2 MTA-ELTE Exoplanet Research Group, 9700 Szombathely, Szent Imre h. u. 112, Hungary
3 Astronomical Institute, Slovak Academy of Sciences, 05960 Tatranská Lomnica, Slovakia
4 Department of Astronomy, Stockholm University, AlbaNova University Center, 10691 Stockholm, Sweden
5 Dipartimento di Fisica, Universita degli Studi di Torino, via Pietro Giuria 1, I-10125, Torino, Italy
6 Centre for Exoplanet Science, SUPA School of Physics and Astronomy, University of St Andrews, North Haugh, St Andrews KY16 9SS, UK
7 Observatoire Astronomique de l’Université de Genève, Chemin Pegasi 51, Versoix, Switzerland
8 Physikalisches Institut, University of Bern, Gesellsschaftstrasse 6, 3012 Bern, Switzerland
9 Center for Space and Habitability, Gesellsschaftstrasse 6, 3012 Bern, Switzerland
10 Cavendish Laboratory, JJ Thomson Avenue, Cambridge CB3 0HE, UK
11 INAF, Osservatorio Astronomico di Padova, Vicolo dell’Osservatorio 5, 35122 Padova, Italy
12 Institut d’astrophysique de Paris, UMR7095 CNRS, Université Pierre & Marie Curie, 98bis blvd. Arago, 75014 Paris, France
13 Aix Marseille Univ, CNRS, CNES, LAM, 38 rue Frédéric Joliot-Curie, 13388 Marseille, France
14 Space sciences, Technologies and Astrophysics Research (STAR) Institute, Université de Liège, Allée du 6 Août 19C, 4000 Liège, Belgium
15 Instituto de Astrofisica de Canarias, 38200 La Laguna, Tenerife, Spain
16 Departamento de Astrofisica, Universidad de La Laguna, 38206 La Laguna, Tenerife, Spain
17 Institut de Ciencies de l’Espai (ICE, CSIC), Campus UAB, Can Magrans s/n, 08193 Bellaterra, Spain
18 Institut d’Estudis Espacials de Catalunya (IEEC), 08034 Barcelona, Spain
19 Admatis, 5. Kandó Kálmán Street, 3534 Miskolc, Hungary
20 Depto. de Astrofisica, Centro de Astrobiologia (CSIC-INTA), ESAC campus, 28692 Villanueva de la Cañada (Madrid), Spain
21 Instituto de Astrofisica e Ciencias do Espaco, Universidade do Porto, CAUP, Rua das Estrelas, 4150-762 Porto, Portugal
22 Departamento de Fisica e Astronomia, Faculdade de Ciencias, Universidade do Porto, Rua do Campo Alegre, 4169-007 Porto, Portugal
23 Space Research Institute, Austrian Academy of Sciences, Schmiedlstrasse 6, A-8042 Graz, Austria
24 Université Grenoble Alpes, CNRS, IPAG, 38000 Grenoble, France
25 Institute of Planetary Research, German Aerospace Center (DLR), Rutherfordstrasse 2, 12489 Berlin, Germany
26 Université de Paris, Institut de physique du globe de Paris, CNRS, F-75005 Paris, France
27 Centre for Mathematical Sciences, Lund University, Box 118, SE 221 00, Lund, Sweden
28 Astrobiology Research Unit, Université de Liège, Allée du 6 Août 19C, B-4000 Liège, Belgium
29 Leiden Observatory, University of Leiden, PO Box 9513, 2300 RA Leiden, The Netherlands
30 Department of Space, Earth and Environment, Chalmers University of Technology, Onsala Space Observatory, 43992 Onsala, Sweden
31 University of Vienna, Department of Astrophysics, Türkenschanzstrasse 17, 1180 Vienna, Austria
32 Department of Physics, University of Warwick, Gibbet Hill Road, Coventry CV4 7AL, United Kingdom
33 Science and Operations Department - Science Division (SCI-SC), Directorate of Science, European Space Agency (ESA), European Space Research and Technology Centre (ESTEC), Keplerlaan 1, 2201-AZ Noordwijk, The Netherlands
34 Konkoly Observatory, Research Centre for Astronomy and Earth Sciences, 1121 Budapest, Konkoly Thege Miklós út 15-17, Hungary
35 IMCCE, UMR8028 CNRS, Observatoire de Paris, PSL Univ., Sorbonne Univ., 77 av. Denfert-Rochereau, 75014 Paris, France
36 Astrophysics Group, Keele University, Staffordshire, ST5 5BG, United Kingdom
37 Department of Astrophysics, University of Vienna, Tuerkenschanzstrasse 17, 1180 Vienna, Austria
38 MTA-ELTE Lendület ”Momentum” Milky Way Research Group, Hungary
39 INAF, Osservatorio Astrofisico di Catania, Via S. Sofia 78, 95123 Catania, Italy
40 Institute of Optical Sensor Systems, German Aerospace Center (DLR), Rutherfordstrasse 2, 12489 Berlin, Germany
41 Dipartimento di Fisica e Astronomia ”Galileo Galilei”, Universita degli Studi di Padova, Vicolo dell’Osservatorio 3, 35122 Padova, Italy
42 ESTEC, European Space Agency, 2201AZ, Noordwijk, NL
43 Center for Astronomy and Astrophysics, Technical University Berlin, Hardenberstrasse 36, 10623 Berlin, Germany
44 Institut für Geologische Wissenschaften, Freie Universität Berlin, 12249 Berlin, Germany
45 Space Science Data Center, ASI, via del Politecnico snc, 00133 Roma, Italy
46 INAF, Osservatorio Astronomico di Roma, via Frascati 33, 00078 Monte Porzio Catone (RM), Italy
47 Institute of Astronomy, University of Cambridge, Madingley Road, Cambridge, CB3 0HA, United Kingdom
48 ELTE Eötvös Loránd University, Institute of Physics, Pázmány Péter sétány 1/A, 1117 Budapest, Hungary
Transit timing variations of AU Microscopii b and c
Here we report large-amplitude transit timing variations (TTVs) for AU Microcopii b and c as detected in combined TESS (2018, 2020) and CHEOPS (2020, 2021) transit observations. AU Mic is a young planetary system with a debris disk and two transiting warm Neptunes. A TTV on the order of several minutes was previously reported for AU Mic b, which was suggested to be an outcome of mutual perturbations between the planets in the system. In 2021, we observed AU Mic b (five transits) and c (three transits) with the CHEOPS space telescope to follow-up the TTV of AU Mic b and possibly detect a TTV for AU Mic c. When analyzing TESS and CHEOPS 2020–2021 measurements together, we find that a prominent TTV emerges with a full span of minutes between the two TTV extrema. Assuming that the period change results from a periodic process —such as mutual perturbations— we demonstrate that the times of transits in the summer of 2022 are expected to be 30–85 minutes later than predicted by the available linear ephemeris.
1 Introduction
AU Microscopii is the epitome of a young planetary system, where planets orbit a late-type star, with possible star–planet interactions. Its age is estimated to be 22 Myr (Mamajek & Bell, 2014), and as a Pictoris Moving Group (Torres et al., 2006) member, it has a dynamical trace-back age of Myr (Miret-Roig et al., 2020), making it one of the youngest known exoplanet systems. AU Mic hosts two transiting warm Neptunes near mean-motion resonances (Plavchan et al., 2020). Recurrent spot occultations along the transit chord are observed thanks to a 7:4 spin–orbit commensurability between the orbital period of AU Mic b and the stellar rotation (Szabó et al., 2021).
Eight transits of AU Mic b have been published so far. TESS (Ricker et al., 2014) observed two and three transits in 2018 and 2020, respectively (Gilbert et al., 2021), and CHEOPS (Benz et al., 2021) observed three transits in 2020 (previously reported in Szabó et al., 2021). All published data on AU Mic c so far come from TESS, covering one transit in 2018 and two in 2020 (Plavchan et al., 2020; Gilbert et al., 2021). The previous observations led to somewhat inconsistent period estimates for AU Mic b (with a scatter significantly larger than expected from the estimated timing uncertainty), which has recently been suggested to reflect TTVs on the order of 80 s (reported by Gilbert et al., 2021) or 3 min (by Martioli et al., 2021).
Here we present new photometric observations of AU Mic b and AU Mic c carried out with the CHEOPS space telescope from July through September, 2021. We describe the observations and data-processing methods in Sect. 2 and present the results in Sect. 3.
2 Observations and data processing
| Visit ID | Start Date | End Date | File Key | CHEOPS | Integ. | Co-added | Num. of |
|---|---|---|---|---|---|---|---|
| (2021) | (2021) | product | time (s) | exposures | frames | ||
| AU Mic b 21-07-26 | 07-26 11:27:13 | 07-26 22:34:04 | PR100010_TG003001 | Subarray | 42 | 3 s 14 | 669 |
| Imagettes | 3 | — | 9366 | ||||
| AU Mic c 21-08-09 | 08-09 04:59:15 | 08-09 19:37:47 | PR100010_TG003401 | Subarray | 42 | 3 s 14 | 1029 |
| Imagettes | 3 | — | 14 406 | ||||
| AU Mic b 21-08-12 | 08-12 08:25:41 | 08-12 19:53:00 | PR100010_TG003601 | Subarray | 42 | 3 s 14 | 839 |
| Imagettes | 3 | — | 11 746 | ||||
| AU Mic c 21-08-28 | 08-28 02:09:13 | 08-28 16:35:03 | PR100010_TG003402 | Subarray | 42 | 3 s 14 | 907 |
| Imagettes | 3 | — | 12 698 | ||||
| AU Mic b 21-08-29 | 08-29 05:17:41 | 08-29 16:44:59 | PR100010_TG003701 | Subarray | 42 | 3 s 14 | 667 |
| Imagettes | 3 | — | 9338 | ||||
| AU Mic b 21-09-06 | 09-06 17:38:41 | 09-07 05:05:59 | PR100010_TG003101 | Subarray | 42 | 3 s 14 | 643 |
| Imagettes | 3 | — | 9002 |
During the 2021 opposition, we observed five transits of AU Mic b and three transits of AU Mic c. Four of the five AU Mic b transits and two of the AU Mic c transits are appropriate for transit timing analysis. For the fifth AU Mic b transit (21-09-25), both the ingress and egress are missing because of gaps in the data. These transits will be analyzed in a forthcoming publication. Similarly to the third 2020 observation with CHEOPS, we used short exposure times of 3 s to better resolve possible flares. The brightness of the star (V = 8.6 mag and GAIA G = 7.843 mag; Kiraga, 2012; Gaia Collaboration et al., 2018) ensured an adequate signal despite the short exposures. See Table 1 for the observations log. In the CHEOPS Proposal Handling Tool, we set up observation windows with an observation length covering seven (AU Mic b) and nine CHEOPS orbits (AU Mic c), with one CHEOPS orbit lasting 98.77 min. We centered each visit at the predicted mid-transit time and observed for the entire transit duration, adding at least 1.5 CHEOPS orbits on each side in order to have a reasonably long out-of-transit baseline. The efficiency of the observations varied between 55 % and 90 %.
The sub-array frames were automatically processed with the CHEOPS Data Reduction Pipeline (DRP; Hoyer et al., 2020). In addition to the sub-arrays, there are imagettes available for each exposure. The imagettes are images of 30 pixels in radius centered on the target and do not need to be co-added before download owing to their smaller size. We used a tool specifically developed for photometric extraction of imagettes using point-spread function (PSF) photometry, PIPE (PSF imagette photometric extraction; for more details of how it was applied to AU Mic data, we refer to Szabó et al. 2021). The PIPE photometry has a signal-to-noise ratio (S/N) comparable to that of DRP photometry, but has a lower cadence, allowing better identification of flares (Szabó et al., 2021).
In this Letter, we analyze the PIPE reduction averaged to 15 s cadence for better S/N of individual points. The data reduced with both DRP and PIPE will be available on VizieR after the publication of this Letter.
2.1 Pre-processing of the light curves
Due to the rotation of the host star, the stellar brightness slowly varied during the observations. This was removed by fitting a fourth-order polynomial to the out-of-transit light curve segments before starting the analysis.
Because flares can severely bias the transit model, we masked them out during the transits before the modeling. The longest flare with at least three major, complex humps occurred around the ingress phase of the CHEOPS 21-07-26 visit, and only the egress of this transit could be kept for further analysis. A shorter lasting flare was observed during the transits of the CHEOPS 21-08-29 and CHEOPS 21-09-23 visits, which nevertheless did not affect the ingress and egress phases.
We show the raw CHEOPS light curves after a subtraction of the polynomial slow-trend model and the image synthesis model of background contamination in Fig. 6. We note that the segments of light curves contaminated by flares (in smaller dots in the figure) were omitted from the fit.
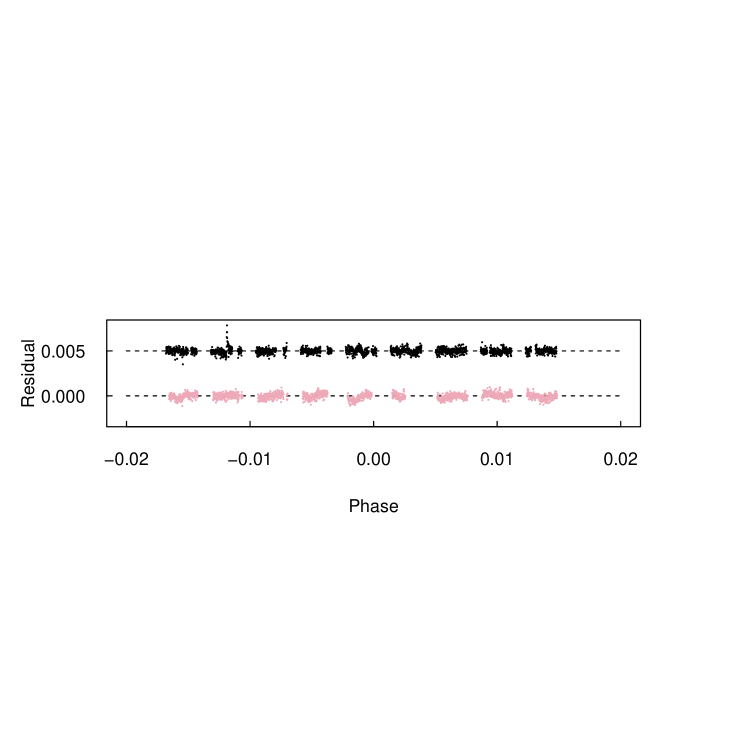
A visual inspection of the light curve led us to conclude that the level of red noise is not negligible. A quantitative analysis showed that the residuals after fitting the transits on the 2021 light curves are on average 280 ppm, higher than the 125 ppm residuals we found in the 2020 data (see also Fig. 1 and its discussion). The increasing red noise can be attributed to an increased stellar activity in 2021 compared to 2020. The increasing activity between 2018 and 2020 was also observed by TESS (Gilbert et al., 2021; Martioli et al., 2021). The adverse effects of increased activity are stronger for AU Mic c transits because of their shallowness, making the transit parameters more sensitive to red noise. The changing spot coverage of the star leads to a bias in the planet size () parameter as well (see Tables 2 and 3 and the discussions that follow them).
Because of the spin–orbit commensurability (Szabó et al., 2021) of AU Mic b, the transits 21-07-26 and 21-08-29 are observed in front of the same stellar longitude. This longitude also coincides with the CHEOPS 20-08-21 and CHEOPS 20-09-24 observations shown in Szabó et al. (2021), but the change in the spot map does not allow a direct comparison between the years.
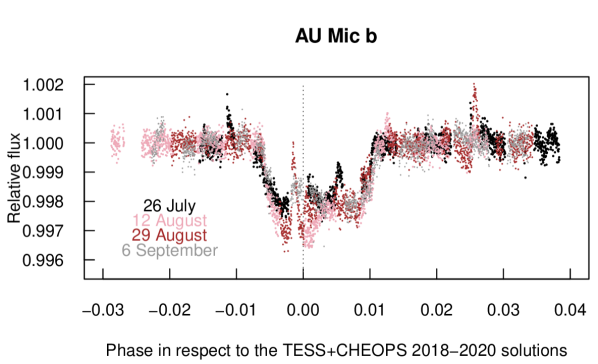
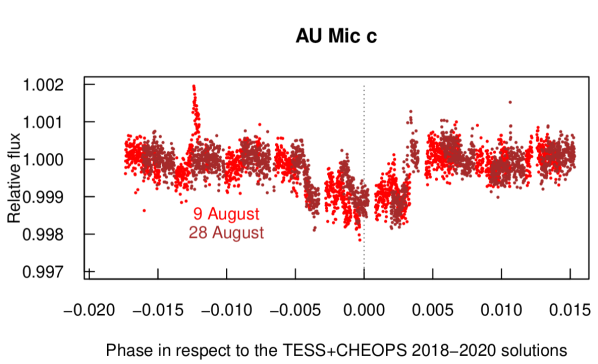
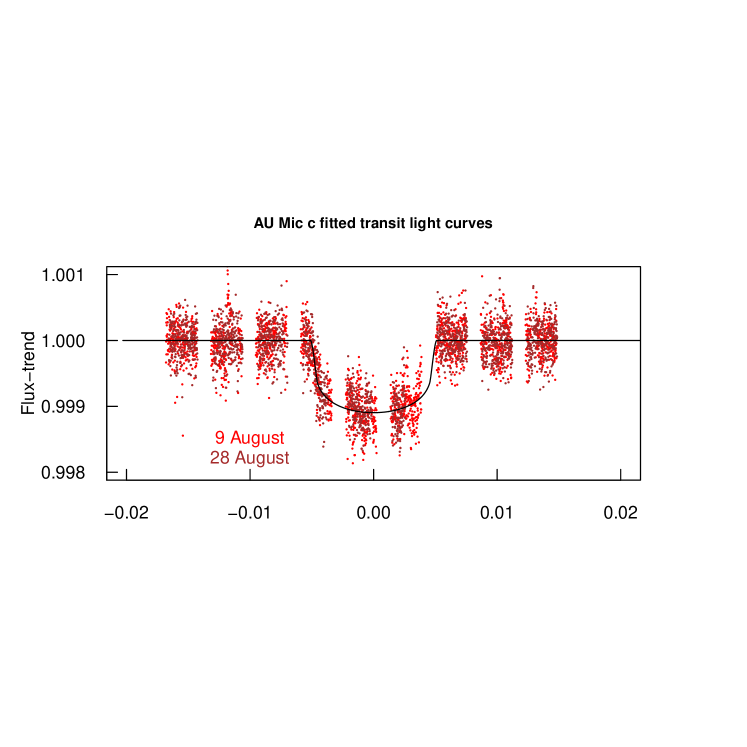
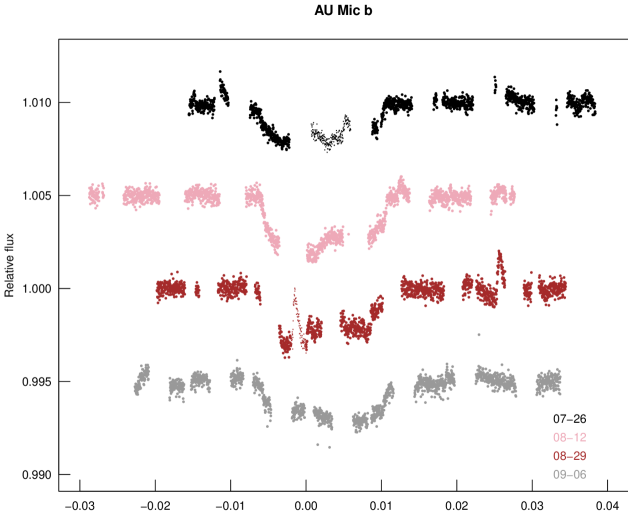
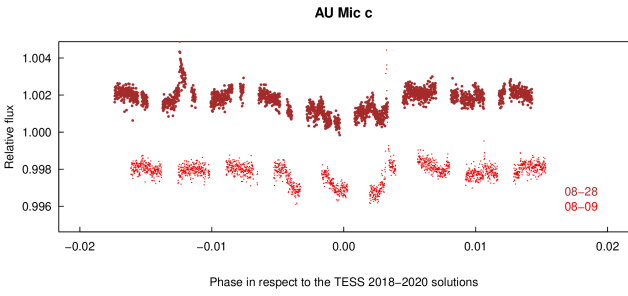
The phased transit light curves of both AU Mic b and AU Mic c are shown in Fig. 1. In both panels of this figure, the period and epoch of the transit times have been adopted from publications based on 2018–2020 data (AU Mic b and c: Martioli et al., 2021; Gilbert et al., 2021, respectively) to reflect the dramatic shift of the transits in reference to these linear ephemeris. The mid-transit of AU Mic b is shifted toward the positive phase coordinates, and a slight shift toward negative values is suspected in the case of AU Mic c. This is an impressive representation of how much the behavior of both planets changed within less than a year.
Both panels of Fig. 1 show the CHEOPS datasets without masking out the flares. In the case of AU Mic b, we see prominent anomalies mostly during the ingress phase and the start of the transit floor (around 0.00 phase coordinate according to the phase definition in Fig. 1). The ingress phase of the 21-07-26 transit is shallower than the other ones, which is further evidence of a positive anomaly at around phase 0.008 which is due to a small flare. The 21-08-12 transit is significantly steeper than the other ones, which is likely the result of a different spot distribution (e.g., the beginning of the transit chord not covered by spots).
The 21-08-12 and 21-08-29 transits are exactly 3.5 stellar rotations apart and are therefore observed at opposite stellar longitudes. Interestingly, both of these transits have a “brightening” near the center of the transit, as if both of these transits happened in front of a spot. However, the presence of two large spots on opposite sides of the star is compatible with the rotation light curve of the star showing two minima during one rotation (Plavchan et al., 2020; Martioli et al., 2021; Szabó et al., 2021; Gilbert et al., 2021).
The phased transit curve of AU Mic c shows an unlucky coverage: the egress phase is within the data gaps in the case of both observations. There are also many residuals during the transits that are likely due to the presence of spot occultations. There is little resemblance between the residuals of the two planets. However, the impact parameter is known to be different for the planets (Martioli et al., 2021; Gilbert et al., 2021), which means that the two transit chords map to different parts of the star. The observed residuals are consistent with this interpretation.
2.2 The transit model
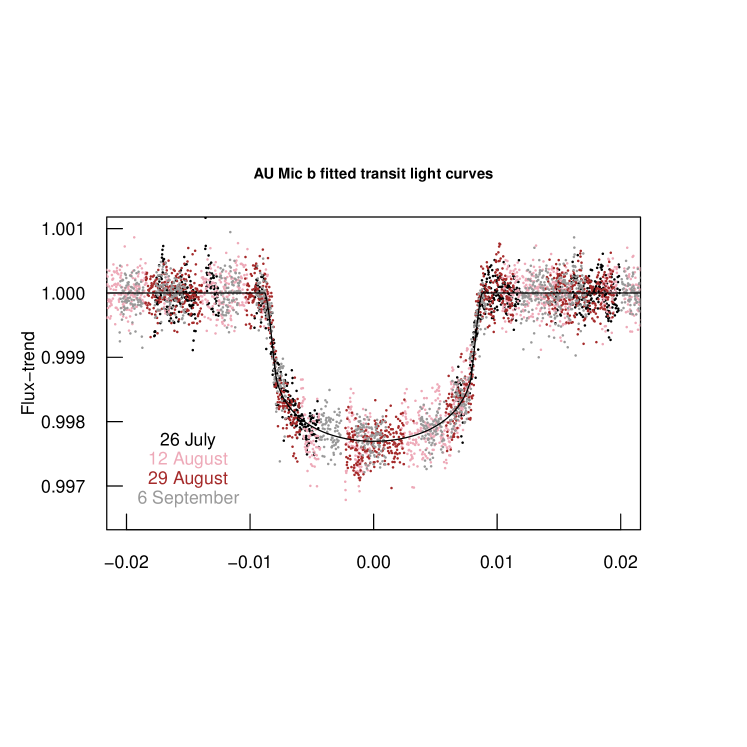
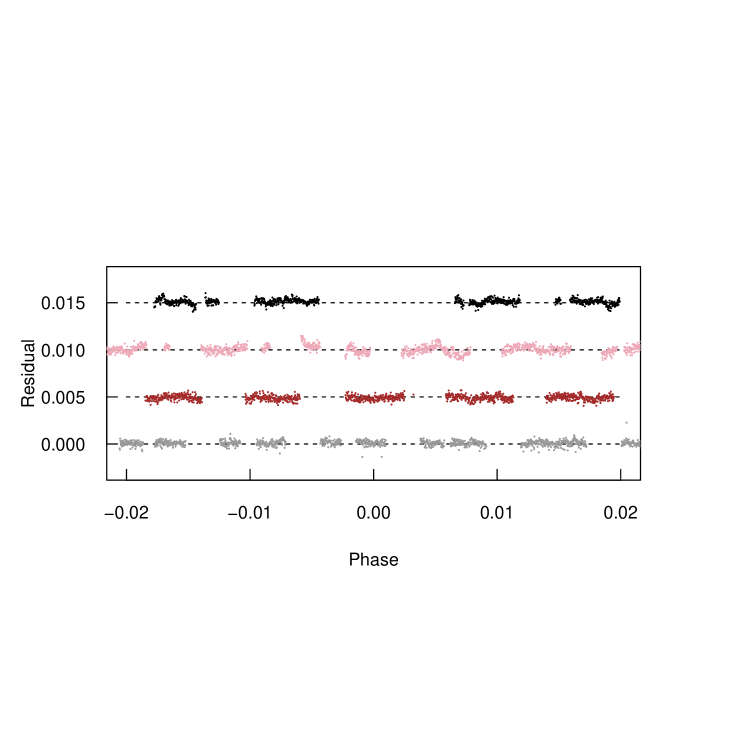
After masking out the flares (as shown in Fig. 6), we determined the transit parameters using the pycheops software module (Maxted et al., 2021). pycheops uses the qpower2 transit model and the power-2 limb-darkening law (Maxted & Gill, 2019); it calculates transit models of a spot-free star and a planet with a circular silhouette. The model parameters are the transit time (), the transit depth parameter , the transit duration parameter , and the impact parameter . The other system parameters can be derived from the above set; for example the transit duration expressed in hours as , where is the instantaneous orbital period.
It is possible to fit more complex models to the observed transits that account for the presence of spots. In order to constrain the spot modeling, we performed ground-based observations simultaneously with the CHEOPS observations. We intend to publish this more complex modeling in a forthcoming paper, as the scope of this Letter is to primarily report the unexpectedly large TTVs, for which the standard modeling methods are sufficient.
The priors we used are listed in Table 4 for both AU Mic b and AU Mic c. The stellar fundamental parameters were taken from SWEET-Cat (Sousa et al., 2018), which are the same parameters as in Plavchan et al. (2020). The noise model was calculated with celerite using the white-noise term JitterTerm plus, optionally, a GP with kernel SHOTerm. The priors were identical to what we set up in Szabó et al. (2021).
The long-period trends of TTVs lead to the apparent change of the instantaneous orbital period. We fitted the instantaneous period as the parameter to remove the linear trend of TTV in 2021. The actual mean orbital period, , is the one that minimizes the scatter of the TTV. was determined by an analysis of mid-transit times (see Sect. 3, and also Tables 5 and 6).
3 Results

The best-fit transit parameters to 2021 CHEOPS observations are summarizsed in Tables 2 and 3, both for AU Mic b and AU Mic c. We compare our results to previous estimates in Plavchan et al. (2020), Szabó et al. (2021), Martioli et al. (2021), and Gilbert et al. (2021). In Szabó et al. (2021), we derived three sets of solutions using different solving algorithms (pycheops Maxted et al. 2021 and TLCM Csizmadia 2020), with resulting solutions that did not differ significantly from each other. As the present Letter uses the pycheops algorithm, we selected the pycheops solution in Szabó et al. (2021) for comparison with the 2021 observations.
All parameters with the exception of (and hence ) are compatible with all previous solutions in the literature. The most significant improvement of the present analysis is the increased precision of the transit duration, , thanks to the combined precision of the four CHEOPS light curves, which have very good internal photometric accuracy.
The most relevant difference is observed in the (and consequently, the ) planet radius parameters. In 2021, we observed smaller values than in 2018 and 2020, with a difference between the current and previous estimates of 3.4. This is probably because the spot coverage of the stellar surface evolved between 2018 and 2021. It is known that spots along the transit chord decrease the transit depth, while unocculted spots increase it, and the naively determined size parameter becomes inconsistent (Oshagh et al., 2013). Assuming that most spots are out of the transit chord, and therefore that spots increase the transit depth, Martioli et al. (2021) derived that in 2020, the actual diameter was overestimated by about 6% based on TESS data. Our result shows that the activity level increases between 2020 and 2021 while the transit depth decreases significantly, rather than being biased to larger values. The most simple explanation would be that spots of the host star are mostly on the transit chord of AU Mic b. We will discuss this possibility in detail in a forthcoming paper.
| This Letter | P2020 | M2021 | Sz2021 | G2021 | |
|---|---|---|---|---|---|
| 0.0433 0.0017 | 0.05140.0013 | 0.0526 | 0.0531 0.0023 | 0.0512 0.0020 | |
| 18.95 0.35 | 19.1 | 19.1 | 19.24 0.37 | 19.07 | |
| [h] | 3.51 0.03 | 3.50 | 3.50 0.08 | 3.48 0.19 | 3.56 |
| [R⊕] | 3.55 0.13 | 4.290.20 | 4.07 0.17 | 4.36 0.18 | 4.27 0.17 |
| [AU] | 0.0654 0.0012 | 0.066 | 0.0645 0.0013 | 0.0678 0.0013 | 0.0644 |
| 0.17 0.11 | 0.16 | 0.18 0.11 | 0.09 0.05 | 0.26 |
| This Letter | M2021 | G2021 | |
|---|---|---|---|
| 0.03130.0016 | 0.03950.0011 | 0.0340 | |
| 28.8 2.4 | 29 3.0 | 31.7 | |
| [h] | 4.29 0.30 | 4.50 0.80 | 4.20 |
| [R⊕] | 2.56 0.12 | 3.24 0.16 | 2.79 |
| [AU] | 0.0993 0.0085 | 0.1101 0.0022 | 0.110 |
| 0.58 0.13 | 0.51 0.21 | 0.30 |
3.1 Large-amplitude TTVs
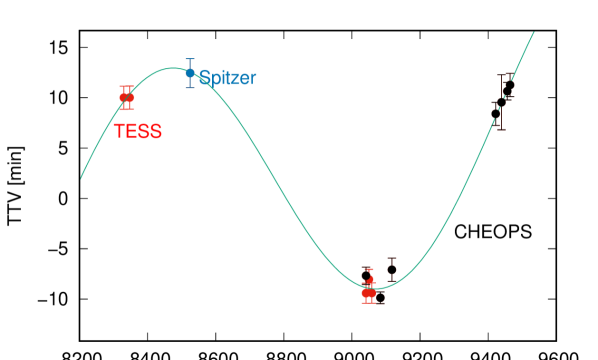
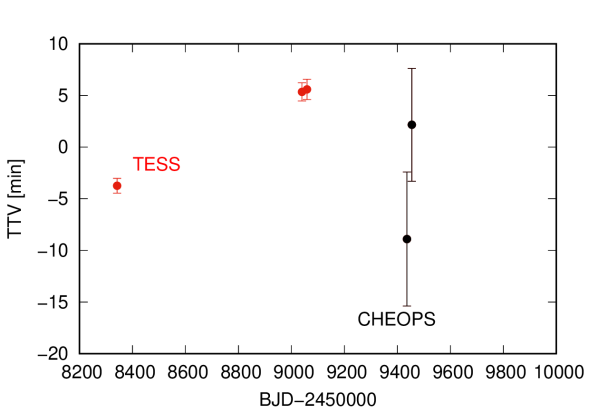
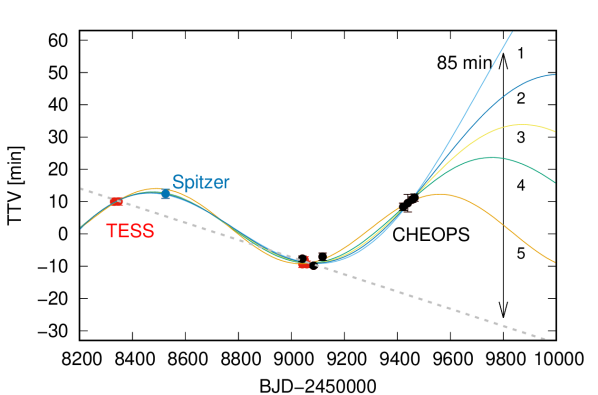
Both planets show a very prominent TTV. We complemented the CHEOPS (2020 and 2021) observations with mid-transit times of TESS data (2018 and 2020), and also the mid-transit time of the single Spitzer measurement fitted by Plavchan et al. (2020) (see the mid-transit times in Tables 5 and 6). Following Lithwick et al. (2012), the simplest form of a TTV can be described as a sinusoidal function with amplitude and superperiod , which are complicated functions of the exoplanet system parameters. Therefore,
| (1) |
where are individual transit times, and , , and are free parameters determined by the selection of the time coordinate and the trial orbital period. We derive the mean orbital period and , while demanding the elimination of the constant and the linear terms in : . (If there is no suspicion of a periodic TTV, linear epheremides (period and transit time) are given as A=0 solutions of Eq. 1.) The currently available times of minima lead to d and d in case of AU Mic b and d and d in case of AU Mic c. With this selection, the peak-to-peak amplitude of the TTV of AU Mic b and c are 23 and 9.5 min, respectively (Fig. 3).
The derived depends on which parts of the are constrained by data. It is likely that , but, in general, equality cannot be guaranteed, in particular when the is sparsely sampled and with significant TTVs, as in the present case. The result is that the fitted coefficients and become uncertain. Despite the fact that and were determined such that and vanish, they have error terms that correlate to the other parameters. The simplest form of an model describing a periodic process has all five free variables in the form of Eq. 1: , and that are fitted, and and as parametrric constants determined from the data, which are therefore in correlation with the other three parameters.
The currently measured transits are concentrated in four relatively narrow windows (from a single transit to three-month observations) in the case of AU Mic b, and three similar windows in the case of AU Mic c. This leads to degeneracies in the best-fitting models of AU Mic b. Because of these degeneracies, we did not attempt to fit any curve to the current AU Mic c data. The future transit times extrapolated from the modeled curves of AU Mic b are wildly diverging. The (determined as described above) and the possible predictions for the future (being equivalently well-fitting solutions of Eq. 1) are plotted in Fig. 4 with curves, and the gray dashed line shows the predictions from the linear ephemeris based on previously published data. Transits predicted for 2022 are expected to occur 40–85 min later than expected without the 2021 observations of CHEOPS. We note that if the dominant process in the long-term behavior of AU Mic b is a period change with a constant rate, and the appropriate fit is a parabola instead of a harmonic function, the difference in transit time can be even more than 90 min. However, we think that this scenario is unlikely, because the position of the single measurement with the Spitzer telescope and the seemingly anticorrelated variations of the two planets in the system strongly suggest a periodic TTV in its leading term.
This TTV may reflect orbital changes. Ioannidis et al. (2016) suggested that starspots can also cause apparent TTVs of up to % of the transit duration. This would be on the order of 2 min in the case of AU Mic b. The observed effect is an order of magnitude larger than this prediction, and moreover with a pattern that is incompatible with the random behavior expected from stochastic spot occultations. Together, these findings strongly suggest an orbital dynamics origin of the TTVs.
The large TTVs of the AU Mic system are unusual, as can be seen when comparing to Kepler planets with confirmed TTVs (Fig. 5). Among the Kepler planets, only two that exhibit TTVs have shorter orbital periods than AU Mic b (Kepler-25 b and Kepler-1530 c, see Gajdoš et al., 2019). AU Mic b has a TTV semi-amplitude of min, which is large in comparison to other planets with known TTVs. AU Mic c is still at the short-period end of the planets with known TTVs, while the semi-amplitude of the TTV is known with lower precision.
Martioli et al. (2021) estimate that the AU Mic b–c interactions lead to a superperiod of 82 days and significantly smaller amplitude than reported here. While we are certain that the TTV has its origin in the orbital physics, there are still too few data points to conclusively determine a superperiod or the possibility of a linear period drift in addition to the periodic TTV. These effects could point to either a currently ongoing migration or additional perturbing outer planets. To address these questions, a longer time-span of observed transit timings is required.
4 Summary
In this paper, we report our analysis of new CHEOPS observations of both planets in the AU Mic system and draw the following main conclusions:
-
1.
AU Mic b shows very significant TTVs, with a minimum-to-maximum amplitude min. AU Mic c shows TTVs with a minimum-to-maximum amplitude of min. The best fitting mean orbital periods of AU Mic b and c are d and d, respectively. Taking the TTV into account, we predict that the transit times of AU Mic b in 2022 will happen 40–90 min later than expected from previously published linear ephemeris.
-
2.
The transit depths of both planets are observed by CHEOPS to be smaller in 2021 than in 2020. The most likely reason is the increased activity of AU Mic with significant changes in the spot structure on the stellar surface.
-
3.
Due to the large influence of spots on the size parameter , its value should only be considered as a proxy for the actual sizes of the planets. A de-biased size determination requires detailed spot modeling with contemporary complementary observations, which we will address in a forthcoming paper.
The large-amplitude TTVs imply that the observations during the 2022 visibility have to be planned circumspectly. The ambiguity in transit-time predictions can be inaccurate up to 40–85 min which is about half of the transit duration. This can be especially critical for scheduling follow-up observations of either planet, for example with the Hubble Space Telescope or the James Webb Space Telescope.
Acknowledgements
CHEOPS is an ESA mission in partnership with Switzerland with important contributions to the payload and the ground segment from Austria, Belgium, France, Germany, Hungary, Italy, Portugal, Spain, Sweden, and the United Kingdom. The CHEOPS Consortium would like to gratefully acknowledge the support received by all the agencies, offices, universities, and industries involved. Their flexibility and willingness to explore new approaches were essential to the success of this mission. GyMSz and ZG acknowledge the support of the Hungarian National Research, Development and Innovation Office (NKFIH) grant K-125015, a a PRODEX Experiment Agreement No. 4000137122 between the ELTE Eötvös Loránd University and the European Space Agency (ESA-D/SCI-LE-2021-0025), the Lendület LP2018-7/2021 grant of the Hungarian Academy of Science and the support of the city of Szombathely. ZG was supported by the VEGA grant of the Slovak Academy of Sciences No. 2/0031/22 and by the Slovak Research and Development Agency - the contract No. APVV-20-0148. ABr was supported by the SNSA. DG gratefully acknowledges financial support from the CRT foundation under Grant No. 2018.2323 “Gaseous or rocky? Unveiling the nature of small worlds”. ACC and TW acknowledge support from STFC consolidated grant number ST/M001296/1. A.De. acknowledges support from the European Research Council (ERC) under the European Union’s Horizon 2020 research and innovation programme (project Four Aces, grant agreement No. 724427), and from the National Centre for Competence in Research “PlanetS” supported by the Swiss National Science Foundation (SNSF). This work was also partially supported by a grant from the Simons Foundation (PI Queloz, grant number 327127). ML acknowledges support of the Swiss National Science Foundation under grant number PCEFP2_194576. GSc, GPi, IPa, LBo, RRa, and VNa and RRa acknowledge the funding support from Italian Space Agency (ASI) regulated by“Accordo ASI-INAF n. 2013-016-R.0 del 9 luglio 2013 e integrazione del 9 luglio 2015 CHEOPS Fasi A/B/C”. LMS gratefully acknowledges financial support from the CRT foundation under Grant No. 2018.2323 “Gaseous or rocky? Unveiling the nature of small worlds”. V.V.G. is an F.R.S-FNRS Research Associate. YA and MJH acknowledge the support of the Swiss National Fund under grant 200020_172746. We acknowledge support from the Spanish Ministry of Science and Innovation and the European Regional Development Fund through grants ESP2016-80435-C2-1-R, ESP2016-80435-C2-2-R, PGC2018-098153-B-C33, PGC2018-098153-B-C31, ESP2017-87676-C5-1-R, MDM-2017-0737 Unidad de Excelencia Maria de Maeztu-Centro de Astrobiología (INTA-CSIC), as well as the support of the Generalitat de Catalunya/CERCA programme. The MOC activities have been supported by the ESA contract No. 4000124370. S.C.C.B. acknowledges support from FCT through FCT contracts nr. IF/01312/2014/CP1215/CT0004. XB, SC, DG, MF and JL acknowledge their role as ESA-appointed CHEOPS science team members. This project was supported by the CNES. The Belgian participation to CHEOPS has been supported by the Belgian Federal Science Policy Office (BELSPO) in the framework of the PRODEX Program, and by the University of Liège through an ARC grant for Concerted Research Actions financed by the Wallonia-Brussels Federation. This work was supported by FCT - Fundação para a Ciência e a Tecnologia through national funds and by FEDER through COMPETE2020 - Programa Operacional Competitividade e Internacionalizacão by these grants: UID/FIS/04434/2019, UIDB/04434/2020, UIDP/04434/2020, PTDC/FIS-AST/32113/2017 & POCI-01-0145-FEDER- 032113, PTDC/FIS-AST/28953/2017 & POCI-01-0145-FEDER-028953, PTDC/FIS-AST/28987/2017 & POCI-01-0145-FEDER-028987, O.D.S.D. is supported in the form of work contract (DL 57/2016/CP1364/CT0004) funded by national funds through FCT. B.-O.D. acknowledges support from the Swiss National Science Foundation (PP00P2-190080). This project has received funding from the European Research Council (ERC) under the European Union’s Horizon 2020 research and innovation programme (project Four Aces grant agreement No 724427). It has also been carried out in the frame of the National Centre for Competence in Research PlanetS supported by the Swiss National Science Foundation (SNSF). DE acknowledges financial support from the Swiss National Science Foundation for project 200021_200726. LD is an F.R.S.-FNRS Postdoctoral Researcher. MF and CMP gratefully acknowledge the support of the Swedish National Space Agency (DNR 65/19, 174/18). M.G. is an F.R.S.-FNRS Senior Research Associate. SH gratefully acknowledges CNES funding through the grant 837319. KGI is the ESA CHEOPS Project Scientist and is responsible for the ESA CHEOPS Guest Observers Programme. She does not participate in, or contribute to, the definition of the Guaranteed Time Programme of the CHEOPS mission through which observations described in this paper have been taken, nor to any aspect of target selection for the programme. This work was granted access to the HPC resources of MesoPSL financed by the Region Ile de France and the project Equip@Meso (reference ANR-10-EQPX-29-01) of the programme Investissements d’Avenir supervised by the Agence Nationale pour la Recherche. PM acknowledges support from STFC research grant number ST/M001040/1. Acknowledges support from the Spanish Ministry of Science and Innovation and the European Regional Development Fund through grant PGC2018-098153-B- C33, as well as the support of the Generalitat de Catalunya/CERCA programme. S.G.S. acknowledge support from FCT through FCT contract nr. CEECIND/00826/2018 and POPH/FSE (EC).
References
- Benz et al. (2021) Benz, W., Broeg, C., Fortier, A., et al. 2021, Experimental Astronomy, 51, 109
- Csizmadia (2020) Csizmadia, S. 2020, MNRAS, 496, 4442
- Gaia Collaboration et al. (2018) Gaia Collaboration, Brown, A. G. A., Vallenari, A., et al. 2018, A&A, 616, A1
- Gajdoš et al. (2019) Gajdoš, P., Vaňko, M., & Parimucha, Š. 2019, Research in Astronomy and Astrophysics, 19, 041
- Gilbert et al. (2021) Gilbert, E. A., Barclay, T., Quintana, E. V., et al. 2021, arXiv e-prints, arXiv:2109.03924
- Hoyer et al. (2020) Hoyer, S., Guterman, P., Demangeon, O., et al. 2020, A&A, 635, A24
- Ioannidis et al. (2016) Ioannidis, P., Huber, K. F., & Schmitt, J. H. M. M. 2016, A&A, 585, A72
- Kiraga (2012) Kiraga, M. 2012, Acta Astron., 62, 67
- Lithwick et al. (2012) Lithwick, Y., Xie, J., & Wu, Y. 2012, ApJ, 761, 122
- Mamajek & Bell (2014) Mamajek, E. E. & Bell, C. P. M. 2014, MNRAS, 445, 2169
- Martioli et al. (2021) Martioli, E., Hébrard, G., Correia, A. C. M., Laskar, J., & Lecavelier des Etangs, A. 2021, A&A, 649, A177
- Maxted et al. (2021) Maxted, P. F. L., Ehrenreich, D., Wilson, T. G., et al. 2021, MNRAS[arXiv:2111.08828]
- Maxted & Gill (2019) Maxted, P. F. L. & Gill, S. 2019, A&A, 622, A33
- Miret-Roig et al. (2020) Miret-Roig, N., Galli, P. A. B., Brandner, W., et al. 2020, A&A, 642, A179
- Oshagh et al. (2013) Oshagh, M., Santos, N. C., Boisse, I., et al. 2013, A&A, 556, A19
- Plavchan et al. (2020) Plavchan, P., Barclay, T., Gagné, J., et al. 2020, Nature, 582, 497
- Ricker et al. (2014) Ricker, G. R., Winn, J. N., Vanderspek, R., et al. 2014, in Society of Photo-Optical Instrumentation Engineers (SPIE) Conference Series, Vol. 9143, Space Telescopes and Instrumentation 2014: Optical, Infrared, and Millimeter Wave, ed. J. Oschmann, Jacobus M., M. Clampin, G. G. Fazio, & H. A. MacEwen, 914320
- Sousa et al. (2018) Sousa, S. G., Adibekyan, V., Delgado-Mena, E., et al. 2018, A&A, 620, A58
- Szabó et al. (2021) Szabó, G. M., Gandolfi, D., Brandeker, A., et al. 2021, A&A, 654, A159
- Torres et al. (2006) Torres, C. A. O., Quast, G. R., da Silva, L., et al. 2006, A&A, 460, 695
Appendix A Data tables
In this Appendix, we present tables with detailed parameters used in the transit fitting, as cited in the main text.
| AU Mic b | AU Mic c | |
| PRIORS | ||
| POSTERIORS | ||
| Designation | Transit Time | Err | |
|---|---|---|---|
| [BJD2 450 000] | [min] | [min] | |
| TESS S1#1a | 8330.39110.0009 | 10.00 | 1.33 |
| TESS S1#2a | 8347.31740.0009 | 10.02 | 1.33 |
| Spitzer#1b | 8525.045090.0010 | 12.45 | 1.43 |
| TESS S27#1a | 9041.28160.0008 | -9.42 | 1.17 |
| TESS S27#2a | 9049.74570.0008 | -8.05 | 1.17 |
| TESS S27#3a | 9058.20800.0008 | -9.40 | 1.17 |
| CHEOPS 20-07-10a | 9041.28280.0006 | -7.70 | 0.87 |
| CHEOPS 20-08-21a | 9083.59700.0004 | -9.88 | 0.58 |
| CHEOPS 20-09-24a | 9117.45150.0008 | -7.08 | 1.17 |
| CHEOPS 21-07-26c | 9422.13420.0010 | 8.40 | 1.43 |
| CHEOPS 21-08-12c | 9439.06360.0021 | 9.55 | 3.15 |
| CHEOPS 21-08-29c | 9455.98950.0007 | 10.65 | 1.0 |
| CHEOPS 21-09-06c | 9464.45310.0009 | 11.25 | 1.27 |
| Designation | Transit Time | O-C | Err |
|---|---|---|---|
| [BJD2 450 000] | [min] | [min] | |
| TESS S1#1a | 8342.224320.0004 | -3.75 | 0.71 |
| TESS S27#1a | 9040.006970.0005 | 5.34 | 0.88 |
| TESS S27#2a | 9058.865960.0006 | 5.58 | 0.98 |
| CHEOPS 21-08-09b | 9436.03230.0045 | -8.90 | 6.48 |
| CHEOPS 21-08-28b | 9454.89880.0038 | 2.16 | 5.47 |
A.1 Coefficients of the model curves in Fig. 4
In this subsection, we give the coefficients of the model curves in Fig. 4. The purpose of this table is to enable the reproduction of the figure. The coefficients refer to time measured in BJD-2 450 000 days. We emphasize that we do not attribute any physical interpretation to these fits. Moreover, the various fits are equally consistent with the current data.
The equation of the model curves is equivalent to Eq. 1, but has a different parametrization to reduce parameter correlations and give more stable fits. The fitted curves use the following parametric function:
| (2) |
where the coefficients are listed in Table 7.
| Curve | Coefficients | ||||
|---|---|---|---|---|---|
| designation | |||||
| 1 | 13.57 | 0.0049061 | 9410.9 | 0.00833 | 2.657 |
| 2 | 29.18 | 0.0033930 | 9709.9 | 0.04665 | 34.921 |
| 3 | 11.18 | 0.0058742 | 9296.77 | 0.00016 | 8.469 |
| 4 | 15.85 | 0.0044917 | 9475.23 | 0.01502 | 2.442 |
| 5 | 19.18 | 0.0040833 | 9548.96 | 0.02380 | 10.170 |