ALMA as a Redshift Machine:
Using [CII] to Efficiently Confirm Galaxies in the Epoch of Reionization
Abstract
The [CII]158μm line has long been proposed as a promising line to spectroscopically confirm galaxies in the epoch of reionization. In this paper we present the results of new ALMA observations spectral scanning for [CII] in six particularly luminous Lyman Break Galaxies at . The six sources were drawn from a sample of bright galaxies identified using the wide-area optical, near-IR, and Spitzer/IRAC data over the COSMOS/UltraVISTA field and were targeted on the basis of tight constraints on their redshifts from their IRAC [3.6]-[4.5] colors. We detect significant () [CII] lines in three of our six targets () co-spatial with the rest- emission from the ground/space-based near-IR imaging. The luminosities of the [CII] lines lie in the range to , consistent with the local [CII]-SFR relation. Meanwhile, their [CII]/ ratios are slightly elevated compared to local (U)LIRGS. This could be due to lower dust-to-gas or dust-to-metal ratios. We also find that our sources display a large kinematic diversity, with one source showing signs of rotation, one source a likely major merger and one dispersion dominated source that might contain a bright star-forming clump. Our results highlight the effectiveness of spectral scans with ALMA in spectroscopically confirming luminous galaxies in the epoch of reionization, something that is being be applied on a significantly larger sample in the on-going REBELS large program.
1 Introduction
Exploring the build-up of galaxies in the universe just a few hundred million years after the Big Bang is a key frontier in extragalactic astronomy. Though 100s of UV-bright galaxy candidates at redshifts (e.g., McLure et al., 2013; Bouwens et al., 2015; Finkelstein et al., 2015; Ishigaki et al., 2018; Bouwens et al., 2021a; Harikane et al., 2021) are known, characterization of their physical properties has been difficult. Deriving these properties from optical and near-IR photometry is complicated by uncertainties in the redshifts (e.g., Bouwens et al., 2021b; Robertson, 2021), dust extinction (e.g., Fudamoto et al., 2020; Schouws et al., 2021; Bowler et al., 2021), and rest-frame optical nebular emission line properties (e.g., Smit et al., 2015; Endsley et al., 2021; Stefanon et al., 2021) of galaxies.
Fortunately, with ALMA, it is possible to make great progress on the characterization of galaxies at (e.g., Hodge & da Cunha, 2020; Robertson, 2021). The [CII]158m line is especially interesting as it is the strongest cooling line of warm gas ( K) in galaxies. This line has already been detected in a significant number of galaxies out to -8 (e.g., Walter et al., 2009; Wagg et al., 2010; Riechers et al., 2014; Willott et al., 2015; Capak et al., 2015; Maiolino et al., 2015; Pentericci et al., 2016; Knudsen et al., 2016; Bradač et al., 2017; Smit et al., 2018; Matthee et al., 2017, 2019; Harikane et al., 2020; Carniani et al., 2020; Le Fèvre et al., 2020; Béthermin et al., 2020; Venemans et al., 2020; Fudamoto et al., 2021). In addition to the immediate utility of [CII] to spectroscopically confirm galaxies in the reionization era and obtain a precise measurement of their redshift, the strength of this line makes it one of the prime features for studying the kinematics of high-z galaxies (e.g., Smit et al., 2018; Hashimoto et al., 2019; Jones et al., 2021). Dynamical masses are particularly interesting in that they give some handle on the masses of galaxies, which can be challenging to do from the photometry alone (e.g., Schaerer & de Barros, 2009).
Despite the great utility of [CII] and the huge interest from the community, only a modest number of galaxies had been found to show [CII] emission in the first six years of ALMA operations (e.g., Maiolino et al., 2015; Pentericci et al., 2016; Bradač et al., 2017; Matthee et al., 2017; Smit et al., 2018; Carniani et al., 2018; Hashimoto et al., 2019). Additionally, even in cases where the [CII] line was detected, only modest luminosities were found, i.e., 2108 . One potentially important factor in the limited success of earlier probes for [CII] at may have been the almost exclusive targeting of sources with redshifts from the Ly emission line. At lower redshifts at least, Ly emission seems to be much more prevalent in lower mass galaxies than it is in higher mass galaxies (e.g., Stark et al., 2010). Additionally, Ly emitters have been found to be systematically low in their [CII] luminosity-to-SFR ratios (Harikane et al., 2018; Matthee et al., 2019). Both factors would have caused early ALMA observations to miss those galaxies with the brightest [CII] lines.
In a cycle 4 pilot, Smit et al. (2018) demonstrated the effectiveness of spectral scans for the [CII] line in galaxies which are particularly luminous and which also have well constrained photometric redshifts. One aspect of the galaxies from Smit et al. (2018) that allowed for particularly tight constraints on their redshifts were the high EWs of their strong [OIII]+H emission lines in the Spitzer/IRAC bands. This is due to the particular sensitivity of the Spitzer/IRAC [3.6][4.5] colors to redshift of galaxies for high-EW [OIII]+H emitters (Smit et al., 2015). Remarkably, despite just 1 hour of observations becoming available on these targets, the results were nevertheless striking, with 6-8 [CII] lines found in two targeted sources, with redshifts and . Additionally, the [CII] luminosities of the two sources were relatively high, being brighter in [CII] than all ALMA non-QSO targets by factors of 2-20.
Encouraged by the high efficiency of the Smit et al. (2018) spectral scan results, we successfully proposed for similar observations for 6 other luminous galaxies (2018.1.00085.S: PI Schouws) to add to the results available from the Smit et al. (2018) program and further refine the spectral scan strategy. The purpose of this paper is to present results from this second pilot. Results from this pilot program and an earlier program from Smit et al. (2018) served as the motivation for the Reionization Era Bright Emission Line Survey (REBELS) ALMA large program (Bouwens et al., 2021b) in cycle 7. The REBELS program significantly expanded the strategy employed in these pilot programs to a much larger set of targets, while extending the scan strategy to even higher redshift.
The paper is structured as follows. In §2, we detail the selection of targets for this second pilot program, while also describing the set up and reduction of our spectral scan observations. In §3, we describe the [CII] line search and present our new [CII] detections. We place our detections on the [CII]-SFR relation and examine the [CII]/ of our sources. We conclude the Section by examining their kinematics. In §4, we discuss the prospect of deploying the described spectral scan observations to a much larger set of galaxies. Finally in §5, we summarize our conclusions.
2 High-Redshift Targets and ALMA Observations
2.1 UltraVISTA Search Field and Photometry
Our source selection is based on ultradeep near-infrared imaging over the COSMOS field (Scoville et al., 2007) from the third data release (DR3) of UltraVISTA (McCracken et al., 2012). UltraVISTA provides imaging covering 1.4 square degrees (McCracken et al., 2012) in the Y, J, H and Ks filters to 24-25 mag (5), with DR3 achieving fainter limits over 0.7 square degrees in 4 ultradeep strips. The DR3 contains all data taken between December 2009 and July 2014 and reaches , , , mag (5 in 1.2′′-diameter apertures). The nominal depth we measure in the Y, J, H, and Ks bands for the UltraVISTA DR3 release is 0.1-0.2 mag, 0.6 mag, 0.8 mag, and 0.2 mag, respectively, deeper than in UltraVISTA DR2 release.
The optical data we use consists of CFHT/Omegacam in g, r, i, z (Erben et al., 2009) from the Canada-France-Hawaii Legacy Survey (CFHTLS) and Subaru/SuprimeCam in BJ+VJ+g+r+i+z imaging (Taniguchi et al., 2007). This analysis uses Spitzer/IRAC 3.6m and 4.5m observations from S-COSMOS (Sanders et al., 2007), the Spitzer Extended Deep Survey (SEDS: Ashby et al., 2013), the Spitzer-Cosmic Assembly Near-Infrared Deep Extragalactic Survey (S-CANDELS: Ashby et al., 2015), Spitzer Large Area Survey with Hyper-Suprime-Cam (SPLASH, PI: Peter Capak), and the Spitzer Matching survey of the UltraVISTA ultra-deep Stripes (SMUVS, PI: K. Caputi: Ashby et al., 2018). Compared to the original S-COSMOS IRAC data, SPLASH provides a large improvement in depth over nearly the whole UltraVISTA area, covering the central 1.2 square degree COSMOS field to 25.5 mag (AB) at 3.6 and 4.5m. SEDS and S-CANDELS cover smaller areas to even deeper limits. We also make use of data from SMUVS, which provides substantially deeper Spitzer/IRAC data over the deep UltraVISTA stripes.
Source catalogs were constructed using SExtractor v2.19.5 (Bertin & Arnouts, 1996), run in dual image mode, with source detection performed on the square root of a image (Szalay et al., 1999) generated from the UltraVISTA YJHKs images. In creating our initial catalog of candidate galaxies, we started from simply-constructed catalogs derived from the ground-based observations. Prior to our photometric measurements, images were first convolved to the J-band point-spread function (PSF) and carefully registered against the detection image (mean RMS0.05″). Color measurements were made in small Kron (1980) like apertures (SExtractor AUTO and Kron factor 1.2) with typical radius 0.35-0.50″).
We also consider color measurements made in fixed 1.2′′-diameter apertures when refining our selection of candidate galaxies. For the latter color measurements, flux from a source and its nearby neighbors (12″12″ region) is carefully modeled; and then flux from the neighbors is subtracted before the aperture photometry is performed. Our careful modeling of the light from neighboring sources improves the overall robustness of our final candidate list to source confusion. Total magnitudes are derived by correcting the fluxes measured in 1.2″-diameter apertures for the light lying outside a 1.2-diameter aperture. The relevant correction factors are estimated on a source-by-source basis based on the spatial profile of each source and the relevant PSF-correction kernel. Photometry on the Spitzer/IRAC (Fazio et al., 2004) observations is more involved due to the much lower resolution FWHM = 1.7″ compared to the ground-based data (FWHM = 0.7″). The lower resolution results in source blending where light from foreground sources contaminates measurements of the sources of interest. These issues can largely be overcome by modeling and subtracting the contaminating light using the higher spatial resolution near-IR images as a prior. Measurements of the flux in the Spitzer/IRAC observations were performed with the mophongo software (Labbé et al., 2006, 2010a, 2010b, 2013, 2015). The positions and surface brightness distributions of the sources in the coadded JHKs image are assumed to appropriate models and, after PSF matching to the IRAC observations, these models are simultaneously fit to the IRAC image leaving only their normalization as a free parameter. Subsequently, light from all neighbors is subtracted, and flux densities were measured in 2″ diameter circular apertures. The IRAC fluxes are corrected to total for missing light outside the aperture using the model profile for the individual sources. The procedure employed here is very similar to those of other studies (e.g., Skelton et al., 2014; Galametz et al., 2013; Guo et al., 2013; Stefanon et al., 2017; Weaver et al., 2022).
2.2 Bright Selection
In effort to identify a robust set of galaxies from the wide-area UltraVISTA data set for follow-up with ALMA, we require sources to be detected at 6, combining the flux in J, H, Ks, [3.6], and [4.5]-band images (coadding the S/N’s in quadrature). The combined UltraVISTA + IRAC detection and SNR requirements exclude spurious sources due to noise, detector artifacts, and diffraction features. We construct a preliminary catalog of candidate z 7 galaxies using those sources that show an apparent Lyman break due to absorption of UV photons by neutral hydrogen in the IGM blueward of the redshifted Ly line. This break is measured using simple color criteria. At , the -band flux is significantly impacted by this absorption of rest- photons, while at , the -band flux is impacted. The following criteria were applied:
where is the logical AND operator. In case of a non-detection, the or -band flux in these relations is replaced by the equivalent 1 upper limit.
It is worth emphasizing that our final sample of bright galaxies shows little dependence on the specific limits chosen here. For each candidate source the redshift probability distribution P(z) is then determined using the EAZY photometric redshift software (Brammer et al., 2008), which fits a linear combination of galaxy spectral templates to the observed spectral energy distribution (SED).
The template set used here is the standard EAZY v1.0 template set, augmented with templates from the Galaxy Evolutionary Synthesis Models (GALEV: Kotulla et al., 2009) which include nebular continuum and emission lines. The implementation of nebular lines follow the prescription of Anders & Fritze-v. Alvensleben (2003), assuming 0.2 Z⊙ metallicity and a large rest-frame EW of H = 1300Å. These extreme EW reproduce the observed [3.6][4.5] colors for many spectroscopically confirmed -9 galaxies (e.g., Ono et al., 2012; Finkelstein et al., 2013; Oesch et al., 2015; Zitrin et al., 2015; Roberts-Borsani et al., 2016; Stark et al., 2017). A flat prior on the redshift is assumed.
To maximize the robustness of candidates selected for our samples, we require the integrated probability beyond to be 70%. The use of a redshift likelihood distribution is very effective in rejecting faint low-redshift galaxies with a strong Balmer/4000Å break and fairly blue colors redward of the break.
The available optical observations are used to reject other low redshift sources and Galactic stars by imposing . is defined as where is the flux in band in a consistent aperture, is the uncertainty in this flux, and SGN() is equal to 1 if and if . is calculated in both 0.8′′-diameter apertures and in scaled elliptical apertures. is effective in excluding -3 low-redshift star-forming galaxies where the Lyman break color selection is satisfied by strong line emission contributing to one of the broad bands (e.g. van der Wel et al., 2011; Atek et al., 2011). Sources which show a 2 detection in the available ground-based imaging bands (weighting the flux in the different bands according to the inverse square uncertainty in ) are also excluded as potentially corresponding to lower-redshift contaminants. Finally, to minimize contamination by low-mass stars, we fit the observed SEDs of candidate galaxies both with EAZY and with stellar templates from the SpecX prism library (Burgasser et al., 2004). Sources which are significantly better fit ( 1) by stellar SED models are excluded. The SED templates for lower mass stars are extended to 5m using the known or colors of these spectral types (Patten et al., 2006; Kirkpatrick et al., 2011) and the nominal spectral types of stars from the SpecX library. The approach we utilize is identical to the SED-fitting approach employed by Bouwens et al. (2015) for excluding low-mass stars from the CANDELS fields. Combined, these selection requirements result in very low expected contamination rates.
Using the above selection criteria, we select 32 potential candidates for spectral scans over a 1.2 square degrees area in the UltraVISTA field. The sources have an H-band magnitude ranging from 23.8 mag to 25.7 mag and redshifts 6.6 to 7.1. We include a list of the sources we select in Table 3 from Appendix A.
|
|
|
|
|
|
|
|||||||||||||||
|---|---|---|---|---|---|---|---|---|---|---|---|---|---|---|---|---|---|---|---|---|---|
| UVISTA-Z-001 | 10:00:43.36 | 02:37:51.3 | 1.47″1.21″ | 39.31 | 3.3 | 228.62 - 239.37 (-7.31) (71%) | |||||||||||||||
| UVISTA-Z-007 | 09:58:46.21 | 02:28:45.8 | 1.40″1.19″ | 32.76 | 1.9 | 240.28 - 251.02 (-6.91) (82%) | |||||||||||||||
| UVISTA-Z-009 | 10:01:52.30 | 02:25:42.3 | 1.38″1.20″ | 32.76 | 1.9 | 240.28 - 251.02 (-6.91) (65%) | |||||||||||||||
| UVISTA-Z-010 | 10:00:28.12 | 01:47:54.5 | 1.44″1.18″ | 39.31 | 3.3 | 228.62 - 239.37 (-7.31) (90%) | |||||||||||||||
| UVISTA-Z-013 | 09:59:19.35 | 02:46:41.3 | 1.45″1.18″ | 39.31 | 3.3 | 228.62 - 239.37 (-7.31) (99%) | |||||||||||||||
| UVISTA-Z-019 | 10:00:29.89 | 01:46:46.4 | 1.39″1.18″ | 32.76 | 1.9 | 240.28 - 251.02 (-6.91) (95%) |
Note. — a Beamsize for the naturally weighted moment-0 images. b Corresponds to the average on-source integration time for the two tunings. c Average precipitable water vapour during the observations. d Percentage of the redshift probability distribution that is covered by the spectral scan.
2.3 Target Selection for the ALMA Observations
In an effort to further demonstrate the potential of spectral scans with ALMA to characterize massive star-forming galaxies at , we elected to target six sources from the galaxy sample constructed in the previous Section (and which is presented in Appendix A).
We focused on those galaxies which are brightest in the rest-frame and have the tightest constraints on their photometric redshifts. -bright galaxies are particularly useful to target since those sources have the highest apparent SFRs and should contain particularly luminous [CII] lines, assuming the De Looze et al. (2014) relation holds out to as Schaerer et al. (2020) find. If there is an additional contribution from obscured star formation, the luminosity of [CII] should be further enhanced.
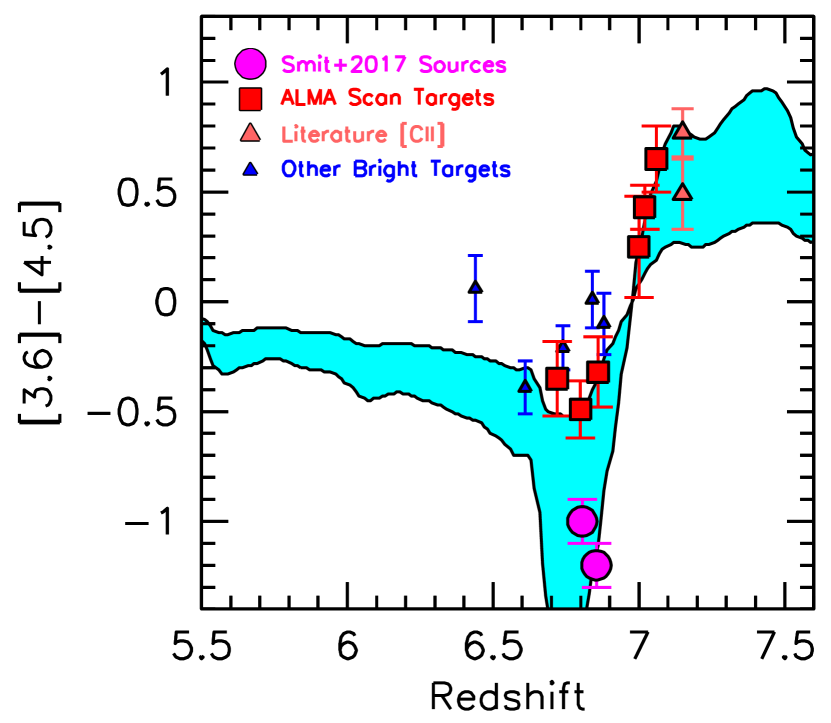
Additionally, it is useful to target sources with tight constraints on their redshifts from photometry to minimize the number of spectral scan windows that need to be utilized. For this purpose, a useful set of sources to target are those with particularly strong constraints on their photometric redshifts from their Spitzer/IRAC colors. One particularly interesting opportunity exists for sources where the broad-band Lyman-break places sources around a redshift , as Smit et al. (2015) and Smit et al. (2018) have already demonstrated. This is due to the fact that at , the Spitzer/IRAC color can reduce the width of the redshift likelihood window for a source by as much as a factor of 2. Due to the dramatic impact the [OIII]+H lines have on the [3.6][4.5] colors for star-forming galaxies at , the Spitzer/IRAC color places robust constraints on the redshift of a source. For sources with a robustly red Spitzer/IRAC [3.6][4.5] color, we can eliminate the solution, while for sources with a robustly blue Spitzer/IRAC [3.6][4.5] color, we can eliminate the solution.
Following from these arguments, the best targets for the detection of luminous [CII] line emission at are those sources (1) which are bright , (2) have photometric Lyman breaks around , and (3) have robustly red or blue colors. We highlight these sources in a Spitzer/IRAC [3.6][4.5] color vs. redshift diagram in Figure 1 as the large red squares.
|
|
|
|
|
|
|
|
|
|
||||||||||||||||||
|---|---|---|---|---|---|---|---|---|---|---|---|---|---|---|---|---|---|---|---|---|---|---|---|---|---|---|---|
| UVISTA-Z-001 | 7.00 | 7.0599(3) | 2.9 | 9.58 | 1004 | 5.0 | 0.570.08 | 6.7 1.2 | 256 27 | ||||||||||||||||||
| UVISTA-Z-007 | 6.72 | 6.7496(5) | 1.5 | 9.57 | 761 | 2.2c | 0.510.09 | 5.6 1.4 | 301 42 | ||||||||||||||||||
| UVISTA-Z-009 | 6.86 | - | 1.6 | 9.40 | 1012 | 2.4 | - | -d | - | ||||||||||||||||||
| UVISTA-Z-010 | 7.06 | - | 1.1 | 8.88 | 1706 | 2.1 | - | -d | - | ||||||||||||||||||
| UVISTA-Z-013 | 7.02 | - | 1.4 | 10.72 | 1821 | 2.2 | - | -d | - | ||||||||||||||||||
| UVISTA-Z-019 | 6.80 | 6.7534(2) | 1.0 | 9.51 | 628 | 2.7 | 0.800.06 | 8.8 0.9 | 184 15 |
Note. — -Luminosities and stellar masses are taken from Schouws et al. (2021) and were derived using the methodology described in Stefanon et al. (2019), assuming a metallicity of 0.2 , a constant star formation history and a Calzetti et al. (2000) dust law. [OIII]+H equivalent widths are taken from Bouwens et al. (2021b) and Stefanon et al. (2022, in prep). a Total infrared luminosity integrated from 8-1000m assuming a modified black body SED with a dust temperature of 50 K and a dust emissivity index =1.6 after correcting for CMB effects (we refer to Schouws et al., 2021, for details). b Observed FWHM of the [CII] emission line as measured in the 1d spectrum. c UVISTA-Z-007 shows dust continuum emission at a level of (corresponding to ), but we use the upper limit on the luminosity for the remainder of our analysis to be conservative. d These non-detections are either caused by a [CII] luminosity is lower than our detection limit (, see Figure 7) or because their redshift falls outside of the range scanned in this study. Because of this degeneracy we cannot provide limits on their [CII] luminosity outside the scanned redshift ranges (see table 1).
2.4 ALMA Observations and Data Reduction
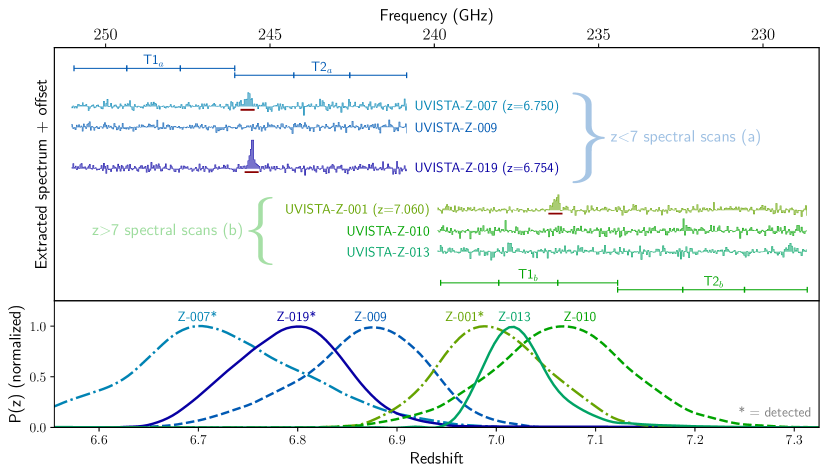
A summary of the ALMA data collected for this second pilot program is presented in Table 1. ALMA observations were obtained over a contiguous 10.75 GHz range (2 tunings) to scan for [CII] line. For the three targets with photometric redshifts , the redshift range to 6.91 was scanned (240.28 to 251.02 GHz). For the targets with photometric redshifts , the redshift range to 7.31 was scanned (228.62 to 239.37 GHz). The scan windows utilized are presented in Figure 2, along with the redshift likelihood distribution inferred from our photometry. These scan windows cover between 71% to 99% of the estimated redshift likelihood distribution (Table 1). The required integration times for the observations were set assuming a similar [CII] luminosity and line width for sources as in pilot program observations of Smit et al. (2018), i.e., 4108 and 200 km/s for the FWHM of [CII]. To detect this line at 5, we required achieving a sensitivity of 300 Jy per 66 km/s channel. To achieve this sensivitity, we require to 39 minutes of integration time with ALMA.
The ALMA data were reduced and calibrated using Casa version 5.4.1 following the standard ALMA pipeline procedures. To reduce the data-size of the visibility measurement set, we averaged the data in bins of 30 seconds after carefully calculating that this bin-size does not impact our data through time-average smearing (e.g. Thompson, Moran & Swenson 2017). We then performed initial imaging of the full data-cube using the tclean task with natural weighting. We clean to a depth of 3 per channel and use automasking111For the automasking we use the recommended settings for the 12-meter array with compact baselines from the Casa automasking guide: https://casaguides.nrao.edu/index.php/Automasking_Guide. We verified that the automasking identifies the same emission regions that we would have selected when masking by hand. to identify regions that contain emission. This initial data-cube was used to do an inital search for [CII] line candidates, details of our line-search procedure are described in the next Section.
If a significant emission line candidate is identified, we use the line properties to carefully mask the channels containing line emission to produce a continuum subtracted visibility data-set using the uvcontsub task. This continuum subtracted measurement set is then used to re-image the full data cube, after which we repeat the line search and verify that the same line candidates are obtained.
For each emission line candidate we produce an initial moment-0 image, including channels that fall within 2 the initial FWHM estimate of the line candidate222Collapsing over all channels that fall within 2 the FWHM captures 98% of the flux for lines with a Gaussian line-profile.. Using this moment-0 map, we produce a 1d spectrum where we include all pixel-spectra that correspond to emission in the moment-0 map and we weigh the contribution of each pixel-spectrum by their signal-to-noise level. We then fit a Gaussian line model to this spectrum to extract the central frequency and the FWHM. Next, using this updated estimate for the FWHM, we update the moment-0 image and its associated signal-to-noise weighted 1d spectrum. We perform this 10 times and note that it converges to a stable solution within a few iterations. The line parameters that we derive with this method are also used to carefully exclude line emission from the continuum imaging used in Schouws et al. (2021).
3 Results
3.1 [CII] Line Search
We performed a systematic search for emission line candidates using the MF3D line search algorithm (Pavesi et al., 2018). MF3D finds line candidates using Gaussian template matching, which accounts for both spectrally and spatially extended emission lines. We used MF3D with 10 frequency templates with line-widths ranging from 50 to 600 km/s and 10 spatial templates ranging from 0 to 4.5 arcseconds. To be considered a reliable detection, we require line candidates to be within 1.5″ of the rest-frame UV position of our sources and have SNR5.2. This criterion was found to result in 95% purity (Schouws et al. in prep.).
Based on this search, we find reliable emission lines for UVISTA-Z-001 at 12.8 at 235.80 GHz, for UVISTA-Z-007 at 9.4 at 245.24 GHz and for UVISTA-Z-019 at 18.3 at 245.12 GHz. The other datacubes did not contain any line candidates that meet the SNR requirements discussed above. For these non-detections, either their [CII] luminosity is lower than our detection limit (, see Figure 7) or their redshift falls outside of the range scanned in this study. The results of the line-search are summarized in Figure 2, which shows the layout of the full spectral scan and corresponding P(z)’s for all six sources in this study.
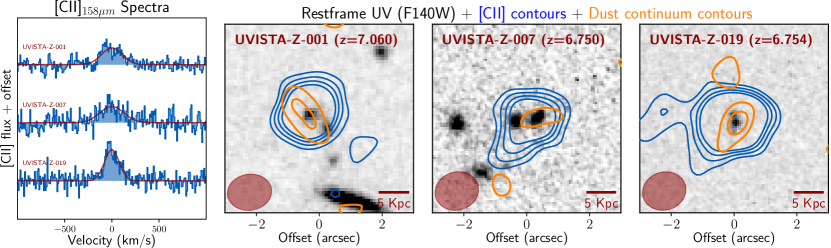
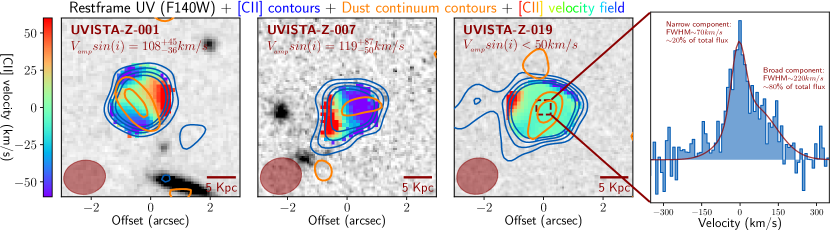
For the detected sources we show the contours from the [CII] and dust continuum emission compared to the rest-frame morphology and their 1d spectra in Figure 3. The rest-frame images are in the F140W band at 1.39m and are from GO-13793 (UVISTA-Z-001, PI:Bowler: Bowler et al., 2017) and GO-16506 (UVISTA-Z-007, UVISTA-Z-019, PI: Witstok; Witstok et al. 2022, in prep). For a detailed description of the procedure we used to produce the moment-0 images and 1d spectra we refer to Section 2.4.
We measure the integrated flux of the [CII] emission lines from the moment-0 images by fitting the data with a 1-component Gaussian model using the imfit task. The resulting flux measurements are shown in Table 2. We double-check the measurements from imfit with UVMULTIFIT (Martí-Vidal et al., 2014), which we use to fit a Gaussian model in the (u,v)-plane instead of the image-plane. We reassuringly find that both methods produce results consistent within their errorbars. Finally, we convert these [CII] fluxes to luminosities following Solomon et al. (1992) and Carilli et al. (2013):
| (1) |
with the integrated flux density in mJy km/s, the observing frequency and the luminosity distance.
3.2 The [CII]-SFR Relation
The large luminosity and favourable atmospheric opacity of [CII] enable detection up to very high redshifts. Local galaxies studies have found a tight correlation between the [CII] luminosity and SFR (De Looze et al., 2011, 2014; Kapala et al., 2014; Cormier et al., 2015; Herrera-Camus et al., 2015; Díaz-Santos et al., 2017), [CII] has therefore been proposed as an efficient and unbiased probe of the SFR at high redshift.
In past few years, this correlation between SFR and L[CII] has been observed out to with an increasing number of detections and upper-limits. Of particular note are the results from the ALPINE large program, which finds little to no evolution in the [CII]-SFR relation in a large sample of normal galaxies at (Schaerer et al., 2020). At even higher redshifts the current samples are less uniform, but still seem to be consistent with the local relation, albeit with a larger scatter (e.g., Carniani et al., 2018; Matthee et al., 2019).
Nevertheless, there has been an increasing number of observations of galaxies that fall well below the local relations (e.g., Ota et al., 2014; Matthee et al., 2019; Laporte et al., 2019; Bakx et al., 2020; Binggeli et al., 2021; Uzgil et al., 2021; Rybak et al., 2021; Jolly et al., 2021). In particular lensed galaxies probing lower M∗ and SFRs, and Lyman- emitters (LAE) seem to be deficient in [CII] (Harikane et al., 2020; Jolly et al., 2021).
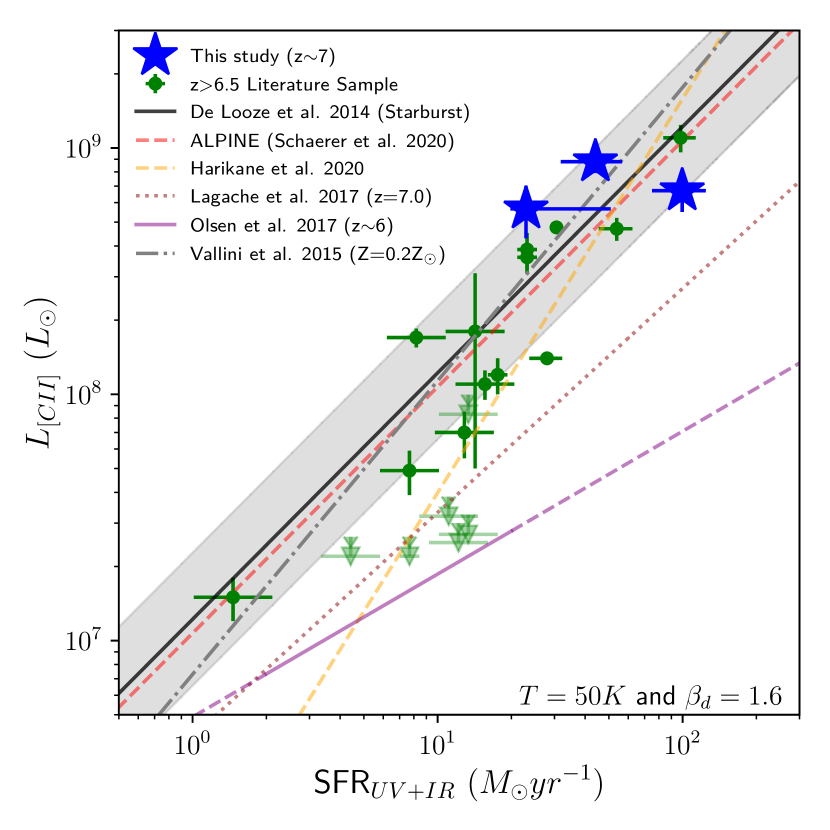
We show the position of our sources on the [CII]-SFR relation in Figure 4, and find that the galaxies targeted in this study are also consistent with the local relation from De Looze et al. (2014) within the expected scatter. The three sources where [CII] remains undetected are not shown on this Figure, since it is unclear whether the [CII] line is below our detection threshold (i.e., ) or whether the true redshift is outside the range of our spectral scan. Because these sources have SFRs between 18 and 26 our detection limit falls only slightly below and within the scatter from the local relation (De Looze et al. (2014)). From this Figure, it is clear that most of the galaxies with SFR are consistent with the local relation, while at lower SFRs a significant fraction of currently observed galaxies seems to fall below the relation.
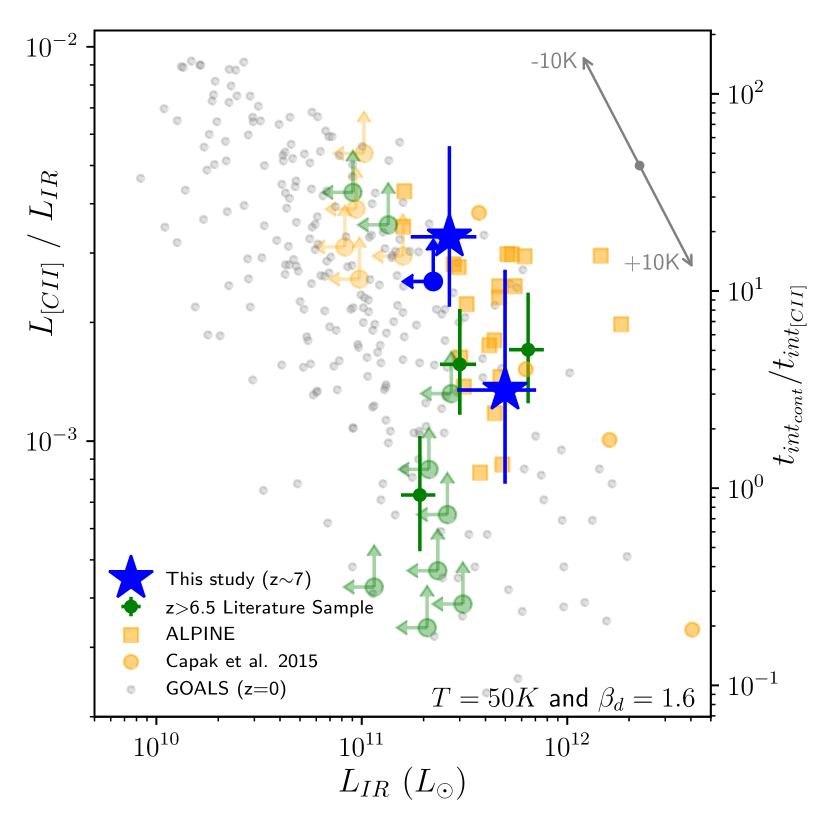
3.3 [CII] vs. FIR
It has been found that [CII] can account for up to of the total infrared luminosity of galaxies, however it has also been found that this fraction decreases by orders of magnitude with increasing , leading to a [CII]-deficit in luminous galaxies (e.g., Genzel & Cesarsky, 2000; Malhotra et al., 2001; Hodge & da Cunha, 2020). Specifically, observed [CII]/FIR ratios range from 10-2 for normal z0 galaxies to 10-4 for the most luminous objects, with a large scatter (e.g., Díaz-Santos et al., 2013).
The reason for this observed [CII]-deficit remains a topic of discussion in the literature, with a large range of possible explanations including optically thick [CII] emission, effects from AGN, changes in the IMF, thermal saturation of [CII], positive dust grain charging and dust-dominated HII region opacities (e.g., Casey et al., 2014; Smith et al., 2016; Ferrara et al., 2019; Rybak et al., 2019; Hodge & da Cunha, 2020).
The galaxies in this study have far infrared luminosities of 333To calculate the far infrared luminosities we assume a modified black body dust-SED with K and , see Schouws et al. (2021) for details., which puts them in the Luminous Infrared Galaxy (LIRG) classification. Comparing their infrared to their [CII] luminosity we find ratios of [CII]/ (see Figure 5). Compared to local (U)LIRGS from the GOALS survey (Díaz-Santos et al., 2013, 2017), we find that our galaxies are less deficient in [CII] by a factor 0.3 dex. This result has a minor dependence on the assumed dust temperature as shown with the grey arrows on Figure 5. When assuming higher or lower dust temperatures the data-points move mostly parallel to the trend. Only for substantially higher dust temperatures (K) would our measurements be consistent with the local results.
Our measured [CII]/FIR ratios are consistent with other studies at high redshifts, which also find that high redshift galaxies tend to be less [CII] deficient (e.g., Capak et al., 2015; Schaerer et al., 2020). A possible explanation for this lack of [CII]-deficit in high redshift galaxies could be different dust conditions. Specifically, a lower dust-to-gas ratio at a fixed far infrared luminosity could increase the [CII] luminosity with respect to the infrared (Capak et al., 2015).
3.4 [CII] Kinematics
Due to its high intrinsic luminosity, [CII] is an efficient tracer of the kinematics of high redshift galaxies (e.g., Neeleman et al., 2019). To investigate the kinematics of our sources, we derive the velocity maps of our galaxies by fitting Gaussians to the pixel-spectra in our cube, including all pixels for which the uncertainty on the velocity is less than 50 km/s. The resulting velocity fields are shown in Figure 6. Despite the low (1.3″, see Table 1) resolution of our observations, some of our sources show significant velocity gradients.
In particular, we find that both UVISTA-Z-001 and UVISTA-Z-007 display a significant velocity gradient, with velocity amplitudes of km/s and km/s respectively444We derive by fitting a rotating thin disk model to the 3D datacube using forward modeling with our kinematics fitting code Skitter (Schouws et al., in prep.). The maximum velocities on the kinematics maps shown in Figure 6 are lower than the actual due to beam-smearing effects.. If we compare the observed rotational velocities assuming no correction for inclination (, hence = ) to the total line-width of the 1d spectrum () (see Table 2 and Figure 6), we find that the are and respectively. This would mean that both sources should most likely be classified as rotation dominated (defined as as utilized in e.g. Förster-Schreiber et al., 2009). This calculation does not assume a correction for the inclination of the system, which would increase . The observed velocity gradient could however also be caused by close mergers. At the current resolution, rotating disks are indistinguishable from mergers (e.g. Jones et al., 2021, Schouws et al., in prep).
In particular, we find indications that UVISTA-Z-007 could be a merger. The HST F140W imaging (Witstok et al. in prep.) shows clearly that this source consists of two distinct components (see Figure 3). The observed velocity gradient is in the same direction as the two UV components (as shown in Figure 6), making it likely that the observed velocity gradient in the [CII] is in fact due to the merger of these two components.
For UVISTA-Z-019 we do not observe a significant velocity gradient and constrain the maximum rotation velocity to km/s, implying that this system is either dominated by dispersion or a face-on system (). A more detailed look at the pixel-spectra within the cube indicates that in the central part of this source, the [CII] emission seems to break down into two distinct components (rightmost panel on Figure 6), consisting of a narrow component (FWHM km/s) responsible for of the total flux and a broad component (FWHM km/s) that accounts for of the total flux.
This interesting spectral feature could be caused by several processes, such as the effect of an outflow. However, this would imply that the majority of the [CII] luminosity originates from the outflow and that the emission from the galaxy would have a very narrow FWHM, implying a low dynamical mass, lower than the stellar mass ( 555We derive dynamical masses following Wang et al. (2013): where is the full width half maximum of the [CII] line in and the [CII] half light radius in kpc. Because the narrow [CII] component is unresolved, we assume a size of 1 kpc (consistent with Bowler et al., 2017). versus ). An alternative explanation for the spectral feature could be a minor-merger, where the narrow component originates from an in-falling galaxy. However, this would mean that the LOS velocity is rather small at only km/s, despite this likely being one of the final stages of the merger. Indeed, HST morphology tentatively shows two close components separated by 1.5 kpc (see also Figure 3). Finally, the kinematics could also be evidence for a bright clump of intense star formation within a larger system, indicating the complex structure of high redshift sources (e.g., Kohandel et al., 2019, 2020). Hence an alternative interpretation of the clumps in HST imaging could be the presence of multiple star-forming regions in a larger system. Higher spatial resolution ALMA observations or deep rest-frame optical observations with JWST would be invaluable to definitively distinguish between these scenarios.
4 The Efficiency of Spectral Scans and Future Prospects
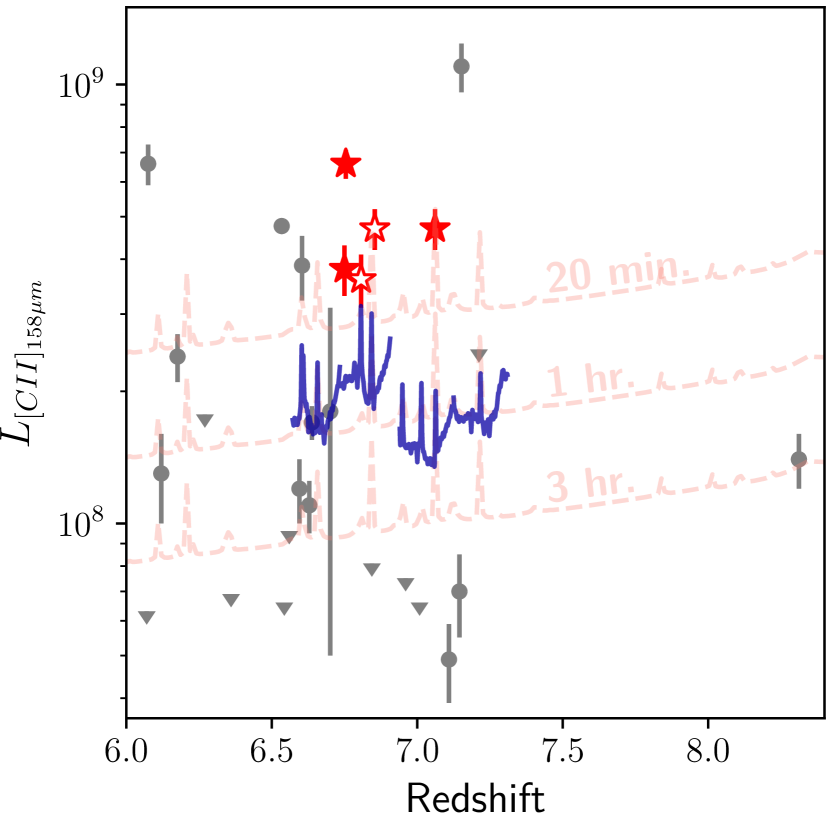
In this study we have obtained redshifts for three galaxies without a prior spectrocopic redshift. In particular by targeting UV-luminous galaxies with high SFRs, the [CII] lines we detect are also luminous. In Figure 7 we show that the [CII] emission of our sources could have been detected at 5 in only minute integrations per tuning with ALMA.
Our sources benefit from very tight constraints on the photometric redshift due to the large break in the IRAC colors (see Figure 1), which enables us to cover a significant fraction of the with only 2 tunings. For sources that lack this additional constraint, 3 or 4 tunings would be necessary to cover the appropriately. Nevertheless, this would still mean that galaxies like the ones targeted in this study could be spectroscopically confirmed in less than hours per source.
It should be noted though that for sources with a lower SFR (and hence lower [CII] luminosities), spectral scanning becomes expensive quickly. A spectral scan targeting an galaxy ( at ) would cost hours on source adopting the De Looze et al. (2014) -SFR relation. Therefore, to study the [CII] emission from galaxies, either targeting lensed galaxies for spectral scans or following-up galaxies with a prior spectroscopic redshift (e.g. from JWST or ground-based Lyman-) remain the most suitable options.
One significant advantage of using a spectral scan strategy is the time spent integrating in regions of the spectra not containing prominent ISM cooling lines. These integrations allow us to probe continuum emission from our targets. This is important – since the continuum is much harder to detect than [CII], as one can see from the [CII]/ ratios of our sources. This is illustrated in Figure 5 (right vertical axis), on which we show the ratio of the integration time needed to detect the dust continuum versus the [CII] line. We find that it is necessary to integrate up to longer to obtain a detection of the dust continuum. This means that the time spent observing tunings that do not contain a spectral line is not wasted, but contributes to the necessary sensitivity to detect the faint dust continuum.
Based on the results presented in this paper and Smit et al. (2018), we proposed and were awarded the time to apply the spectral scan method to a significantly larger sample of galaxies, covering a much larger range in galaxy properties and redshift. The result was the on-going Reionization Era Bright Emission Line Survey (REBELS) large program, in which we pursue spectral scans for [CII] or [OIII] in a sample of 40 galaxies (Bouwens et al., 2021b).
5 Summary
In this paper we present the results of new ALMA spectral scan observations targeting [CII] in a small sample of six luminous Lyman Break Galaxies at . The targeted sources were identified from deep, wide-area near-IR, optical, and Spitzer/IRAC observations and are particularly luminous. The targeted sources also feature tight constraints on their redshifts leveraging the abrupt changes that occur in the IRAC colour around (where strong line emission from [OIII]+H shifts from the [3.6] to [4.5] band). This improves the efficiency of the spectral scans by 2 based on a small number of tunings required to cover the inferred . The present results build on the exciting results from Smit et al. (2018), who previously demonstrated the potential of spectral scans for [CII] with just two sources.
Our main results are summarized below:
-
•
We detect () [CII] lines for three of the six galaxies we target with our spectral scans (shown in Figure 2). The [CII] lines are strong with luminosities between and . We also observe that the [CII], dust and rest-frame UV emission are well aligned within the resolution of our observation (see Figure 3).
-
•
Placing our new detections on the [CII]-SFR relation shows that our sources are consistent with the local relation from De Looze et al. (2014) (for HII/starburst galaxies) (shown in Figure 4), and we find slightly higher [CII]/ compared to local (U)LIRGS (see Figure 5), which is consistent with previous studies of high redshift galaxies.
-
•
Although our observations are taken at a relatively low resolution (1.3″), we find that our sources display a broad spectrum of kinematic diversity. One of our sources seems to be rotation dominated, one source is most likely a major merger and one source is dominated by dispersion. We also find possible kinematic evidence for a bright star forming clump within the dispersion dominated source (see Figure 6). However, higher resolution observations are necessary to confirm our interpretation of the kinematics of our sources.
-
•
We discuss the lack of evolution of the [CII]-SFR relation found for luminous high redshift galaxies by reviewing the literature on the physical effects that drive the [CII] emission in high redshift galaxies. While one would naively expect a trend towards lower [CII]/SFR values with redshift based on the higher ionization parameter, lower metallicities and higher densities of high redshift galaxies, this is not observed. We speculate that a lower dust-to-gas or dust-to-metal ratio, which increases the [CII] emission, could compensate for those effects.
These new results illustrate the tremendous potential spectral scans with ALMA have for characterizing luminous galaxies in the epoch of reionization (see Figure 7), including deriving spectroscopic redshifts for sources, and probing the kinematics and dynamical masses of sources, as well as the dust continuum (Schouws et al., 2021). Results from this data set showed the potential (§4) and were important in successfully proposing for the REBELS large program in cycle 7 (Bouwens et al., 2021b). Future studies (Schouws et al. 2022, in prep) will significantly add to the current science using that considerable data set.
Acknowledgements
We are greatly appreciative to our ALMA program coordinator Daniel Harsono for support with our ALMA program. This paper makes use of the following ALMA data: ADS/JAO.ALMA 2018.1.00085.S. ALMA is a partnership of ESO (representing its member states), NSF (USA) and NINS (Japan), together with NRC (Canada), MOST and ASIAA (Taiwan), and KASI (Republic of Korea), in cooperation with the Republic of Chile. The Joint ALMA Observatory is operated by ESO, AUI/NRAO and NAOJ. Sander Schouws and Rychard Bouwens acknowledge support from TOP grant TOP1.16.057 and a NOVA (Nederlandse Onderzoekschool Voor Astronomie) 5 grant. JH acknowledges support of the VIDI research programme with project number 639.042.611, which is (partly) financed by the Netherlands Organisation for Scientific Research (NWO). HSBA acknowledges support from the NAOJ ALMA Scientific Research Grant Code 2021-19A. JW and RS acknowledge support from the ERC Advanced Grant 695671, ”QUENCH”, and the Fondation MERAC. RS acknowledges support from an STFC Ernest Rutherford Fellowship (ST/S004831/1). The PI acknowledges assistance from Allegro, the European ALMA Regional Center node in the Netherlands.
Appendix A Bright Sample of Galaxies Used for Selecting Our Six Follow-up Targets
For completeness, we provide the coordinates, magnitudes, [3.6][4.5] colors, and photometric redshifts for the full selection of bright candidate galaxies we identified (§2.2) within the UltraVISTA field in Table 3.
| ID | R.A. | Dec | aafootnotemark: | [3.6]-[4.5] | bbfootnotemark: | Referencesccfootnotemark: | |
|---|---|---|---|---|---|---|---|
| Current Selection of Bright Candidate Galaxies | |||||||
| UVISTA-Z-001 | 10:00:43.361 | 2:37:51.33 | 23.80.1 | 0.30.2 | 7.00 | [2] | |
| UVISTA-Z-002 | 10:02:06.469 | 2:13:24.18 | 24.10.1 | 0.20.1 | 6.74 | [1,10] | |
| UVISTA-Z-003 | 10:02:06.701 | 2:34:21.42 | 24.20.1 | 0.10.1 | 6.88 | ||
| UVISTA-Z-004 | 10:01:36.850 | 2:37:49.10 | 24.30.1 | 0.00.1 | 6.84 | [2,10] | |
| UVISTA-Z-005 | 10:01:58.501 | 2:33:08.22 | 24.30.1 | 0.40.1 | 6.61 | [1,10] | |
| UVISTA-Z-006 | 10:01:40.688 | 1:54:52.37 | 24.40.1 | 0.50.2 | 7.09 | 7.152∗ | [2,9] |
| UVISTA-Z-007 | 09:58:46.214 | 2:28:45.75 | 24.40.1 | 0.40.2 | 6.72 | ||
| UVISTA-Z-008 | 09:58:39.762 | 2:15:03.27 | 24.40.1 | 0.10.2 | 6.44 | ||
| UVISTA-Z-009 | 10:01:52.304 | 2:25:42.27 | 24.50.1 | 0.30.2 | 6.86 | [2] | |
| UVISTA-Z-010 | 10:00:28.121 | 1:47:54.47 | 24.50.1 | 0.60.2 | 7.06 | [2] | |
| UVISTA-Z-011 | 10:00:42.125 | 2:01:57.10 | 24.60.1 | 0.10.1 | 6.55 | [2,10] | |
| UVISTA-Z-013 | 09:59:19.353 | 2:46:41.31 | 24.80.2 | 0.40.1 | 7.02 | [10] | |
| UVISTA-Z-014 | 09:57:35.723 | 1:44:56.40 | 24.80.1 | –d | 7.13 | ||
| UVISTA-Z-015 | 10:00:23.772 | 2:20:36.98 | 24.80.1 | 0.80.1 | 7.07 | 7.154∗∗ | [2,3,4,5,6,7] |
| UVISTA-Z-016 | 10:01:54.562 | 2:47:35.79 | 24.90.2 | 1.10.9 | 6.77 | ||
| UVISTA-Z-017 | 10:00:30.188 | 2:15:59.71 | 24.90.1 | 1.30.2 | 6.78 | 6.854∗∗∗ | [1,2,3,4,8,10] |
| UVISTA-Z-018 | 10:02:03.811 | 2:13:25.06 | 25.00.2 | 0.60.3 | 6.81 | [2] | |
| UVISTA-Z-019 | 10:00:29.892 | 1:46:46.37 | 25.00.2 | 0.50.1 | 6.80 | ||
| UVISTA-Z-020 | 10:01:57.140 | 2:33:48.76 | 25.00.2 | 0.60.3 | 6.73 | ||
| UVISTA-Z-021 | 09:57:36.994 | 2:05:11.28 | 25.10.2 | 0.30.3 | 6.73 | [10] | |
| UVISTA-Z-022 | 09:59:13.206 | 2:21:52.51 | 25.10.2 | 0.10.6 | 6.52 | ||
| UVISTA-Z-023 | 09:58:45.961 | 2:39:05.94 | 25.10.2 | 3.47.3 | 6.76 | ||
| UVISTA-Z-024 | 09:59:04.558 | 2:11:38.10 | 25.20.2 | 0.80.4 | 6.89 | ||
| UVISTA-Z-025 | 09:58:49.216 | 1:39:09.70 | 25.30.3 | 1.60.6 | 6.70 | [10] | |
| UVISTA-Z-026 | 10:02:05.967 | 2:06:46.13 | 25.30.2 | 1.40.4 | 6.74 | [10] | |
| UVISTA-Z-027 | 09:59:22.426 | 2:31:19.45 | 25.30.2 | 0.10.7 | 6.69 | [10] | |
| UVISTA-Z-028 | 10:00:54.819 | 1:50:05.28 | 25.30.2 | 0.10.2 | 6.67 | [10] | |
| UVISTA-Z-029 | 10:00:41.097 | 2:29:31.13 | 25.30.2 | 0.10.1 | 6.72 | ||
| UVISTA-Z-030 | 10:02:22.458 | 2:04:45.72 | 25.30.3 | 0.10.2 | 6.61 | ||
| UVISTA-Z-031 | 09:59:01.407 | 2:28:02.13 | 25.40.2 | 0.90.4 | 6.61 | ||
| UVISTA-Z-032 | 10:00:22.482 | 1:45:32.62 | 25.40.2 | 1.00.4 | 6.71 | ||
Note. — a UVISTA -band magnitude. b 68% confidence intervals derived by EAzY using the SED template set presented in §2.2. c References: [1] Tilvi et al. (2013), [2] Bowler et al. (2014, 2017), [3] Bouwens et al. (2015), [4] Smit et al. (2015), [5] Roberts-Borsani et al. (2016), [6] Pentericci et al. (2016), [7] Stark et al. (2017), [8] Smit et al. (2018), [9] Hashimoto et al. (2019), [10] Endsley et al. (2021). d This source fell outside the footprint of the IRAC mosaics used for the source selection in this manuscript. * Detected in dust continuum, [CII] and [OIII] by Hashimoto et al. (2019) and dust continuum by Bowler et al. (2018) (Big Three Dragons/ B14-65666). ** Detected in [CII] by Pentericci et al. (2016) and Lyman- by Stark et al. (2017). *** Detected in [CII] by Smit et al. (2018).
References
- Anders & Fritze-v. Alvensleben (2003) Anders, P., & Fritze-v. Alvensleben, U. 2003, A&A, 401, 1063
- Ashby et al. (2013) Ashby, M. L. N., Willner, S. P., Fazio, G. G., et al. 2013, ApJ, 769, 80
- Ashby et al. (2015) —. 2015, ApJS, 218, 33
- Ashby et al. (2018) Ashby, M. L. N., Caputi, K. I., Cowley, W., et al. 2018, The Astrophysical Journal Supplement Series, 237, 39. https://doi.org/10.3847%2F1538-4365%2Faad4fb
- Atek et al. (2011) Atek, H., Siana, B., Scarlata, C., et al. 2011, ApJ, 743, 121
- Bakx et al. (2020) Bakx, T. J. L. C., Tamura, Y., Hashimoto, T., et al. 2020, Monthly Notices of the Royal Astronomical Society, 493, 4294. https://doi.org/10.1093/mnras/staa509
- Bertin & Arnouts (1996) Bertin, E., & Arnouts, S. 1996, A&AS, 117, 393
- Béthermin et al. (2020) Béthermin, M., Fudamoto, Y., Ginolfi, M., et al. 2020, A&A, 643, A2. https://doi.org/10.1051/0004-6361/202037649
- Binggeli et al. (2021) Binggeli, C., Inoue, A. K., Hashimoto, T., et al. 2021, A&A, 646, A26. https://doi.org/10.1051/0004-6361/202038180
- Bouwens et al. (2015) Bouwens, R. J., Illingworth, G. D., Oesch, P. A., et al. 2015, The Astrophysical Journal, 803, 34. https://doi.org/10.1088%2F0004-637x%2F803%2F1%2F34
- Bouwens et al. (2021a) Bouwens, R. J., Oesch, P. A., Stefanon, M., et al. 2021a, AJ, 162, 47
- Bouwens et al. (2021b) Bouwens, R. J., Smit, R., Schouws, S., et al. 2021b, arXiv e-prints, arXiv:2106.13719
- Bowler et al. (2018) Bowler, R. A. A., Bourne, N., Dunlop, J. S., McLure, R. J., & McLeod, D. J. 2018, Monthly Notices of the Royal Astronomical Society, 481, 1631. https://doi.org/10.1093/mnras/sty2368
- Bowler et al. (2021) Bowler, R. A. A., Cullen, F., McLure, R. J., Dunlop, J. S., & Avison, A. 2021, arXiv e-prints, arXiv:2110.06236
- Bowler et al. (2017) Bowler, R. A. A., Dunlop, J. S., McLure, R. J., & McLeod, D. J. 2017, Monthly Notices of the Royal Astronomical Society, 466, 3612. https://doi.org/10.1093/mnras/stw3296
- Bowler et al. (2014) Bowler, R. A. A., Dunlop, J. S., McLure, R. J., et al. 2014, MNRAS, 440, 2810
- Bradač et al. (2017) Bradač, M., Garcia-Appadoo, D., Huang, K.-H., et al. 2017, The Astrophysical Journal, 836, L2. https://doi.org/10.3847%2F2041-8213%2F836%2F1%2Fl2
- Brammer et al. (2008) Brammer, G. B., van Dokkum, P. G., & Coppi, P. 2008, ApJ, 686, 1503
- Burgasser et al. (2004) Burgasser, A. J., McElwain, M. W., Kirkpatrick, J. D., et al. 2004, AJ, 127, 2856
- Calzetti et al. (2000) Calzetti, D., Armus, L., Bohlin, R. C., et al. 2000, The Astrophysical Journal, 533, 682. https://doi.org/10.1086%2F308692
- Capak et al. (2015) Capak, P. L., Carilli, C., Jones, G., et al. 2015, Nature, 522, 455. https://doi.org/10.1038/nature14500
- Carilli et al. (2013) Carilli, C. L., Riechers, D., Walter, F., et al. 2013, ApJ, 763, 120
- Carniani et al. (2018) Carniani, S., Maiolino, R., Smit, R., & Amorín, R. 2018, The Astrophysical Journal, 854, L7. https://doi.org/10.3847%2F2041-8213%2Faaab45
- Carniani et al. (2020) Carniani, S., Ferrara, A., Maiolino, R., et al. 2020, MNRAS, 499, 5136
- Casey et al. (2014) Casey, C. M., Narayanan, D., & Cooray, A. 2014, Phys. Rep., 541, 45
- Chabrier (2003) Chabrier, G. 2003, Publications of the Astronomical Society of the Pacific, 115, 763. https://doi.org/10.1086%2F376392
- Cormier et al. (2015) Cormier, D., Madden, S. C., Lebouteiller, V., et al. 2015, A&A, 578, A53. https://doi.org/10.1051/0004-6361/201425207
- De Looze et al. (2011) De Looze, I., Baes, M., Bendo, G. J., Cortese, L., & Fritz, J. 2011, MNRAS, 416, 2712
- De Looze et al. (2014) De Looze, I., Cormier, D., Lebouteiller, V., et al. 2014, A&A, 568, A62. https://doi.org/10.1051/0004-6361/201322489
- Díaz-Santos et al. (2013) Díaz-Santos, T., Armus, L., Charmandaris, V., et al. 2013, The Astrophysical Journal, 774, 68. https://doi.org/10.1088/0004-637x/774/1/68
- Díaz-Santos et al. (2017) —. 2017, The Astrophysical Journal, 846, 32. https://doi.org/10.3847/1538-4357/aa81d7
- Endsley et al. (2021) Endsley, R., Stark, D. P., Chevallard, J., & Charlot, S. 2021, MNRAS, 500, 5229
- Erben et al. (2009) Erben, T., Hildebrandt, H., Lerchster, M., et al. 2009, A&A, 493, 1197. https://doi.org/10.1051/0004-6361:200810426
- Faisst et al. (2020) Faisst, A. L., Fudamoto, Y., Oesch, P. A., et al. 2020, Monthly Notices of the Royal Astronomical Society, https://academic.oup.com/mnras/advance-article-pdf/doi/10.1093/mnras/staa2545/33674766/staa2545.pdf, staa2545. https://doi.org/10.1093/mnras/staa2545
- Fazio et al. (2004) Fazio, G. G., Hora, J. L., Allen, L. E., et al. 2004, ApJS, 154, 10
- Ferrara et al. (2019) Ferrara, A., Vallini, L., Pallottini, A., et al. 2019, Monthly Notices of the Royal Astronomical Society, 489, 1. https://doi.org/10.1093/mnras/stz2031
- Finkelstein et al. (2013) Finkelstein, S. L., Papovich, C., Dickinson, M. Song, M., et al. 2013, Nature, 502, 524
- Finkelstein et al. (2015) Finkelstein, S. L., Ryan, R. E., Papovich, C., et al. 2015, The Astrophysical Journal, 810, 71. https://doi.org/10.1088%2F0004-637x%2F810%2F1%2F71
- Fudamoto et al. (2020) Fudamoto, Y., Oesch, P., Faisst, A., et al. 2020, arXiv e-prints, arXiv:2004.10760. https://ui.adsabs.harvard.edu/abs/2020arXiv200410760F
- Fudamoto et al. (2021) Fudamoto, Y., Oesch, P. A., Schouws, S., et al. 2021, Nature, 597, 489
- Förster-Schreiber et al. (2009) Förster-Schreiber, N. M., Genzel, R., Bouché, N., et al. 2009, The Astrophysical Journal, 706, 1364. https://doi.org/10.1088/0004-637x/706/2/1364
- Galametz et al. (2013) Galametz, A., Grazian, A., Fontana, A., et al. 2013, ApJS, 206, 10
- Genzel & Cesarsky (2000) Genzel, R., & Cesarsky, C. J. 2000, Annual Review of Astronomy and Astrophysics, 38, 761. https://doi.org/10.1146/annurev.astro.38.1.761
- Guo et al. (2013) Guo, Y., Ferguson, H. C., Giavalisco, M., et al. 2013, ApJS, 207, 24
- Harikane et al. (2018) Harikane, Y., Ouchi, M., Shibuya, T., et al. 2018, ApJ, 859, 84
- Harikane et al. (2020) Harikane, Y., Ouchi, M., Inoue, A. K., et al. 2020, ApJ, 896, 93
- Harikane et al. (2021) Harikane, Y., Ono, Y., Ouchi, M., et al. 2021, arXiv e-prints, arXiv:2108.01090
- Hashimoto et al. (2019) Hashimoto, T., Inoue, A. K., Mawatari, K., et al. 2019, Publications of the Astronomical Society of Japan, 71, https://academic.oup.com/pasj/article-pdf/71/4/71/29163312/psz049.pdf, 71. https://doi.org/10.1093/pasj/psz049
- Herrera-Camus et al. (2015) Herrera-Camus, R., Bolatto, A. D., Wolfire, M. G., et al. 2015, The Astrophysical Journal, 800, 1. https://doi.org/10.1088/0004-637x/800/1/1
- Hodge & da Cunha (2020) Hodge, J. A., & da Cunha, E. 2020, arXiv e-prints, arXiv:2004.00934. https://arxiv.org/abs/2004.00934
- Ishigaki et al. (2018) Ishigaki, M., Kawamata, R., Ouchi, M., et al. 2018, ApJ, 854, 73
- Jolly et al. (2021) Jolly, J.-B., Knudsen, K., Laporte, N., et al. 2021, A&A, 652, A128. https://doi.org/10.1051/0004-6361/202140878
- Jones et al. (2021) Jones, G. C., Vergani, D., Romano, M., et al. 2021, MNRAS, 507, 3540
- Jones et al. (2021) Jones, G. C., Vergani, D., Romano, M., et al. 2021, Monthly Notices of the Royal Astronomical Society, 507, 3540. https://doi.org/10.1093/mnras/stab2226
- Kapala et al. (2014) Kapala, M. J., Sandstrom, K., Groves, B., et al. 2014, The Astrophysical Journal, 798, 24. https://doi.org/10.1088/0004-637x/798/1/24
- Kirkpatrick et al. (2011) Kirkpatrick, J. D., Cushing, M. C., Gelino, C. R., et al. 2011, ApJS, 197, 19
- Knudsen et al. (2016) Knudsen, K. K., Richard, J., Kneib, J.-P., et al. 2016, MNRAS, 462, L6
- Kohandel et al. (2020) Kohandel, M., Pallottini, A., Ferrara, A., et al. 2020, Monthly Notices of the Royal Astronomical Society, 499, 1250. https://doi.org/10.1093/mnras/staa2792
- Kohandel et al. (2019) —. 2019, Monthly Notices of the Royal Astronomical Society, 487, 3007. https://doi.org/10.1093/mnras/stz1486
- Kotulla et al. (2009) Kotulla, R., Fritze, U., Weilbacher, P., & Anders, P. 2009, MNRAS, 396, 462
- Kron (1980) Kron, R. G. 1980, ApJS, 43, 305
- Labbé et al. (2006) Labbé, I., Bouwens, R., Illingworth, G. D., & Franx, M. 2006, ApJ, 649, L67
- Labbé et al. (2010a) Labbé, I., González, V., Bouwens, R. J., et al. 2010a, ApJ, 708, L26
- Labbé et al. (2010b) —. 2010b, ApJ, 716, L103
- Labbé et al. (2013) Labbé, I., Oesch, P. A., Bouwens, R. J., et al. 2013, ApJ, 777, L19
- Labbé et al. (2015) Labbé, I., Oesch, P. A., Illingworth, G. D., et al. 2015, ApJS, 221, 23
- Lagache et al. (2018) Lagache, G., Cousin, M., & Chatzikos, M. 2018, A&A, 609, A130. https://doi.org/10.1051/0004-6361/201732019
- Laporte et al. (2019) Laporte, N., Katz, H., Ellis, R. S., et al. 2019, Monthly Notices of the Royal Astronomical Society: Letters, 487, L81. https://doi.org/10.1093/mnrasl/slz094
- Le Fèvre et al. (2020) Le Fèvre, O., Béthermin, M., Faisst, A., et al. 2020, A&A, 643, A1
- Maiolino et al. (2015) Maiolino, R., Carniani, S., Fontana, A., et al. 2015, Monthly Notices of the Royal Astronomical Society, 452, 54. https://doi.org/10.1093/mnras/stv1194
- Malhotra et al. (2001) Malhotra, S., Kaufman, M. J., Hollenbach, D., et al. 2001, The Astrophysical Journal, 561, 766. https://doi.org/10.1086/323046
- Martí-Vidal et al. (2014) Martí-Vidal, I., Vlemmings, W. H. T., Muller, S., & Casey, S. 2014, A&A, 563, A136. https://doi.org/10.1051/0004-6361/201322633
- Matthee et al. (2017) Matthee, J., Sobral, D., Boone, F., et al. 2017, The Astrophysical Journal, 851, 145. https://doi.org/10.3847%2F1538-4357%2Faa9931
- Matthee et al. (2019) Matthee, J., Sobral, D., Boogaard, L. A., et al. 2019, The Astrophysical Journal, 881, 124. https://doi.org/10.3847%2F1538-4357%2Fab2f81
- McCracken et al. (2012) McCracken, H. J., Milvang-Jensen, B., Dunlop, J., et al. 2012, A&A, 544, A156. https://doi.org/10.1051/0004-6361/201219507
- McLure et al. (2013) McLure, R. J., Dunlop, J. S., Bowler, R. A. A., et al. 2013, Monthly Notices of the Royal Astronomical Society, 432, 2696. https://doi.org/10.1093/mnras/stt627
- Neeleman et al. (2019) Neeleman, M., Bañados, E., Walter, F., et al. 2019, The Astrophysical Journal, 882, 10. https://doi.org/10.3847/1538-4357/ab2ed3
- Oesch et al. (2015) Oesch, P. A., Bouwens, R. J., Illingworth, G. D., et al. 2015, The Astrophysical Journal, 808, 104. https://doi.org/10.1088%2F0004-637x%2F808%2F1%2F104
- Oke & Gunn (1983) Oke, J. B., & Gunn, J. E. 1983, ApJ, 266, 713. https://ui.adsabs.harvard.edu/abs/1983ApJ...266..713O
- Olsen et al. (2017) Olsen, K., Greve, T. R., Narayanan, D., et al. 2017, The Astrophysical Journal, 846, 105. https://doi.org/10.3847/1538-4357/aa86b4
- Ono et al. (2012) Ono, Y., Ouchi, M., Mobasher, B., et al. 2012, ApJ, 744, 83
- Ota et al. (2014) Ota, K., Walter, F., Ohta, K., et al. 2014, The Astrophysical Journal, 792, 34. https://doi.org/10.1088%2F0004-637x%2F792%2F1%2F34
- Patten et al. (2006) Patten, B. M., Stauffer, J. R., Burrows, A., et al. 2006, ApJ, 651, 502
- Pavesi et al. (2018) Pavesi, R., Sharon, C. E., Riechers, D. A., et al. 2018, ApJ, 864, 49
- Pentericci et al. (2016) Pentericci, L., Carniani, S., Castellano, M., et al. 2016, The Astrophysical Journal, 829, L11. https://doi.org/10.3847%2F2041-8205%2F829%2F1%2Fl11
- Riechers et al. (2014) Riechers, D. A., Carilli, C. L., Capak, P. L., et al. 2014, ApJ, 796, 84
- Roberts-Borsani et al. (2016) Roberts-Borsani, G. W., Bouwens, R. J., Oesch, P. A., et al. 2016, The Astrophysical Journal, 823, 143. https://doi.org/10.3847%2F0004-637x%2F823%2F2%2F143
- Roberts-Borsani et al. (2016) Roberts-Borsani, G. W., Bouwens, R. J., Oesch, P. A., et al. 2016, ApJ, 823, 143
- Robertson (2021) Robertson, B. E. 2021, arXiv e-prints, arXiv:2110.13160
- Rybak et al. (2019) Rybak, M., Rivera, G. C., Hodge, J. A., et al. 2019, The Astrophysical Journal, 876, 112. https://doi.org/10.3847/1538-4357/ab0e0f
- Rybak et al. (2021) Rybak, M., da Cunha, E., Groves, B., et al. 2021, The Astrophysical Journal, 909, 130. https://doi.org/10.3847/1538-4357/abd946
- Sanders et al. (2007) Sanders, D. B., Salvato, M., Aussel, H., et al. 2007, ApJS, 172, 86
- Schaerer & de Barros (2009) Schaerer, D., & de Barros, S. 2009, A&A, 502, 423
- Schaerer et al. (2020) Schaerer, D., Ginolfi, M., Béthermin, M., et al. 2020, A&A, 643, A3
- Schouws et al. (2021) Schouws, S., Stefanon, M., Bouwens, R. J., et al. 2021, arXiv e-prints, arXiv:2105.12133
- Scoville et al. (2007) Scoville, N., Aussel, H., Brusa, M., et al. 2007, The Astrophysical Journal Supplement Series, 172, 1. https://doi.org/10.1086%2F516585
- Skelton et al. (2014) Skelton, R. E., Whitaker, K. E., Momcheva, I. G., et al. 2014, ApJS, 214, 24
- Smit et al. (2015) Smit, R., Bouwens, R. J., Franx, M., et al. 2015, The Astrophysical Journal, 801, 122. https://doi.org/10.1088%2F0004-637x%2F801%2F2%2F122
- Smit et al. (2018) Smit, R., Bouwens, R. J., Carniani, S., et al. 2018, Nature, 553, 178. https://doi.org/10.1038/nature24631
- Smith et al. (2016) Smith, J. D. T., Croxall, K., Draine, B., et al. 2016, The Astrophysical Journal, 834, 5. https://doi.org/10.3847/1538-4357/834/1/5
- Solomon et al. (1992) Solomon, P. M., Downes, D., & Radford, S. J. E. 1992, ApJ, 387, L55
- Stark et al. (2010) Stark, D. P., Ellis, R. S., Chiu, K., Ouchi, M., & Bunker, A. 2010, MNRAS, 408, 1628
- Stark et al. (2017) Stark, D. P., Ellis, R. S., Charlot, S., et al. 2017, MNRAS, 464, 469
- Stefanon et al. (2021) Stefanon, M., Bouwens, R. J., Labbé, I., et al. 2021, arXiv e-prints, arXiv:2103.06279. https://ui.adsabs.harvard.edu/abs/2021arXiv210306279S
- Stefanon et al. (2017) Stefanon, M., Yan, H., Mobasher, B., et al. 2017, ApJS, 229, 32
- Stefanon et al. (2019) Stefanon, M., Labbé, I., Bouwens, R. J., et al. 2019, arXiv e-prints, arXiv:1902.10713
- Szalay et al. (1999) Szalay, A. S., Connolly, A. J., & Szokoly, G. P. 1999, AJ, 117, 68
- Taniguchi et al. (2007) Taniguchi, Y., Scoville, N., Murayama, T., et al. 2007, ApJS, 172, 9
- Tilvi et al. (2013) Tilvi, V., Papovich, C., Tran, K. V. H., et al. 2013, ApJ, 768, 56
- Uzgil et al. (2021) Uzgil, B. D., Oesch, P. A., Walter, F., et al. 2021, The Astrophysical Journal, 912, 67. https://doi.org/10.3847/1538-4357/abe86b
- Vallini et al. (2015) Vallini, L., Gallerani, S., Ferrara, A., Pallottini, A., & Yue, B. 2015, The Astrophysical Journal, 813, 36. https://doi.org/10.1088/0004-637x/813/1/36
- van der Wel et al. (2011) van der Wel, A., Straughn, A. N., Rix, H. W., et al. 2011, ApJ, 742, 111
- Venemans et al. (2020) Venemans, B. P., Walter, F., Neeleman, M., et al. 2020, ApJ, 904, 130
- Wagg et al. (2010) Wagg, J., Carilli, C. L., Wilner, D. J., et al. 2010, A&A, 519, L1
- Walter et al. (2009) Walter, F., Riechers, D., Cox, P., et al. 2009, Nature, 457, 699
- Wang et al. (2013) Wang, R., Wagg, J., Carilli, C. L., et al. 2013, The Astrophysical Journal, 773, 44. https://doi.org/10.1088/0004-637x/773/1/44
- Weaver et al. (2022) Weaver, J. R., Kauffmann, O. B., Ilbert, O., et al. 2022, ApJS, 258, 11
- Willott et al. (2015) Willott, C. J., Carilli, C. L., Wagg, J., & Wang, R. 2015, The Astrophysical Journal, 807, 180. https://doi.org/10.1088%2F0004-637x%2F807%2F2%2F180
- Zitrin et al. (2015) Zitrin, A., Labbé, I., Belli, S., et al. 2015, ApJ, 810, L12