Computational indentation in highly cross-linked polymer networks
Abstract
Indentation is a common experimental technique to study the mechanics of polymeric materials. The main advantage of using indentation is because this provides a direct correlation between the microstructure and the small-scale mechanical response, which is otherwise difficult within the standard tensile testing. Here, majority of studies have investigated hydrogels, microgels, elastomers, and even soft biomaterials. However, a lesser investigated system is the indentation in highly cross-linked polymer (HCP) networks, where the complex network structure plays a key role in dictating their physical properties. In this work, we investigate the structure-property relationship in HCP networks using the computational indentation of a generic model. We establish a correlation between the local bond breaking, the network rearrangement, and the small-scale mechanics. The results are compared with the elastic-plastic deformation model. HCPs harden upon indentation.
I Introduction
Polymers are ubiquitous since the early start of life in the form of natural rubber, starch, and cellulose fang2005development ; hon2017cellulose ; chen2007acetylated ; james1943theory . However, the concept of synthetic polymers is relatively new, which was first proposed in the pioneering work of Hermann Staudinger staudinger1920 . Polymers are of particular interest because the relevant energy scale in these materials is about at the ambient temperature, thus their properties are dictated by the large conformational and compositional fluctuations kroger2004simple ; muller2020process ; DMCMMKK2020 ; singh2020glass . Here, is the Boltzmann constant. Therefore, polymers provide a suitable platform for the flexible design of advanced soft materials. For example, polymers are widely used for the lubrication klein1994reduction ; de2014solvent ; singh2015polymer ; singh2020polymer , the confinement mechanics of biological materials missirlis2014combined ; kim2002afm ; wen2014interplay ; beamish2010effects , the smart materials brighenti2020smart ; stuart2010emerging ; DMCMMKK2020 , thermoelectrics tripathi2020optimization ; shi2017tuning , and in the common daily-use materials kim2015high ; halek1988relationship ; jain2011biodegradable ; maier2001polymers , to name a few.
Traditionally linear polymers are commonly used for various applications kroger2004simple ; muller2020process ; DMCMMKK2020 ; kim2015high , while the more recent interest have been directed towards the cross-linked polymers that range from elastomers (weakly cross-linked) to epoxies (highly cross-linked) stevens2001interfacial ; MukherjiPRE2008 ; lv2021effect . Cross-linked, in particular highly cross-lined polymers (HCP), are important because they are light-weight, high-strength materials that can also have self healing properties NancySotos ; sharifi2014toughened ; gold2017microscopic ; Melissa2019 . Here, one of the important physical properties of HCPs, and polymers in general, is their mechanical response stevens2001interfacial ; MukherjiPRE2008 ; lv2021effect . Therefore, a more in-depth understanding of the mechanics is needed for the advanced applications of polymeric materials with tunable properties.
Experimentally, two most common techniques are the tensile (or shear) deformation NancySotos ; sharifi2014toughened ; rahil2016nanoscale ; persson2018some and the nano-indentation mathis2019indenting ; mathis2018two ; singh2018combined ; muser2019modeling ; akhtar2018oscillatory ; kalcioglu2012macro . The former technique has been extensively employed in the standard experimental setups NancySotos ; sharifi2014toughened ; lv2021effect and also in a variety of computational studies stevens2001interfacial ; MukherjiPRE2008 , which gives the bulk mechanics. However, within the tensile studies, the localized force response due to the small-scale complex structures becomes exceedingly difficult to extract. In this context, mechanical indentation may serve as a better technique, where extensive recent experimental efforts have been performed mathis2018two ; mathis2019indenting ; backes2017combined , while the computational indentation studies in polymers are rather limited boots2022quantifying . Additionally, the indentation experiments are used to measure the hardness of materials and have the basic goal of quantifying materials’ resistance to plastic deformation.
Indentation-based techniques have been extensively employed for the polymeric systems, such as hydrogels, microgels, elastomers singh2018combined ; muser2019modeling ; mathesan2016molecular and also often used to measure the mechanical stiffness is the biological cells nanoindentationEbenstein2006 ; efremov2019anisotropy . Moreover, the similar studies in HCP are limited. Here, using large scale molecular dynamics simulations of a generic model, we have studied the mechanics of HCP networks with different functionalities using computational indentation. To the best of our knowledge, until now the computational works have “only” employed the tensile deformation for polymers harmandaris2000atomistic ; kroger1997polymer ; murashima2021viscosity ; kim2014plastic ; aoyagi2000molecular ; parisi2021macro and the indentation simulations are usually performed on the crystalline nanostructures chen2018nanoindentation . Therefore, the investigation discussed herein is a first attempt that employs the indentation technique for HCPs within a generic mesoscale framework.
We note in passing that for this study we have employed a (chemically independent) generic model. While generic models are extremely useful to make qualitative comparisons with the experiments, they do not provide any quantitative agreement with a chemical specific system. Moreover, for the HCP networks, very little experimental information is known regarding the network microstructures and thus even an all-atom representation of HCP does not guarantee any realistic case known from a native chemical system. Therefore, we have deliberately chosen to use generic model where tuning the system parameters for the desired property is rather trivial.
II Model and method
HCP networks with two different network functionality are chosen for this study. Here, defines the maximum number of bonds that a monomer can form with its neighboring monomers. We have chosen a system of tri-functional (i.e., ) and a tetra-functional (i.e., ) networks. The systems consist of LJ particles randomly distributed within a cubic box at an initial monomer number density . The simulations are performed using the LAMMPS molecular dynamics package plimpton1995fast .
II.1 Interaction potentials
We employ a generic molecular dynamics simulation approach. Here, the non-bonded monomers interact with a 612 Lennard-Jones (LJ) potential if the distance between two monomers is less than a cutoff distance . for , and is chosen such that the potential is continuous at . Here, and are the LJ energy and the LJ length, respectively. This leads to a unit of time , with being the mass of the monomers. The values representative of the hydrocarbons are, meV, nm, and ps. The unit of pressure MPa kremer1990dynamics .
The equations of motion are integrated using the velocity Verlet algorithm with a time step and the temperature is set to that is much higher than the typical glass transition temperatures in these network systems stevens2001interfacial ; MukherjiPRE2008 , thus representing a HCP gel phase. The temperature is imposed using a Langevin thermostat with a damping coefficient of . The initial LJ system is equilibrated for steps.
To model the HCP networks, we have used two different bonded interaction : namely the finitely extensible nonlinear elastic (FENE) kremer1990dynamics and the quartic potential stevens2001interfacial ; TingeRobinsQuartic .
II.2 Network cure
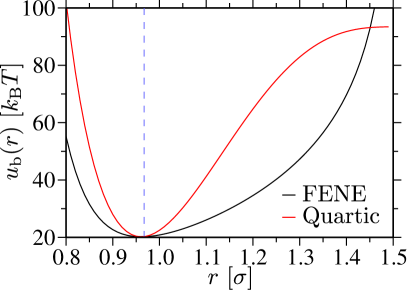
During the network formation FENE is used, where a bond between two monomers is defined by the combination of repulsive 6-12 LJ potential,
| (1) |
and the FENE potential,
| (2) |
Here, and . This gives a typical bond length of kremer1990dynamics , see the black curve in Fig. 1.
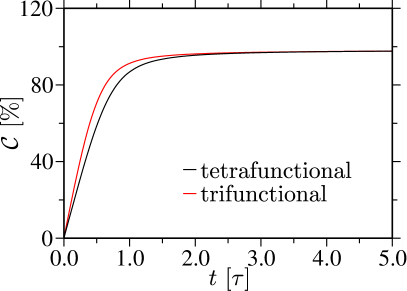
Because the indentation is performed along the direction, the starting configuration (before curing) consists of a homogeneous sample of LJ particles at confined between two repulsive walls along the direction. The periodic boundary conditions are employed in the and the directions. The bonds are allowed to form between the monomers using a protocol proposed in the earlier works of some of us DMPRM21 ; MukherjiPRE2009 . Within this protocol, the bonds are randomly formed between two monomers when: 1) two particles are closer than distance, 2) monomers have not formed the maximum number of possible bonds limited by , and 3) a random number between zero and one is less than the bond forming probability of 0.05. The network curing is performed for during the canonical simulation. Here, is sufficient to attain close to 99% cure, see Fig. 2.
This procedure also ensures a rather homogeneous bond formations within the sample, see the Supplementary Fig. S1 epaps .
After the network curing stage, systems are equilibrated for at the zero pressure. Here, pressure is employed using Nose-Hoover barostat with pressure damping parameter .
II.3 Computational indentation
For the indentation simulations, we have used a quartic potential TingeRobinsQuartic ,
| (3) |
Here, , , , , , and . This potential ensures bond breaking if the distance between two bonded monomers is larger than .
An implicit spherical indenter of radius is used. The force acting on the indenter is obtained by summing the force contributions of the first shell surrounding monomers. Here, the individual force is calculated using the derivative of , where is the force constant and is the distance from the atom to the center of tSuchhe indenter. The indentation is performed at a constant velocity and in the microcanonical ensemble. Two different indenter with and 15.0 are chosen for this work.
We note in passing that we have also conducted simulations at . The results showed no noticeable difference for the tetrafunctional sample, while a significant difference was observed for the trifunctional system (data not shown). Therefore, we have chosen below which the mechanical response remain invariant irrespective of the network functionality. To test the reproducibility of the data, we have performed three sets of simulations for and for both functionalities. The data is shown in the Supplementary Section S6 epaps .
III Results and discussion
III.1 Force response upon indentation
We start by discussing the mechanical response of a tetrafunctional HCP network. Fig. 3 shows the typical force versus indentation behavior for two different .
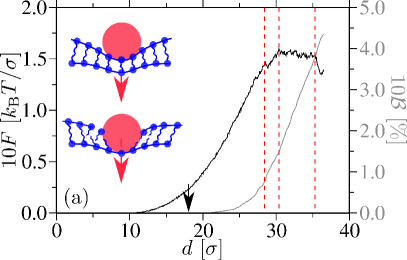
Other than the generic behavior, i.e., the increase in with increasing , one interesting feature can be seen is the sudden force drop at various . Note that we define only when its magnitude is larger than the percentage of error fluctuation calculated in the elastic regime, i.e., below bond breaking indicated by the black arrows in Fig 3. Such force drop is a well known phenomenon in the mechanical response of the glassy materials, where the atomic rearrangements during deformation can lead to such force drops falk1998dynamics . This phenomenon is commonly referred to as the avalanche. In our study, however, we are dealing with a rather rigid cross-linked network that has microscopically different molecular connectivity in comparison to the common glasses.
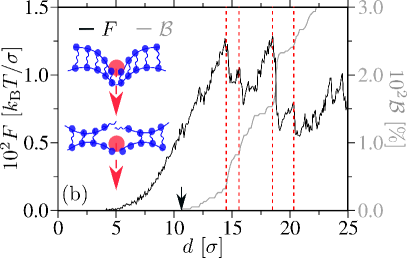
What causes such avalanche-like deformation in HCP? To investigate this issue, we have calculated the percentage of bond breaking as a function of . It can be appreciated that (see the black data sets in Fig. 3) is directly related to the large number of broken bond (see the light grey data sets in Fig. 3). This behavior is quite expected because the strongly interacting bonded monomers can significantly resist the deformation. When the bonds break, they induce large force drops in HCPs. In the insets of Fig. 3 we show the possible pictorial representations of the cases just before and after the bond breaking in these samples. Such avalanches, induced by the bond breaking, were also observed in a combined experimental and simulation study on soft polymer networks boots2022quantifying .
Fig. 3 also reveals that is more prominent for in comparison to . This behavior is not surprising given that the smaller indenter can delicately monitor the bond breaking that occurs at the monomer level, while the larger indenter tip can only monitor a larger group of monomers that on average contribute to and . We also note in passing that the standard tensile deformation can only investigate the bulk mechanical behavior MukherjiPRE2008 , while the indentation simulations can reveal the small-scale microscopic structural details because of the localized deformation, which is also intrinsically related to . Additionally, the relatively larger values for is because this indenter tip has on average a larger number of monomers that are directly in contact with it.
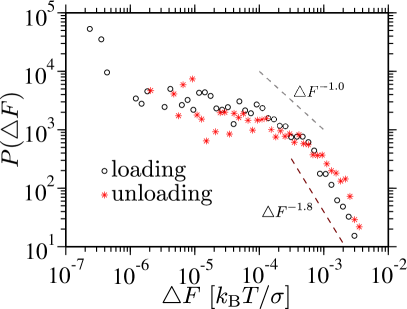
As discussed in the preceding paragraphs, the observed trends in is reminiscent of the mechanics of amorphous materials. It would therefore be interesting to see whether the distribution of follows a scaling law as it is the case for sheared amorphous systems SalernoRobinsaPRE2013 . For this purpose, we have also calculated distribution of for our systems . The corresponding data is shown in Fig. 4. It can be appreciated that the data shows three regimes: a plateau for , for a narrow region , and finally for . For the elastic-plastic deformation of glassy systems, most of the studies have focused on the distribution of avalanches in the stationary regime. In these cases, three-dimensional simulations have reported the exponents within the range of SalernoRobinsaPRE2013 ; ozawa2018random . However, only a few works have dealt with the transient regime and results obtained so far suggest either a similar value of the avalanche exponent as in the stationary regime ozawa2018random or smaller ruscher2021avalanches . In this context, the gel phase of HCP systems investigated here are microscopically different from the traditional mono-atomic glass formers. Therefore, we can only point toward the relatively close value of the avalanche exponent without attempting to state precisely why this description still holds in our case. Moreover, the close resemblance of the mechanical behavior observed between two microscopically distinct systems may direct at a more generic mechanical picture of the jammed systems. We also note in passing that the goal of this work is not to study the scaling laws of , rather to only study any possible close resemblance with the avalanche-like behavior. Therefore, we abstain from going into further details on this aspect.
III.2 Mechanics during loading and unloading
In the typical elastomers, microgels, hydrogels and/or in polymers, the deformation is usually visco-elastic in nature upon small deformations. However, mechanical indentation in HCPs also induces a significant amount of bonds breaking, thus is expected to follow the elastic-plastic deformation. In this context, it has been previously shown that the depth sensing of the materials can be investigated within the loading-unloading setup oliver2004measurement . Furthermore, the hardness, the stiffness and the effective elastic modulus of a sample can be readily calculated. Therefore, in this section we investigate HCPs under cyclic loading.
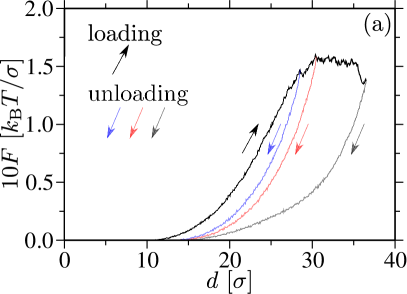
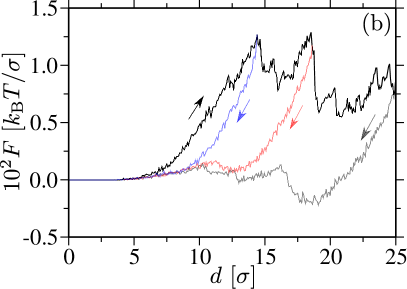
Fig. 5 shows the mechanics of HCPs during the loading and the unloading cycles. The significant hysteresis indicate at a large plastic deformation in the samples, resulting from a large number of the broken bonds. Furthermore, the strong undershooting, i.e., for , in Fig. 5(b) is because an unloading cycle pulls certain number of monomers that induces a negative pressure in the samples. This behavior is in good agreement with a set of recent experiments on hydrogels, where large force drops during the loading cycles and strong hysteresis during the unloading cycles were observed muthukumar2022cone . It should also be highlighted that the most severe for effects of hysteresis is observed for . We will come back to this point at a later stage of this draft.
| - | ||||||
| - | ||||||
| - | ||||||
| 15.0 | 4.1 | 0.006 | 0.0029 | 2.5 | 215.98 | 17.49 |
| - | ||||||
| 9.0 | 0.038 | 0.0087 | 6.5 | 479.88 | 35.20 | |
| - | ||||||
| 15.8 | 0.111 | 0.0194 | 11.5 | 668.37 | 66.50 | |
| - | ||||||
| 18.5 | 0.147 | 0.0226 | 13.6 | 700.70 | 75.66 | |
| - | ||||||
| 20.5 | 0.158 | 0.0234 | 15.4 | 706.36 | 78.03 | |
| - | ||||||
| 26.5 | 0.137 | 0.0204 | 21.5 | 574.13 | 75.45 | |
| - | ||||||
| - | ||||||
| 5.0 | 10.4 | 0.013 | 0.0038 | 7.9 | 52.12 | 46.65 |
| - | ||||||
| 14.6 | 0.013 | 0.0025 | 10.7 | – | – | |
| - | ||||||
| 21.0 | 0.008 | 0.0021 | 18.1 | – | – | |
| - |
Having shown the mechanics during the loading and the unloading cycles, we will now investigate if the relevant system properties can be extracted from the data in Fig. 5. In this context, there is a theory that connects the mechanics under the unloading cycles to the material stiffness via the “so called” effective elastic modulus oliver2004measurement ,
| (4) |
Here, is calculated from the initial displacements during the unloading cycles. The contact area for a spherical indenter can be estimated using and the contact depth between the indenter and the sample is . We note in passing that this theory was initially developed for the Berkovich contact oliver2004measurement . It is widely used in typical micro- and nano-indentation experiments. A more general treatment is discussed in that dealt with different indenter shapes oliver2004measurement .
Using Eq. 4 we have calculated during the unloading at different indentation depths and for both . The data is compiled in Table 1. For , it can be appreciated that increases with increasing , before reaching a plateau at . This length scale is also consistent with the value at which the force plateaus in Fig. 5
The stiffening upon deformation is reminiscent of the strain-hardening behavior in polymeric materials MukherjiPRE2009 ; hoy2007strain . In this context, it has been previously shown that a tetrafunctional HCP can strain-harden under tensile deformation MukherjiPRE2008 . There it was argued that the network curing protocol induces a significant amount of free volume within the cured samples. These free volumes usually collapse to form rather large protovoids centers, where the monomers around the periphery of a protovoids can statistically form bonds pointing away from each other. During the tensile deformation, these protovoids open up by disrupting the van der Waals (vdW) contacts and thus may be a possible cause for the strain hardening. In contrast to the tensile testing, indentation compresses a sample. Such compression induced hardening results from two effects: (1) The small-scale tension buildup when the certain number of bonds are pulled taut, while some other are compressed. (2) The two boundaries of a protovoid interacting via vdW forces can plastically slide past each other. These two combined effects lead to the major contributions to the increased , that we name indentation hardening.
Table 4 also shows that for and , is not defined. This is particularly because Eq. 4 only holds for the small relative indentations, i.e., when .
The theoretical treatment described above does not account for the dynamics, such as the systems exhibiting visco-elastic deformation. Here, one may expect the force relaxation to be significantly faster than the structural relaxation. On the contrary, a HCP network is microscopically different, where the system shows a elastic-plastic deformation via bond breaking during the indentation, see Fig. 5. Furthermore, we find that the relaxation of is significantly slower than the structural relaxation, see the Supplementary Fig. S3 epaps . We also wish to highlight that the HCP networks investigated here are in their gel phase where the high frequency elastic contacts due to the chain connectivity in the network architectures play the crucial role in restoring the network structures. The mode of this temporal relaxation is shown in a supplementary simulation movie.
III.3 Effect of network functionality
The network functionality is also expected to significantly impact the force response. For this purpose, here we show the system with where the most prominent force drops are observed, see Fig. 3(b), while the data for is presented in the Supplementary Fig. S4.
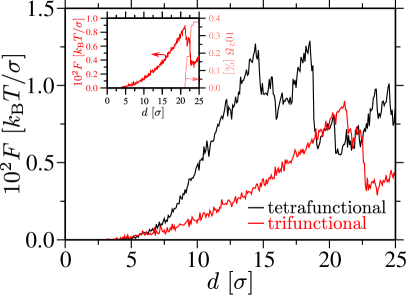
Fig. 6 shows the effect of on the mechanical response. It can be appreciated that the trifunctional system can withstand almost twice larger indentation depth before the bond breaking happens in a sample. For example, bond breaking starts at for a tetrafunctional sample (see Fig. 3a), while it is about for a trifunctional system (see the inset in Fig. 6). This is particularly because the lower bond density of a trifunctional sample, in comparison to a tetrafunctional sample, can withstand a larger elastic deformation. Furthermore, a trifunctional system is twice as ductile as a tetrafunctional sample, while the maximum force these samples can withstand also reduces by about a factor of two for the former (see the main panel in Fig. 6). These results are reasonably consistent with the HCPs under the tensile deformations MukherjiPRE2009 .
III.4 Effect of network curing percentage
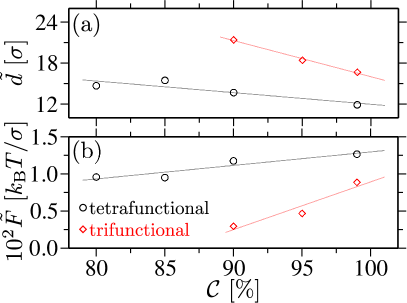
One of the most important features of the HCP networks is that their mechanics can be tuned almost at will by tuning the amount of cure in the sample. Therefore, in this section we aim to investigate the effect of curing on the mechanics of the samples. For this purpose, we have calculated the force-indentation behavior for different percentage of cure , see the Supplementary Fig. S5. From these data sets, we extract the force at the first maximum drop and the corresponding indentation depth . Fig. 7 shows the variation of and with the change in . The data clearly indicate a reasonable linear variation that can serve as a guiding tool for the possible synthesis of epoxies with tunable mechanical response.
IV Conclusion and Discussion
Using large scale molecular dynamics simulations of a (mesoscopic) generic model, we investigate the mechanical response of a set of highly cross-linked polymer (HCP) networks. For this purpose, we have used the mechanical indentation of different indenter sizes. The use of such method has many advantages over the routinely used tensile deformations. For example, the deformations at the monomer level can be monitored because the individual bond breaking and network (re-)arrangements are directly accessible. Contrary to the visco-elastic deformations in the standard polymers, the deformations in the HCPs are of elastic-plastic nature. An analysis based on a simple theory of elastic-plastic deformation oliver2004measurement , suggests that the HCP networks harden upon indentation. This is because the bonds that are pulled or compressed taut and the disruption of the protovoids (collapsed free volume area) that originate within the sample during the network cure DMPRM21 .
The results also indicate at a very intriguing force-drop like mechanical response, reminiscent of the avalanche in the glassy materials. Such behavior in HCPs are related to the instantaneous bond breaking, small-scale monomeric rearrangements, and localized force response within the samples. We further show that the distribution of follows a scaling law decay with an exponent close to the theoretical predictions for the avalanches in the standard glasses.
The results presented in this work is based on a generic molecular dynamics approach that combines a broad range of chemical systems within one physical framework. While such models are extremely useful in studying the trends observed in the chemical specific systems, they do not provide any quantitative agreement with the experiments. Also note that there are generic models that are specifically tuned to reproduce certain quantities and their respective behavior DM20macromolwithRobin . Therefore, it is important to discuss the possible chemical systems that represent the HCP networks discussed here. In this context, in a generic model, one bead corresponds to a certain number of atomistic monomers kremer1990dynamics ; stevens2001interfacial , while the degree of such coarse-graining is controlled by the bond and bending stiffnesses.
The experimental synthesis of HCPs, such as the epoxies, are performed with different underlying chemistry. For example, the most commonly used systems include, but are not limited to: the amine-cured epoxies sharifi2014toughened and the phenylenediamines-based cross-linking of a network structure lv2020effect . These systems are rather rigid network materials that exhibit extraordinary mechanical sharifi2014toughened ; MukherjiPRE2008 and thermal properties DMPRM21 ; lv2021effect . Furthermore, more complex structures are also synthesized that use the alkane chains for cross-linking lv2021effect . The longer the length of the alkanes, the softer the network at a given temperature lv2021effect . In this context, the quartic potential parameters used in this work closely mimics the amine-based epoxies, while the FENE bonds mimic the relatively softer bonded interactions induced by the alkane-based linkers. A more detailed discussion on the atomistic to generic mapping schemes is presented in Ref. DMPRM21 .
It is also important to discuss that the mechanical testing on weakly cross-linked systems, such as the
PAM-based hydrogels muser2019modeling , surface-grafted gels singh2018combined , and PNIPAM-based microgels backes2017combined
often lead to unexpected behavior. One of the interesting aspects of these systems is that they exhibit
depth dependent force response, i.e., the stiffness of the samples change with the depth.
This is practically because of the synthesis protocols that unavoidably introduce a greater degree
of bond density at the core and decreases radially outward from the centers.
In this context, while our trifunctional system may mimic such weakly cross-linked networks, the bond density in our systems are rather homogeneous across the sample, see the Supplementary Fig. S1 epaps . Therefore, a more careful modelling will require an additional control parameter of the non-homogeneous
bond density within the samples that can serve as a guiding tool for the materials design. A detailed discussion on this aspect will be presented elsewhere.
Note added during the revision: After submission of our work on 7th February 2022, two important related experimental works were published that we cite in this revised draft boots2022quantifying ; muthukumar2022cone .
V Acknowledgement
D.M. thanks Martin Müser for useful discussions. This research was undertaken thanks, in part, to the Canada First Research Excellence Fund (CFREF), Quantum Materials and Future Technologies Program. MKS thanks Science and Engineering Research Board (SERB), India for financial support provided under the Start-up Research Grant (SRG) scheme (grant number: SRG/2020/000938).
References
- (1) J. Fang, P. Fowler, C. Escrig, R. Gonzalez, J. Costa, and L. Chamudis, “Development of biodegradable laminate films derived from naturally occurring carbohydrate polymers,” Carbohydrate polymers, vol. 60, no. 1, pp. 39–42, 2005.
- (2) D. N.-S. Hon, “Cellulose and its derivatives: structures, reactions, and medical uses,” in Polysaccharides in medicinal applications, pp. 87–105, Routledge, 2017.
- (3) L. Chen, X. Li, L. Li, and S. Guo, “Acetylated starch-based biodegradable materials with potential biomedical applications as drug delivery systems,” Current Applied Physics, vol. 7, pp. e90–e93, 2007.
- (4) H. M. James and E. Guth, “Theory of the elastic properties of rubber,” The Journal of Chemical Physics, vol. 11, no. 10, pp. 455–481, 1943.
- (5) S. H, “Uber polymerisation,” European Journal of Inorganic Chemistry, vol. 53, no. 6, pp. 1073–1085, 1920.
- (6) M. Kröger, “Simple models for complex nonequilibrium fluids,” Physics reports, vol. 390, no. 6, pp. 453–551, 2004.
- (7) M. Müller, “Process-directed self-assembly of copolymers: Results of and challenges for simulation studies,” Progress in Polymer Science, vol. 101, p. 101198, 2020.
- (8) D. Mukherji, C. M. Marques, and K. Kremer, “Smart responsive polymers: Fundamentals and design principles,” Annual Review of Condensed Matter Physics, vol. 11, no. 1, pp. 271–299, 2020.
- (9) M. K. Singh, M. Hu, Y. Cang, H.-P. Hsu, H. Therien-Aubin, K. Koynov, G. Fytas, K. Landfester, and K. Kremer, “Glass transition of disentangled and entangled polymer melts: Single-chain-nanoparticles approach,” Macromolecules, vol. 53, no. 17, pp. 7312–7321, 2020.
- (10) J. Klein, E. Kumacheva, D. Mahalu, D. Perahia, and L. J. Fetters, “Reduction of frictional forces between solid surfaces bearing polymer brushes,” Nature, vol. 370, no. 6491, pp. 634–636, 1994.
- (11) S. De Beer, E. Kutnyanszky, P. M. Schön, G. J. Vancso, and M. H. Müser, “Solvent-induced immiscibility of polymer brushes eliminates dissipation channels,” Nature communications, vol. 5, no. 1, pp. 1–6, 2014.
- (12) M. K. Singh, P. Ilg, R. M. Espinosa-Marzal, M. Kröger, and N. D. Spencer, “Polymer brushes under shear: Molecular dynamics simulations compared to experiments,” Langmuir, vol. 31, no. 16, pp. 4798–4805, 2015.
- (13) M. K. Singh, “Polymer brush based tribology,” in Tribology in Materials and Applications, pp. 15–32, Springer, 2020.
- (14) D. Missirlis and J. P. Spatz, “Combined effects of peg hydrogel elasticity and cell-adhesive coating on fibroblast adhesion and persistent migration,” Biomacromolecules, vol. 15, no. 1, pp. 195–205, 2014.
- (15) S. H. Kim, A. Opdahl, C. Marmo, and G. A. Somorjai, “Afm and sfg studies of phema-based hydrogel contact lens surfaces in saline solution: adhesion, friction, and the presence of non-crosslinked polymer chains at the surface,” Biomaterials, vol. 23, no. 7, pp. 1657–1666, 2002.
- (16) J. H. Wen, L. G. Vincent, A. Fuhrmann, Y. S. Choi, K. C. Hribar, H. Taylor-Weiner, S. Chen, and A. J. Engler, “Interplay of matrix stiffness and protein tethering in stem cell differentiation,” Nature materials, vol. 13, no. 10, pp. 979–987, 2014.
- (17) J. A. Beamish, J. Zhu, K. Kottke-Marchant, and R. E. Marchant, “The effects of monoacrylated poly (ethylene glycol) on the properties of poly (ethylene glycol) diacrylate hydrogels used for tissue engineering,” Journal of Biomedical Materials Research Part A, vol. 92, no. 2, pp. 441–450, 2010.
- (18) R. Brighenti, Y. Li, and F. J. Vernerey, “Smart polymers for advanced applications: a mechanical perspective review,” Frontiers in Materials, vol. 7, p. 196, 2020.
- (19) M. A. C. Stuart, W. T. Huck, J. Genzer, M. Müller, C. Ober, M. Stamm, G. B. Sukhorukov, I. Szleifer, V. V. Tsukruk, M. Urban, et al., “Emerging applications of stimuli-responsive polymer materials,” Nature materials, vol. 9, no. 2, pp. 101–113, 2010.
- (20) A. Tripathi, Y. Ko, M. Kim, Y. Lee, S. Lee, J. Park, Y.-W. Kwon, J. Kwak, and H. Y. Woo, “Optimization of thermoelectric properties of polymers by incorporating oligoethylene glycol side chains and sequential solution doping with preannealing treatment,” Macromolecules, vol. 53, no. 16, pp. 7063–7072, 2020.
- (21) W. Shi, Z. Shuai, and D. Wang, “Tuning thermal transport in chain-oriented conducting polymers for enhanced thermoelectric efficiency: a computational study,” Advanced Functional Materials, vol. 27, no. 40, p. 1702847, 2017.
- (22) G.-H. Kim, D. Lee, A. Shanker, L. Shao, M. S. Kwon, D. Gidley, J. Kim, and K. P. Pipe, “High thermal conductivity in amorphous polymer blends by engineered interchain interactions,” Nature materials, vol. 14, no. 3, pp. 295–300, 2015.
- (23) G. W. Halek, “Relationship between polymer structure and performance in food packaging applications,” 1988.
- (24) J. Jain, W. Y. Ayen, A. J. Domb, and N. Kumar, “Biodegradable polymers in drug delivery,” Biodegradable polymers in clinical use and clinical development, pp. 3–58, 2011.
- (25) G. Maier, “Polymers for microelectronics,” Materials today, vol. 4, no. 5, pp. 22–33, 2001.
- (26) M. J. Stevens, “Interfacial fracture between highly cross-linked polymer networks and a solid surface: effect of interfacial bond density,” Macromolecules, vol. 34, no. 8, pp. 2710–2718, 2001.
- (27) D. Mukherji and C. F. Abrams, “Microvoid formation and strain hardening in highly cross-linked polymer networks,” Physical Review E, vol. 78, no. 5, p. 050801, 2008.
- (28) G. Lv, B. Soman, N. Shan, C. M. Evans, and D. G. Cahill, “Effect of linker length and temperature on the thermal conductivity of ethylene dynamic networks,” ACS Macro Letters, vol. 10, no. 9, pp. 1088–1093, 2021.
- (29) S. R. White, N. R. Sottos, P. H. Geubelle, J. S. Moore, M. R. Kessler, S. Sriram, E. N. Brown, and S. Viswanathan, “Autonomic healing of polymer composites,” Nature, vol. 409, no. 6822, pp. 794–797, 2001.
- (30) M. Sharifi, C. Jang, C. Abrams, and G. Palmese, “Toughened epoxy polymers via rearrangement of network topology,” Journal of Materials Chemistry A, vol. 2, no. 38, pp. 16071–16082, 2014.
- (31) B. Gold, C. Hövelmann, N. Lühmann, W. Pyckhout-Hintzen, A. Wischnewski, and D. Richter, “The microscopic origin of the rheology in supramolecular entangled polymer networks,” Journal of Rheology, vol. 61, no. 6, pp. 1211–1226, 2017.
- (32) M. Hess, E. Roeben, A. Habicht, S. Seiffert, and A. M. Schmidt, “Local dynamics in supramolecular polymer networks probed by magnetic particle nanorheology,” Soft Matter, vol. 15, no. 5, pp. 842–850, 2019.
- (33) Z. Rahil, S. Pedron, X. Wang, T. Ha, B. Harley, and D. Leckband, “Nanoscale mechanics guides cellular decision making,” Integrative Biology, vol. 8, no. 9, pp. 929–935, 2016.
- (34) B. Persson and M. Scaraggi, “Some comments on hydrogel and cartilage contact mechanics and friction,” Tribology letters, vol. 66, no. 1, p. 23, 2018.
- (35) C. H. Mathis, C. Kang, S. N. Ramakrishna, L. Isa, N. D. Spencer, et al., “Indenting polymer brushes of varying grafting density in a viscous fluid: A gradient approach to understanding fluid confinement,” Polymer, vol. 169, pp. 115–123, 2019.
- (36) C. H. Mathis, N. D. Spencer, et al., “A two-step method for rate-dependent nano-indentation of hydrogels,” Polymer, vol. 137, pp. 276–282, 2018.
- (37) M. K. Singh, C. Kang, P. Ilg, R. Crockett, M. Kröger, and N. D. Spencer, “Combined experimental and simulation studies of cross-linked polymer brushes under shear,” Macromolecules, vol. 51, no. 24, pp. 10174–10183, 2018.
- (38) M. H. Müser, H. Li, and R. Bennewitz, “Modeling the contact mechanics of hydrogels,” Lubricants, vol. 7, no. 4, p. 35, 2019.
- (39) R. Akhtar, E. R. Draper, D. J. Adams, and J. Hay, “Oscillatory nanoindentation of highly compliant hydrogels: A critical comparative analysis with rheometry,” Journal of Materials Research, vol. 33, no. 8, pp. 873–883, 2018.
- (40) Z. I. Kalcioglu, R. Mahmoodian, Y. Hu, Z. Suo, and K. J. Van Vliet, “From macro-to microscale poroelastic characterization of polymeric hydrogels via indentation,” Soft Matter, vol. 8, no. 12, pp. 3393–3398, 2012.
- (41) S. Backes, P. Krause, W. Tabaka, M. U. Witt, and R. von Klitzing, “Combined cononsolvency and temperature effects on adsorbed pnipam microgels,” Langmuir, vol. 33, no. 50, pp. 14269–14277, 2017.
- (42) J. Boots, D. te Brake, J. M. Clough, J. Tauber, J. Ruiz-Franco, T. Kodger, and J. van der Gucht, “Quantifying bond rupture during indentation fracture of soft polymer networks using molecular mechanophores,” Physical Review Materials, vol. 6, no. 2, p. 025605, 2022.
- (43) S. Mathesan, A. Rath, and P. Ghosh, “Molecular mechanisms in deformation of cross-linked hydrogel nanocomposite,” Materials Science and Engineering: C, vol. 59, pp. 157–167, 2016.
- (44) D. M. Ebenstein and L. A. Pruitt, “Nanoindentation of biological materials,” Nano today, vol. 1, no. 3, pp. 26–33, 2006.
- (45) Y. M. Efremov, M. Velay-Lizancos, C. J. Weaver, A. I. Athamneh, P. D. Zavattieri, D. M. Suter, and A. Raman, “Anisotropy vs isotropy in living cell indentation with afm,” Scientific reports, vol. 9, no. 1, pp. 1–12, 2019.
- (46) V. A. Harmandaris, V. G. Mavrantzas, and D. N. Theodorou, “Atomistic molecular dynamics simulation of stress relaxation upon cessation of steady-state uniaxial elongational flow,” Macromolecules, vol. 33, no. 21, pp. 8062–8076, 2000.
- (47) M. Kröger, C. Luap, and R. Muller, “Polymer melts under uniaxial elongational flow: stress- optical behavior from experiments and nonequilibrium molecular dynamics computer simulations,” Macromolecules, vol. 30, no. 3, pp. 526–539, 1997.
- (48) T. Murashima, K. Hagita, and T. Kawakatsu, “Viscosity overshoot in biaxial elongational flow: Coarse-grained molecular dynamics simulation of ring–linear polymer mixtures,” Macromolecules, vol. 54, no. 15, pp. 7210–7225, 2021.
- (49) J. M. Kim, R. Locker, and G. C. Rutledge, “Plastic deformation of semicrystalline polyethylene under extension, compression, and shear using molecular dynamics simulation,” Macromolecules, vol. 47, no. 7, pp. 2515–2528, 2014.
- (50) T. Aoyagi and M. Doi, “Molecular dynamics simulation of entangled polymers in shear flow,” Computational and Theoretical Polymer Science, vol. 10, no. 3-4, pp. 317–321, 2000.
- (51) D. Parisi, S. Costanzo, Y. Jeong, J. Ahn, T. Chang, D. Vlassopoulos, J. D. Halverson, K. Kremer, T. Ge, M. Rubinstein, G. S. Grest, W. Srinin, and A. Y. Grosberg, “Nonlinear shear rheology of entangled polymer rings,” Macromolecules, vol. 54, no. 6, pp. 2811–2827, 2021.
- (52) J. Chen, J. Shi, Y. Wang, J. Sun, J. Han, K. Sun, and L. Fang, “Nanoindentation and deformation behaviors of silicon covered with amorphous sio 2: a molecular dynamic study,” RSC advances, vol. 8, no. 23, pp. 12597–12607, 2018.
- (53) S. Plimpton, “Fast parallel algorithms for short-range molecular dynamics,” Journal of computational physics, vol. 117, no. 1, pp. 1–19, 1995.
- (54) K. Kremer and G. S. Grest, “Dynamics of entangled linear polymer melts: A molecular-dynamics simulation,” The Journal of Chemical Physics, vol. 92, no. 8, pp. 5057–5086, 1990.
- (55) T. Ge, F. Pierce, D. Perahia, G. S. Grest, and M. O. Robbins, “Molecular dynamics simulations of polymer welding: Strength from interfacial entanglements,” Physical review letters, vol. 110, no. 9, p. 098301, 2013.
- (56) D. Mukherji and M. K. Singh, “Tuning thermal transport in highly cross-linked polymers by bond-induced void engineering,” Phys. Rev. Materials, vol. 5, p. 025602, Feb 2021.
- (57) D. Mukherji and C. F. Abrams, “Mechanical behavior of highly cross-linked polymer networks and its links to microscopic structure,” Physical Review E, vol. 79, no. 6, p. 061802, 2009.
- (58) “Electronic supplementary material. number to be filled by editor.,”
- (59) M. L. Falk and J. S. Langer, “Dynamics of viscoplastic deformation in amorphous solids,” Physical Review E, vol. 57, no. 6, p. 7192, 1998.
- (60) K. M. Salerno and M. O. Robbins, “Effect of inertia on sheared disordered solids: Critical scaling of avalanches in two and three dimensions,” Phys. Rev. E, vol. 88, p. 062206, Dec 2013.
- (61) M. Ozawa, L. Berthier, G. Biroli, A. Rosso, and G. Tarjus, “Random critical point separates brittle and ductile yielding transitions in amorphous materials,” Proceedings of the National Academy of Sciences, vol. 115, no. 26, pp. 6656–6661, 2018.
- (62) C. Ruscher and J. Rottler, “Avalanches in the athermal quasistatic limit of sheared amorphous solids: an atomistic perspective,” Tribology Letters, vol. 69, no. 2, pp. 1–9, 2021.
- (63) W. C. Oliver and G. M. Pharr, “Measurement of hardness and elastic modulus by instrumented indentation: Advances in understanding and refinements to methodology,” Journal of materials research, vol. 19, no. 1, pp. 3–20, 2004.
- (64) M. Muthukumar, M. Bobji, and K. Simha, “Cone cracks in tissue-mimicking hydrogels during hypodermic needle insertion: the role of water content,” Soft Matter, 2022.
- (65) R. S. Hoy and M. O. Robbins, “Strain hardening in polymer glasses: limitations of network models,” Physical review letters, vol. 99, no. 11, p. 117801, 2007.
- (66) Y. Zhao, M. K. Singh, K. Kremer, R. Cortes-Huerto, and D. Mukherji, “Why do elastin-like polypeptides possibly have different solvation behaviors in water–ethanol and water–urea mixtures?,” Macromolecules, vol. 53, no. 6, pp. 2101–2110, 2020.
- (67) G. Lv, E. Jensen, C. Shen, K. Yang, C. M. Evans, and D. G. Cahill, “Effect of amine hardener molecular structure on the thermal conductivity of epoxy resins,” ACS Applied Polymer Materials, vol. 3, no. 1, pp. 259–267, 2020.