What are the best systems? New perspectives on NLP Benchmarking
Abstract
In Machine Learning, a benchmark refers to an ensemble of datasets associated with one or multiple metrics together with a way to aggregate different systems performances. They are instrumental in (i) assessing the progress of new methods along different axes and (ii) selecting the best systems for practical use. This is particularly the case for NLP with the development of large pre-trained models (e.g. GPT, BERT) that are expected to generalize well on a variety of tasks. While the community mainly focused on developing new datasets and metrics, there has been little interest in the aggregation procedure, which is often reduced to a simple average over various performance measures. However, this procedure can be problematic when the metrics are on a different scale, which may lead to spurious conclusions. This paper proposes a new procedure to rank systems based on their performance across different tasks. Motivated by the social choice theory, the final system ordering is obtained through aggregating the rankings induced by each task and is theoretically grounded. We conduct extensive numerical experiments (on over 270k scores) to assess the soundness of our approach both on synthetic and real scores (e.g. GLUE, EXTREM, SEVAL, TAC, FLICKR). In particular, we show that our method yields different conclusions on state-of-the-art systems than the mean-aggregation procedure while being both more reliable and robust.
1 Introduction
This paper is about improving current practices regarding benchmarks of NLP systems. As pointed out by [83], benchmarks are made of datasets, metrics, and a way to aggregate performance. Our point is that, if the bulk of the NLP community efforts on this domain is about collecting new datasets and introducing new metrics, little work is concerned with the third part, namely how to aggregate various performances.
Why are benchmarks vital? Research advances in Machine Learning (ML) are crucially fueled by reliable evaluation procedures [78, 34]. The latter are indeed mandatory to fairly compare new methods and systems. Usually, one relies on a well-chosen metric that reflects the ability to perform on a task – e.g. accuracy for classification, mean-squared error for regression.
The multi-tasks evaluation setting. If single-tasks problems are quite common, to best understand weakness and model in real-world scenario, the community is heading towards more complex evaluations involving fine-grained evaluation [61] across several metrics (or criteria [46, 103]) and several tasks [91, 108, 47, 63, 36, 89]. This is due to the increasing performance of deep neural networks, which are nowadays designed to generalize in a great variety of situations and to solve complex tasks [86]. One is typically seeking for models with good transfer learning properties, meaning an ability to generalize well under distribution shift and/or task shift [51].
How to aggregate performances? The multi-tasks setting has been investigated in recent works that provide benchmark of state-of-the-art models across a great variety of tasks [80, 62, 28, 108, 90], sometimes with more than fifty [85, 2, 94, 84]. These papers provide tables of scores across the considered tasks, but the only non-qualitative way to compare systems consists in averaging the performances across tasks and then ranking systems according to their mean score values. This is, for instance, done with the GLUE benchmark [91] and its derivatives [92]. However, taking the mean is seriously flawed since the different metrics are usually not on the same scales and can even be unbounded [102, 23]. Even a pre-processing renormalization scheme would fail to capture the intrinsic difficulty of the tasks.
Contribution 1. Our first contribution is to provide a reliable tool to rank systems in a multi-tasks setting. We rely on a ranking aggregation procedure which, from a set of rankings induced by each criterion, returns a single ranking that somehow aggregates the former. This procedure, called the Kemeny consensus [52], can be seen as a voting rule and stems from the social choice theory [66].
Aggregation when instance-level information is available. As illustrated by Zhong et al. [109], Ruder [83], a fine-grained understanding of the model performance should include instance-level scores. If taking the mean is quite natural in the classification setting, this is not always the case, as recently pointed out by [73] in the NLG setting. In this article, the authors investigate pairwise comparison of NLG systems for a single metric (e.g. BLEU [71], ROUGE [59], METEOR [5, 35, 49], CHRF [76, 77], BertScore [105]). They prove that a comparison based on the mean or the median of the scores across test utterances can be highly flawed. They rather advise to rely on the Bradley-Terry [10] pairwise comparison method, which consists, for two systems A and B, in computing the proportion of utterances on which A achieves a better score than B. Their work is a significant advance but remains limited to pairwise comparisons.
Contribution 2. Our second contribution consists in going one step further than [73] by applying our ranking procedure to an arbitrarily large set of NLG systems with respect to a group of fixed criterion. Our evaluation methodology can be seen as a natural extension of [73] since it coincides with the latter in the particular case of pairwise comparison. In a more realistic multi-criteria scenario, we combine our two contributions and develop a two-stages ranking aggregation procedure which first aggregates along utterances and then along criteria.
Experiments. Our two contributions rely on our aggregation procedure which is proved to be effective through several experiments.
-
1.
We explain on a simple synthetic example the superiority of our approach compared to the mean-aggregation procedure and the pairwise-aggregation procedure, both in terms of consistency and robustness.
-
2.
We use our ranking procedure on 10 multi-tasks / multi-criteria benchmarks and observe it leads to different conclusions than mean- and pairwise-aggregation procedures.
-
3.
We argue our procedure is more robust by investigating its stability with respect to the addition of criteria and with respect to the addition of systems.
Our code and the collected data will be released to accelerate the adoption of what we think is a reliable evaluation method for multi-tasks and multi-criteria benchmarks.
2 Problem Formulation and limitations of existing methods
2.1 General Considerations
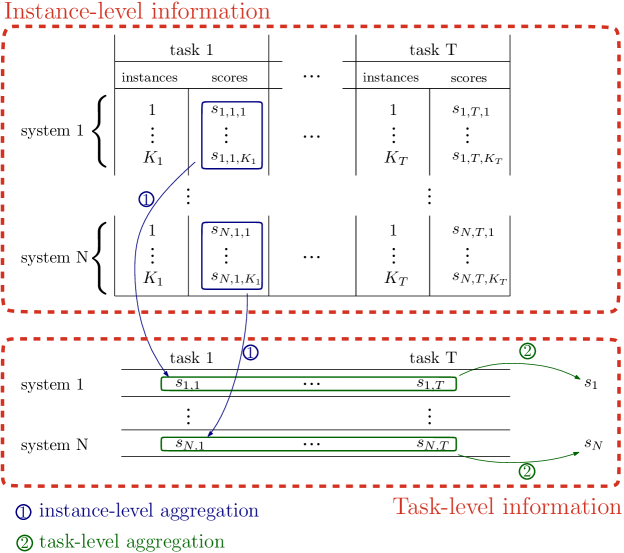
When comparing systems performances, two settings can be distinguished depending on the information granularity at our disposal and on the way one wishes to use this information. In general, each system is scored on each instance of a test set with respect to a given metric. The final (single) score of the system with respect to this metric is obtained through an aggregation procedure we will call instance-level aggregation, and which has to be chosen by the practitioner (usually, the mean of the instances-scores). Then, the final benchmark score of the system is obtained through an aggregation we call task-level aggregation of the scores of this system for each metric of the considered benchmark. See Fig. 1 for an illustration.
Notations. Suppose we are given systems evaluated on tasks, each task being associated with a metric and a test set made of instances. For every , and , we denote by the score of system on the instance of task .
Instance-level aggregation. The performance of system on task is an aggregation of its scores on each instances. This aggregation is chosen by the practitioner and is usually the mean-aggregation defined by .
Task-level aggregation. Sometimes, one only has access to the aggregated scores of each system on each task, that is, for every and , to a score which corresponds to an instance-level aggregation for system on the instances of task . From these quantities, one can then compute, for each system, a synthetic score reflecting the overall performance of this system across every considered task. Again, the usually-taken synthetic score of system is the mean-aggregation: .
2.2 Problem Formulation
Ranking objective. When benchmarking systems, the goal is to output a ranking of each systems according to some objective criterion. Formally, we need to introduce the symmetric group on elements, denoted by , which elements are the permutations of . Equipped with this notation, our goal is to output a permutation
corresponding to the rankings of the systems. For instance, one reads “system is the -th best system". Depending on the granularity of the information at our disposal, we distinguish two problems.
Ranking Systems from Task Level Information.
Given a set of scores of systems on tasks, find a proper aggregation procedure.
Ranking Systems from Instance Level Information.
Given a set of scores of systems on the different instances of tasks, find a proper aggregation procedure.
2.3 Limitation of Existing Methods
Mean-aggregation procedure. The mean-aggregation procedure consists in taking the permutation that would rank the aggregated means , . This procedure suffers from several flaws. First, it is not well-suited when the metrics associated with the considered tasks are not on the same scale. Consider, for instance, the situation where one of the tasks (say task ) is associated with a metric that is at a significantly larger scale than the others. In that case, the ranking obtained through mean-aggregation would probably correspond to the ranking induced by task . One could argue that a remedy would first normalize each metric so that everything is on the same scale. However, the resulting aggregation would still fail to capture each task’s intrinsic difficulty. Worse, this procedure is impractical in cases where some metrics are unbounded – for instance, this is the case of the BARTScore [102]. Finally, another weakness of the mean-aggregation ranking procedure is that the score of a system is computed irrespective of its relative performance with respect to the others. This simple observation has been pointed out by [73] who advises, in the special case of two systems and one metric, to compute the number of times a system is better than the other on the instances.
Pairwise ranking.To be a bit more formal, the pairwise ranking aggregation proposed by [73] to rank two systems and , which scores on a given task are given by and , consists in computing
Then, is better than if and only if . As explained by the authors, this method is more relevant than the mean-aggregation in the context of NLG evaluation. However, it is limited to the evaluation of two systems and does not apply for a general number of systems. A solution would be to give a rank for each pair of systems and then aggregate these pairwise rankings. However, this would lead to a prohibitive computational factor for the complexity. Moreover, the conclusion of these pairwise rankings can be paradoxical. Tab. 1 below provides a toy example where three systems , , and are evaluated on 6 tasks, and where the pairwise comparisons give the paradoxical conclusion , and .
| Task1 | Task2 | Task3 | Task4 | Task5 | Task6 | SUM | |
| A | 0.3 | 5 | 10 | 0.02 | 1.0 | 0.4 | 16.72 |
| B | 0.1 | 4 | 13 | 0.01 | 2.2 | 0.3 | 19.61 |
| C | 0.0 | 3 | 15 | 0.03 | 2.0 | 0.2 | 20.23 |
3 Ranking via Kemeny consensus
We now turn to the description of our methodology to rank an arbitrary number of systems on multi-tasks / multi-criteria benchmarks.
3.1 Kemeny Consensus
Let us consider the problem of ranking systems on tasks based on the information of the scores of each system on each task . We believe a robust approach to this problem consist in relying on the relative performance between systems on each task. More precisely, for each task , we consider
where corresponds to the rank of system on task , in decreasing order. Then, we would like to find an appropriate procedure that aggregates the rankings . More formally, we would like to define a function
This function, from a set of permutations corresponding to rankings, should return a final permutation that summarizes them. One difficulty is that the mean procedure makes no sense on the symmetric group, which is not a vector space. It turns out that a very natural choice consists in taking as the so-called Kemeny consensus [52] aggregation procedure, which somehow corresponds to compute a barycenter.
Kemeny consensus.
Let be the Kendall distance on the symmetric group, defined for every by . A Kemeny consensus of is a solution of the following minimization problem .
Why is Kemeny consensus natural? As proved by Young and Levenglick [100], the Kemeny consensus aggregation procedure is the only rule that satisfies three natural properties: neutrality, meaning that it does not depend on the order of the tasks; consistency, meaning that if the tasks are split in two subsets and that the aggregation in the to subsets rank system above system then ; and the Condorcet criterion [27], meaning that an item wining all its pairwise comparison is ranked fist. Moreover, the Kemeny consensus is also the maximum likelihood of the widely-used Mallows statistical on the symmetric group [99].
3.2 Borda’s count approximation
If the Kemeny consensus is the ideal objective one would like to obtain, its computation is, in general, an NP-hard problem [6, 40] – although some regularity assumptions, rarely satisfied in practice, can speed up the computation, see for instance [8] and [11]. Fortunately, there exist many ways to get satisfying approximations of the latter: see for example [1] for a comprehensive empirical study. For our experiments, we choose the so-called Borda’s count procedure, defined hereafter for the instance-level and/or task-level aggregation.
Borda’s count.
The Borda’s count consists, from a set of permutations corresponding to the ranking of systems across tasks or instances, to sum the ranks of each system and then to rank the obtained sums. Formally, it
-
1.
Compute for every ,
-
2.
Output that ranks the sums, ().
There are at least four explanations for choosing Borda’s count procedure. First, it coincides with the pairwise ranking procedure in the case of two systems, making it a natural generalization. Second, there exists a theoretical result assessing it is a -approximation of the Kemeny consensus [30] with respect to the Kendall distance [42]. Third, it is an unbiased estimator of the Kemeny consensus with low sample complexity for data distributed according to standard rankings models such as Mallows [13, 44]. Fourth, from a practical perspective, [1] observe it is efficient, accurate, and actually times faster than the other approximation algorithms. Fourth, We are now in a position to give our answers to the initial ranking problems from Task Level Information and from Instance Level Information.
3.3 Our Ranking Procedures
How to rank Systems from Task Level Information.
Let be permutation that ranks the scores . Our aggregation procedure () output is .
How to rank Systems from Instance Level Information.
We actually give two different procedures. For every task and every instance of that task, let be the permutation that ranks the scores . See Figure 3.3 for an illustration.
Two-level aggregation (). This procedure
-
1.
Compute for each task ,
-
2.
Output .
One-level aggregation (). This procedure outputs .
![[Uncaptioned image]](/html/2202.03799/assets/x2.png) \captionof
\captionof
figureIllustration of our two aggregation procedures to rank systems from instance-level information.
3.4 How to compare rankings
The rest of the paper is dedicated to synthetic and empirical experiments, on which we demonstrate the soundness of our approach. In order to obtain a quantitative result, one needs to be able to compare different rankings quantitatively. Two measures can be used for that purpose: (1) the Kendall distance and (2) the Kendall correlation () [53, 54]. The Kendall distance computes the number of inversions between two permutations and is therefore adapted for our purpose of ranking systems. The values of range from where the value of 1 corresponds to a strong agreement, and close to -1 indicates strong disagreement.
4 Synthetic Experiments
In this section, we validate on simulated data the performance of our method on two criteria: robustness to manipulation and robustness to scaling.
4.1 Data Generation
The toy experiment analysis is carried out on synthetic scores over systems, tasks and instances. For each , we model the performance of system by a Gumbel r.v. centered at at scale , where is a dispersion parameter. The scores of system , , are i.i.d. samples of centered at with scale , where is a dispersion parameter. Moreover, the scores of different systems are sampled independently. Since follows a logistic distribution with mean at scale , this imply that , the probability that system performs better than system is at least . Therefore, for all , the rankings of systems is a realization of the ground-truth ranking , with a noise term controlled by the ‘dispersion’ parameter .
Extreme scenarii correspond to the choices and . More precisely, implies that all scores have the same distribution, whereas induces a strong consensus, i.e., a clear system ranking emerges.
Remark 1.
Sampling according to the described procedure is equivalent to sampling the ranking of the systems from the well-know Plackett-Luce distribution [39, 75] with weights . Interestingly, this distribution over ranking can be seen both from the utilitarian perspective in which the scores are real numbers and from a ranking-model perspective in which the ranking of systems have known distribution.
4.2 Robustness to manipulation
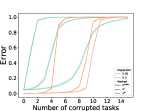
Setting. To test the robustness of our ranking procedure, we analyze its stability with respect to perturbations of the scores. More precisely, our way to corrupt scores of a given task consists in sampling as i.i.d. samples following Gumbel distribution centered at . This implies that, for that task , the underlying ranking is , namely the exact opposite of the ground truth . The robustness to manipulation analysis shows how the error on the final ranking of systems increases as the scores of some tasks are ‘corrupted’. Here, the error is computed relying on the normalized Kendall distance between the ground-truth ranking and the ranking of systems obtained relying on the corrupted scores.
Results: For each of the considered methods, , and we report in Fig. 2 the results of the robustness analysis when and the number of corrupted task varies. The results of the robustness analysis show that outperforms which at the same time consistently outperforms . Overall, for the same number of corrupted tasks and dispersion, the error of is always the smallest.
Moreover, the score-based method gets an error larger than .75 when just 2, 3, and 5 out of the total of tasks have been corrupted, while for the same error is achieved with 5, 7 and 10 corrupted tasks. The most robust method is the two-level for which 10, 11 and 11 out of tasks have to be corrupted to get the same error of 0.75.
Takeaways: We conclude that the ranking-based methods are more robust than . In particular, the 2-level aggregation is the most robust aggregation procedure.
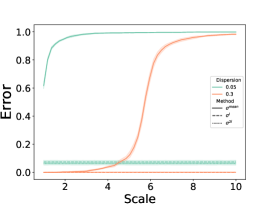
4.3 Robustness to scaling
To further compare the ranking, we corrupt the scores of a given task by re-scaling them by a factor of . Whereas it does not affect our ranking procedure (every ranking induced by a task-instance pair remains the same), it increasingly perturbs the mean aggregation procedure as increases. Re-scaling the scores by a factor of 2 produces an error larger than 90%. For larger , re-scaling the scores by a factor of 7 produces the same error (see Fig. 5 for detailed results).
Takeaways: Re-scaling one task’s score with an arbitrarily large number will always produce an arbitrarily large error for mean aggregation while not affecting ranking based aggregation.
figureGlobal Analysis of Instance Level Raning
5 Empirical Experiments
In this section, we present our results on real evaluation scores. Our large scale experiments relies on real evaluation scores (over 270k scores) which are described in Ssec. 5.1. In Ssec. 5.2 we gather experimental results for Ranking Systems from Task Level Information, while Ssec. 5.3 is dedicated to the problem of Ranking Systems from Instance Level Information.
5.1 Data Collection
Datasets with Task Level Information We collect the results of GLUE [91], SGLUE [92]111Results can be found at https://super.gluebenchmark.com/ and XTREME [50]. For GLUE the dataset is composed of systems that are evaluated on 9 different tasks: CoLA [93], SST-2 [87], MRPC [38], STS-B [14], QQP, MNLI [96], QNLI [80], RTE [31, 48, 7] and WNLI [57]. For SGLUE, the final dataset gathers scores from systems that are evaluated on 10 different tasks: BoolQ [17], CB [33], COPA [82], MultiRC [55], ReCoRD [104], RTE, WiC [74], WSC and its derivatives AX-b AX-g [57]. XTREM benchmark is composed of systems and include tasks such as sentence classification (using XNLI [29, 95] and PAXS-X [98, 106]), structured prediction (relying on Universal Dependencies v2.5 [68] and Wikiann [79, 70]), sentence retrieval (with BUCC [111, 110] and Tatoeba [3]) and question answering (via XQuAD [4, 80], MLQA [58], TyDiQA-GoldP [18]).
For all benchmarks, various types of metrics with various scales are reported (i.e accuracy, f1, correlation).
Datasets with Instance-level information
In this setting we focus on NLG evaluation as these scores are among the easiest to be collected. We focus on five different tasks: summary evaluation, image description, dialogue and translation. For summary evaluation, we use TAC08 [32], TAC10, TAC11 [69], RSUM [9] and SEVAL [41]. For sentence-based image description we rely on FLICKR [101] and for dialogue we use PersonaChat (PC) and TopicalChat (TC) [64]. Finally for machine translation, we rely on the multilingual quality estimation (MLQE) introduced in Ranasinghe et al. [81]. For all datasets except MLQE, we consider automatic metric based on S3 (both variant pyr/resp) [72], ROUGE [59] (including 5 of its variants [67]), JS [1-2] [60], Chrfpp [77], BLEU, BERTScore [105], MoverScore [107]. For MLQE we solely consider several version of BERTScore, MoverScore and ContrastScore. We also add human evaluation which is specific to each dataset. All details corresponding to these dataset can be found in Appendix A.
5.2 Task-level Aggregation Experiments
In this section, we address the aggregation problem when task-level information is available. We first study the final ranking obtained by different methods on GLUE, SGLUE, and XTREM. Then, we assess the robustness of when removing tasks.
Comparison with mean-aggregation To compare the rankings and , we compute (i) the agreement rate (in %) which is the proportion of common top-ranked systems between and , and (ii) the Kendall Tau correlation () between the rankings.
Results. In Ssec. 5.2, we compare the rankings of aforementioned methods for Top K systems (strongest systems) and Last K systems (weakest systems). For the three benchmarks, we observe a high correlation between the final rankings (i.e. correlation values are in the range ). To a finer degree, we also observe that methods tend to agree on which are the best/worst systems. Although and agree on the best/worst systems, they do not rank them in the same order (see Ssec. 5.2). For instance, on XTREM, the third-best system according to (rank 2) is actually the sixth-best system according to .
Takeaways. When changing the aggregation function, the response to our initial question "what are the best systems?" varies.
| Dataset | Top 1 | Top 3 | Top 5 | Top 10 |
| XT. | 1 | 0.66 | 0.8 | 0.9 |
| GLUE | 1 | 1 | 0.8 | 0.8 |
| SGLUE | 1 | 1 | 0.8 | 0.9 |
| Dataset | Last 3 | Last 5 | Last 10 | |
| EXT. | 1 | 0.8 | 0.9 | 0.82 |
| GLUE | 1 | 0.8 | 0.7 | 0.92 |
| SGLUE | 1 | 1 | 1 | 0.91 |
tableAgreement count between Top N/Last N systems on the Ranking when Task Level Information is available. is computed on the total ranking.
| GLUE | XTREM | ||||
| Team | Team | ||||
| 0 | Ms Alex | 0 | 0 | ULR | 0 |
| 1 | ERNIE | 1 | 1 | CoFe | 1 |
| 2 | DEBERTA | 2 | 2 | InfoLXL | 3 |
| 3 | AliceMind | 3 | 3 | VECO | 4 |
| 4 | PING-AH | 5 | 4 | Unicoder | 5 |
| 5 | HFL | 4 | 5 | PolyGlot | 2 |
| 6 | T5 | 6 | 6 | ULR-v2 | 6 |
| 7 | DIRL | 10 | 7 | HiCTL | 8 |
| 8 | Zihan | 7 | 8 | Ernie | 7 |
| 9 | ELECTRA | 11 | 9 | Anony | 10 |
tableQualitative analysis between ranking obtained with or . Results in parenthesis report the score of the considered aggregation procedure.


How does the addition/removal of new tasks/metrics affect the ranking?
When building a benchmark, practitioners can always add new tasks to refine the model performance assessment (it boils down to adding a new column in Tab. 1). In this experiment, we analyze how adding and removing tasks affect the rankings of the aggregation procedures.
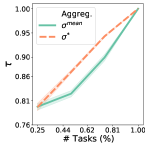
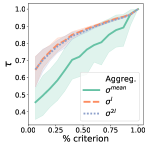
Setting. We compare the rankings obtained when considering a subset of the tasks and the one obtained using all the tasks. Formally, for a given number of tasks , we randomly sample tasks, compute the rankings obtain by our procedure and by the mean procedure, and , on these tasks, and finally compute the Kendall correlation between (resp. ) and the "ground truth" (resp. ). We repeat this random sampling 100 times to obtain a mean/variance plot of the correlations in the function of the number of sub-tasks.
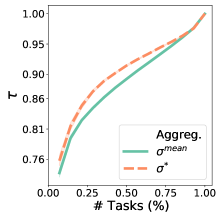
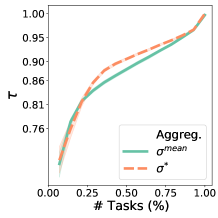
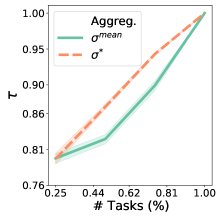
Results. We report in Fig. 3(a,f) the obtained results for varying size of subsets. Interestingly we observe that correlation between the and is consistently higher than the one between and . This difference is particularly visible in the range . We observe a similar behavior when considering SGLUE (see Fig. 6)
Takeaways. The ranking from is more robust to task addition/drop than the one from .
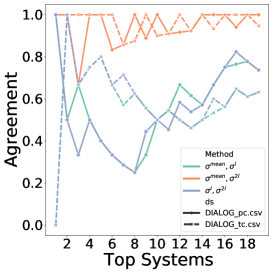
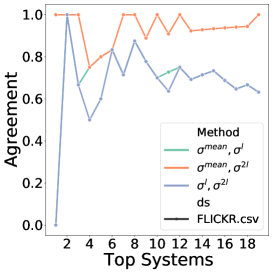
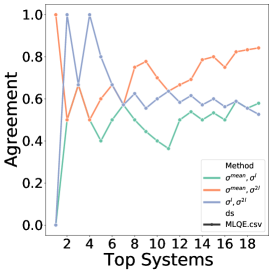
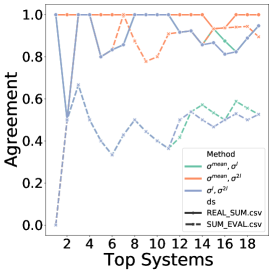
5.3 Instance-level Aggregation Experiments
For instance level aggregation, we conduct experiments on the 9 aforementioned data-sets. We study both the final ranking obtained for each aggregation (i.e. , and ) as well as the effect of task addition/removal.
| PC | TC | FLI. | MLQE | |
| -0.08 | -0.01 | 0 | -0.03 | |
| 0.32 | 0.27 | 0.29 | 0.01 | |
| -0.10 | -0.15 | -0.04 | 0.00 | |
| RSUM | SEVAL | TAC08 | TAC09 | TAC11 |
| 0.04 | 0.14 | 0.28 | 0.06 | -0.06 |
| 0.07 | 0.52 | 0.32 | 0.37 | 0.37 |
| 0 | 0.10 | 0.23 | 0.19 | 0.07 |
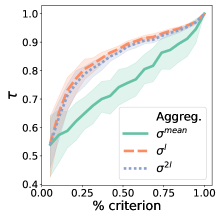
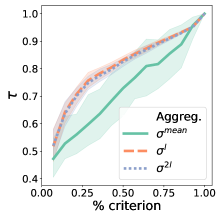
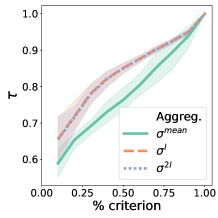
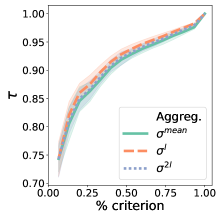
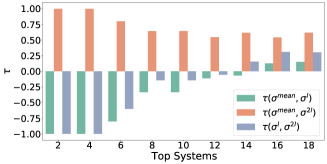
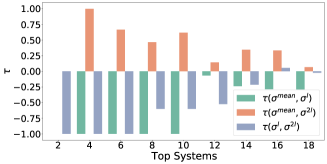
Global analysis
When conducting our experiments, we observe that the three different aggregation procedures lead to three different state-of-the-art in 8 datasets out of 9. Furthermore, they never agree on the top 3 systems. In what follows, we compare , and .
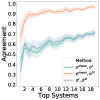
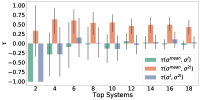
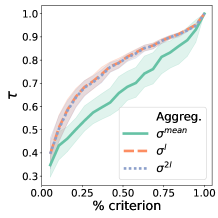
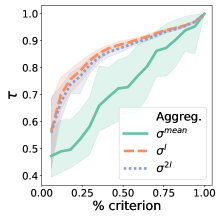
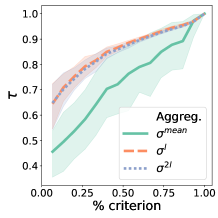
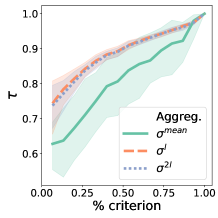
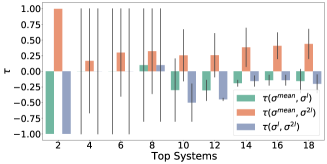
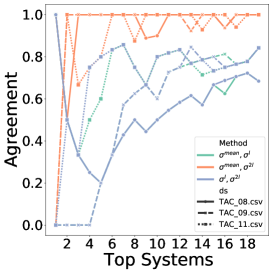
Setting. We compare the obtained ranking by (1) comparing the Kendall correlation (see Fig. 4), (2) comparing the number of agreements between the top N systems, (3) computing the Kendall correlation between them.
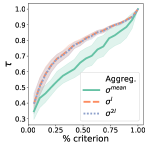
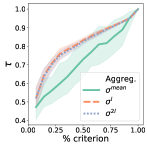
Results. When considering the agreement analysis of 3b(a), we observe that and select a high number of common top systems. However, the correlation of the rankings induced by and on these top-systems is low (see 3b(b)). This is also the case for the correlation of the entire rankings (see 3b). In short and select similar systems but rank them differently. Similar analysis shows that disagrees from and both on top systems and on their orders.
Takeaways. exhibits a more similar behavior than with respect to .
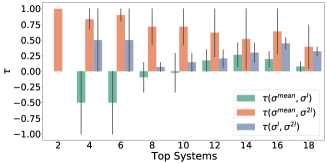
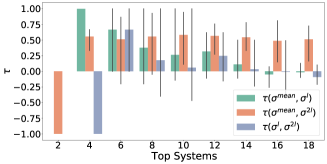
What is the impact of removing/adding tasks?
In NLG, different metrics (i.e. task) assess the quality of a generated sentence along a different axis. As adding a new metric may affect the final ranking, we investigate the impact of task addition/removal on the final system ordering.
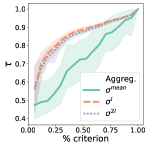
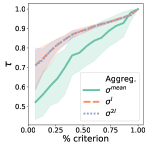
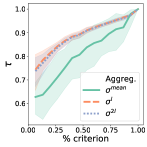
Setting. Similarly to LABEL:ssec:robustness_benchmark, we study the evolution between the correlation between the ranking computed on a subset of tasks and the ground truth ranking (computed on all tasks) for each of the three procedures.
Results. We observe that for all datasets both obtain higher correlation and lower variance compared to when adding/removing tasks. Results for RSUM reports a similar trends (see Fig. 7).
Takeaways. The ranking obtained with either or are more robust to task addition/drop than the one from .
6 Conclusion and Future Works
In this paper, we introduced new aggregation procedures to rank systems when either task level scores or instance level scores are available. Our methods, which are theoretically grounded and rely on Kemeny ranking consensus, address fundamental flaws of the widely used arithmetic mean.
We conducted extensive numerical experiments, which show that our methods are both more reliable and more robust than the mean aggregation while leading to different conclusions on which are the best systems. Overall, when task-level (resp. instance-level) information is available, we would recommend using the aggregation procedure (resp. ) rather than the (resp. and ).
Although we focused on NLP benchmarks, our methodology could be applied in other modalities (e.g. Computer Vision, Audio). Another interesting avenue would be to consider a weighted version of the Kemeney consensus where weight could reflect task-specific criteria (e.g fairness, robustness, complexity).
7 Acknowledgements and Fundings
We thank Maxime Peyrard, Saibo Geng, and Wei Zhao for sharing their collected dataset. A warm thanks to Matthieu Labeau for his sharp eyes and excellent comments when reading our paper manuscript. This work was granted access to the HPC resources of IDRIS under the allocation 2021-101838 and 2021-101913 made by GENCI. Nathan is funded by the projet ANR LIMPID.
References
- Ali and Meilă [2012] Alnur Ali and Marina Meilă. Experiments with kemeny ranking: What works when? Mathematical Social Sciences, 64(1):28–40, 2012.
- Aribandi et al. [2021] Vamsi Aribandi, Yi Tay, Tal Schuster, Jinfeng Rao, Huaixiu Steven Zheng, Sanket Vaibhav Mehta, Honglei Zhuang, Vinh Q Tran, Dara Bahri, Jianmo Ni, et al. Ext5: Towards extreme multi-task scaling for transfer learning. arXiv preprint arXiv:2111.10952, 2021.
- Artetxe and Schwenk [2019] Mikel Artetxe and Holger Schwenk. Massively multilingual sentence embeddings for zero-shot cross-lingual transfer and beyond. Transactions of the Association for Computational Linguistics, 7:597–610, 2019.
- Artetxe et al. [2019] Mikel Artetxe, Sebastian Ruder, and Dani Yogatama. On the cross-lingual transferability of monolingual representations. arXiv preprint arXiv:1910.11856, 2019.
- Banerjee and Lavie [2005] Satanjeev Banerjee and Alon Lavie. Meteor: An automatic metric for mt evaluation with improved correlation with human judgments. In Proceedings of the acl workshop on intrinsic and extrinsic evaluation measures for machine translation and/or summarization, pages 65–72, 2005.
- Bartholdi et al. [1989] John J Bartholdi, Craig A Tovey, and Michael A Trick. The computational difficulty of manipulating an election. Social Choice and Welfare, 6(3):227–241, 1989.
- Bentivogli et al. [2009] Luisa Bentivogli, Peter Clark, Ido Dagan, and Danilo Giampiccolo. The fifth pascal recognizing textual entailment challenge. In TAC, 2009.
- Betzler et al. [2009] Nadja Betzler, Michael R Fellows, Jiong Guo, Rolf Niedermeier, and Frances A Rosamond. How similarity helps to efficiently compute kemeny rankings. In Proceedings of The 8th International Conference on Autonomous Agents and Multiagent Systems-Volume 1, pages 657–664, 2009.
- Bhandari et al. [2020] Manik Bhandari, Pranav Gour, Atabak Ashfaq, Pengfei Liu, and Graham Neubig. Re-evaluating evaluation in text summarization. arXiv preprint arXiv:2010.07100, 2020.
- Bradley and Terry [1952] Ralph Allan Bradley and Milton E Terry. Rank analysis of incomplete block designs: I. the method of paired comparisons. Biometrika, 39(3/4):324–345, 1952.
- Brandt et al. [2010] Felix Brandt, Markus Brill, Edith Hemaspaandra, and Lane A Hemaspaandra. Bypassing combinatorial protections: Polynomial-time algorithms for single-peaked electorates. In Twenty-Fourth AAAI Conference on Artificial Intelligence, 2010.
- Busa-Fekete et al. [2021] Róbert Busa-Fekete, Dimitris Fotakis, and Emmanouil Zampetakis. Private and non-private uniformity testing for ranking data. Advances in Neural Information Processing Systems, 34, 2021.
- Caragiannis et al. [2013] Ioannis Caragiannis, Ariel D Procaccia, and Nisarg Shah. When Do Noisy Votes Reveal the Truth? In Proceedings of the Fourteenth ACM Conference on Electronic Commerce, EC ’13, pages 143–160. ACM, 2013. ISBN 978-1-4503-1962-1. doi: 10.1145/2482540.2482570. URL http://doi.acm.org/10.1145/2482540.2482570.
- Cer et al. [2017] Daniel Cer, Mona Diab, Eneko Agirre, Inigo Lopez-Gazpio, and Lucia Specia. Semeval-2017 task 1: Semantic textual similarity-multilingual and cross-lingual focused evaluation. arXiv preprint arXiv:1708.00055, 2017.
- Chapuis et al. [2020] Emile Chapuis, Pierre Colombo, Matteo Manica, Matthieu Labeau, and Chloe Clavel. Hierarchical pre-training for sequence labelling in spoken dialog. arXiv preprint arXiv:2009.11152, 2020.
- Chapuis et al. [2021] Emile Chapuis, Pierre Colombo, Matthieu Labeau, and Chloe Clavel. Code-switched inspired losses for generic spoken dialog representations. arXiv preprint arXiv:2108.12465, 2021.
- Clark et al. [2019] Christopher Clark, Kenton Lee, Ming-Wei Chang, Tom Kwiatkowski, Michael Collins, and Kristina Toutanova. Boolq: Exploring the surprising difficulty of natural yes/no questions. arXiv preprint arXiv:1905.10044, 2019.
- Clark et al. [2020] Jonathan H Clark, Eunsol Choi, Michael Collins, Dan Garrette, Tom Kwiatkowski, Vitaly Nikolaev, and Jennimaria Palomaki. Tydi qa: A benchmark for information-seeking question answering in typologically diverse languages. Transactions of the Association for Computational Linguistics, 8:454–470, 2020.
- Colombo [2021] Pierre Colombo. Learning to represent and generate text using information measures. PhD thesis, Institut polytechnique de Paris, 2021.
- Colombo et al. [2019] Pierre Colombo, Wojciech Witon, Ashutosh Modi, James Kennedy, and Mubbasir Kapadia. Affect-driven dialog generation. arXiv preprint arXiv:1904.02793, 2019.
- Colombo et al. [2020] Pierre Colombo, Emile Chapuis, Matteo Manica, Emmanuel Vignon, Giovanna Varni, and Chloe Clavel. Guiding attention in sequence-to-sequence models for dialogue act prediction. In Proceedings of the AAAI Conference on Artificial Intelligence, volume 34, pages 7594–7601, 2020.
- Colombo et al. [2021a] Pierre Colombo, Emile Chapuis, Matthieu Labeau, and Chloe Clavel. Improving multimodal fusion via mutual dependency maximisation. arXiv preprint arXiv:2109.00922, 2021a.
- Colombo et al. [2021b] Pierre Colombo, Chloe Clave, and Pablo Piantanida. Infolm: A new metric to evaluate summarization & data2text generation. arXiv preprint arXiv:2112.01589, 2021b.
- Colombo et al. [2021c] Pierre Colombo, Chloe Clavel, and Pablo Piantanida. A novel estimator of mutual information for learning to disentangle textual representations. arXiv preprint arXiv:2105.02685, 2021c.
- Colombo et al. [2021d] Pierre Colombo, Guillaume Staerman, Chloe Clavel, and Pablo Piantanida. Automatic text evaluation through the lens of wasserstein barycenters. arXiv preprint arXiv:2108.12463, 2021d.
- Colombo et al. [2021e] Pierre Colombo, Chouchang Yang, Giovanna Varni, and Chloé Clavel. Beam search with bidirectional strategies for neural response generation. arXiv preprint arXiv:2110.03389, 2021e.
- Condorcet [1785] N. Condorcet. Essai sur l’application de l’analyse à la probabilité des décisions rendues à la pluralité des voix. de l’Imprimerie Royale, 1785.
- Conneau et al. [2018a] Alexis Conneau, German Kruszewski, Guillaume Lample, Loïc Barrault, and Marco Baroni. What you can cram into a single vector: Probing sentence embeddings for linguistic properties. arXiv preprint arXiv:1805.01070, 2018a.
- Conneau et al. [2018b] Alexis Conneau, Guillaume Lample, Ruty Rinott, Adina Williams, Samuel R Bowman, Holger Schwenk, and Veselin Stoyanov. Xnli: Evaluating cross-lingual sentence representations. arXiv preprint arXiv:1809.05053, 2018b.
- Coppersmith et al. [2006] Don Coppersmith, Lisa Fleischer, and Atri Rudra. Ordering by weighted number of wins gives a good ranking for weighted tournaments. In Proceedings of the seventeenth annual ACM-SIAM symposium on Discrete algorithm, pages 776–782, 2006.
- Dagan et al. [2005] Ido Dagan, Oren Glickman, and Bernardo Magnini. The pascal recognising textual entailment challenge. In Machine Learning Challenges Workshop, pages 177–190. Springer, 2005.
- Dang et al. [2008] Hoa Trang Dang, Karolina Owczarzak, et al. Overview of the tac 2008 update summarization task. In TAC, 2008.
- De Marneffe et al. [2019] Marie-Catherine De Marneffe, Mandy Simons, and Judith Tonhauser. The commitmentbank: Investigating projection in naturally occurring discourse. In proceedings of Sinn und Bedeutung, volume 23, pages 107–124, 2019.
- Dehghani et al. [2021] Mostafa Dehghani, Yi Tay, Alexey A Gritsenko, Zhe Zhao, Neil Houlsby, Fernando Diaz, Donald Metzler, and Oriol Vinyals. The benchmark lottery. arXiv preprint arXiv:2107.07002, 2021.
- Denkowski and Lavie [2014] Michael Denkowski and Alon Lavie. Meteor universal: Language specific translation evaluation for any target language. In Proceedings of the ninth workshop on statistical machine translation, pages 376–380, 2014.
- Dhole et al. [2021] Kaustubh D Dhole, Varun Gangal, Sebastian Gehrmann, Aadesh Gupta, Zhenhao Li, Saad Mahamood, Abinaya Mahendiran, Simon Mille, Ashish Srivastava, Samson Tan, et al. Nl-augmenter: A framework for task-sensitive natural language augmentation. arXiv preprint arXiv:2112.02721, 2021.
- Dinkar et al. [2020] Tanvi Dinkar, Pierre Colombo, Matthieu Labeau, and Chloé Clavel. The importance of fillers for text representations of speech transcripts. arXiv preprint arXiv:2009.11340, 2020.
- Dolan and Brockett [2005] William B Dolan and Chris Brockett. Automatically constructing a corpus of sentential paraphrases. In Proceedings of the Third International Workshop on Paraphrasing (IWP2005), 2005.
- Duncan [1959] Luce R Duncan. Individual choice behavior: A theoretical analysis, 1959.
- Dwork et al. [2001] Cynthia Dwork, Ravi Kumar, Moni Naor, and Dandapani Sivakumar. Rank aggregation methods for the web. In Proceedings of the 10th international conference on World Wide Web, pages 613–622, 2001.
- Fabbri et al. [2021] Alexander R Fabbri, Wojciech Kryściński, Bryan McCann, Caiming Xiong, Richard Socher, and Dragomir Radev. Summeval: Re-evaluating summarization evaluation. Transactions of the Association for Computational Linguistics, 9:391–409, 2021.
- Fagin et al. [2003] Ronald Fagin, Ravi Kumar, and Dakshinamurthi Sivakumar. Comparing top k lists. SIAM Journal on discrete mathematics, 17(1):134–160, 2003.
- Fligner and Verducci [1986] Michael A Fligner and Joseph S Verducci. Distance based ranking models. Journal of the Royal Statistical Society, 48(3):359–369, 1986.
- Fligner and Verducci [1988] Michael A Fligner and Joseph S Verducci. Multistage Ranking Models. Journal of the American Statistical Association, 83(403):892–901, 1988. ISSN 01621459. doi: 10.2307/2289322. URL http://www.jstor.org/stable/2289322?origin=crossref.
- Garcia et al. [2019] Alexandre Garcia, Pierre Colombo, Slim Essid, Florence d’Alché Buc, and Chloé Clavel. From the token to the review: A hierarchical multimodal approach to opinion mining. arXiv preprint arXiv:1908.11216, 2019.
- Gardent et al. [2017] Claire Gardent, Anastasia Shimorina, Shashi Narayan, and Laura Perez-Beltrachini. Creating training corpora for nlg micro-planning. In 55th annual meeting of the Association for Computational Linguistics (ACL), 2017.
- Gehrmann et al. [2021] Sebastian Gehrmann, Tosin Adewumi, Karmanya Aggarwal, Pawan Sasanka Ammanamanchi, Anuoluwapo Aremu, Antoine Bosselut, Khyathi Raghavi Chandu, Miruna-Adriana Clinciu, Dipanjan Das, Kaustubh Dhole, Wanyu Du, Esin Durmus, Ondřej Dušek, Chris Chinenye Emezue, Varun Gangal, Cristina Garbacea, Tatsunori Hashimoto, Yufang Hou, Yacine Jernite, Harsh Jhamtani, Yangfeng Ji, Shailza Jolly, Mihir Kale, Dhruv Kumar, Faisal Ladhak, Aman Madaan, Mounica Maddela, Khyati Mahajan, Saad Mahamood, Bodhisattwa Prasad Majumder, Pedro Henrique Martins, Angelina McMillan-Major, Simon Mille, Emiel van Miltenburg, Moin Nadeem, Shashi Narayan, Vitaly Nikolaev, Andre Niyongabo Rubungo, Salomey Osei, Ankur Parikh, Laura Perez-Beltrachini, Niranjan Ramesh Rao, Vikas Raunak, Juan Diego Rodriguez, Sashank Santhanam, João Sedoc, Thibault Sellam, Samira Shaikh, Anastasia Shimorina, Marco Antonio Sobrevilla Cabezudo, Hendrik Strobelt, Nishant Subramani, Wei Xu, Diyi Yang, Akhila Yerukola, and Jiawei Zhou. The GEM benchmark: Natural language generation, its evaluation and metrics. In Proceedings of the 1st Workshop on Natural Language Generation, Evaluation, and Metrics (GEM 2021), pages 96–120, Online, August 2021. Association for Computational Linguistics. doi: 10.18653/v1/2021.gem-1.10. URL https://aclanthology.org/2021.gem-1.10.
- Giampiccolo et al. [2007] Danilo Giampiccolo, Bernardo Magnini, Ido Dagan, and William B Dolan. The third pascal recognizing textual entailment challenge. In Proceedings of the ACL-PASCAL workshop on textual entailment and paraphrasing, pages 1–9, 2007.
- Guo and Hu [2019] Yinuo Guo and Junfeng Hu. Meteor++ 2.0: Adopt syntactic level paraphrase knowledge into machine translation evaluation. In Proceedings of the Fourth Conference on Machine Translation (Volume 2: Shared Task Papers, Day 1), pages 501–506, Florence, Italy, August 2019. Association for Computational Linguistics. doi: 10.18653/v1/W19-5357. URL https://www.aclweb.org/anthology/W19-5357.
- Hu et al. [2020] Junjie Hu, Sebastian Ruder, Aditya Siddhant, Graham Neubig, Orhan Firat, and Melvin Johnson. Xtreme: A massively multilingual multi-task benchmark for evaluating cross-lingual generalisation. In International Conference on Machine Learning, pages 4411–4421. PMLR, 2020.
- Kawaguchi et al. [2017] Kenji Kawaguchi, Leslie Pack Kaelbling, and Yoshua Bengio. Generalization in deep learning. arXiv preprint arXiv:1710.05468, 2017.
- Kemeny [1959] John G Kemeny. Mathematics without numbers. Daedalus, 88(4):577–591, 1959.
- Kendall [1938] Maurice G Kendall. A new measure of rank correlation. Biometrika, 30(1/2):81–93, 1938.
- Kendall [1945] Maurice G Kendall. The treatment of ties in ranking problems. Biometrika, 33(3):239–251, 1945.
- Khashabi et al. [2018] Daniel Khashabi, Snigdha Chaturvedi, Michael Roth, Shyam Upadhyay, and Dan Roth. Looking beyond the surface: A challenge set for reading comprehension over multiple sentences. In Proceedings of the 2018 Conference of the North American Chapter of the Association for Computational Linguistics: Human Language Technologies, Volume 1 (Long Papers), pages 252–262, 2018.
- Korba et al. [2017] Anna Korba, Stephan Clémençon, and Eric Sibony. A learning theory of ranking aggregation. In Proceedings of the 20th International Conference on Artificial Intelligence and Statistics, AISTATS 2017, 2017.
- Levesque et al. [2012] Hector Levesque, Ernest Davis, and Leora Morgenstern. The winograd schema challenge. In Thirteenth International Conference on the Principles of Knowledge Representation and Reasoning, 2012.
- Lewis et al. [2019] Patrick Lewis, Barlas Oğuz, Ruty Rinott, Sebastian Riedel, and Holger Schwenk. Mlqa: Evaluating cross-lingual extractive question answering. arXiv preprint arXiv:1910.07475, 2019.
- Lin [2004] Chin-Yew Lin. Rouge: A package for automatic evaluation of summaries. In Text summarization branches out, pages 74–81, 2004.
- Lin et al. [2006] Chin-Yew Lin, Guihong Cao, Jianfeng Gao, and Jian-Yun Nie. An information-theoretic approach to automatic evaluation of summaries. In Proceedings of the Human Language Technology Conference of the NAACL, Main Conference, pages 463–470, 2006.
- Liu et al. [2021] Pengfei Liu, Jinlan Fu, Yang Xiao, Weizhe Yuan, Shuaicheng Chang, Junqi Dai, Yixin Liu, Zihuiwen Ye, Zi-Yi Dou, and Graham Neubig. Explainaboard: An explainable leaderboard for nlp. arXiv preprint arXiv:2104.06387, 2021.
- McCann et al. [2018] Bryan McCann, Nitish Shirish Keskar, Caiming Xiong, and Richard Socher. The natural language decathlon: Multitask learning as question answering. arXiv preprint arXiv:1806.08730, 2018.
- McMillan-Major et al. [2021] Angelina McMillan-Major, Salomey Osei, Juan Diego Rodriguez, Pawan Sasanka Ammanamanchi, Sebastian Gehrmann, and Yacine Jernite. Reusable templates and guides for documenting datasets and models for natural language processing and generation: A case study of the HuggingFace and GEM data and model cards. In Proceedings of the 1st Workshop on Natural Language Generation, Evaluation, and Metrics (GEM 2021), pages 121–135, Online, August 2021. Association for Computational Linguistics. doi: 10.18653/v1/2021.gem-1.11. URL https://aclanthology.org/2021.gem-1.11.
- Mehri and Eskenazi [2020] Shikib Mehri and Maxine Eskenazi. Usr: An unsupervised and reference free evaluation metric for dialog generation. arXiv preprint arXiv:2005.00456, 2020.
- Mnih et al. [2008] Volodymyr Mnih, Csaba Szepesvári, and Jean-Yves Audibert. Empirical bernstein stopping. In Proceedings of the 25th international conference on Machine learning, pages 672–679, 2008.
- Myerson [1996] Roger B Myerson. Fundamentals of social choice theory. Technical report, Discussion Paper, 1996.
- Ng and Abrecht [2015] Jun-Ping Ng and Viktoria Abrecht. Better summarization evaluation with word embeddings for rouge. arXiv preprint arXiv:1508.06034, 2015.
- [68] Joakim Nivre, Mitchell Abrams, Zeljko Agic, Lars Ahrenberg, Lene Antonsen, et al. Universal dependencies 2.2 (2018). URL http://hdl. handle. net/11234/1-1983xxx. LINDAT/CLARIN digital library at the Institute of Formal and Applied Linguistics, Charles University, Prague, http://hdl. handle. net/11234/1-1983xxx.
- Owczarzak and Dang [2011] Karolina Owczarzak and Hoa Trang Dang. Overview of the tac 2011 summarization track: Guided task and aesop task. In Proceedings of the Text Analysis Conference (TAC 2011), Gaithersburg, Maryland, USA, November, 2011.
- Pan et al. [2017] Xiaoman Pan, Boliang Zhang, Jonathan May, Joel Nothman, Kevin Knight, and Heng Ji. Cross-lingual name tagging and linking for 282 languages. In Proceedings of the 55th Annual Meeting of the Association for Computational Linguistics (Volume 1: Long Papers), pages 1946–1958, 2017.
- Papineni et al. [2002] Kishore Papineni, Salim Roukos, Todd Ward, and Wei-Jing Zhu. Bleu: a method for automatic evaluation of machine translation. In Proceedings of the 40th annual meeting of the Association for Computational Linguistics, pages 311–318, 2002.
- Peyrard et al. [2017] Maxime Peyrard, Teresa Botschen, and Iryna Gurevych. Learning to score system summaries for better content selection evaluation. In Proceedings of the Workshop on New Frontiers in Summarization, pages 74–84, 2017.
- Peyrard et al. [2021] Maxime Peyrard, Wei Zhao, Steffen Eger, and Robert West. Better than average: Paired evaluation of nlp systems. arXiv preprint arXiv:2110.10746, 2021.
- Pilehvar and Camacho-Collados [2018] Mohammad Taher Pilehvar and Jose Camacho-Collados. Wic: the word-in-context dataset for evaluating context-sensitive meaning representations. arXiv preprint arXiv:1808.09121, 2018.
- Plackett [1975] Robin L Plackett. The analysis of permutations. Journal of the Royal Statistical Society: Series C (Applied Statistics), 24(2):193–202, 1975.
- Popović [2015] Maja Popović. chrf: character n-gram f-score for automatic mt evaluation. In Proceedings of the Tenth Workshop on Statistical Machine Translation, pages 392–395, 2015.
- Popović [2017] Maja Popović. chrf++: words helping character n-grams. In Proceedings of the second conference on machine translation, pages 612–618, 2017.
- Post [2018] Matt Post. A call for clarity in reporting BLEU scores. In Proceedings of the Third Conference on Machine Translation: Research Papers, pages 186–191, Belgium, Brussels, October 2018. Association for Computational Linguistics. URL https://www.aclweb.org/anthology/W18-6319.
- Rahimi et al. [2019] Afshin Rahimi, Yuan Li, and Trevor Cohn. Massively multilingual transfer for ner. arXiv preprint arXiv:1902.00193, 2019.
- Rajpurkar et al. [2016] Pranav Rajpurkar, Jian Zhang, Konstantin Lopyrev, and Percy Liang. Squad: 100,000+ questions for machine comprehension of text. arXiv preprint arXiv:1606.05250, 2016.
- Ranasinghe et al. [2021] Tharindu Ranasinghe, Constantin Orasan, and Ruslan Mitkov. An exploratory analysis of multilingual word-level quality estimation with cross-lingual transformers. arXiv preprint arXiv:2106.00143, 2021.
- Roemmele et al. [2011] Melissa Roemmele, Cosmin Adrian Bejan, and Andrew S Gordon. Choice of plausible alternatives: An evaluation of commonsense causal reasoning. In 2011 AAAI Spring Symposium Series, 2011.
- Ruder [2021] Sebastian Ruder. Challenges and Opportunities in NLP Benchmarking. http://ruder.io/nlp-benchmarking, 2021.
- Sanh et al. [2021] Victor Sanh, Albert Webson, Colin Raffel, Stephen H Bach, Lintang Sutawika, Zaid Alyafeai, Antoine Chaffin, Arnaud Stiegler, Teven Le Scao, Arun Raja, et al. Multitask prompted training enables zero-shot task generalization. arXiv preprint arXiv:2110.08207, 2021.
- Siddhant et al. [2020] Aditya Siddhant, Junjie Hu, Melvin Johnson, Orhan Firat, and Sebastian Ruder. Xtreme: A massively multilingual multi-task benchmark for evaluating cross-lingual generalization. 2020.
- Silver et al. [2016] David Silver, Aja Huang, Chris J Maddison, Arthur Guez, Laurent Sifre, George Van Den Driessche, Julian Schrittwieser, Ioannis Antonoglou, Veda Panneershelvam, Marc Lanctot, et al. Mastering the game of go with deep neural networks and tree search. nature, 529(7587):484–489, 2016.
- Socher et al. [2013] Richard Socher, Alex Perelygin, Jean Wu, Jason Chuang, Christopher D Manning, Andrew Y Ng, and Christopher Potts. Recursive deep models for semantic compositionality over a sentiment treebank. In Proceedings of the 2013 conference on empirical methods in natural language processing, pages 1631–1642, 2013.
- Staerman et al. [2021] Guillaume Staerman, Pavlo Mozharovskyi, Stéphan Clémençon, and Florence d’Alché Buc. Depth-based pseudo-metrics between probability distributions. arXiv e-prints, pages arXiv–2103, 2021.
- Tay et al. [2020a] Yi Tay, Mostafa Dehghani, Samira Abnar, Yikang Shen, Dara Bahri, Philip Pham, Jinfeng Rao, Liu Yang, Sebastian Ruder, and Donald Metzler. Long range arena: A benchmark for efficient transformers. arXiv preprint arXiv:2011.04006, 2020a.
- Tay et al. [2020b] Yi Tay, Donovan Ong, Jie Fu, Alvin Chan, Nancy Chen, Anh Tuan Luu, and Christopher Pal. Would you rather? a new benchmark for learning machine alignment with cultural values and social preferences. In Proceedings of the 58th Annual Meeting of the Association for Computational Linguistics, pages 5369–5373, 2020b.
- Wang et al. [2018] Alex Wang, Amanpreet Singh, Julian Michael, Felix Hill, Omer Levy, and Samuel R Bowman. Glue: A multi-task benchmark and analysis platform for natural language understanding. arXiv preprint arXiv:1804.07461, 2018.
- Wang et al. [2019] Alex Wang, Yada Pruksachatkun, Nikita Nangia, Amanpreet Singh, Julian Michael, Felix Hill, Omer Levy, and Samuel R Bowman. Superglue: A stickier benchmark for general-purpose language understanding systems. arXiv preprint arXiv:1905.00537, 2019.
- Warstadt et al. [2019] Alex Warstadt, Amanpreet Singh, and Samuel R Bowman. Neural network acceptability judgments. Transactions of the Association for Computational Linguistics, 7:625–641, 2019.
- Wei et al. [2021] Jason Wei, Maarten Bosma, Vincent Y Zhao, Kelvin Guu, Adams Wei Yu, Brian Lester, Nan Du, Andrew M Dai, and Quoc V Le. Finetuned language models are zero-shot learners. arXiv preprint arXiv:2109.01652, 2021.
- Williams et al. [2017a] Adina Williams, Nikita Nangia, and Samuel R Bowman. A broad-coverage challenge corpus for sentence understanding through inference. arXiv preprint arXiv:1704.05426, 2017a.
- Williams et al. [2017b] Adina Williams, Nikita Nangia, and Samuel R Bowman. A broad-coverage challenge corpus for sentence understanding through inference. arXiv preprint arXiv:1704.05426, 2017b.
- Witon et al. [2018] Wojciech Witon, Pierre Colombo, Ashutosh Modi, and Mubbasir Kapadia. Disney at iest 2018: Predicting emotions using an ensemble. In Proceedings of the 9th Workshop on Computational Approaches to Subjectivity, Sentiment and Social Media Analysis, pages 248–253, 2018.
- Yang et al. [2019] Yinfei Yang, Yuan Zhang, Chris Tar, and Jason Baldridge. Paws-x: A cross-lingual adversarial dataset for paraphrase identification. arXiv preprint arXiv:1908.11828, 2019.
- Young [1988] H Peyton Young. Condorcet’s theory of voting. American Political science review, 82(4):1231–1244, 1988.
- Young and Levenglick [1978] H Peyton Young and Arthur Levenglick. A consistent extension of condorcet’s election principle. SIAM Journal on applied Mathematics, 35(2):285–300, 1978.
- Young et al. [2014] Peter Young, Alice Lai, Micah Hodosh, and Julia Hockenmaier. From image descriptions to visual denotations: New similarity metrics for semantic inference over event descriptions. Transactions of the Association for Computational Linguistics, 2:67–78, 2014.
- Yuan et al. [2021] Weizhe Yuan, Graham Neubig, and Pengfei Liu. Bartscore: Evaluating generated text as text generation. arXiv preprint arXiv:2106.11520, 2021.
- Yuan et al. [2019] Xiaoyong Yuan, Pan He, Qile Zhu, and Xiaolin Li. Adversarial examples: Attacks and defenses for deep learning. IEEE transactions on neural networks and learning systems, 30(9):2805–2824, 2019.
- Zhang et al. [2018] Sheng Zhang, Xiaodong Liu, Jingjing Liu, Jianfeng Gao, Kevin Duh, and Benjamin Van Durme. Record: Bridging the gap between human and machine commonsense reading comprehension. arXiv preprint arXiv:1810.12885, 2018.
- Zhang et al. [2019a] Tianyi Zhang, Varsha Kishore, Felix Wu, Kilian Q Weinberger, and Yoav Artzi. Bertscore: Evaluating text generation with bert. arXiv preprint arXiv:1904.09675, 2019a.
- Zhang et al. [2019b] Yuan Zhang, Jason Baldridge, and Luheng He. Paws: Paraphrase adversaries from word scrambling. arXiv preprint arXiv:1904.01130, 2019b.
- Zhao et al. [2019] Wei Zhao, Maxime Peyrard, Fei Liu, Yang Gao, Christian M Meyer, and Steffen Eger. Moverscore: Text generation evaluating with contextualized embeddings and earth mover distance. arXiv preprint arXiv:1909.02622, 2019.
- Zheng et al. [2021] Yanan Zheng, Jing Zhou, Yujie Qian, Ming Ding, Jian Li, Ruslan Salakhutdinov, Jie Tang, Sebastian Ruder, and Zhilin Yang. Fewnlu: Benchmarking state-of-the-art methods for few-shot natural language understanding. arXiv preprint arXiv:2109.12742, 2021.
- Zhong et al. [2021] Ruiqi Zhong, Dhruba Ghosh, Dan Klein, and Jacob Steinhardt. Are larger pretrained language models uniformly better? comparing performance at the instance level. arXiv preprint arXiv:2105.06020, 2021.
- Zweigenbaum et al. [2017] Pierre Zweigenbaum, Serge Sharoff, and Reinhard Rapp. Overview of the second bucc shared task: Spotting parallel sentences in comparable corpora. In Proceedings of the 10th Workshop on Building and Using Comparable Corpora, pages 60–67, 2017.
- Zweigenbaum et al. [2018] Pierre Zweigenbaum, Serge Sharoff, and Reinhard Rapp. Overview of the third bucc shared task: Spotting parallel sentences in comparable corpora. In Proceedings of 11th Workshop on Building and Using Comparable Corpora, pages 39–42, 2018.
Checklist
The checklist follows the references.Please read the checklist guidelines carefully for information on how to answer these questions.For each question, change the default [TODO] to [Yes] , [No] , or [N/A] .You are strongly encouraged to include a justification to your answer, either by referencing the appropriate section of your paper or providing a brief inline description.For example:
-
•
Did you include the license to the code and datasets? [Yes]
-
•
Did you include the license to the code and datasets? [N/A]
-
•
Did you include the license to the code and datasets? [N/A]
Please do not modify the questions and only use the provided macros for your answers.Note that the Checklist section does not count towards the page limit.In your paper, please delete this instructions block and only keep the Checklist section heading above along with the questions/answers below.
-
1.
For all authors…
-
(a)
Do the main claims made in the abstract and introduction accurately reflect the paper’s contributions and scope? [Yes]
-
(b)
Did you describe the limitations of your work? [Yes]
-
(c)
Did you discuss any potential negative societal impacts of your work? [N/A] Our works aim at developing safe ai systems.
-
(d)
Have you read the ethics review guidelines and ensured that your paper conforms to them? [Yes]
-
(a)
-
2.
If you are including theoretical results…
-
(a)
Did you state the full set of assumptions of all theoretical results? [Yes]
-
(b)
Did you include complete proofs of all theoretical results? [Yes]
-
(a)
-
3.
If you ran experiments…
-
(a)
Did you include the code, data, and instructions needed to reproduce the main experimental results (either in the supplemental material or as a URL)? [Yes] Both in the supplementary and main paper
-
(b)
Did you specify all the training details (e.g., data splits, hyperparameters, how they were chosen)? [Yes] In the supplementary.
-
(c)
Did you report error bars (e.g., with respect to the random seed after running experiments multiple times)? [Yes] In the supplementary.
-
(d)
Did you include the total amount of compute and the type of resources used (e.g., type of GPUs, internal cluster, or cloud provider)? [Yes] In the supplementary.
-
(a)
-
4.
If you are using existing assets (e.g., code, data, models) or curating/releasing new assets…
-
(a)
If your work uses existing assets, did you cite the creators? [Yes] .
-
(b)
Did you mention the license of the assets? [N/A] .
-
(c)
Did you include any new assets either in the supplemental material or as a URL? [Yes] .
-
(d)
Did you discuss whether and how consent was obtained from people whose data you’re using/curating? [N/A] .
-
(e)
Did you discuss whether the data you are using/curating contains personally identifiable information or offensive content? [N/A] .
-
(a)
-
5.
If you used crowdsourcing or conducted research with human subjects…
-
(a)
Did you include the full text of instructions given to participants and screenshots, if applicable? [N/A]
-
(b)
Did you describe any potential participant risks, with links to Institutional Review Board (IRB) approvals, if applicable? [N/A]
-
(c)
Did you include the estimated hourly wage paid to participants and the total amount spent on participant compensation? [N/A]
-
(a)
Appendix A Details on Datasets
We report in Tab. 3 and Tab. 3 global statistics of the data described in sec:data_collection. Overall our conclusions are drawn from a total of over 270k scores.
| # of tasks | # of instance | |
| GLUE | 105 | 15 |
| SGLUE | 24, 15 | |
| XTREM | 15 | 5 |
| # of tasks | # of instance | |
| PC | 19 | 240 |
| TC | 19 | 300 |
| FLICKR | 14 | 864 |
| MLQE | 10 | 7000 |
| RSUM | 15 | 2500 |
| SEVAL | 17 | 1600 |
| TAC08 | 15 | 2976 |
| TAC09 | 15 | 2596 |
| TAC11 | 15 | 2376 |
Appendix B Additional Experiments
In this section, we report additional experimental results including the details of the robustness to the scaling experiment (see Ssec. B.1), the ranking on XTREM (see Ssec. B.2), complete results on the experiments when adding adding/removing metrics/tasks when Task Level Information (see Sssec. B.3.1) and Instance Level Information is available (see Sssec. B.3.2). In the main paper we only report the aggregated score for the agreement analysis when instance level informatino is available, we report detailed results on Ssec. B.4.
B.1 Toy Experiment on Scale
We display in Fig. 5 the results of the toy experiment on scaling robustness. When corrupting one task by rescaling, we see that the error of the ranking induced by increases to 1 while the error of ranking-based aggregation remains constant.
B.2 Ranking of SGLUE
We display in Tab. 4 the resulting ranking on the three considered benchmark. Although aggregation procedures tend to agree on good and bad systems, when changing the aggregation function, the rankings vary. Thus conclusion depending on the answer to the initial question ”what are the best systems?” might change.
| GLUE | SGLUE | XTREM | ||||||
| Team | Team | Team | ||||||
| 0 | Ms Alex | 0 | 0 | Liam | 0 | 0 | ULR | 0 |
| 1 | ERNIE | 1 | 1 | Ms Alex | 1 | 1 | CoFe | 1 |
| 2 | DEBERTA | 2 | 2 | ERNIE | 2 | 2 | InfoLXL | 3 |
| 3 | AliceMind | 3 | 3 | HUMAN | 3 | 3 | VECO | 4 |
| 4 | PING-AH | 5 | 4 | DEBERTA | 5 | 4 | Unicoder | 5 |
| 5 | HFL | 4 | 5 | Zirui | 4 | 5 | PolyGlot | 2 |
| 6 | T5 | 6 | 6 | T5 | 6 | 6 | ULR-v2 | 6 |
| 7 | DIRL | 10 | 7 | Alibaba | 7 | 7 | HiCTL | 8 |
| 8 | Zihan | 7 | 8 | Anuar | 8 | 8 | Ernie | 7 |
| 9 | ELECTRA | 11 | 9 | Huawei | 11 | 9 | Anony | 10 |
B.3 Complete results on the task addition/removal experiments
B.3.1 Task Level Aggregation
Results of task addition/removal experiments when Task level information is available are reported in Fig. 6. Overall, we observe that ranking-based aggregation is more robust than mean-based aggregation.
B.3.2 Instance Level Aggregation
Results of task addition/removal experiments when instance-level information is available are reported in Fig. 7. Overall, we observe that ranking-based aggregation is more robust than mean-based aggregation.

B.4 Agreement analysis on Instance Level Aggregation
To further complete the experiment on agreement analysis of Ssec. 5.3 report results on individual tasks. We report in Fig. 8 the correlation of ranking when Top K systems for different values of K while Fig. 9 reports the agreement analysis.
B.5 Possible Extensions
For the futur we would like to extend the proposed ranking procedures to:
- •
- •
- •
Appendix C Dispersion Analysis
In this section, we introduce the notion of dispersion across a set of different rankings .
C.1 Dispersion as a measure performance
Suppose you have two ranking candidates, and , to summarize . A natural question consists in measuring the performance of and . Denoting by the Kendall distance, a natural measure is
| (1) |
Of course, in our task-level framework, our candidate will achieve better performance than the mean since it is designed to minimize this quantity. From a probabilistic point of view, one can see as an i.i.d. realization of a r.v. on the symmetric group . Denoting by is law and the associated expectation, Equation (1) is an approximation of
| (2) |
C.2 Dispersion to measure ranking complexity
In order to take into account the intrinsic complexity of ranking , a natural way would be to compute some kind of Dispersion among these permutations. Using the same notations as before, one can rely on the pairwise distance.
| (3) |
On a practical perspective, the computational complexity of Equation (3) is . Nevertheless, it is possible to efficiently approximate this value via empirical stopping algorithms based on Berstein or Hoeffding bounds [65, 56]. Notice that the pairwise distance has a solid theoretical foundation as to be the base for a measure of the spread. It is an empirical approximation of where and are independent with law . Therefore, both are directly related to the noise level in different probabilistic models for permutations [43]. Moreover, the former is the basis of statistical uniformity tests for ranked data building upon it [12].
Remark 2.
A known relation between and has remarkable consequences on assessing the quality of our estimation. It says that the former is bounded below (respectively, above) by 0.5 (respectively, 1) times the latter [56]. This fact has broad practical application since it means that the measure of the expected quality of the estimators and is lower an upper bounded by the intrinsic difficulty of the problem, which we can approximate via sample statistics in Equation (3).
We conclude by noting that is the natural ranking counterpart of the variance for real-valued aggregation . However, when the scores are not on the same scale, then the variance of the scores is no longer interpretable as a measure of spread in the population.
C.3 Experiments
We report in Tab. 5 the results of the dispersion analysis. We compare the dispersion to measure performance obtained with the induced ranking by and the one obtained by 100 random permutations.
Takeaways As expected, obtains a lowest dispersion which further validate our approach.
| GLUE | 793 | 805 | 2746 |
| SGLUE | 44.9 | 47.21 | 137.3 |
| XTREM | 12.25 | 12.75 | 50.6 |