Addressing Data Scarcity in Multimodal User State Recognition by Combining Semi-Supervised and Supervised Learning
Abstract.
Detecting mental states of human users is crucial for the development of cooperative and intelligent robots, as it enables the robot to understand the user’s intentions and desires. Despite their importance, it is difficult to obtain a large amount of high quality data for training automatic recognition algorithms as the time and effort required to collect and label such data is prohibitively high. In this paper we present a multimodal machine learning approach for detecting dis-/agreement and confusion states in a human-robot interaction environment, using just a small amount of manually annotated data. We collect a data set by conducting a human-robot interaction study and develop a novel preprocessing pipeline for our machine learning approach. By combining semi-supervised and supervised architectures, we are able to achieve an average F1-score of 81.1% for dis-/agreement detection with a small amount of labeled data and a large unlabeled data set, while simultaneously increasing the robustness of the model compared to the supervised approach.
1. Introduction
Recognizing mental states of a conversational partner is essential in human communication, as they provide important information during everyday social interaction. By recognizing signals of agreement, disagreement, and confusion during a conversation, an interlocutor can give adequate answers to a given question, make affirmative statements, and quickly identify problems during a conversation, without being dependent on explicit keywords. Although dis-/agreement and confusion is sometimes communicated verbally, many cues and indicators for these complex mental states are expressed through non-verbal behaviour (Cohen, 2003), like head movements or hand gestures. In everyday interactions, the human face is a particularly important source of spontaneous reactions, as it can express a wide variety of different complex mental states, like conveying interest or indicating confusion (Baron-Cohen, 1996; Kaliouby and
Robinson, 2004). This can be an especially important but also highly complex problem for emotionally intelligent robots (Littlewort et al., 2011; Pantic and
Rothkrantz, 2003), and affect-sensitive human computer interaction (Lang
et al., 2012), as many people convey similar reactions in very different ways.
In recent years, machine learning algorithms have become one of the leading methods for automatically detecting and recognizing social cues in human-robot interaction (Vrigkas
et al., 2017; Borges et al., 2019). While supervised machine learning algorithms can solve an ever-increasing complexity of problems, they require a lot of accurately labeled data, which is not always available due to time and budget constraints. As the information in these small data sets are limited, the machine learning models trained on this data can be unable to function outside of narrow scenarios, due to the high noise inherent in the multimodal nature of human interaction in the wild. Semi-supervised algorithms attempt to alleviate some of these problems by training on small amounts of labeled data combined with very large unlabeled data sets (Zhu, 2008; van Engelen and
Hoos, 2020; Ouali
et al., 2020), but are primarily focused on computer vision (Jing and Tian, 2019; Zhai
et al., 2019; Iscen
et al., 2019) and natural language problems (Jo and Cinarel, 2019; Cho
et al., 2019; Dhingra
et al., 2018).
Previous work on automatic dis-/agreement recognition has focused on using verbal (Hillard
et al., 2003; Galley et al., 2004; Hahn
et al., 2006; Germesin and
Wilson, 2009) or non-verbal cues (Kaliouby and
Robinson, 2004; Sheerman-Chase et al., 2009; Dunn
et al., 2011), with only a limited number of approaches combining both modalities (Bousmalis
et al., 2011; Hossein Khaki
, Elif Bozkurt, 2016).
For verbal cues, Wang et al. developed an approach on conditional random fields, with which they achieved an F1-score of 57.2% for agreement and 51.2% for disagreement (Wang et al., 2011). Sheerman‐Chase et al. used non-verbal cues, gathered from natural conversations with an AdaBoost classifier. Although they did not include the disagreement class, due to lack of data, they report an AUC score 0.70 for their agreement detection (Sheerman-Chase et al., 2009).
Similarly to Wang et al., Bousmalis et al. developed an approach based on a hidden conditional random field algorithm that, through the combination of verbal and nonverbal cues, achieved a combined accuracy of 64.2% for dis-/agreement detection (Bousmalis
et al., 2011).
The detection of confusion is primarily focused on EEG-based data (Zhou
et al., 2018; Ni
et al., 2017; Yang
et al., 2016) or based on natural language processing with text input (Zeng
et al., 2017; Geller et al., 2020). Using automatically recognized Action Units from the Facial Action Coding System, Borges et al. trained an LSTM neural network on their own collected data, with which they reported an F1-score of 80.89% for their confusion class. Semi-supervised approaches are primarily focused on computer vision and natural language processing tasks (Jing and Tian, 2019; Zhai
et al., 2019; Jo and Cinarel, 2019; Cho
et al., 2019), but there has been some research into using semi-supervised learning for emotion recognition. Parthasarathy et al. trained a ladder network with an unsupervised auxiliary task to classify emotion from speech (Parthasarathy and
Busso, 2020). Similarly, Liang et al. used a modified transformer architecture to classify from a multimodal data stream, consisting of audio, video and text.
In this work, we explore the use of unsupervised, supervised and semi-supervised learning for the identification of conversationally relevant user states in a multimodal human-robot interaction environment. We formalize user state recognition as a 4-way classification problem (agreement/disagreement/confusion/neutral) for each modality. We create a user study to gather a small labeled data set in a controlled environment and combine it with an unlabeled data set from a wide range of different scenarios, gathered from the internet. After training an unsupervised autoencoder network for audio feature extraction, we combine three different models during training for a combined semi-supervised and supervised approach. In the remainder of this paper we report on the data gathering, the learning approach, and evaluation results.
| Class | audio data only | face data only | combined |
|---|---|---|---|
| Agreement | 5:12 | 5:35 | 4:25 |
| Disagreement | 6:11 | 5:52 | 5:11 |
| Confusion | 4:46 | 5:03 | 4:12 |
| Neutral | 31:46 | 31:46 | 31:46 |
![[Uncaptioned image]](/html/2202.03775/assets/experiment_setup.png)
[Study setup]The setup of the study, which shows the experimenter with a computer behind a wall. On the other side is the participant and the robot. The participant and the robot are separated by a table, on which the information sheet lies.
2. Data
Since there is limited high quality interaction data between robots and humans openly available, in which full conversations are conducted, a stand-alone study was designed, in which a participant performed different tasks with a robot as their conversational partner.
2.1. Robot Interaction Study
The study was conducted using a robot based on the Scitos G5 research platform, equipped with a Microsoft Kinect 2 camera and a Seeed Studio ReSpeaker 6 Microphone Array. The video data was recorded as a RGB image with a resolution of 1920x1080 at 30 FPS using the H.264 codec. The audio data was captured as a stereo signal with a bit rate of 192 kBit/s at a sampling rate of 44.1 kHz and encoded using the AAC codec. All parts of the study were carried out according to the ”Wizard Of Oz” method.
Twelve participants were recruited from local academic institutions (5 women, 7 men) between the ages of 26 and 47. All participants were students or academic employees in the fields of computer science, architecture, and physics. The study lasted on average 15 minutes and was conducted entirely in English. Five of the twelve participants had prior experience interacting with other robots. Our robot interaction study consisted of two parts that were done entirely during one session. A sketch of the study setup can be seen in Figure 1. In the first part the participants were shown eight different optical illusions, in which two equally valid answers were possible. The robot explained the optical illusion to the participants and determined by means of specific questions which of the possible answers were perceived. For four randomly selected illusions, the robot gave an affirmative response, and subsequently asked the participant whether the alternative illusion was also observed. For the remaining four illusions, the participant was challenged on their answer and the robot proclaimed that the alternative answer was the objectively correct choice, trying to elicit a disagreement response. In the second part, a game called ”who am I?” was played with the participant. For this, the participant and the robot took turns choosing one of 16 different objects which were depicted on a sheet of paper and asked each other questions which could be answered with yes or no, to determine the selected object. During the second part, errors in the interaction were simulated at specific points to elicit confusion in the participants. For this purpose, six different interaction errors were designed, from which the experimenter selected one at a time. The interaction errors were: ”misunderstanding the participant”, ”contradicting their own logical reasoning”, ”choosing an object that didn’t exist”, ”solving the game with the wrong object”, ”asking the participant questions, instead of answering.” and ”stopping mid-sentence and repeating question”. All interaction errors were at least 30 seconds apart and substantially distinct as to not evoke any anticipation in the participants. Whenever one of the desired user states was visible, the video file was cut into an individual segments with a minimum length of one second and saved with a description file. This included segments, where only the face or the voice displayed one of the user states, which were save separately. All instances of the robot voice were cut from the data, as well as all utterances which primarily amounted to ”yes” and ”no”. In addition, 2.5 minutes of video footage was saved from each participant in which none of the desired user states were visible, as the neutral labeled data. After collecting all the data, the segments were manually annotated by four different annotators. The average inter-annotator agreement (given by Co-hen’s Kappa) was 0.89. Each segment that didn’t receive a majority vote for one of the four possible labels was removed. resulting in a total of 415 segments. The total seconds of recorded data used for training can be found in Table 1.
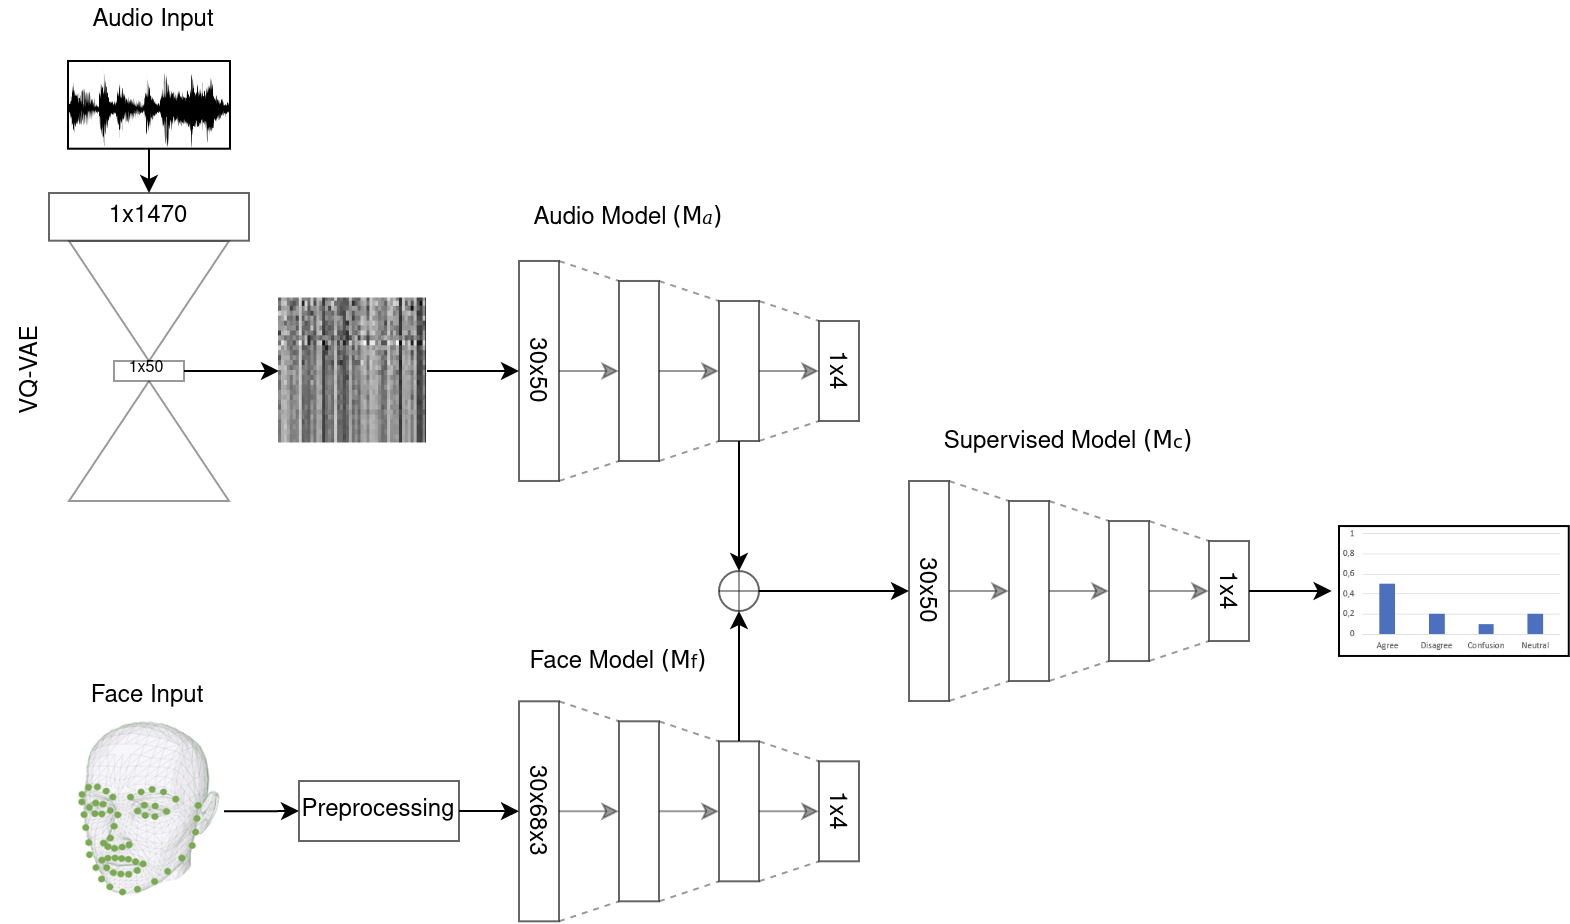
[Model Diagram]An overview of the model architecture. The audio input is fed into the vq-vae model, concatenated and fed into the Audio Model. The face landmarks are concatenated and fed into the face model. The second to last layer of both models are concatenated and become the output of the combined model.
2.2. Youtube Debate Data Set
In addition to the labeled data, a large amount of unlabeled data had to be gathered to train the semi-supervised architecture. For this purpose 560 videos of multiple Youtube channels were downloaded in their highest available resolution, at 30fps, as mp4 files (NewsHour, [n.d.]; Corden, [n.d.]; Colbert, [n.d.]; Norton, [n.d.]; Kunz, [n.d.]). It was ensured that all videos had at least two different speakers, of whom the head and the upper body were visible. In all videos, the intros were removed, as well as all parts, where a narrator was speaking. Any of the videos that did not have two speakers, where the head was not clearly visible or the head position of one of the speakers was strongly slanted, were removed. The resulting data set contained 210 videos, totaling 230 hours of video footage.
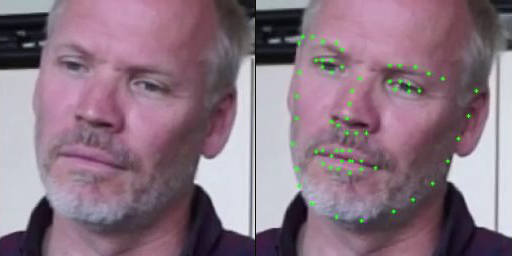
[Visualized Landmark]A head of a person during a confusion event. The left side shows the person without landmarks in his face and the right side shows the added landmarks
3. Approach
The labeled data and the unlabeled data were processed identically. In all videos the faces of the speakers were recognized and 68 3D landmarks, using the model of Bulat et al. (Bulat and Tzimiropoulos, 2017), were added. An example of the landmarks can be found in figure 3. Each face was given a unique ID and tracked for the duration of the video. All videos, in which the audio sampling rate differed were converted to a sampling rate of 44.1 khz using ffmpeg (Tomar, 2006).
3.1. Audio Pipeline
Based on the findings of Chorowski et al. (Chorowski et al., 2019), we decided against solely encoding the audio data as mel-frequency cepstral coefficients (MFCC) for the training input and instead used a Vector Quantized Variational Autoencoder (VQ-VAE) (van den Oord et al., 2017) with MFCC input and raw data output. We divided the audio data into 1/30 of a second and extracted 18 MFCC features at an input frequency of 44.1 khz, augmented with their temporal first and second derivatives. The encoder consisted of six convolutional layers, with a 2x2 pooling layer after the first, third and fifth layer. The embedding space was defined as a 5x10x1 vector, which was flattened to give a latent variable of 50 values. The decoder consisted of six convolutional layer, with a bilinear upsampling layer after the first, third and fifth layer. After the last convolutional layer, a dense layer was added as the output layer. For all convolutional layer, the Leaky ReLU activation function with an alpha value of 0.3 was used (Maas et al., 2013). We trained the VQ-VAE model on 2000 hours of audio data from randomly selected videos downloaded from the video platform Youtube. Based on the paper by Amari et al. (Amari et al., 1997), we split the data into 1980 hours for the training set and 10 hours each, for the validation and testing set. It was ensured that none of the videos of the Youtube debate data set were part of the data set for the audio pipeline. The training was performed on two NVIDIA TESLA V100 gpu for 72 hours, with each epoch being saved individually. After the training, the epoch with lowest validation loss was restored and used for the preprocessing pipeline.
3.2. Face Pipeline
The face pipeline used 30 consecutive frames for each labeled face as input. To minimize the large variance in head movements, we normalized the rotation of the 3D landmarks. To do this, we aligned the average position of all landmarks for each eye along the x-axis, and the average of the eye landmarks with the average of all mouth landmarks, along the y-axis. For the z-axis, we aligned the three foremost landmarks of the nose with the average of all other landmarks. We stored the rotation angles for the first frame in a rotation vector. Starting with the second frame, the rotation vector was subtracted from the current frame and the delta between the current and the last frame was added to the rotation vector. The result were 3D landmarks that were always aligned for the first frame and only changed depending on the movement of the head and face in subsequent frames. For the final preprocessing step, we scaled the 3D landmarks of each frame between zero and one to obtain a uniform input.
3.3. Model Description
As shown in Figure 2, we define three different deep learning models, the audio model , the face model and the supervised model . For and a wide residual network (Zagoruyko and
Komodakis, 2016) with a depth of 22 and a width of 8, while for a depth of 16 and a width of 8 is used. In addition, all residual blocks in the three models are replaced with res2net blocks (Gao
et al., 2019). For the input of , 30 consecutive outputs of the VQ-VAE were added together, to form an input vector of 30x50x1, while for we use the preprocessed 3d landmarks from the face pipeline, resulting in an input vector of 30x68x3. The model receives the concatenated output of the second to last layer from and as input. All the three models have a fully connected layer with a vector size of 4, using a softmax activation function, as their output layer. An overview of the model architecture can be found in Figure 2.
For the input, we define three different data sets: audio input only , landmark input only and combined input , with their respective one-hot label , and . Additionally, we define the unlabeled audio and landmark data and . We let be the predicted class distribution produced by the respective model for the input and be the cross entropy loss, given two probability distributions p and q. We also let and .
For training and , we use the FixMatch algorithm of Sohn et al. with the RandAugment algorithm of Cubuk et al. (Sohn et al., 2020; Cubuk
et al., 2020). We denote the weak and strong augmentations used for the FixMatch algorithm as and , respectively. As the input of and are not natural images we define altered variations of the augmentations used during the semi-supervised training. For , we only translate the input randomly, by up to 15%, omitting the random horizontal flip, while for we reduce the set of possible transformations, by removing the shear and rotation transformations. Due to the scarcity of the desired user states inside the unlabeled data sets, we also define a threshold , given by the threshold of the FixMatch algorithm, and a starting epoch . Starting at epoch , we use a distilled unlabeled data set given by the output of the respective semi-supervised model, in which any of the first three softmax outputs (agreement/disagreement/confusion) exceeds the threshold . Formally, we define and . Given the epoch , the batch size and the unlabeled batch size factor , the two loss function of the semi-supervised models are given as:
| (1) |
| (2) |
| (3) |
During training the two loss functions are combined with the constant hyperparameter , which results in the loss functions and , for the semi-supervised models and , respectively.
| (4) |
| (5) |
The loss function of the model is the cross-entropy loss, given by :
| (6) |
We combine all three loss functions, with two constant hyperparameters and , to receive the final loss function
| (7) |
During the training we minimize the loss function by performing three consecutive forwards steps through the model, followed by the weighted backpropagation step. For the and networks, we take a batch of size from the distilled unlabeled Youtube data set and perform the pseudo labeling and consistency regularization step on them. Together with a labelled batch of size from and , we calculate and on their respective 1x4 dense layers. For the network we take a batch of size from the data set and calculate the cross-entropy loss . With the loss from , and we calculate the final loss and perform the backpropagation step over the whole network. We use the hyperparameters and to balance the influence of the supervised and semi-supervised training.
| Class | Audio only | Face only | Combined |
|---|---|---|---|
| Agreement | 62.6% | 76.2% | 86.7% |
| Disagreement | 46.3% | 75.1% | 75.5% |
| Confusion | 32.3% | 47.6% | 57.1% |
| Neutral | 29.1% | 44.9% | 46.3% |
| Class | Supervised | Semi-Supervised |
|---|---|---|
| Agreement | 79.5% | 86.7% |
| Disagreement | 74.2% | 75.5% |
| Confusion | 48.9% | 57.1% |
| Neutral | 35.5% | 46.3% |
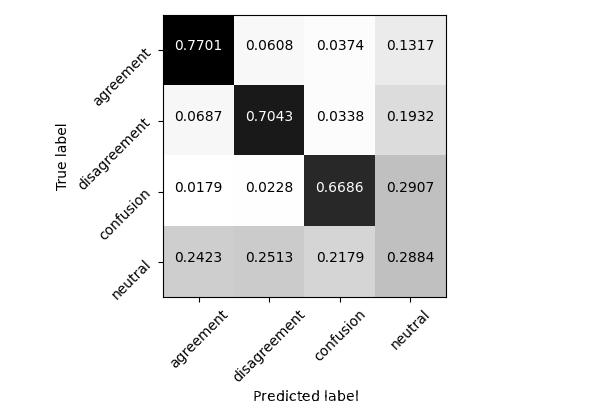
[Supervised Confusion matrix]The confusion matrix of the supervised model, which shows an accuracy of 77% for agreement, 70% for disagreement, 67% for confusion and 29% for neutral.
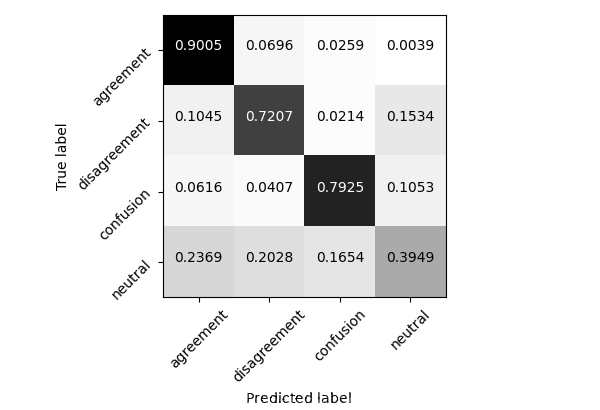
[Semi-Supervised Confusion matrix]The confusion matrix of the semi-supervised model, which shows an accuracy of 90% for agreement, 72% for disagreement, 79% for confusion and 39% for neutral.
| F1 score | ||||||
|---|---|---|---|---|---|---|
| Method | sata set | Features | Data | Agreement | Disagreement | Confusion |
| Hahn et al. (2006) (Hahn et al., 2006) | ICSI data set | Audio Features | 1.800 segments | 75.0% | - | |
| Germesin and Wilson (2009) (Germesin and Wilson, 2009) | AMI Meeting Corpus | Audio Features | 19.600 segments | 45.2% | - | - |
| Wang et al. (2011) (Wang et al., 2011) | DARPA GALE | Audio Features | 2.589 utterances | 57.2% | 51.2% | - |
| Bousmalis et al. (2011) (Bousmalis et al., 2011) | Canal9 data set | Face+Audio+Body Features | 147 episodes | accuracy: 64.2% | - | |
| Rosenthal et al. (2015) (Rosenthal and McKeown, 2015) | ABCD data set | Text Features | 200,000 posts | 58.5% | 73.0% | - |
| Hiray et al. (2018) (Hiray and Duppada, 2018) | ABCD data set | Text Features | 200,000 posts | 80.0% | - | |
| Yang et al. (2016) (Yang et al., 2016) | own data set | Brain wave + Audio Features | 186 minutes | - | - | 87.8% |
| Ni et al (2017) (Ni et al., 2017) | Kaggle data set | Brain wave data | 100 videos | - | - | 73.3% |
| Borges et al. (2019) (Borges et al., 2019) | own data set | Face Action Units | 8.160 segments | - | - | 80.9% |
| ours (supervised) | own data set | Face+Audio Features | 415 segments | 79.5% | 74.2% | 48.9% |
| ours (semi-supervised) | own data set | Face+Audio Features | 415 segments | 86.7% | 75.5% | 57.1% |
4. Results and Discussion
All training was done using the hyperparameters: , , , , , and . The hyperparameters and were determined using the Hyperopt python package (Bergstra
et al., 2013) with a maximum evaluation number of 100. We trained the model on two NVIDIA TESLA V100 with a five fold cross-validation, in which one of the five sets was used for validation, while the other four were used for training and report the average F1-score of the trained models in Table 2. Due to the semi-supervised learning our model has three distinct outputs, the audio only output, the face only output and the combined modality output. we report the average F1-score of the cross-validation for both the single modality models and the combined model, to asses the classification quality of the different models. Comparing the single modality models with the full model shows an increase in F1-score for all four classes when the multimodal approach is used, indicating that the combined model can incorporate the input data from both single modality models successfully.
It can be seen that the audio-only model has the lowest F1-score in all classes and exhibits a higher standard deviation compared to the other models which is expected, as audio data contains more voice variance, due to different voice profiles, and general noise than the face data. In addition, the variance of the model can be a byproduct of the high compression performed by the VQ-VAE. Although the VQ-VAE can reconstruct clearly understandable voice samples, some features could have been lost as the latent output of the model is comparatively small, with only two percent of the input data.
In terms of individual classes, agreement shows the largest increase over the average score for each individual modality at 17.3%, while disagreement and confusion exhibit marginally smaller increases at 14.80% and 17.15%, respectively.
It is noteworthy that the F1-score of the disagree and neutral classes for the multimodal approach show only a small increase in their respective F1-score of 0.4% and 1.4% compared to the face-only model, whereas the agree and confusion classes show a considerably higher increase with 10.5% and 9.5%, respectively. While it was expected that agreement would benefit strongly from the multi model approach, due to the high correlation of features (Bousmalis
et al., 2011), the comparatively low increase of the F1-score for disagreement was unexpected.
For the purpose of investigating the influence of the semi-supervised trained models on the performance of the combined model, we trained all models in a fully supervised manner. A cross-entropy loss was used for all models with the same five fold cross-validation. As can be seen in Table 3, all four classes have an increase in their F1-score, with neutral exhibiting the strongest increase with 10.8%, which shows that the semi-supervised training does have an effect on the performance of the trained models. The high performance gain for the confusion class also shows that complex emotions, which are normally difficult to detect, can benefit greatly from training with unlabeled training data.
To compare the classification errors for each class, we created a confusion matrix for the full semi-supervised model, as well as the supervised model. As can be seen in Figure 4, the supervised model has a very high false positive, as well as a high false negative rate, while the confusion matrix for the semi-supervised model in figure 5 shows a far higher false negative rate than false positive rate. This would suggest, that the semi-supervised model is able to more accurately detect events that it has already seen before than the supervised model, while failing to detect events that differ strongly from the events in the training data. This was expected, as the FixMatch algorithm uses strongly distorted input to enrich the given data, which can increase the robustness of the model.
As can be seen in table 4 our multimodal semi-supervised approach outperforms other models in regards to dis-/agreement classification by up to 6.7%. As we only used 5% of the training data compared to Borges et al. (Borges et al., 2019), we were unable to capture all distinct characteristics of confusion and therefore didn’t reach a comparatively high accuracy for the confusion detection.
As our networks were mostly trained on footage with a still camera, we found that the networks performed similarly well when there was only slight camera movement, but degraded when there was a cut between the cameras or large movements in the camera positions. As currently the preprocessing of the face movement doesn’t take the camera movement into account, this could be alleviated by subtracting the camera movement from the face movement.
5. Conclusion
In this work, we developed and evaluated a method for detecting mental states of users during human-robot interactions, using only a small set of labeled data. We found that semi-supervised networks can extract meaningful user state representations using a small set of labeled data for one modality, which in turn can help to increase the overall performance of a multimodal supervised network when faced with a data scarcity problem. We also showed that modern semi-supervised approaches not only work for image recognition tasks, but also for tasks involving social signals, especially complex social signals such as confusion, increasing the accuracy and robustness of the model. Further research is needed to determine the performance of our approach when different data set are utilized or different unlabeled data is used during training. In the future, we plan and extend our work to a larger number of different modalities and further research the achieved robustness of the model.
References
- (1)
- Amari et al. (1997) S. Amari, N. Murata, K. Müller, M. Finke, and H. Yang. 1997. Asymptotic statistical theory of overtraining and cross-validation. IEEE transactions on neural networks 8 5 (1997), 985–96.
- Baron-Cohen (1996) Simon Baron-Cohen. 1996. Reading the mind in the face: A cross-cultural and developmental study. Visual Cognition 3, 1 (1996), 39–60.
- Bergstra et al. (2013) James Bergstra, Daniel Yamins, and David Cox. 2013. Making a science of model search: Hyperparameter optimization in hundreds of dimensions for vision architectures. In International conference on machine learning. PMLR, 115–123.
- Borges et al. (2019) Niklas Borges, Ludvig Lindblom, Ben Clarke, Anna Gander, and Robert Lowe. 2019. Classifying Confusion: Autodetection of Communicative Misunderstandings using Facial Action Units. 2019 8th International Conference on Affective Computing and Intelligent Interaction Workshops and Demos, ACIIW 2019 (2019), 401–406.
- Bousmalis et al. (2011) Konstantinos Bousmalis, Louis Philippe Morency, and Maja Pantic. 2011. Modeling hidden dynamics of multimodal cues for spontaneous agreement and disagreement recognition. 2011 IEEE International Conference on Automatic Face and Gesture Recognition and Workshops, FG 2011 i (2011), 746–752. https://doi.org/10.1109/FG.2011.5771341
- Bulat and Tzimiropoulos (2017) Adrian Bulat and Georgios Tzimiropoulos. 2017. How far are we from solving the 2D & 3D Face Alignment problem? (and a dataset of 230,000 3D facial landmarks). In International Conference on Computer Vision.
- Cho et al. (2019) Eunah Cho, He Xie, and William M. Campbell. 2019. Paraphrase Generation for Semi-Supervised Learning in. In Proceedings of the Workshop on Methods for Optimizing and Evaluating Neural Language Generation. Association for Computational Linguistics, Stroudsburg, PA, USA, 45–54. https://doi.org/10.18653/v1/W19-2306
- Chorowski et al. (2019) Jan Chorowski, Ron J. Weiss, Samy Bengio, and Aäron Van Den Oord. 2019. Unsupervised speech representation learning using WaveNet autoencoders. IEEE/ACM Transactions on Audio Speech and Language Processing 27, 12 (2019), 2041–2053. https://doi.org/10.1109/TASLP.2019.2938863 arXiv:1901.08810
- Cohen (2003) Shuki Cohen. 2003. A computerized scale for monitoring levels of agreement during a conversation. Proceedings of the 25th Annual Penn Linguistics Colloquium 8, 1 (2003), 57–70.
- Colbert ([n.d.]) Stephen Colbert. [n.d.]. The Late Show with Stephen Colbert - Youtube. https://www.youtube.com/channel/UCMtFAi84ehTSYSE9XoHefig. (Accessed on 08/20/2020).
- Corden ([n.d.]) James Corden. [n.d.]. The Late Late Show with James Corden - Youtube. https://www.youtube.com/user/TheLateLateShow. (Accessed on 08/20/2020).
- Cubuk et al. (2020) Ekin D. Cubuk, Barret Zoph, Jonathon Shlens, and Quoc V. Le. 2020. Randaugment: Practical automated data augmentation with a reduced search space. IEEE Computer Society Conference on Computer Vision and Pattern Recognition Workshops 2020-June (2020), 3008–3017. https://doi.org/10.1109/CVPRW50498.2020.00359 arXiv:1909.13719
- Dhingra et al. (2018) Bhuwan Dhingra, Danish Pruthi, and Dheeraj Rajagopal. 2018. Simple and effective semi-supervised question answering. arXiv (2018), 582–587.
- Dunn et al. (2011) Alan M. Dunn, Owen S. Hofmann, Brent Waters, and Emmett Witchel. 2011. Cloaking malware with the trusted platform module. , 395–410 pages.
- Galley et al. (2004) Michel Galley, Kathleen McKeown, Julia Hirschberg, and Elizabeth Shriberg. 2004. Identifying agreement and disagreement in conversational speech. In Proceedings of the 42nd Annual Meeting on Association for Computational Linguistics - ACL ’04. Association for Computational Linguistics, Morristown, NJ, USA, 669–es. https://doi.org/10.3115/1218955.1219040
- Gao et al. (2019) Shanghua Gao, Ming-Ming Cheng, Kai Zhao, Xin-Yu Zhang, Ming-Hsuan Yang, and Philip HS Torr. 2019. Res2net: A new multi-scale backbone architecture. IEEE transactions on pattern analysis and machine intelligence (2019).
- Geller et al. (2020) Shay A Geller, Nicholas Hoernle, Kobi Gal, Avi Segal, Amy X Zhang, David Karger, Marc T Facciotti, and Michele Igo. 2020. # Confused and beyond: detecting confusion in course forums using students’ hashtags. In Proceedings of the Tenth International Conference on Learning Analytics & Knowledge. 589–594.
- Germesin and Wilson (2009) Sebastian Germesin and Theresa Wilson. 2009. Agreement detection in multiparty conversation. In Proceedings of the 2009 international conference on Multimodal interfaces - ICMI-MLMI ’09. ACM Press, New York, New York, USA, 7. https://doi.org/10.1145/1647314.1647319
- Hahn et al. (2006) Sangyun Hahn, Richard Ladner, and Mari Ostendorf. 2006. Agreement / Disagreement Classification : Exploiting Unlabeled Data using Contrast Classifiers. Computational Linguistics June (2006), 53–56.
- Hillard et al. (2003) Dustin Hillard, Mari Ostendorf, and Elizabeth Shriberg. 2003. Detection of agreement vs. disagreement in meetings. In Proceedings of the 2003 Conference of the North American Chapter of the Association for Computational Linguistics on Human Language Technology companion volume of the Proceedings of HLT-NAACL 2003–short papers - NAACL ’03, Vol. 2. Association for Computational Linguistics, Morristown, NJ, USA, 34–36. https://doi.org/10.3115/1073483.1073495
- Hiray and Duppada (2018) Sushant Hiray and Venkatesh Duppada. 2018. Agree to disagree: Improving disagreement detection with dual GRUs. 2017 7th International Conference on Affective Computing and Intelligent Interaction Workshops and Demos, ACIIW 2017 2018-Janua (2018), 147–152. https://doi.org/10.1109/ACIIW.2017.8272605 arXiv:1708.05582
- Hossein Khaki , Elif Bozkurt (2016) Engin Erzin Hossein Khaki , Elif Bozkurt. 2016. AGREEMENT AND DISAGREEMENT CLASSIFICATION OF DYADIC INTERACTIONS USING VOCAL AND GESTURAL CUES Hossein Khaki , Elif Bozkurt , Engin Erzin Multimedia , Vision and Graphics Lab , Koc. Icassp 2016 (2016), 2762–2766.
- Iscen et al. (2019) Ahmet Iscen, Giorgos Tolias, Yannis Avrithis, and Ondrej Chum. 2019. Label Propagation for Deep Semi-supervised Learning. arXiv:cs.CV/1904.04717
- Jing and Tian (2019) Longlong Jing and Yingli Tian. 2019. Self-supervised Visual Feature Learning with Deep Neural Networks: A Survey. arXiv (feb 2019), 1–24. https://doi.org/10.1109/tpami.2020.2992393 arXiv:1902.06162
- Jo and Cinarel (2019) Hwiyeol Jo and Ceyda Cinarel. 2019. Delta-training: Simple Semi-Supervised Text Classification using Pretrained Word Embeddings. EMNLP-IJCNLP 2019 - 2019 Conference on Empirical Methods in Natural Language Processing and 9th International Joint Conference on Natural Language Processing, Proceedings of the Conference (jan 2019), 3458–3463. https://doi.org/10.18653/v1/d19-1347 arXiv:1901.07651
- Kaliouby and Robinson (2004) Rana El Kaliouby and Peter Robinson. 2004. Real-time inference of complex mental states from facial expressions and head gestures. IEEE Computer Society Conference on Computer Vision and Pattern Recognition Workshops 2004-Janua, January (2004), 0–5. https://doi.org/10.1109/CVPR.2004.427
- Kunz ([n.d.]) James Kunz. [n.d.]. Modern-Day Debate - YouTube. https://www.youtube.com/c/ModernDayDebate. (Accessed on 08/20/2020).
- Lang et al. (2012) Christian Lang, Sven Wachsmuth, Marc Hanheide, and Heiko Wersing. 2012. Facial Communicative Signals. International Journal of Social Robotics 4, 3 (aug 2012), 249–262. https://doi.org/10.1007/s12369-012-0145-z
- Littlewort et al. (2011) Gwen C. Littlewort, Marian S. Bartlett, Linda P. Salamanca, and Judy Reilly. 2011. Automated measurement of children’s facial expressions during problem solving tasks. 2011 IEEE International Conference on Automatic Face and Gesture Recognition and Workshops, FG 2011 (2011), 30–35. https://doi.org/10.1109/FG.2011.5771418
- Maas et al. (2013) Andrew L Maas, Awni Y Hannun, and Andrew Y Ng. 2013. Rectifier nonlinearities improve neural network acoustic models. in ICML Workshop on Deep Learning for Audio, Speech and Language Processing 28 (2013).
- NewsHour ([n.d.]) PBS NewsHour. [n.d.]. PBS NewsHour - Youtube. https://www.youtube.com/playlist?list=PLgawtcOBBjr8o6ZfuuzSMpkz9E_a-LJRQ. (Accessed on 08/20/2020).
- Ni et al. (2017) Zhaoheng Ni, Ahmet Cem Yuksel, Xiuyan Ni, Michael I Mandel, and Lei Xie. 2017. Confused or not confused? Disentangling brain activity from EEG data using bidirectional LSTM recurrent neural networks. In Proceedings of the 8th ACM International Conference on Bioinformatics, Computational Biology, and Health Informatics. 241–246.
- Norton ([n.d.]) Graham Norton. [n.d.]. The Graham Norton Show - Youtube. https://www.youtube.com/c/OfficialGrahamNorton. (Accessed on 08/20/2020).
- Ouali et al. (2020) Yassine Ouali, Céline Hudelot, and Myriam Tami. 2020. An Overview of Deep Semi-Supervised Learning. (2020), 1–43. arXiv:2006.05278 http://arxiv.org/abs/2006.05278
- Pantic and Rothkrantz (2003) Maja Pantic and Leon J.M. Rothkrantz. 2003. Toward an affect-sensitive multimodal human-computer interaction. Proc. IEEE 91, 9 (2003), 1370–1390. https://doi.org/10.1109/JPROC.2003.817122
- Parthasarathy and Busso (2020) Srinivas Parthasarathy and Carlos Busso. 2020. Semi-supervised speech emotion recognition with ladder networks. IEEE/ACM transactions on audio, speech, and language processing 28 (2020), 2697–2709.
- Rosenthal and McKeown (2015) Sara Rosenthal and Kathy McKeown. 2015. I Couldn’t Agree More: The Role of Conversational Structure in Agreement and Disagreement Detection in Online Discussions. In Proceedings of the 16th Annual Meeting of the Special Interest Group on Discourse and Dialogue. Association for Computational Linguistics, Prague, Czech Republic, 168–177. https://doi.org/10.18653/v1/W15-4625
- Sheerman-Chase et al. (2009) Tim Sheerman-Chase, Eng-Jon Ong, and Richard Bowden. 2009. Feature selection of facial displays for detection of non verbal communication in natural conversation. In 2009 IEEE 12th International Conference on Computer Vision Workshops, ICCV Workshops. IEEE, 1985–1992. https://doi.org/10.1109/ICCVW.2009.5457525
- Sohn et al. (2020) Kihyuk Sohn, David Berthelot, Chun Liang Li, Zizhao Zhang, Nicholas Carlini, Ekin D. Cubuk, Alex Kurakin, Han Zhang, and Colin Raffel. 2020. FixMatch: Simplifying semi-supervised learning with consistency and confidence. arXiv NeurIPS (2020). arXiv:2001.07685
- Tomar (2006) Suramya Tomar. 2006. Converting video formats with FFmpeg. Linux Journal 2006, 146 (2006), 10.
- van den Oord et al. (2017) Aaron van den Oord, Oriol Vinyals, and Koray Kavukcuoglu. 2017. Neural Discrete Representation Learning. Advances in Neural Information Processing Systems 2017-Decem, Nips (nov 2017), 6307–6316. arXiv:1711.00937 http://arxiv.org/abs/1711.00937
- van Engelen and Hoos (2020) Jesper E. van Engelen and Holger H. Hoos. 2020. A survey on semi-supervised learning. Machine Learning 109, 2 (2020), 373–440. https://doi.org/10.1007/s10994-019-05855-6
- Vrigkas et al. (2017) Michalis Vrigkas, Christophoros Nikou, and Ioannis A. Kakadiaris. 2017. Identifying Human Behaviors Using Synchronized Audio-Visual Cues. IEEE Transactions on Affective Computing 8, 1 (2017), 54–66. https://doi.org/10.1109/TAFFC.2015.2507168
- Wang et al. (2011) Wen Wang, Sibel Yaman, Kristin Precoda, Colleen Richey, and Geoffrey Raymond. 2011. Detection of agreement and disagreement in broadcast conversations. ACL-HLT 2011 - Proceedings of the 49th Annual Meeting of the Association for Computational Linguistics: Human Language Technologies 2 (2011), 374–378.
- Yang et al. (2016) Jingkang Yang, Haohan Wang, Jun Zhu, and Eric P. Xing. 2016. SeDMiD for Confusion Detection: Uncovering Mind State from Time Series Brain Wave Data. 1 (nov 2016), 1–11. arXiv:1611.10252 http://arxiv.org/abs/1611.10252
- Zagoruyko and Komodakis (2016) Sergey Zagoruyko and Nikos Komodakis. 2016. Wide Residual Networks. British Machine Vision Conference 2016, BMVC 2016 2016-September (2016), 87.1–87.12. https://doi.org/10.5244/C.30.87 arXiv:1605.07146
- Zeng et al. (2017) Ziheng Zeng, Snigdha Chaturvedi, and Suma Bhat. 2017. Learner Affect through the Looking Glass: Characterization and Detection of Confusion in Online Courses. International Educational Data Mining Society (2017).
- Zhai et al. (2019) Xiaohua Zhai, Avital Oliver, Alexander Kolesnikov, and Lucas Beyer. 2019. S4L: Self-Supervised Semi-Supervised Learning. arXiv:cs.CV/1905.03670
- Zhou et al. (2018) Yun Zhou, Tao Xu, Shiqian Li, and Shaoqi Li. 2018. Confusion State Induction and EEG-based Detection in Learning. In 2018 40th Annual International Conference of the IEEE Engineering in Medicine and Biology Society (EMBC). IEEE, 3290–3293.
- Zhu (2008) Xiaojin Zhu. 2008. Semi-Supervised Learning Literature Survey Contents. SciencesNew York 10, 1530 (2008), 10. https://doi.org/10.1.1.146.2352 arXiv:1412.6596