Optically induced anisotropy in time-resolved scattering: Imaging molecular scale structure and dynamics in disordered media with experiment and theory
Abstract
Time-resolved scattering experiments enable imaging of materials at the molecular scale with femtosecond time resolution. However, in disordered media they provide access to just one radial dimension thus limiting the study of orientational structure and dynamics. Here we introduce a rigorous and practical theoretical framework for predicting and interpreting experiments combining optically induced anisotropy and time-resolved scattering. Using impulsive nuclear Raman and ultrafast X-ray scattering experiments of chloroform and simulations, we demonstrate that this framework can accurately predict and elucidate both the spatial and temporal features of these experiments.
The characterization of the structure and dynamics of disordered media ranging from liquids to solutions and glasses with atomic resolution remains a formidable challenge. Whether using X-rays, neutrons, or electrons to characterize the structure of these systems the orientational averaging associated with isotropic samples reduces the structural information to a single radial dimension inhibiting the ability to resolve the orientational structure and dynamics.
The situation becomes even more vexing when the goal extends to understanding the dynamics of liquids and solutions with atomic resolution. Accessing this information requires techniques that can probe timescales from tens of femtoseconds to hundreds of picoseconds corresponding to frequencies ranging from 0.1 to 1,000 cm-1. While ultrafast nonlinear spectroscopies can be used to investigate dynamics in this temporal range, they do not provide a direct link to the underlying structural changes occurring, necessitating their combination with other techniques, such as simulation, to infer these connections [1]. In contrast, inelastic X-ray and neutron scattering measurements provide access to the required spatial resolution, but in practice the low count rates of the measurements limit their impact [2, 3, 4].
The advent of intense ultrafast X-ray laser sources has enabled the combination of ultrafast non-linear optical excitation methods and X-ray scattering to access the dynamics of liquids and solutions in the femtosecond temporal and Ångström spatial dimensions [5, 6, 7, 8]. In particular, impulsive nuclear Raman and X-ray scattering (INXS) combines non-resonant impulsive stimulated Raman scattering (ISRS) interactions, which excite Raman active vibrational and rotational motions [9, 10, 11] and generate non-equilibrium nuclear geometries, with ultrafast time-resolved elastic X-ray scattering to probe these structural dynamics [12, 13]. INXS has recently been experimentally realized [14, 12, 13] and offers the potential to obtain radial and orientational structure and dynamics of liquids on the Ångström to nanometer length scale and the femtosecond to picosecond time scale. By generating changes in both the radial and orientational order of disordered media, ISRS interactions can generate both isotropic and anisotropic changes in the structure factor, thus extending radial information present in INXS to a second spatial (orientational) dimension. These developments thus present a tremendous opportunity for combining optically induced anisotropic excitations with nuclear scattering probes such as ISRS with X-ray scattering to transform our understanding of the structure and dynamics of disordered media.
To elucidate and harness the rich information present in experiments which exploit the combination of optically induced anisotropy and time-resolved scattering and inspire future developments, it is essential to develop quantitatively predictive theories that can reproduce experimental signals and provide an interpretational framework of these cutting edge measurements. Here we derive a rigorous and practical quantum mechanical framework in the linear response limit for predicting and interpreting experiments involving optically induced anisotropy combined with time-resolved scattering. By performing INXS experiments of liquid cholorform and simulations of our theory based on a polarizable force field [15], we show that our approach provides a quantitative description of the INXS signal and thus provides a robust and clear foundation for understanding and interpreting INXS experiments that can be extended to other liquids and solutions.
From both a theoretical and interpretational perspective, the linear response formulation [1] offers numerous advantages. By employing this formulation we cast the system’s nonequilibrium response to light-matter interactions in terms of equilibrium time correlation functions, which allows one to elucidate a system’s inherent response rather than one that depends on the details of the nonequilibrium simulation designed to mirror the physical process being probed. This formulation incorporates the optical and X-ray pulses through a convolution with the system’s inherent response, allowing one to also study the effect of pulse shaping on the signal. When taken to the classical limit of the nuclei, our approach permits the use of the well developed toolbox of atomistic simulation techniques to simulate the INXS signal.
To formulate our theory, we consider the features of the INXS experiment. INXS initially pumps the sample with an electronically and vibrationally off-resonant optical pulse and then probes it with an off-resonant X-ray pulse, leading to a time-resolved scattering pattern on the detector plane (SI Fig.1). The frequency dependence of the INXS signal recovers Raman active modes (see Fig. 2). Hence, INXS is a third-order nonlinear scattering method with the initial interaction consisting of an optical Raman excitation followed by a scattering interaction [12, 13].
We thus employ an expansion of the system’s density matrix to third-order in the light-matter coupling [1, 16] subject to the INXS sequence of excitation and scattering interactions. In SI Sec. 1, we first derive a rigorous quantum mechanical expression for the INXS signal and then demonstrate how INXS experiments permit a series of well-controlled approximations [17, 18, 19, 20, 21, 22, 23, 24, 25, 26, 27, 28, 29, 30, 31, 32, 33, 1, 34, 35, 36, 37] that result in an expression for the INXS signal at time after the initial excitation that is compatible with direct atomistic simulations,
| (1) |
where is given in Eq. 3, is the electric field envelope for the optical interaction and
| (2) |
Here is the INXS response function in the limit of classical nuclei (for the quantum mechanical expression, see SI Eq. 37) that correlates the Raman excitation at , given by the linear combination of polarizability tensor elements, with the X-ray scattering pattern at time , given by the -cut (perpendicular to the -propagation-direction of the incoming X-ray probe) of the X-ray scattering operator, . While our expression can be combined with a range of methods to treat , in our simulations below we employ the widely adopted independent atom model [23, 24].
An immediate success of our expression for the INXS signal, Eq. 1, lies in the derived proportionality constant,
| (3) |
which offers testable predictions of the scaling of the INXS signal with respect to the experimental setup and strengths and frequencies of the light pulses. In particular, predicts that the INXS signal is strongest when the incoming and scattered X-ray are collinearly polarized, (), and diminishes to zero when perpendicular (). It also depends quadratically on the magnitude of the electric field for the optical () and incoming ( and scattered () X-ray pulses, and is inversely proportional to the square of the frequencies for the optical () and incoming () and scattered () X-ray pulses. Our experiments have confirmed all these predictions, providing support for applicability of our linear response theory treatment of the INXS interactions.
A fundamental question that arises in the theoretical treatment of the INXS experiment is when an anisotropic INXS signal will emerge from a homogeneous and isotropic system. Equation 2 shows that the anisotropic signal arises from the instantaneous correlation of the components of the polarizability tensor, , that depend on the global nuclear configuration, , and the cut of the modified structure factor, , that arises from a constrained Fourier transform () of the microscopic positions of all atoms in the system. Equation 2 also shows that systems characterized by an isotropic polarizability tensor, and where , can only produce isotropic INXS signals.
This is because the linear combination of the polarizability tensor elements in Eq. 2 is set by the polarization of the optical pulse, , which is taken to be in the plane (see SI Fig. 1), and leads to . This is because the polarization of the optical pulse, whether it is linearly or circularly polarized, sets the linear combination of the polarizability tensor elements in Eq. 2 (SI Eq. 33). For instance, an optical pulse linearly polarized at an angle with respect to the - plane, , as is the case in our experiment (see SI Fig. 1), leads to . As such, when and , the resulting INXS signal would have no dependence on the detector plane and therefore no anisotropic component. Hence, the anisotropy of the INXS signal arises from the filtering of the wavevector-restricted structure factor, , imposed by the anisotropy of the polarizability tensor, , of the entire system which depends on the global nuclear configuration of the sample. As the experimental and simulation results below demonstrate, the INXS signal provides an avenue to break the symmetry of an X-ray scattering pattern as filtered through the nuclear position-dependent polarizability tensor and analyze how its time evolution reveals the connection between structural rearrangements and energy relaxation pathways in complex liquids.
To assess the ability to understand and interpret INXS experiments using this theoretical approach we performed INXS experiments (SI Sec. 2) at the XPP endstation of the LCLS X-ray free electron laser (XFEL). The pump was an 800 nm, 50 fs full-width at half-maximum (FWHM) ultrafast laser pulse and the probe was an 8.8 keV monochromatic, 40 fs FWHM X-ray pulse. Both pulses were linearly polarized with about a 30°angle between the two polarizations. The sample, liquid chloroform (CHCl3) at room temperature, was delivered to the interaction point with a 50 µm diameter fused silica capillary based cylindrical jet. We detected the scattered X-rays with the CSPAD large area detector [38], for scattering vectors () up to 4.5 Å-1. The experimental time resolution was measured to be 70 fs FWHM using a water sample as reference. During the experiment, it was verified that the anisotropic difference scattering signal increases linearly with pump pulse energy.
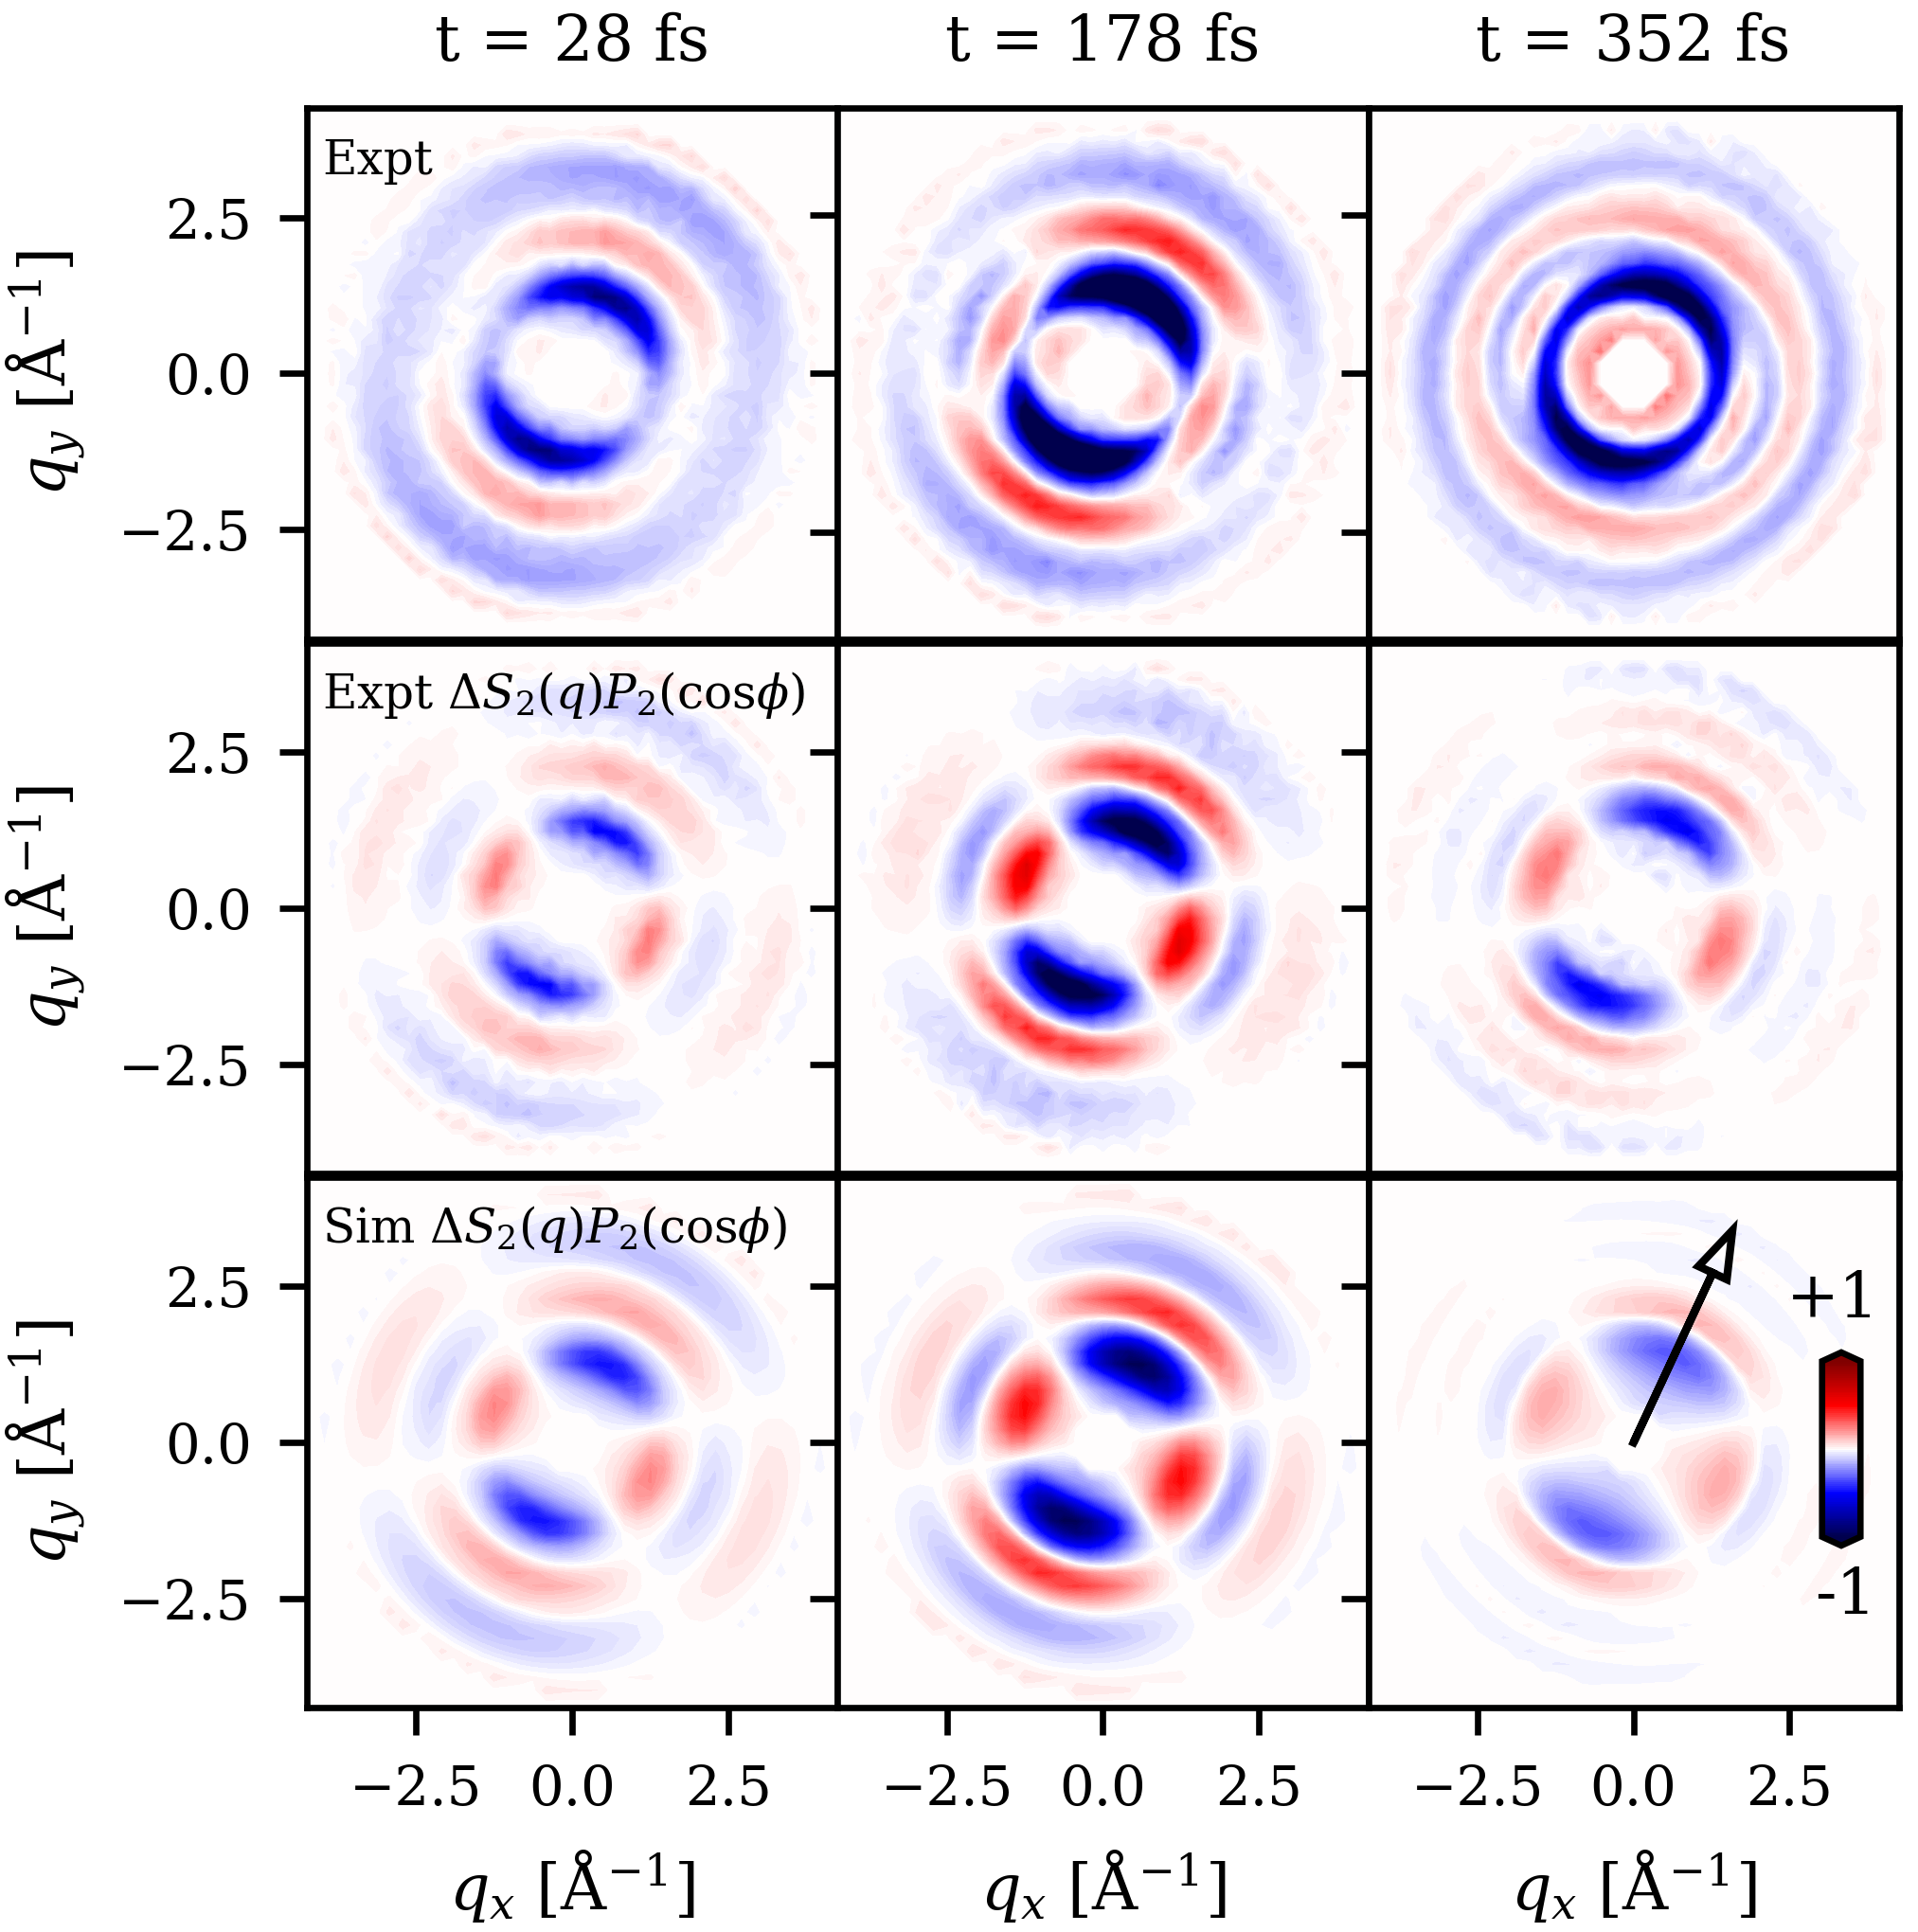
The top row of Fig. 1 compares the difference INXS signal, , relative to the equilibrium elastic X-ray scattering signal, measured at times from 28 fs to 352 fs after excitation. This signal exhibits strong anisotropy that increases for the first 200 fs, followed by a decay over the next few picoseconds that leaves an isotropic background signal due to an increase in liquid temperature of 18 K arising from the pump excitation (SI Sec. 2 and SI Fig. 2). The prominent anisotropic nature of the signal highlights the utility of this approach in obtaining orientationally resolved structure and dynamics in the isotropic sample. To isolate the anisotropic component, we exploit the fact that the INXS signal can be accurately decomposed [39, 40, 41, 42, 43, 44, 26] in terms of just the zeroth (isotropic) and second order (anisotropic) Legendre polynomials with negligible higher order contributions (SI Fig. 3 and 4). The ability to decompose the signal into the zeroth and second order Lengendre polynomials alone is consistent with what is expected for ISRS and the theory formulated in SI Sec. 1. The middle and bottom rows of Fig. 1 show the anisotropic contribution to the INXS signal () obtained from both experiment and molecular dynamics simulations (see SI Sec. 4) of the theoretical treatment of INXS introduced here. The excellent agreement between the experimental and simulated across the full time and scattering wavevector () ranges probed demonstrates that the anisotropic component of the INXS signal can be accurately captured within linear response using our theoretical approach when combined with a polarizable force field treatment of chloroform.
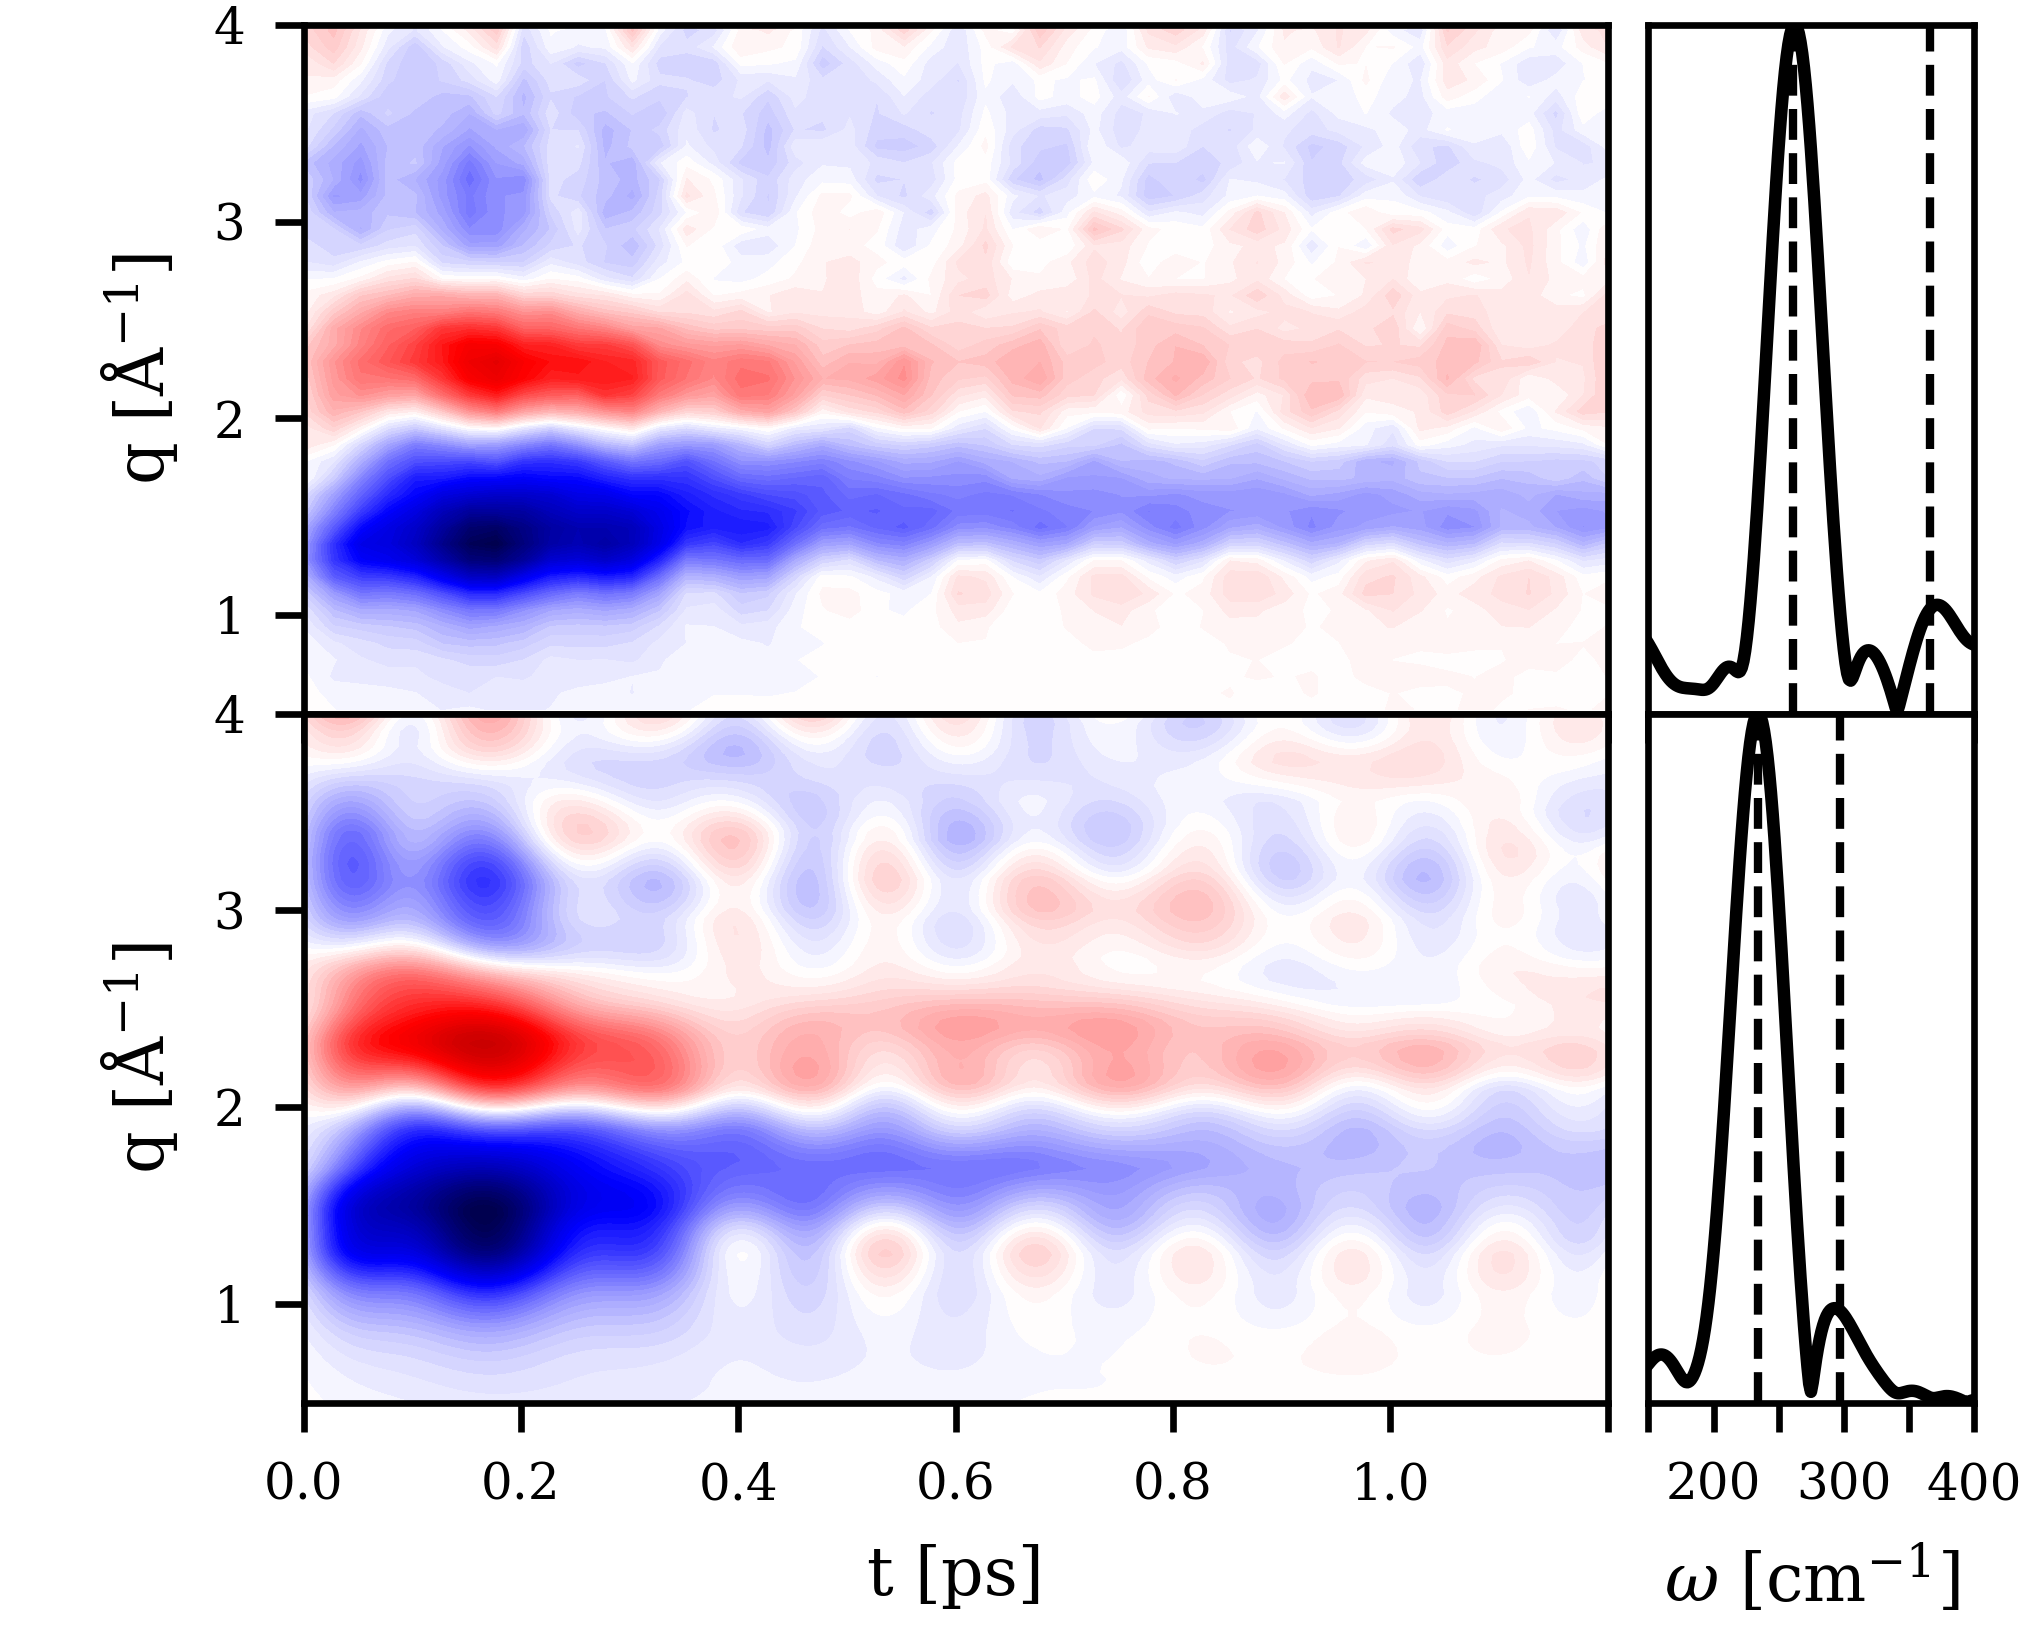
To provide further insight into the time evolution of the anisotropic () component of the INXS difference signal, Fig. 2 shows the scattering wavevector () dependence of the signal for 1.2 ps following the initial excitation. Here the excellent agreement between the experiment and theory across the entire time range shown is even more evident with both exhibiting pronounced oscillatory features in the high region while the low region exhibits more non-oscillatory features indicative of diffusive dynamics. To elucidate the physical origins of these oscillatory features, the right hand panel of Fig. 2 contains the frequency dependence of the anisotropic signal (see SI Sec. 6). From this we observe that the anisotropic signal has a large component at 261 cm-1 for the experiment and at 234 cm-1 for the simulation. The source of this frequency can be explained by considering the normal modes of the chloroform molecule (SI Table. 1). Of chloroform’s nine normal modes, six fall outside the current resolvable frequency range of the experiment ( cm-1), due to the temporal width of the excitation pulse. Of the three remaining normal modes, one is a doubly degenerate ( symmetry) vibration and appears at a frequency of 261 cm-1 with the other an ( symmetry) vibration at 366 cm-1 in the experimental Raman spectrum of the liquid [45]. We note that in the force field simulation, these modes appear in the Raman spectrum at 234 cm-1 and 298 cm-1 respectively (SI Fig. 5). The frequencies and symmetries of the intramolecular vibrations observed with INXS match the expectations established by polarized Raman scattering and ISRS. Specifically, the lower frequency asymmetric CCl bend (261 cm-1, symmetry) should predominantly appear in the anisotropic INXS signal, while the higher frequency symmetric CCl bend (366 cm-1, symmetry) should predominantly appear in the isotropic INXS signal [45]. The experimental and simulated INXS signals confirm these expectations (right panels of Fig 2). However, to understand the less oscillatory anharmonic intermolecular modes probed by the experiment it is useful to consider how the signal varies in time as a function of position.
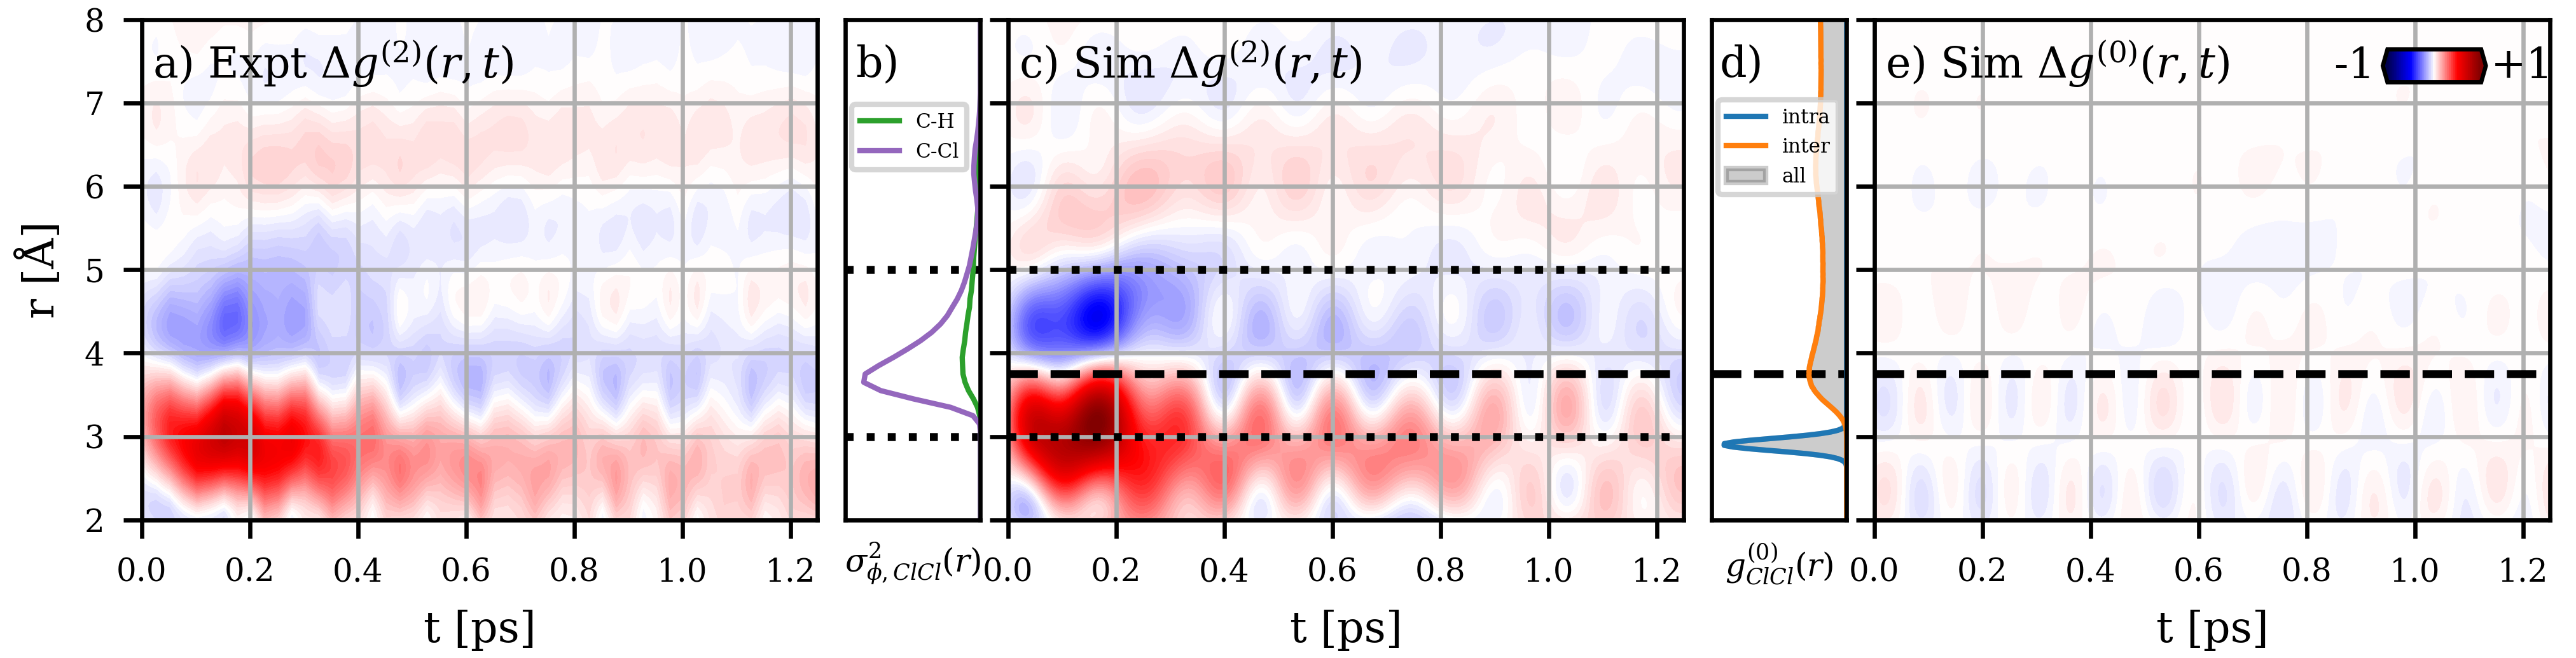
To discern the more diffusive intermolecular contributions from the more oscillatory intramolecular contributions to the INXS signal, Fig. 3 shows results of transforming both the isotropic and anisotropic components to real space where the spatial extent of these features helps identify their origins. Since chlorine atoms are by far the largest scatterers in this system, with an atomic form factor nearly three-fold greater than that of the other atoms, one would expect the INXS signal to be dominated by chlorine-chlorine scattering. This is indeed the case in the simulations where, as demonstrated in SI Fig. 7, we can exactly extract the chlorine-chlorine contributions to the signal to leave only a small residual. By exploiting this realization, as shown in SI Sec. 7, the transformation of the experimental signal to real space and its physical interpretation can be simplified considerably.
While our primary focus is the physical interpretation of the anisotropic information that INXS reveals, it is instructive to first consider the content of the isotropic component. In particular, one can connect the isotropic component, , to the difference pair distribution function
| (4a) | ||||
| (4b) | ||||
where is the -th order spherical Bessel function (see SI Sec. 7). Equation 4b introduces the well known expression for the angular average over the polar angle (see SI Sec. 7), which in the case of a conventional X-ray scattering signal corresponds to the circularly symmetric signal on the detector plane. Applying Eq. 4a to the isotropic component of the simulated signal yields the difference pair distribution function shown in Fig. 3e, where we see oscillations from the 293 cm-1 chloroform mode centered around the first intramolecular peak of .
A similar transformation gives access to the real space information contained in the anisotropic INXS signal. Specifically, we apply the second order Bessel transformation to ,
| (5a) | ||||
| (5b) | ||||
By comparing the expression in Eq. 5b to the expression for the standard difference pair distribution function in Eq. 4b and noting that , we see that that this procedure yields a difference generalized pair distribution function that encapsulates the angularly resolved fluctuations of the distribution following the symmetry of the second-order Legendre polynomial . thus provides a direct measure of fluctuations in the projection of the pair distribution onto the anisotropic polarizability. This anisotropic component of the INXS signal mirrors the symmetry of the second-order Legendre polynomial, which displays a pattern with two pairs of positive and negative lobes around the circle, and when fully averaged across the circle would disappear. This additional information expands on that provided by conventional X-ray and neutron scattering experiments which only provide the isotropic averaging shown in Eq. 4b. The transformation of the simulated to real space, , as shown in Fig. 3c allows us to determine the origins of the non-oscillatory features in the signal. For example, the non-oscillatory feature that peaks at 200 fs and subsequently decays straddles the first intermolecular chlorine-chlorine peak of the simulated centered at 3.75 Å. This suggests that it arises from motions following excitation that lead to purely intermolecular redistribution. This is confirmed in SI Fig. 8 where we exactly decompose the simulated INXS signal into its intra- and intermolecular components where the intramolecular component lacks this feature. In contrast, this non-oscillatory intermolecular peak does not appear in the isotropic signal. Hence, the Raman excitation causes an anisotropic orientational rearrangement of neighboring chloroform molecules (angularly distributed according to the second-order Legendre polynomial) that conserves the average intermolecular chlorine-chlorine distance. To provide insight into the local molecular arrangements that lead to the non-oscillatory positive and negative feature at 200 fs in the region 3-5 Å in , we consider the density fluctuations of chlorine that dominate the anisotropic response in the real space INXS signal. Since arises from anisotropic orientational rearrangements, the experimental signal at a particular distance is sensitive to the variance of the angular distribution (Fig. 3b) at that distance, i.e. if there is no angular variation in the molecular density at that distance, the signal will be isotropic and will not contribute to . Figure 3b shows the variance of the angular distribution of the chlorine-chlorine radial distribution function along the two principal symmetry axes of the chloroform molecule: the C-H axis and the Cl-C-Cl bisector perpendicular to the C-H axis (see SI Sec. 10). From this, one can see that for both axes the variance of the angular distribution is largest in the region 3-5 Å consistent with the regions of the greatest signal in (dotted lines in Fig. 3c). This can be seen even more clearly in SI Fig. 7 where the we show just the intermolecular obtained from the simulations. Thus, by breaking the symmetry of an isotropic sample through the directionality of a Raman interaction, the real space anisotropic INXS signal reveals an angularly resolved microscopic density and orientational fluctuations in chemical, biological, and materials systems with fs and Å level resolution as a response to an impulsive excitation. The theoretical and simulation framework presented here offers the opportunity to obtain and understand the unique orientational structure and dynamical information about the molecular to nanoscopic structure of liquids and glasses present in experiments that harness optically induced anisotropy in time-resolved scattering.
This work was supported by the U.S. Department of Energy, Office of Science, Basic Energy Sciences, Chemical Sciences, Geosciences, and Biosciences Division. The authors wish to acknowledge LCLS staff including T. Sato, J. Glownia, D. Zhu, S. Nelson and A. Robert for experimental support and helpful discussion. Use of the Linac Coherent Light Source (LCLS), SLAC National Accelerator Laboratory, is supported by the U.S. Department of Energy, Office of Science, Office of Basic Energy Sciences under Contract No. DE-AC02-76SF00515. This research used resources of the National Energy Research Scientific Computing Center (NERSC), a U.S. Department of Energy Office of Science User Facility operated under Contract No. DE-AC02-05CH11231.
References
- Mukamel [1995] S. Mukamel, Principles of Nonlinear Optical Spectroscopy (Oxford University Press, New York, 1995).
- Sette et al. [1998] F. Sette, M. H. Krisch, C. Masciovecchio, G. Ruocco, and G. Monaco, Dynamics of glasses and glass-forming liquids studied by inelastic X- ray scattering, Science 280, 1550 (1998).
- Teixeira et al. [1985a] J. Teixeira, M. C. Bellissent-Funel, S. H. Chen, and B. Dorner, Observation of new short-wavelength collective excitations in heavy water by coherent inelastic neutron scattering, Physical Review Letters 54, 2681 (1985a).
- Teixeira et al. [1985b] J. Teixeira, M. C. Bellissent-Funel, S. H. Chen, and A. J. Dianoux, Experimental determination of the nature of diffusive motions of water molecules at low temperatures, Physical Review A 31, 1913 (1985b).
- Kim et al. [2021] J. G. Kim, E. H. Choi, Y. Lee, and H. Ihee, Femtosecond X-ray Liquidography Visualizes Wavepacket Trajectories in Multidimensional Nuclear Coordinates for a Bimolecular Reaction, Accounts of Chemical Research 54, 1685 (2021).
- Chergui and Collet [2017] M. Chergui and E. Collet, Photoinduced Structural Dynamics of Molecular Systems Mapped by Time-Resolved X-ray Methods, Chemical Reviews 117, 11025 (2017).
- Gaffney [2021] K. J. Gaffney, Capturing photochemical and photophysical transformations in iron complexes with ultrafast X-ray spectroscopy and scattering, Chemical Science 12, 8010 (2021).
- Biasin et al. [2021] E. Biasin, Z. W. Fox, A. Andersen, K. Ledbetter, K. S. Kjær, R. Alonso-Mori, J. M. Carlstad, M. Chollet, J. D. Gaynor, J. M. Glownia, K. Hong, T. Kroll, J. H. Lee, C. Liekhus-Schmaltz, M. Reinhard, D. Sokaras, Y. Zhang, G. Doumy, A. M. March, S. H. Southworth, S. Mukamel, K. J. Gaffney, R. W. Schoenlein, N. Govind, A. A. Cordones, and M. Khalil, Direct observation of coherent femtosecond solvent reorganization coupled to intramolecular electron transfer, Nature Chemistry 13, 343 (2021).
- Vohringer and Scherer [1995] P. Vohringer and N. F. Scherer, Transient grating optical heterodyne detected impulsive stimulated raman scattering in simple liquids, Journal of Physical Chemistry 99, 2684 (1995).
- Dhar et al. [1994] L. Dhar, J. A. Rogers, and K. A. Nelson, Time-Resolved Vibrational Spectroscopy in the Impulsive Limit, Chemical Reviews 94, 157 (1994).
- Loughnane et al. [1999] B. J. Loughnane, A. Scodinu, R. A. Farrer, J. T. Fourkas, and U. Mohanty, Exponential intermolecular dynamics in optical Kerr effect spectroscopy of small-molecule liquids, Journal of Chemical Physics 111, 2686 (1999).
- Ki et al. [2021] H. Ki, S. Choi, J. Kim, E. H. Choi, S. Lee, Y. Lee, K. Yoon, C. W. Ahn, D.-S. Ahn, J. H. Lee, J. Park, I. Eom, M. Kim, S. H. Chun, J. Kim, H. Ihee, and J. Kim, Optical Kerr Effect of Liquid Acetonitrile Probed by Femtosecond Time-Resolved X-ray Liquidography, Journal of the American Chemical Society (2021).
- Kim et al. [2020] K. H. Kim, A. Späh, H. Pathak, C. Yang, S. Bonetti, K. Amann-Winkel, D. Mariedahl, D. Schlesinger, J. A. Sellberg, D. Mendez, G. Van Der Schot, H. Y. Hwang, J. Clark, O. Shigeki, T. Tadashi, Y. Harada, H. Ogasawara, T. Katayama, A. Nilsson, and F. Perakis, Anisotropic X-Ray Scattering of Transiently Oriented Water, Physical Review Letters 125, 76002 (2020).
- Biasin et al. [2016] E. Biasin, T. B. Van Driel, K. S. Kjær, A. O. Dohn, M. Christensen, T. Harlang, P. Chabera, Y. Liu, J. Uhlig, M. Pápai, Z. Németh, R. Hartsock, W. Liang, J. Zhang, R. Alonso-Mori, M. Chollet, J. M. Glownia, S. Nelson, D. Sokaras, T. A. Assefa, A. Britz, A. Galler, W. Gawelda, C. Bressler, K. J. Gaffney, H. T. Lemke, K. B. Møller, M. M. Nielsen, V. Sundström, G. Vankó, K. Wärnmark, S. E. Canton, and K. Haldrup, Femtosecond X-Ray Scattering Study of Ultrafast Photoinduced Structural Dynamics in Solvated [Co (terpy)2] 2+, Physical Review Letters 117, 13002 (2016).
- Mu et al. [2014] X. Mu, Q. Wang, L. P. Wang, S. D. Fried, J. P. Piquemal, K. N. Dalby, and P. Ren, Modeling organochlorine compounds and the -hole effect using a polarizable multipole force field, Journal of Physical Chemistry B 118, 6456 (2014).
- Tanaka et al. [2001] S. Tanaka, V. Chernyak, and S. Mukamel, Time-resolved x-ray spectroscopies: Nonlinear response functions and Liouville-space pathways, Physical Review A 63, 14 (2001).
- Cho et al. [1993] M. Cho, G. R. Fleming, and S. Mukamel, Nonlinear response functions for birefringence and dichroism measurements in condensed phases, The Journal of Chemical Physics 98, 5314 (1993).
- Yan and Mukamel [1991] Y. J. Yan and S. Mukamel, Pulse shaping and coherent Raman spectroscopy in condensed phases, The Journal of Chemical Physics 94, 997 (1991).
- Tanimura and Mukamel [1993] Y. Tanimura and S. Mukamel, Two-dimensional femtosecond vibrational spectroscopy of liquids, The Journal of Chemical Physics 99, 9496 (1993).
- Luber et al. [2014] S. Luber, M. Iannuzzi, and J. Hutter, Raman spectra from ab initio molecular dynamics and its application to liquid S -methyloxirane, Journal of Chemical Physics 141, 10.1063/1.4894425 (2014).
- Long [2002] D. A. Long, The Raman Effect: A Unified Treatment of the Theory of Raman Scattering by Molecules (John Wiley & Sons, Ltd, 2002).
- Dixit et al. [2012] G. Dixit, O. Vendrell, and R. Santra, Imaging electronic quantum motion with light, Proceedings of the National Academy of Sciences 109, 11636 (2012).
- Møller and Henriksen [2012] K. B. Møller and N. E. Henriksen, Time-Resolved X-Ray Diffraction: The Dynamics of the Chemical Bond, in Molecular Electronic Structures of Transition Metal Complexes I, edited by D. M. P. Mingos, P. Day, and J. P. Dahl (Springer Berlin Heidelberg, Berlin, Heidelberg, 2012) pp. 185–211.
- Helliwell and Rentzepis [1997] J. R. Helliwell and P. M. Rentzepis, eds., Time-resolved diffraction (Clarendon Press, Oxford, 1997).
- Coppens [1992] P. Coppens, Electron Density from X-Ray Diffraction, Annual Review of Physical Chemistry 43, 663 (1992).
- Ben-Nun et al. [1997] M. Ben-Nun, J. Cao, and K. R. Wilson, Ultrafast X-ray and electron diffraction: Theoretical considerations, Journal of Physical Chemistry A 101 (1997).
- Cao and Wilson [1998] J. Cao and K. R. Wilson, Ultrafast X-ray Diffraction Theory, Journal of Physical Chemistry A 102, 9523 (1998).
- Rozgonyi et al. [2005] T. Rozgonyi, R. Sauerbrey, and T. Feurer, Time-resolved x-ray diffraction in a molecular crystal, Journal of Applied Physics 97 (2005).
- Dohn et al. [2015] A. O. Dohn, E. Biasin, K. Haldrup, M. M. Nielsen, N. E. Henriksen, and K. B. Møller, On the calculation of x-ray scattering signals from pairwise radial distribution functions, Journal of Physics B: Atomic, Molecular and Optical Physics 48 (2015).
- Moreno Carrascosa et al. [2017] A. Moreno Carrascosa, T. Northey, and A. Kirrander, Imaging rotations and vibrations in polyatomic molecules with X-ray scattering, Physical Chemistry Chemical Physics 19, 7853 (2017).
- Northey et al. [2014] T. Northey, N. Zotev, and A. Kirrander, Ab initio calculation of molecular diffraction, Journal of Chemical Theory and Computation 10, 4911 (2014).
- Northey et al. [2016] T. Northey, A. Moreno Carrascosa, S. Schäfer, and A. Kirrander, Elastic X-ray scattering from state-selected molecules, Journal of Chemical Physics 145, 10.1063/1.4962256 (2016).
- Moreno Carrascosa et al. [2019] A. Moreno Carrascosa, H. Yong, D. L. Crittenden, P. M. Weber, and A. Kirrander, Ab Initio Calculation of Total X-ray Scattering from Molecules, Journal of Chemical Theory and Computation 15, 2836 (2019).
- Egorov et al. [1999] S. A. Egorov, K. F. Everitt, and J. L. Skinner, Quantum Dynamics and Vibrational Relaxation, Journal of Physical Chemistry A 103, 9494 (1999).
- Craig and Manolopoulos [2004] I. R. Craig and D. E. Manolopoulos, Quantum statistics and classical mechanics: Real time correlation functions from ring polymer molecular dynamics, Journal of Chemical Physics 121, 3368 (2004).
- Craig and Manolopoulos [2005] I. R. Craig and D. E. Manolopoulos, Chemical reaction rates from ring polymer molecular dynamics, Journal of Chemical Physics 122 (2005).
- Ramírez et al. [2004] R. Ramírez, T. López-Ciudad, P. Kumar P, and D. Marx, Quantum corrections to classical time-correlation functions: Hydrogen bonding and anharmonic floppy modes, Journal of Chemical Physics 121, 3973 (2004).
- Hart et al. [2012] P. Hart, S. Boutet, G. Carini, M. Dubrovin, B. Duda, D. Fritz, G. Haller, R. Herbst, S. Herrmann, C. Kenney, N. Kurita, H. Lemke, M. Messerschmidt, M. Nordby, J. Pines, D. Schafer, M. Swift, M. Weaver, G. Williams, D. Zhu, N. Van Bakel, and J. Morse, The CSPAD megapixel x-ray camera at LCLS, X-Ray Free-Electron Lasers: Beam Diagnostics, Beamline Instrumentation, and Applications 8504, 85040C (2012).
- Natan et al. [2021] A. Natan, A. Schori, G. Owolabi, J. P. Cryan, J. M. Glownia, and P. H. Bucksbaum, Resolving multiphoton processes with high-order anisotropy ultrafast X-ray scattering, Faraday Discussions 228, 123 (2021).
- Biasin et al. [2018] E. Biasin, T. B. van Driel, G. Levi, M. G. Laursen, A. O. Dohn, A. Moltke, P. Vester, F. B. K. Hansen, K. S. Kjaer, T. Harlang, R. Hartsock, M. Christensen, K. J. Gaffney, N. E. Henriksen, K. B. Møller, K. Haldrup, and M. M. Nielsen, Anisotropy enhanced X-ray scattering from solvated transition metal complexes, Journal of Synchrotron Radiation 25, 306 (2018).
- Lorenz et al. [2010] U. Lorenz, K. B. Møller, and N. E. Henriksen, On the interpretation of time-resolved anisotropic diffraction patterns, New Journal of Physics 12 (2010).
- Baskin and Zewail [2006] J. S. Baskin and A. H. Zewail, Oriented ensembles in ultrafast electron diffraction, ChemPhysChem 7, 1562 (2006).
- Baskin and Zewail [2005] J. S. Baskin and A. H. Zewail, Ultrafast electron diffraction: Oriented molecular structures in space and time, ChemPhysChem 6, 2261 (2005).
- Van Kleef and Powis [1999] E. H. Van Kleef and I. Powis, Anisotropy in the preparation of symmetric top excited states. I. One-photon electric dipole excitation, Molecular Physics 96, 757 (1999).
- Madigan and Cleveland [1951] J. R. Madigan and F. F. Cleveland, Substituted methanes: V. Infrared spectra and calculated thermodynamic properties for some trichloromethanes, The Journal of Chemical Physics 19, 119 (1951).