Detecting Majorana Zero Modes via Strong Field Dynamics
Abstract
We propose a protocol to detect topological phase transitions of one-dimensional -wave superconductors from their harmonic emission spectrum in strong fields. Specifically, we identify spectral features due to radiating edge modes, which characterize the spectrum and the density of states in the topological phase, and which are absent in the trivial phase. These features allow us to define an order parameter, obtained from emission measurements, that unambiguously differentiates between the two phases. Local probing provides insight to the localized and topologically protected nature of the modes.The presented results establish that high harmonic spectroscopy can be used as a novel all-optical tool for the detection of Majorana zero modes.
Introduction –
The past decade has witnessed a hunt for the elusive Majorana fermions (MFs) Majorana (1937). Although it is well established that MFs can emerge as quasiparticles from condensed matter Wilczek (2009), clear experimental evidence is still lacking. A paradigmatic system expected to host MFs at the edges is the one-dimensional (1D) spinless -wave superconductor, also called Kitaev chain Kitaev (2001). In the topological superconducting state, the MFs appear as zero-energy modes in the middle of the superconducting gap, and are therefore also called Majorana zero modes (MZMs). They are examples of symmetry-protected topological edge states Chiu et al. (2016), and in two dimensions, they possess non-Abelian anyonic statistics Stern (2010), making them very interesting candidates for topological qubits, thanks to their capability of robustly storing and processing quantum information Kitaev (2003); Sarma et al. (2015); Alicea et al. (2011).
Despite the design of several experimental setups that effectively realize the Kitaev chain model Fu and Kane (2008, 2009); Oreg et al. (2010); Lutchyn et al. (2010); Cook and Franz (2011), the detection of MZMs remains challenging. In nanowire setups, MZMs are expected to appear as zero-energy states in the tunnelling density-of-states (DOS), manifested through a quantized zero-bias peak of height in the differential conductance Law et al. (2009a); Flensberg (2010); Stanescu et al. (2011). Despite several experiments showing compatible results Mourik et al. (2012); Deng et al. (2012); Das et al. (2012), there is still no conclusive evidence of the predicted robust quantization of the conductance Yu et al. (2021). Specifically, the zero bias peaks are found at heights significantly smaller than , challenging their interpretation. Moreover, the observed nearly perfect conductance quantization may also stem from non-Majorana (non-topological) states Liu et al. (2012); Lee et al. (2012); Das Sarma and Pan (2021).
In this Letter, we develop an alternative approach to uncover MZMs by the non-linear response to strong sub-THz electromagnetic fields Hafez et al. (2018). The strong fields bring the electrons into a non-perturbative regime in which their dynamics give rise to high-harmonic generation (HHG) Vampa et al. (2014). In the past, HHG has been used to track the dynamics of excitations at femtosecond timescales, yielding ultrafast imaging methods in atomic and molecular gases Krause et al. (1992); Krausz and Ivanov (2009); Baker et al. (2006); Shafir et al. (2012) and, more recently, in solid-state systems Hohenleutner et al. (2015); Ghimire and Reis (2019); Alcalà et al. (2022). Lately, there has been a rising interest in using HHG to detect topological properties of matter Reimann et al. (2018); Bauer and Hansen (2018); Jürß and Bauer (2019); Silva et al. (2019); Chacón et al. (2020); Pattanayak et al. (2021); Shao et al. (2022).
Here, we analyze the HHG from a proximity-induced 1D -wave superconductor, showing that it directly reflects the density of states, and thus, the width of the energy bands and energy gaps. This gives rise to a spectroscopic scheme that distinguishes the topological from the trivial phase. Specifically, we introduce an order parameter, obtained from the HHG spectrum, to chart out the whole phase diagram. Moreover, by focusing the radiation source to the edge, we are able to discern bulk from edge excitations, clearly isolating the contribution from the topological MZMs. Our method can be used as an independent check for the presence of MZMs, which, as an all-optical technique, can easily be applied to any sample without the need for gating, and which provides unprecedented spatial and temporal resolution. Thus, it is suited to complement or even substitute transport-based detection techniques Law et al. (2009b), in order to provide the sought-after evidence of MZMs in condensed matter setups.
Model –
The 1D -wave superconducting Kitaev chain Kitaev (2001) is described by the Hamiltonian , where () are creation (annihilation) operators of spinless fermions on site . This model exhibits two phases, a trivial one and a topological one, with a topological phase transition at . In the topological phase, for open boundary conditions, the spectrum is characterized by two degenerate ground states, corresponding to MZMs localized at the two edges of the chain.
For studying the response of this model to a strong field, the fermions’ coupling to the electromagnetic field is crucial. A naive coupling to the vector potential via Peierls substitution, , would require a corresponding dynamical change in the superconducting gap to preserve the gauge-invariance of the Hamiltonian. While this is possible, we make the approximation that the value of remains fixed throughout. Therefore, we focus on a particular system Oreg et al. (2010), which has been the main focus of recent experimental investigations and whose low energy behavior is governed by the Kitaev chain Hamiltonian: a heterostructure between a semiconducting chain with strong spin-orbit coupling and a regular -wave superconductor, additionally subjected to an external Zeeman field. Since the interactions with a strong field also excite high energy states, we study the full multiband Hamiltonian of the heterostructure and not just its low energy subspace. To capture the overall dynamics, we consider the time-dependent Hamiltonian for a chain of sites in the Bogoliubov-de Gennes basis, , with
| (1) |
Here, is the identity matrix, and and are matrices defined by and . The operator is a “compressed” Nambu spinor, where , with . The Hamiltonian’s parameters are the hopping , the chemical potential , the effective spin-orbit coupling , the Zeeman field and the proximity-induced superconducting coupling . The structure of the Hamiltonian allows us to straightforwardly couple the system to the external field via a Peierls substitution. For convenience, we choose units of such that the coupling constant , with the unit cell size, is 1. The time-dependence of the vector potential is of the form
| (2) |
describing a pulse of cycles with frequency , and a constant electric field with , explicitly breaking time inversion symmetry in the system, such that both even and odd harmonics of the driving frequency can be generated Kanega et al. (2021). Measuring energies in units of , we choose , such that it corresponds roughly to of the bandgap of the system. The symmetry-breaking DC field is very weak, , whereas the amplitude of the vector potential has to be strong enough to produce high harmonics and is taken to be , which for nm corresponds to Vs/m.
For the static Hamiltonian at , the topological phase appears for Leijnse and Flensberg (2012). For lower values of , the system is in a trivial gapped superconducting state with no topological edge modes. We refer to the Supplemental Material for a full derivation of the Hamiltonian. Although in realistic semiconductor/superconductor heterostructures, the energy scales widely differ, in the following we choose them to be of the same order of magnitude (specifically, ). The reason for this choice is to achieve clear Majorana modes for system sizes that are sufficiently small to numerically perform simulations of the full dynamics. In particular, the parameters were tuned according to the prescription from Alicea (2012) in order to assure the presence of a topological phase. For the purpose of detecting MZM from the high harmonic spectrum, it is important that the ratio between the bandgap (usually of the order of ) and the frequency of the incoming pulse is much larger than 1. For InAs nanowires, the bandgap is on the order of 1 meV (with meV, meV, meV, cf. Ref. Stanescu et al., 2011), but also much larger gaps have been reported, of 4 meV for -Bi2Pd films Guan et al. (2019), or even 15 meV for iron-based superconductors Hagiwara et al. (2021). Depending on the size of the gap, our scheme requires strong microwave to THz sources Hafez et al. (2018), with pulse duration on the order of 1-100 ps, which is potentially much shorter than typical relaxation time scales.
High-harmonic generation –
The key quantity that captures the non-linear optical response of the system is the transmitted HHG spectrum, that is, the power spectrum of emission:
| (3) |
normalized to the maximum of the power spectrum of the incoming pulse Baggesen and Madsen (2011). Here, the time derivative of the average dipole moment yields the electric current, which is Fourier transformed into the frequency domain. The dipole moment is calculated by numerically integrating the time-dependent Schrödinger equation (TDSE) from the initial ground state of the Hamiltonian up to a time (see Supplemental Material for details).
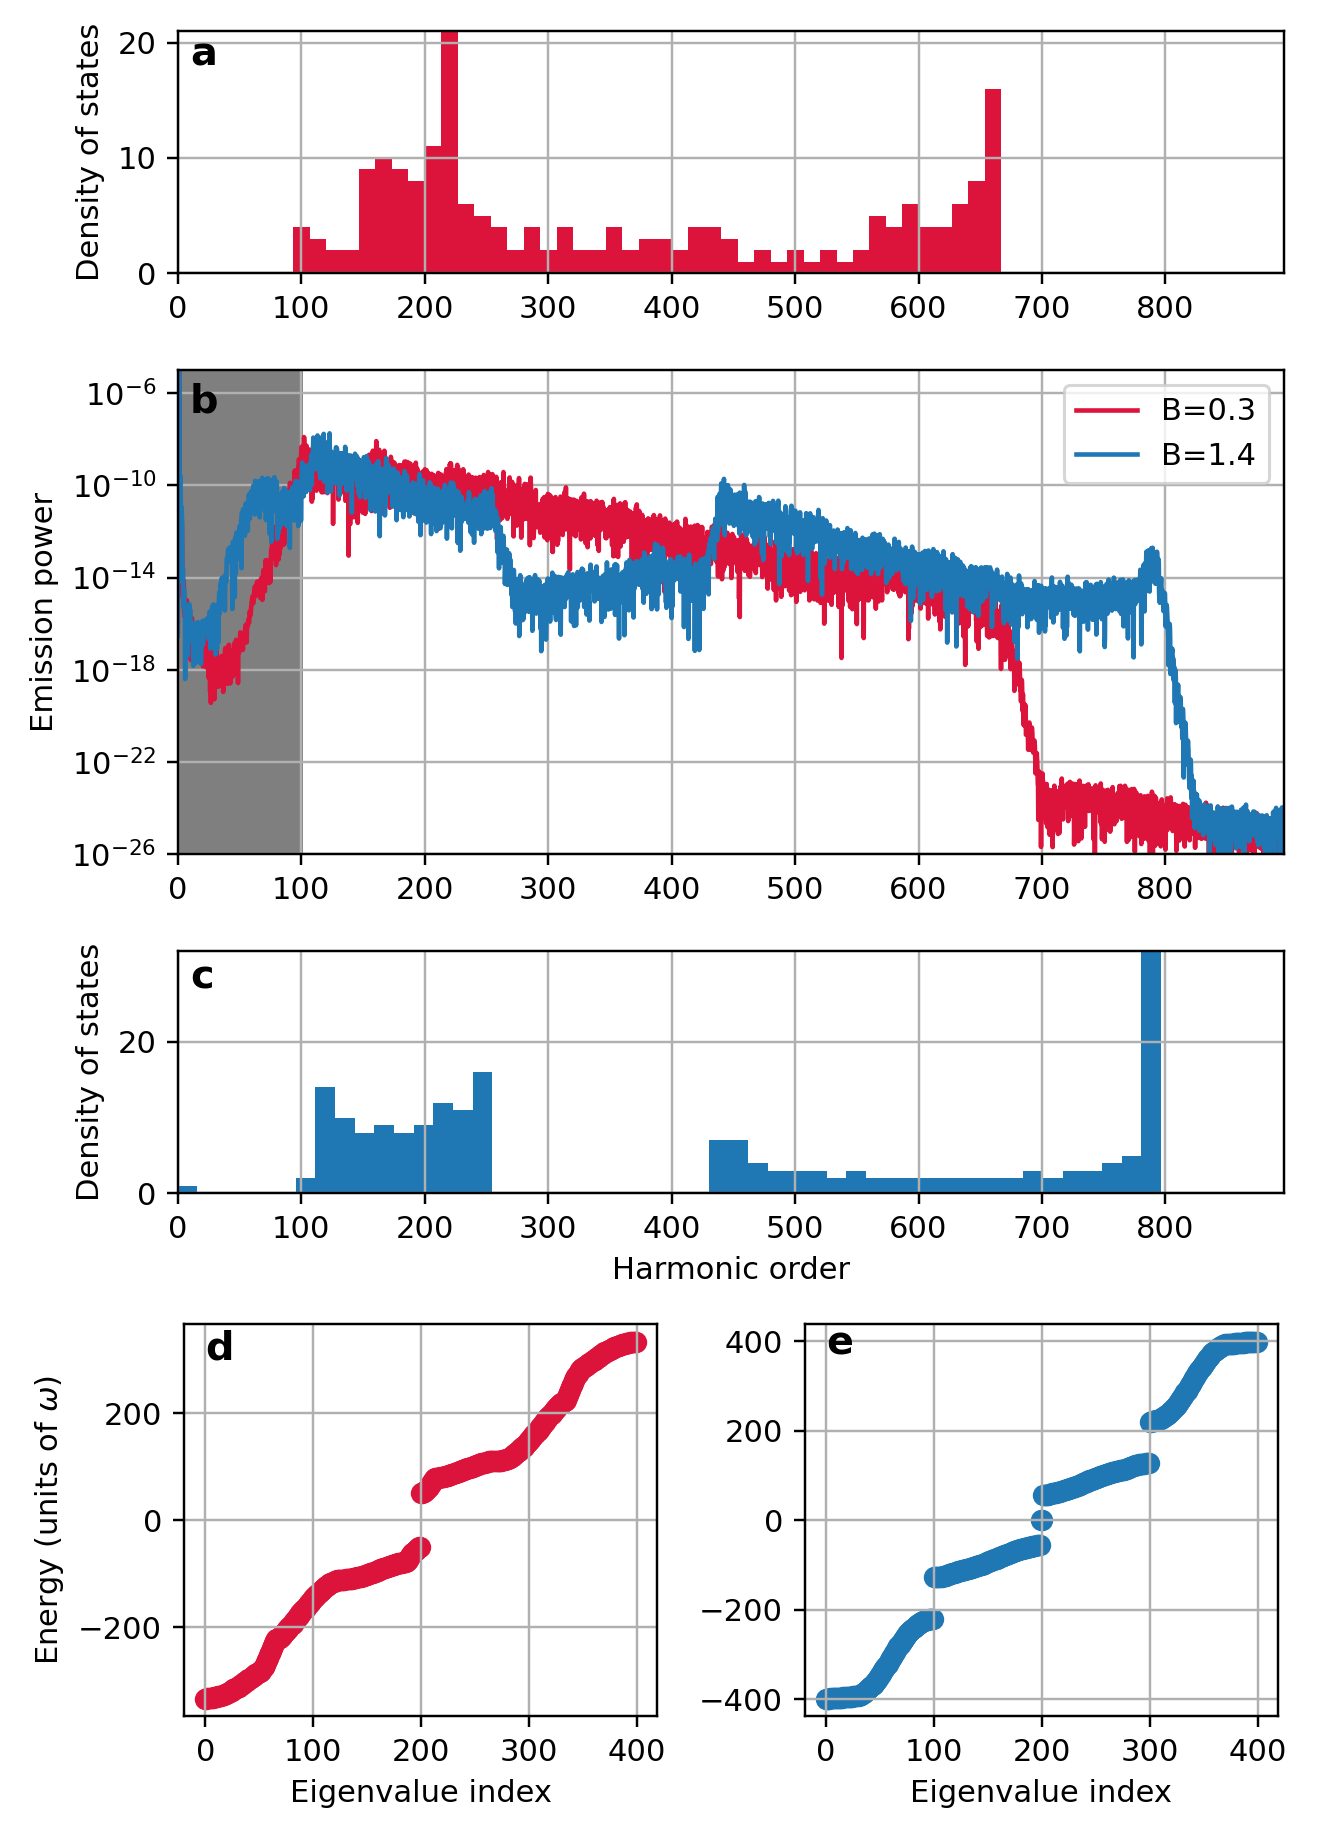
In Fig. 1(b) we plot the emission spectrum, obtained from Eq. (3), as a function of the harmonic order of the driving frequency. We consider two points in parameter space, one deep in the trivial phase at (red), and the other one in the topological one at (blue). Interestingly, we observe that, in both cases, the spectrum echoes the band structure of the Bogoliubov Hamiltonian, plotted in Fig. 1(d) and (e), with two or four bands symmetric around the Fermi energy due to particle-hole symmetry Alicea (2012). In particular, the density of states in the two phases, shown in Fig. 1(a) and (c), clearly determines the emission. In particular, there is no emission above the bandwidth and below the bandgap (defined as the difference between the highest valence band and the lowest conduction band excluding edge modes) in the trivial phase. In stark contrast, in the topological phase, the radiation plateau starts from half-bandgap, which is related to the presence of radiating edge modes at zero-energy.
For a qualitative understanding of the emission spectrum, we note that the dynamics that cause the emission can be split into three different steps Vampa et al. (2014): 1) the incoming pulse can excite a Bogoliubov quasiparticle from the filled bands to the empty ones; 2) the excitation can then move inside the empty band under the applied electric field, and, subsequently, 3) it can relax back to one of the occupied bands. This leads to two different kinds of contributions in the emission spectrum, an intraband one (step 2) and an interband one (steps 1 and 3). The intraband contribution is produced by the acceleration (Bloch oscillations) of the quasiparticles within a band with non-linear dispersion. The frequency of the interband emission, on the other hand, is bounded by the bandgap (lowest possible interband excitation) and the bandwidth of the system (highest one) 111We note that, for a short envelope as considered here (), the Fourier transform of the incoming pulse is spread around the driving frequency. There is subsequently a widening and possible mixing of the harmonics generated by the system, but this is not of particular concern for our purposes as we are not interested in discerning the emission at a particular frequency..
Order parameter –
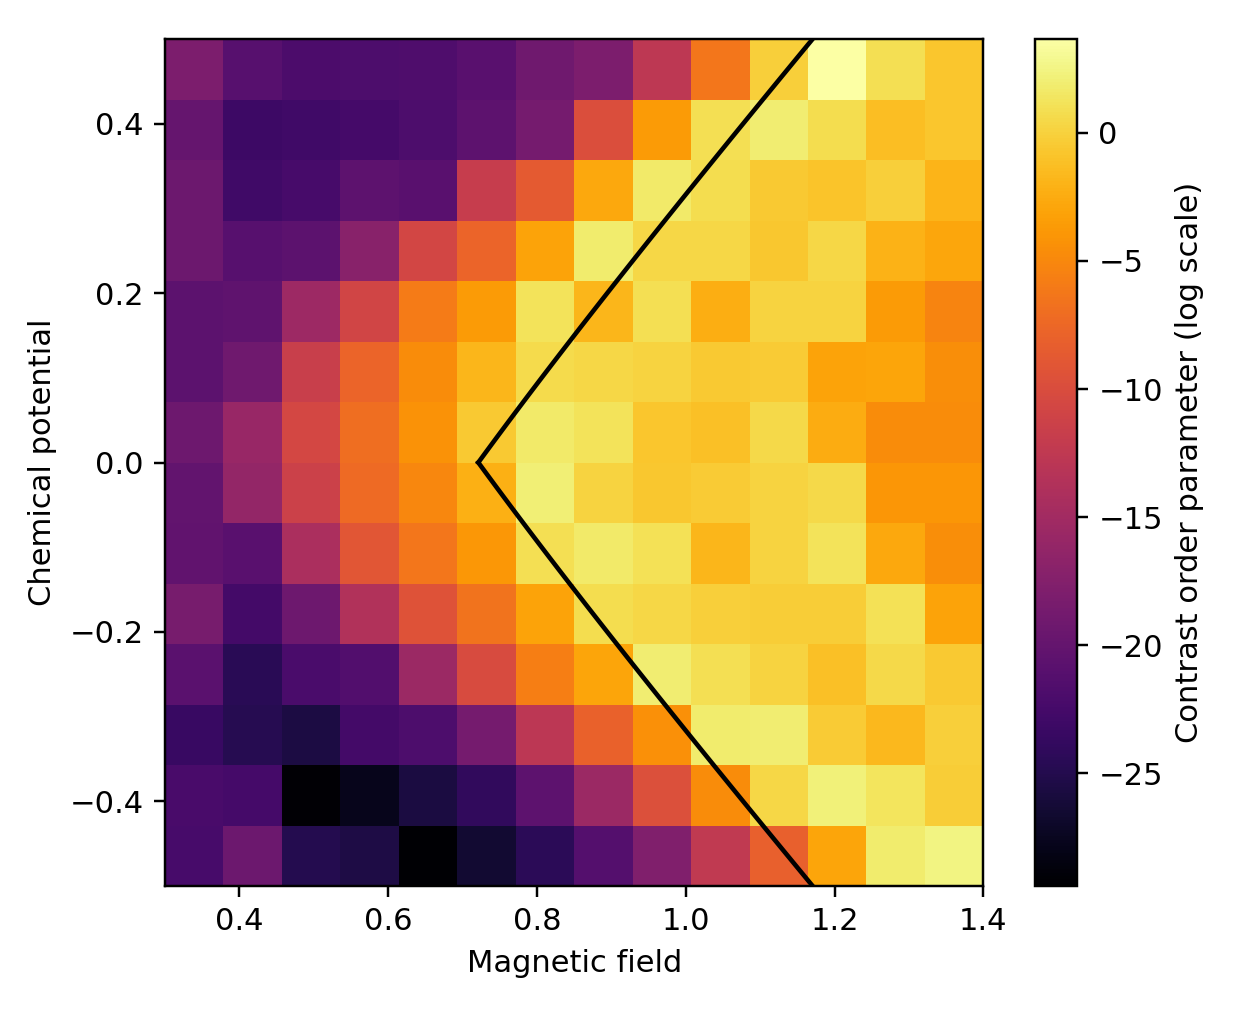
We now propose a contrast order parameter, defined as the ratio between the emission at half the bandgap over the emission at the bandgap ,
| (4) |
which is of order one in the topological phase and zero in the trivial phase. The topological phase diagram of the system is computed Fig. 2 in the plane using the proposed order parameter. Exactly at the boundary where the gap closes, the system behaves as a metal, and our order parameter is greater than one here as the emission is higher for lower harmonics. The choice of the frequency of the incident light pulse is crucial to localize the phase boundary, as a lower frequency provides a sharper criterion for distinguishing topological and trivial phases. From this point of view, choosing a small driving frequency is favorable, as long as the pulse remains short as compared to relaxation times. We refer to the Supplemental Material for a discussion of this behavior.
Robust edge states –
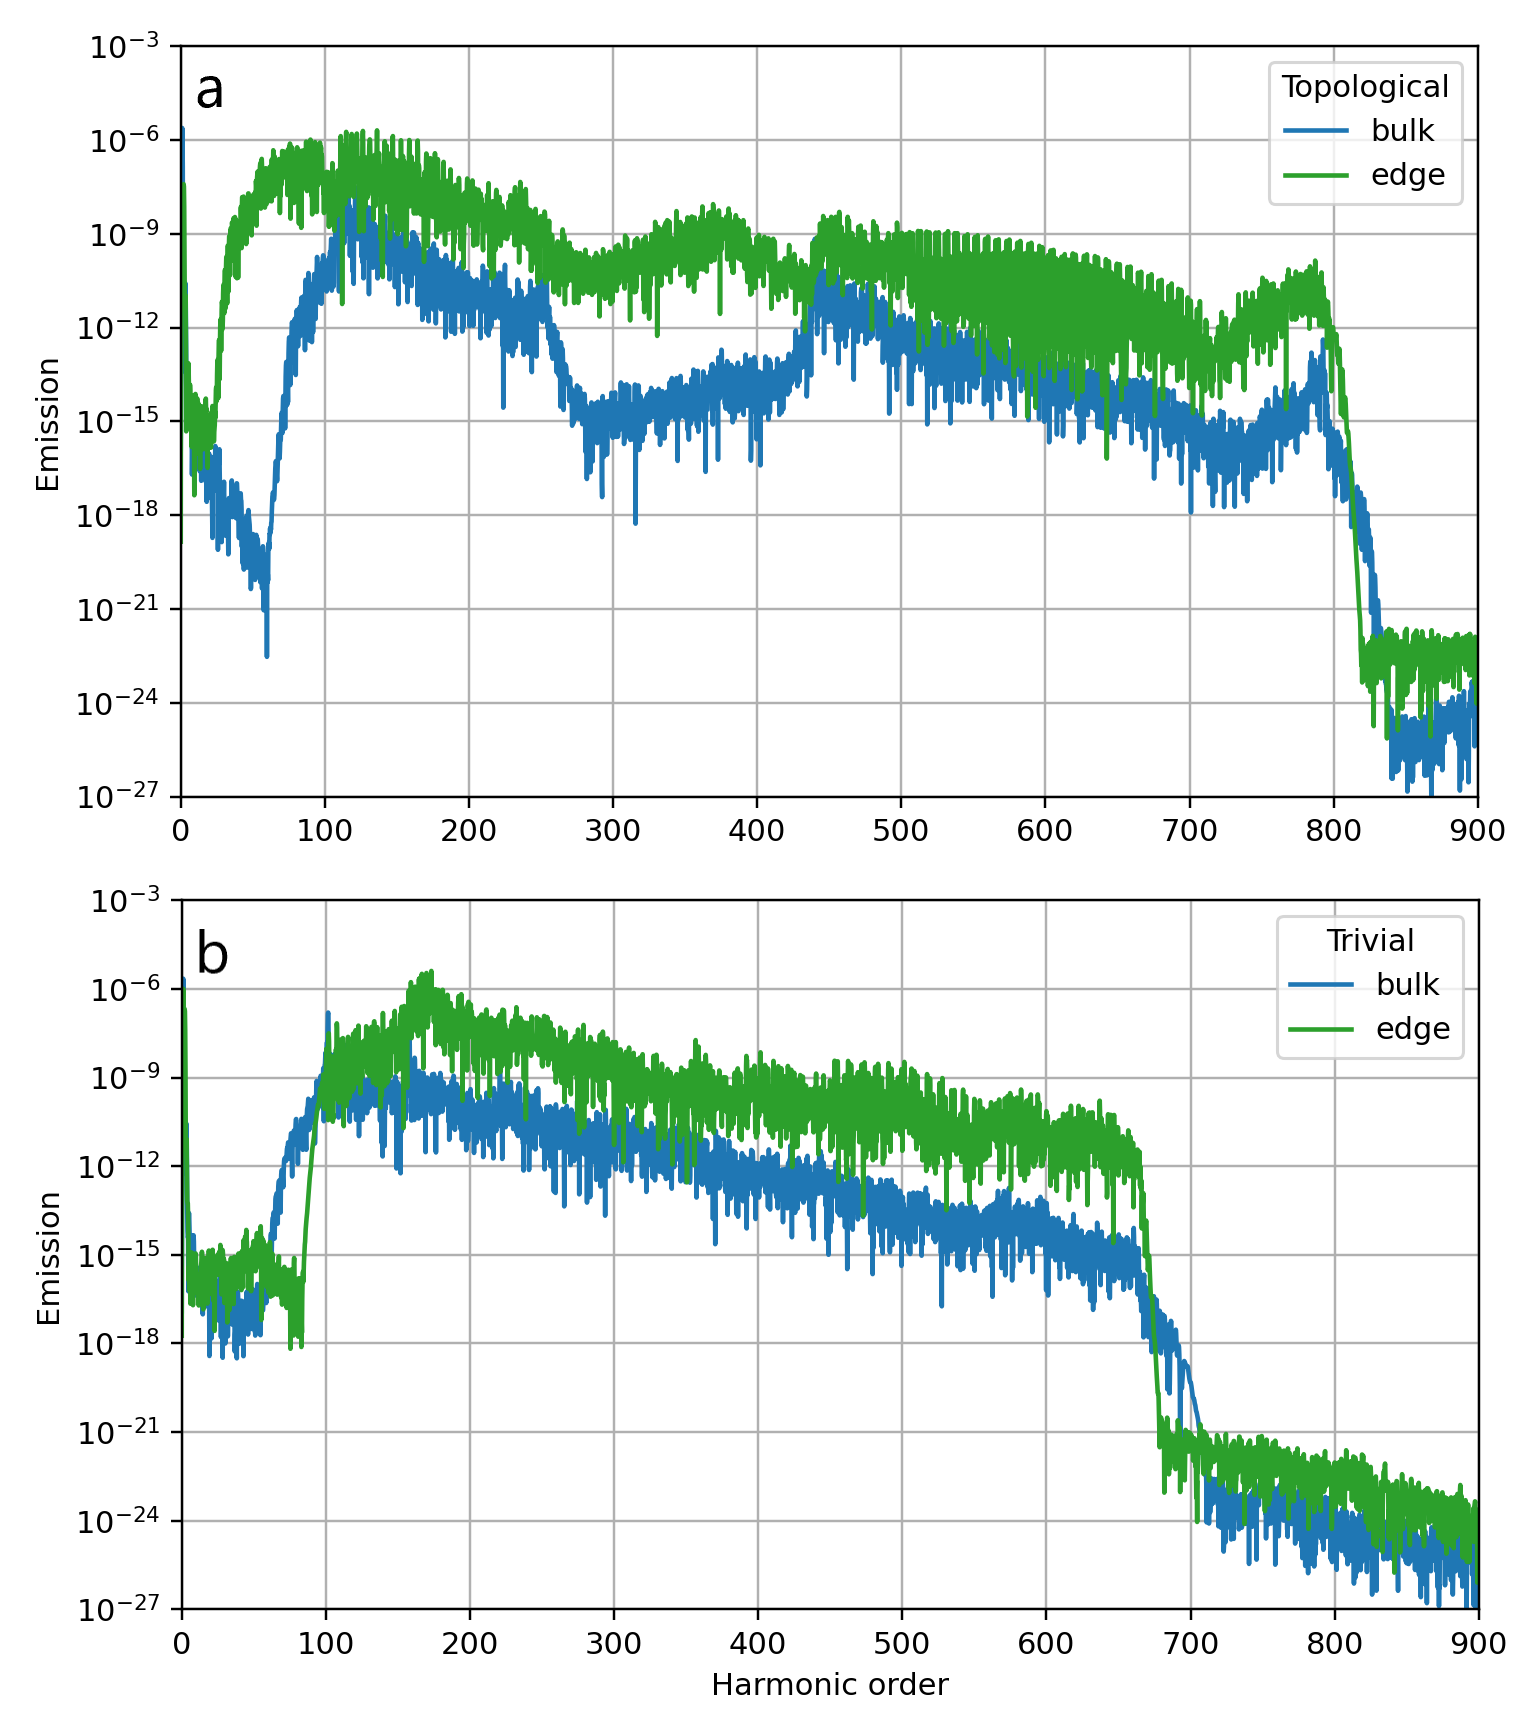
So far, the devised scheme distinguishes between topological and trivial phases by measuring the full bandstructure of the system, but yet it does not capture the maybe most stunning property of the MZMs, their localization at the edge and topological protection. However, with the spatial resolution of the radiation being limited only by the wavelength, it becomes possible to demonstrate that the sub-bandgap emission is due to edge modes by focusing the electromagnetic field either on the edge or the bulk of the sample. In Fig. 3, we show how in the trivial phase the emitted spectrum is qualitatively the same for a pulse focused on the edge or on the bulk. On the other hand, in the topological phase, there is strong radiation between the bandgap and half bandgap if the light is focused on the edge, showing that the contribution to the emitted spectrum in this mid-band gap region does not come from the bulk, but solely from the edge. We have used a Gaussian envelope, and the amplitude of the envelopes is normalized in order to have the same electromagnetic energy for all cases (edge, bulk, and uniform field).
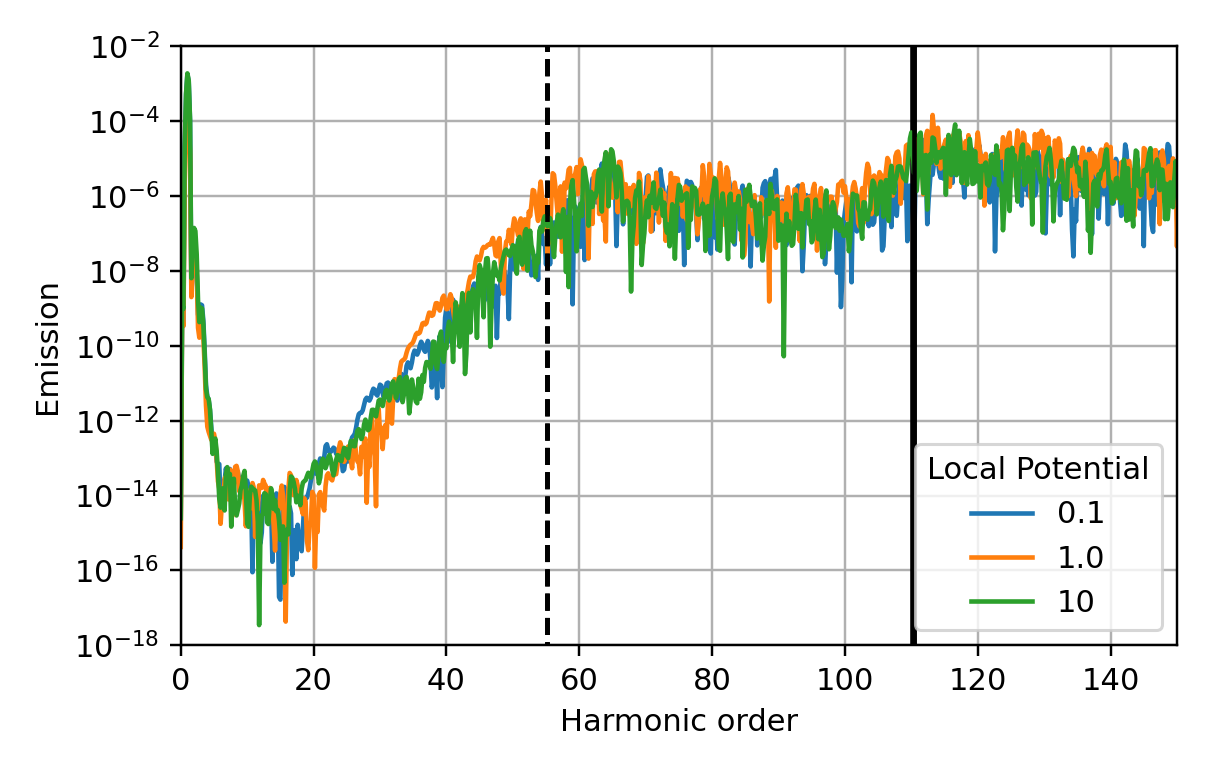
Finally, to illustrate the topological nature of the edge modes, we add a local perturbation to the system that does not break the particle-hole symmetry of the Hamiltonian. Such local potentials (acting on three sites on the left and right edges) can be added by applying gate voltages at the edges and are modeled by adding a term for . We observe that increasing the value of this potential does not affect the shape of the emission spectrum. Specifically, the sub-bandgap edge state emission only appears in the topological phase and remains present precisely between half bandgap and the bandgap, as can be seen in Fig. 4. The different curves in this figure, corresponding to different edge potentials, lie on top of each other for lower harmonics (until the bandgap of the system), indicating that the edge modes do not shift in energy upon the application of edge potentials, clearly demonstrating the topological robustness of the radiating edge modes.
Summary and outlook –
In the present Letter, topological edge modes are detected via the electromagnetic emission spectrum in the non-linear regime. An experimentally observable quantity, the contrast order parameter, is constructed to map the phase diagram. To confirm the topological nature of radiating modes, the system can be probed locally and shown to be robust under local perturbations. Thus, our protocol complements other established methods in the pursuit for MZMs.
A major experimental challenge for the detection of MZMs is to distinguish them from trivial sub-bandgap states that can appear in the material, that is, Andreev bound states Sauls (2018); Prada et al. (2020). These states can appear from regions in the semiconducting chain where the proximity-induced superconductivity fails (i.e. near the edges), creating zones of normal metal where scattering effects can lead to the creation of localized states Andreev (1964). A straightforward extension of our work will use a spatially dependent superconducting order parameter to study the formation of these states and their influence on the emission spectrum. Another interesting application of our technique is the study of Majorana physics in two dimensions, where MZMs can arise as vortices in -wave superconductors Read and Green (2000). Compared to 1D models, the dependence of the emission spectrum on the field polarization states will make the two-dimensional scenario very rich: Recent studies have shown that left-right polarized drives can shed light on the presence of topological chiral states Tran et al. (2017); Asteria et al. (2019), both in the perturbative and ultra-strong regime Silva et al. (2019); Chacón et al. (2020), but a study of the effect on Majoranas is still missing.
Acknowledgements.
We thank A. Dauphin, A. Maxwell, J.-M. Raimond, and P. Stammer for useful discussions and insightful comments. ICFO group acknowledges support from: ERC AdG NOQIA; Agencia Estatal de Investigación (R&D project CEX2019-000910-S, funded by MCIN/ AEI/10.13039/501100011033, Plan National FIDEUA PID2019-106901GB-I00, FPI, QUANTERA MAQS PCI2019-111828-2, Proyectos de I+D+I “Retos Colaboración” RTC2019-007196-7); Fundació Cellex; Fundació Mir-Puig; Generalitat de Catalunya through the CERCA program, AGAUR Grant No. 2017 SGR 134, QuantumCAT/U16-011424, co-funded by ERDF Operational Program of Catalonia 2014-2020; EU Horizon 2020 FET-OPEN OPTOLogic (Grant No 899794); National Science Centre, Poland (Symfonia Grant No. 2016/20/W/ST4/00314); Marie Skłodowska-Curie grant STREDCH No 101029393; “La Caixa” Junior Leaders fellowships (ID100010434) and EU Horizon 2020 under Marie Skłodowska-Curie grant agreement No 847648 (LCF/BQ/PI19/11690013, LCF/BQ/PI20/11760031, LCF/BQ/PR20/11770012, LCF/BQ/PR21/11840013). N.B. acknowledges support from a “la Caixa” Foundation (ID 100010434) fellowship. The fellowship code is LCF/BQ/DI20/11780033. T.G. acknowledges financial support from a fellowship granted by “la Caixa” Foundation (ID 100010434, fellowship code LCF/BQ/PI19/11690013). D.G.-C. is supported by the Simons Collaboration on Ultra-Quantum Matter, which is a grant from the Simons Foundation (651440, P.Z.).References
- Majorana (1937) E. Majorana, Nuovo Cim. 14, 171 (1937), ISSN 1827-6121, URL https://doi.org/10.1007/BF02961314.
- Wilczek (2009) F. Wilczek, Nat. Phys. 5, 614 (2009), ISSN 1745-2481, URL https://doi.org/10.1038/nphys1380.
- Kitaev (2001) A. Y. Kitaev, Phys.-Uspekhi 44, 131 (2001), URL https://doi.org/10.1070/1063-7869/44/10s/s29.
- Chiu et al. (2016) C.-K. Chiu, J. C. Y. Teo, A. P. Schnyder, and S. Ryu, Rev. Mod. Phys. 88, 035005 (2016), URL https://link.aps.org/doi/10.1103/RevModPhys.88.035005.
- Stern (2010) A. Stern, Nature 464, 187 (2010), ISSN 1476-4687, URL https://doi.org/10.1038/nature08915.
- Kitaev (2003) A. Kitaev, Ann. Phys. (N. Y.) 303, 2 (2003), ISSN 0003-4916, URL https://www.sciencedirect.com/science/article/pii/S0003491602000180.
- Sarma et al. (2015) S. D. Sarma, M. Freedman, and C. Nayak, npj Quantum Inf. 1, 15001 (2015), ISSN 2056-6387, URL https://doi.org/10.1038/npjqi.2015.1.
- Alicea et al. (2011) J. Alicea, Y. Oreg, G. Refael, F. von Oppen, and M. P. A. Fisher, Nat. Phys. 7, 412 (2011), ISSN 1745-2481, URL https://doi.org/10.1038/nphys1915.
- Fu and Kane (2008) L. Fu and C. L. Kane, Phys. Rev. Lett. 100, 096407 (2008), URL https://link.aps.org/doi/10.1103/PhysRevLett.100.096407.
- Fu and Kane (2009) L. Fu and C. L. Kane, Phys. Rev. B 79, 161408 (2009), URL https://link.aps.org/doi/10.1103/PhysRevB.79.161408.
- Oreg et al. (2010) Y. Oreg, G. Refael, and F. von Oppen, Phys. Rev. Lett. 105, 177002 (2010), URL https://link.aps.org/doi/10.1103/PhysRevLett.105.177002.
- Lutchyn et al. (2010) R. M. Lutchyn, J. D. Sau, and S. Das Sarma, Phys. Rev. Lett. 105, 077001 (2010), URL https://link.aps.org/doi/10.1103/PhysRevLett.105.077001.
- Cook and Franz (2011) A. Cook and M. Franz, Phys. Rev. B 84, 201105 (2011), URL https://link.aps.org/doi/10.1103/PhysRevB.84.201105.
- Law et al. (2009a) K. T. Law, P. A. Lee, and T. K. Ng, Phys. Rev. Lett. 103, 237001 (2009a), URL https://link.aps.org/doi/10.1103/PhysRevLett.103.237001.
- Flensberg (2010) K. Flensberg, Phys. Rev. B 82, 180516 (2010), URL https://link.aps.org/doi/10.1103/PhysRevB.82.180516.
- Stanescu et al. (2011) T. D. Stanescu, R. M. Lutchyn, and S. Das Sarma, Phys. Rev. B 84, 144522 (2011), URL https://link.aps.org/doi/10.1103/PhysRevB.84.144522.
- Mourik et al. (2012) V. Mourik, K. Zuo, S. M. Frolov, S. R. Plissard, E. P. A. M. Bakkers, and L. P. Kouwenhoven, Science 336, 1003 (2012).
- Deng et al. (2012) M. T. Deng, C. L. Yu, G. Y. Huang, M. Larsson, P. Caroff, and H. Q. Xu, Nano Lett. 12, 6414 (2012), ISSN 1530-6984, URL https://doi.org/10.1021/nl303758w.
- Das et al. (2012) A. Das, Y. Ronen, Y. Most, Y. Oreg, M. Heiblum, and H. Shtrikman, Nat. Phys. 8, 887 (2012), ISSN 1745-2481, URL https://doi.org/10.1038/nphys2479.
- Yu et al. (2021) P. Yu, J. Chen, M. Gomanko, G. Badawy, E. P. A. M. Bakkers, K. Zuo, V. Mourik, and S. M. Frolov, Nat. Phys. 17, 482 (2021), ISSN 1745-2481, URL https://doi.org/10.1038/s41567-020-01107-w.
- Liu et al. (2012) J. Liu, A. C. Potter, K. T. Law, and P. A. Lee, Phys. Rev. Lett. 109, 267002 (2012), URL https://link.aps.org/doi/10.1103/PhysRevLett.109.267002.
- Lee et al. (2012) E. J. H. Lee, X. Jiang, R. Aguado, G. Katsaros, C. M. Lieber, and S. De Franceschi, Phys. Rev. Lett. 109, 186802 (2012), URL https://link.aps.org/doi/10.1103/PhysRevLett.109.186802.
- Das Sarma and Pan (2021) S. Das Sarma and H. Pan, Phys. Rev. B 103, 195158 (2021), ISSN 2469-9969, URL http://dx.doi.org/10.1103/PhysRevB.103.195158.
- Hafez et al. (2018) H. A. Hafez, S. Kovalev, J.-C. Deinert, Z. Mics, B. Green, N. Awari, M. Chen, S. Germanskiy, U. Lehnert, J. Teichert, et al., Nature 561, 507 (2018), ISSN 1476-4687, URL https://doi.org/10.1038/s41586-018-0508-1.
- Vampa et al. (2014) G. Vampa, C. R. McDonald, G. Orlando, D. D. Klug, P. B. Corkum, and T. Brabec, Phys. Rev. Lett. 113, 073901 (2014), URL https://link.aps.org/doi/10.1103/PhysRevLett.113.073901.
- Krause et al. (1992) J. L. Krause, K. J. Schafer, and K. C. Kulander, Phys. Rev. Lett. 68, 3535 (1992), URL https://link.aps.org/doi/10.1103/PhysRevLett.68.3535.
- Krausz and Ivanov (2009) F. Krausz and M. Ivanov, Rev. Mod. Phys. 81, 163 (2009), URL https://link.aps.org/doi/10.1103/RevModPhys.81.163.
- Baker et al. (2006) S. Baker, J. S. Robinson, C. A. Haworth, H. Teng, R. A. Smith, C. C. Chirilă, M. Lein, J. W. G. Tisch, and J. P. Marangos, Science 312, 424 (2006), URL https://www.science.org/doi/abs/10.1126/science.1123904.
- Shafir et al. (2012) D. Shafir, H. Soifer, B. D. Bruner, M. Dagan, Y. Mairesse, S. Patchkovskii, M. Y. Ivanov, O. Smirnova, and N. Dudovich, Nature 485, 343 (2012), ISSN 1476-4687, URL https://doi.org/10.1038/nature11025.
- Hohenleutner et al. (2015) M. Hohenleutner, F. Langer, O. Schubert, M. Knorr, U. Huttner, S. W. Koch, M. Kira, and R. Huber, Nature 523, 572 (2015), ISSN 1476-4687, URL https://doi.org/10.1038/nature14652.
- Ghimire and Reis (2019) S. Ghimire and D. A. Reis, Nat. Phys. 15, 10 (2019), ISSN 1745-2481, URL https://doi.org/10.1038/s41567-018-0315-5.
- Alcalà et al. (2022) J. Alcalà, U. Bhattacharya, J. Biegert, M. Ciappina, U. Elu, T. Graß, P. T. Grochowski, M. Lewenstein, A. Palau, T. P. H. Sidiropoulos, et al., High harmonic spectroscopy of quantum phase transitions in a high-tc superconductor (2022), eprint 2201.09515.
- Reimann et al. (2018) J. Reimann, S. Schlauderer, C. Schmid, F. Langer, S. Baierl, K. Kokh, O. Tereshchenko, A. Kimura, C. Lange, J. Güdde, et al., Nature 562, 396 (2018).
- Bauer and Hansen (2018) D. Bauer and K. K. Hansen, Phys. Rev. Lett. 120, 177401 (2018), URL https://link.aps.org/doi/10.1103/PhysRevLett.120.177401.
- Jürß and Bauer (2019) C. Jürß and D. Bauer, Phys. Rev. B 99, 195428 (2019), URL https://link.aps.org/doi/10.1103/PhysRevB.99.195428.
- Silva et al. (2019) R. E. F. Silva, Á. Jiménez-Galán, B. Amorim, O. Smirnova, and M. Ivanov, Nat. Photon. 13, 849 (2019), ISSN 1749-4893, URL https://doi.org/10.1038/s41566-019-0516-1.
- Chacón et al. (2020) A. Chacón, D. Kim, W. Zhu, S. P. Kelly, A. Dauphin, E. Pisanty, A. S. Maxwell, A. Picón, M. F. Ciappina, D. E. Kim, et al., Phys. Rev. B 102, 134115 (2020), ISSN 2469-9969, URL http://dx.doi.org/10.1103/PhysRevB.102.134115.
- Pattanayak et al. (2021) A. Pattanayak, S. Pujari, and G. Dixit, Fingerprints of majorana fermions in high-harmonic spectroscopy (2021), eprint 2101.09882.
- Shao et al. (2022) C. Shao, H. Lu, X. Zhang, C. Yu, T. Tohyama, and R. Lu, Phys. Rev. Lett. 128, 047401 (2022), URL https://link.aps.org/doi/10.1103/PhysRevLett.128.047401.
- Law et al. (2009b) K. T. Law, P. A. Lee, and T. K. Ng, Phys. Rev. Lett. 103, 237001 (2009b), URL http://dx.doi.org/10.1103/PhysRevLett.103.237001.
- Kanega et al. (2021) M. Kanega, T. N. Ikeda, and M. Sato, Phys. Rev. Res. 3, L032024 (2021), URL https://link.aps.org/doi/10.1103/PhysRevResearch.3.L032024.
- Leijnse and Flensberg (2012) M. Leijnse and K. Flensberg, Semicond. Sci. Technol. 27, 124003 (2012), ISSN 1361-6641, URL http://dx.doi.org/10.1088/0268-1242/27/12/124003.
- Alicea (2012) J. Alicea, Rep. Prog. Phys. 75, 076501 (2012), ISSN 1361-6633, URL http://dx.doi.org/10.1088/0034-4885/75/7/076501.
- Guan et al. (2019) J.-Y. Guan, L. Kong, L.-Q. Zhou, Y.-G. Zhong, H. Li, H.-J. Liu, C.-Y. Tang, D.-Y. Yan, F.-Z. Yang, Y.-B. Huang, et al., Sci. Bull. 64, 1215 (2019), ISSN 2095-9273, URL https://www.sciencedirect.com/science/article/pii/S2095927319304165.
- Hagiwara et al. (2021) K. Hagiwara, M. Ishikado, M. Horio, K. Koshiishi, S. Nakata, S. Ideta, K. Tanaka, K. Horiba, K. Ono, H. Kumigashira, et al., Phys. Rev. Res. 3, 043151 (2021), URL https://link.aps.org/doi/10.1103/PhysRevResearch.3.043151.
- Baggesen and Madsen (2011) J. C. Baggesen and L. B. Madsen, J. Phys. B At. Mol. Opt. 44, 115601 (2011), URL https://hal.archives-ouvertes.fr/hal-00625578.
- Sauls (2018) J. Sauls, Philos. Trans. R. Soc. A 376, 20180140 (2018).
- Prada et al. (2020) E. Prada, P. San-Jose, M. W. A. de Moor, A. Geresdi, E. J. H. Lee, J. Klinovaja, D. Loss, J. Nygård, R. Aguado, and L. P. Kouwenhoven, Nat. Rev. Phys. 2, 575 (2020), ISSN 2522-5820, URL https://doi.org/10.1038/s42254-020-0228-y.
- Andreev (1964) A. Andreev, Sov. Phys. JETP 19, 1228 (1964).
- Read and Green (2000) N. Read and D. Green, Phys. Rev. B 61, 10267–10297 (2000), ISSN 1095-3795, URL http://dx.doi.org/10.1103/PhysRevB.61.10267.
- Tran et al. (2017) D. T. Tran, A. Dauphin, A. G. Grushin, P. Zoller, and N. Goldman, Sci. Adv. 3, e1701207 (2017), URL https://www.science.org/doi/abs/10.1126/sciadv.1701207.
- Asteria et al. (2019) L. Asteria, D. T. Tran, T. Ozawa, M. Tarnowski, B. S. Rem, N. Fläschner, K. Sengstock, N. Goldman, and C. Weitenberg, Nat. Phys. 15, 449 (2019), ISSN 1745-2481, URL https://doi.org/10.1038/s41567-019-0417-8.