The evolution of ultra-massive carbon oxygen white dwarfs ††thanks: The cooling sequences are publicly available for download at http://evolgroup.fcaglp.unlp.edu.ar/TRACKS/tracks.html
Abstract
Ultra-massive white dwarfs () are considered powerful tools to study type Ia supernovae explosions, merger events, the occurrence of physical processes in the Super Asymptotic Giant Branch (SAGB) phase, and the existence of high magnetic fields. Traditionally, ultra-massive white dwarfs are expected to harbour oxygen-neon (ONe) cores. However, new observations and recent theoretical studies suggest that the progenitors of some ultra-massive white dwarfs can avoid carbon burning, leading to the formation of ultra-massive white dwarfs harbouring carbon-oxygen (CO) cores. Here we present a set of ultra-massive white dwarf evolutionary sequences with CO cores for a wide range of metallicity and masses. We take into account the energy released by latent heat and phase separation during the crystallization process and by 22Ne sedimentation. Realistic chemical profiles resulting from the full computation of progenitor evolution are considered. We compare our CO ultra-massive white dwarf models with ONe models. We conclude that CO ultra-massive white dwarfs evolve significantly slower than their ONe counterparts mainly for three reasons: their larger thermal content, the effect of crystallization, and the effect of 22Ne sedimentation. We also provide colors in several photometric bands on the basis of new model atmospheres. These CO ultra-massive white dwarf models, together with the ONe ultra-massive white dwarf models, provide an appropriate theoretical framework to study the ultra-massive white dwarf population in our Galaxy.
keywords:
stars: evolution – stars: interior – stars: white dwarfs1 Introduction
White dwarf stars are the most numerous members of the stellar graveyard. It is widely accepted that more than 95% of all stars of the Universe, will evolve into white dwarfs, Earth-sized, electron-degenerate objects. Therefore, these numerous objects are considered a powerful tool to understand the formation and evolution of stars, the history of our Galaxy and stellar populations, and the evolution of planetary systems (see Fontaine & Brassard, 2008; Winget & Kepler, 2008; Althaus et al., 2010a; García Berro & Oswalt, 2016; Córsico et al., 2019a, for reviews). Among all the white dwarf stars, the ultra-massive white dwarfs, defined as the white dwarfs with masses larger than , are of special interest. These stars play a key role in our understanding of type Ia Supernova explosions, the occurrence of physical processes in the asymptotic giant-branch (AGB) phase, the existence of high-field magnetic white dwarfs, and the occurrence of double white dwarf mergers (Dunlap & Clemens, 2015; Reindl et al., 2020). The observation of ultra-massive white dwarfs has been reported in several studies in the literature (Mukadam et al., 2004; Nitta et al., 2016; Gianninas et al., 2011; Kleinman et al., 2013; Bours et al., 2015; Kepler et al., 2016; Curd et al., 2017; Kilic et al., 2021; Hollands et al., 2020; Caiazzo et al., 2021; Miller et al., 2021).
The formation of ultra-massive white dwarfs has been theoretically predicted as a result of the isolated evolution of massive intermediate-mass stars with a masses larger than , depending on the metallicity and the treatment of convective boundaries (e.g. Doherty et al., 2017, and references therein). Unlike the progenitors of the less massive white dwarfs, the progenitors of ultra-massive white dwarfs are expected to reach the SAGB with a partially degenerate CO core that reaches temperatures high enough to develop off-center C ignition. This violent ignition occurring through flashes is followed by a steady flame propagation towards the centre of the star, and results in the formation of a core composed mainly by 16O and 20Ne, with traces of 23Na and 24Mg (Garcia Berro & Iben, 1994; Siess, 2007, 2006, 2010). These stars will eventually lose their outermost layers by the action of stellar winds, evolving into an ONe-core ultra-massive white dwarf, more massive than .
During the last years, another scenario for the formation of ultra-massive white dwarfs has gained relevance. Recent studies have evinced that a relevant fraction of the single white dwarfs in our Galaxy have been formed as a result of binary mergers (Toonen et al., 2017; Maoz et al., 2018; Temmink et al., 2020; Cheng et al., 2020). Among these studies, Temmink et al. (2020) estimated, based on binary population synthesis studies, that from 30 to 45% of all the single white dwarfs with masses larger than 0.9M⊙, in a volume-limited sample, are likely formed through binary mergers, and most of them via double white dwarf mergers. Moreover, Cheng et al. (2020) concluded, on the basis of their velocity distribution, that about 20% of the single white dwarfs with masses larger than 0.8M⊙ are formed through the merger of two white dwarfs. The formation of ultra-massive white dwarfs as a result of double white dwarf mergers has been calculated through hydrodynamical codes in Yoon et al. (2007); Lorén Aguilar et al. (2009); Dan et al. (2014). More recently, Schwab (2021a) studied the merger of two CO core white dwarfs, finding that the initial CO core composition of the merger remnant is converted to ONe, if the remnant has a mass larger than M⊙. According to this study, the core-chemical composition of an ultra-massive white dwarf formed via mergers should also be ONe.
Nevertheless, recent theoretical models of isolated progenitors of ultra-massive white dwarf suggest that these progenitors can avoid carbon burning on the AGB, supporting the existence of CO-cores in white dwarfs more massive than . Althaus et al. (2021) proposed two possible scenarios for the formation of ultra-massive CO-core white dwarfs in isolated evolution. One scenario involved a reduction in wind rates with respect to the standard prescriptions, in stars with degenerate cores of masses lower than at the onset of the thermally-pulsing AGB phase. This allowed a slow but significant growth of the CO core to values characteristic of CO-core ultra-massive white dwarfs. This scenario exploited the lack of understanding of wind rates on first principles and the particularly poor knowledge of mass-loss in very massive AGB (and SAGB) stars. The alternative scenario involved the effects of rotation on the structure of CO cores (see also Dominguez et al., 1996), which lowered their internal pressure, hampered C-ignition, and ultimately narrowed the initial mass range for the formation of ONe WDs. According to Althaus et al. (2021), the higher the rotation rates of the progenitor model stars, the larger the probability of the formation of CO-core ultra-massive white dwarfs. These authors not only suggested a feasible scenario for the formation of CO-core ultra-massive white dwarfs, but also provided accurate core-chemical profiles for these stars.
The existence of CO core ultra-massive white dwarfs is suggested by the analysis of the observations provided by Gaia space mission of the white dwarf population in the Galaxy (Gaia Collaboration et al., 2018). Indeed, the study of Cheng et al. (2019) suggests that 6% of the ultra-massive white dwarf population should have an extra-delay of nearly 8 Gyrs on their cooling times. Several authors have proposed solutions to this extra-cooling anomaly on the ultra-massive white dwarfs (Bauer et al., 2020; Horowitz, 2020; Caplan et al., 2021; Blouin et al., 2021; Camisassa et al., 2021) but none of them has lead to conclusive results. Moreover, the most promising solutions to the extra-cooling anomaly invoke that the ultra-massive white dwarfs that experience the extra-cooling delays harbour CO cores.
Although the evolution of ultra-massive ONe-core white dwarfs has been analyzed in detail in Camisassa et al. (2019), there are few works in the literature devoted to the study of the evolution ultra-massive CO-core white dwarfs. Schwab (2021b) calculated ultra-massive CO white dwarfs, but focused on the most massive white dwarfs, with masses larger than . On the other hand, Bédard et al. (2020) provided ultra-massive CO white dwarf models, but these authors considered artificial initial chemical profiles composed by a constant profile of 50% O and 50% C. The accurate core-chemical composition is a key ingredient in obtaining reliable cooling times. Furthermore, these calculations did not include the energy released due to the phase separation process induced by crystallization, nor the energy released by 22Ne sedimentation. The recent studies of Camisassa et al. (2021) have shown that, although the effect of 22Ne sedimentation is negligible in the evolution of ONe ultra-massive white dwarfs, it is crucial to determine accurate cooling times for CO ultra-massive white dwarfs. This paper is precisely aimed at filling this theoretical gap, providing a set of ultra-massive CO-core white dwarf evolutionary models that include all the relevant energy sources and an accurate chemical profile that results of the full progenitor evolution. Indeed, we consider the initial chemical profiles of Althaus et al. (2021). We also include the energy released by sedimentation, by latent heat and due to the core chemical redistribution during the crystallization process, following the phase diagram of Horowitz et al. (2010), suitable for C and O composition. We also provide accurate magnitudes and colors for our models in the filters used by the spacial mission Gaia: G, , and and by the Sloan Digital Sky Survey (SDSS): , , , and , using model atmospheres of Koester (2010); Koester & Kepler (2019). To the best of our knowledge, this is the first set of fully evolutionary calculations of ultra-massive CO-core white dwarfs including a realistic initial chemical profile, an updated microphysics and the effects of the crystallization process and 22Ne sedimentation. This set of cooling sequences, together with the ONe ultra-massive models of Camisassa et al. (2019), provide an appropriate theoretical framework to study the ultra-massive white dwarf population in our Galaxy.
The paper is organized as follows. In Section 2 we describe the theoretical modelling of our evolutionary calculations. That includes a description of the microphysics considered, the treatment of the energy released by the different energy sources and the chemical profiles considered. In Section 3 we present the results of our evolutionary calculations and we compare them with other ultra-massive white dwarf cooling models existing in the literature. Finally, in Section 4 we analyze the results achieved and summarize them in the concluding remarks.
2 Theoretical white dwarf modelling
The white dwarf evolutionary models presented in this work were calculated using the LPCODE stellar evolutionary code (see Althaus et al., 2005, 2015, for details). This evolutionary code has been amply used in the study of different aspects of low-mass star evolution (see Althaus et al., 2010b; Renedo et al., 2010, and references therein). Moreover, the code has been recently used to generate a new grid of models for post-AGB stars (Miller Bertolami, 2016) and new white dwarf evolutionary sequences (Camisassa et al., 2016; Camisassa et al., 2017, 2019; Camisassa et al., 2021). This code has been tested and calibrated against other codes in different evolutionary phases, such as the red giant phase (Silva Aguirre et al., 2020; Christensen-Dalsgaard et al., 2020) and the white dwarf phase (Salaris et al., 2013), We briefly summarize the main input physics of LPCODE for the white dwarf regime. The radiative and conductive opacities are taken from OPAL (Iglesias & Rogers, 1996) and from Cassisi et al. (2007), respectively. For the low-temperature regime, the code considers molecular radiative opacities with varying carbon-to-oxygen ratios, computed by Ferguson et al. (2005). The code treats convection within the standard mixing length formulation, as given by the ML2 parameterization (Tassoul et al., 1990). We considered the neutrino emission rates of Itoh et al. (1996) for pair, photo, and bremsstrahlung processes, whereas for plasma processes we follow the prescription from Haft et al. (1994). The outer boundary conditions of our evolving models are provided by non-gray model atmospheres both for H-rich and H-deficient composition (see Rohrmann et al., 2012; Camisassa et al., 2017; Rohrmann, 2018, for references). Finally, LPCODE takes into account the changes in the chemical abundances due to element diffusion, including gravitational settling, and chemical and thermal diffusion.
The initial white dwarf models are result of the full progenitor evolution of the model stars computed in Althaus et al. (2021), with the Monash-Mount Stromlo code MONSTAR (Wood & Faulkner, 1987; Frost & Lattanzio, 1996; Campbell & Lattanzio, 2008; Gil Pons et al., 2013, 2018). In this work, we consider the chemical profile that results from the scenario in which the authors computed the evolution of a 7.8 M⊙ model, from the Zero Age Main Sequence, until advanced stages of the thermally-pulsing AGB, when the CO core-mass grew above 1.05 M⊙. Note that this evolutionary sequence was computed scaling-down the mass-loss rates of Vassiliadis & Wood (1993) along the early AGB and the thermally-pulsing AGB. Therefore, in our white dwarf models, the C/O proportion in the core and the total He mass is the result of the full progenitor evolution. The H mass is set to . The core-chemical profile obtained by these authors in this scenario does not present large discrepancies with the one obtained in their so-called stellar rotation scenario. The main differences in the final chemical profiles relies in the mass of the He mantle. That is, the rotation scenario predicts larger He masses that will ultimately be burned at the beginning of the cooling sequence. Therefore, we chose to employ the chemical profile that results of the reduced mass loss scenario, relying on its most accurate determination of the total He mass (see Althaus et al., 2021, for details).
Although Althaus et al. (2021) explored the evolutionary properties of carbon oxygen ultra-massive white dwarfs, these authors only performed evolutionary calculations for models, and did not consider the energy released by sedimentation, since that paper was aimed at providing a plausible scenario for the formation of ultra-massive white dwarfs with carbon oxygen cores. In our paper we consider four white dwarf masses, , , and , to be consistent with the ONe cooling sequences of Camisassa et al. (2019). For each mass, we calculate 8 cooling sequences, one H-rich and one H-deficient for each of the following initial metallicities , , and . In each cooling sequence, we artificially set the initial 22Ne abundances to be constant through the core and equal to the inital metallicity.
At the beginning of the cooling track we perform a mixing of all core chemical components in some unstable layers of the core. This mixing is expected to occur as a result of the inversion of the mean molecular weight in the CO core. We simulate this process by assuming the mixing to be instantaneous. The chemical abundances will change during the white dwarf evolution due to the action of element diffusion. Gravitational settling acts in purifying the envelopes of our models, leaving pure-H envelopes for our H-rich models, and pure He envelopes for our H-deficient models. Chemical and thermal diffusion act as smoothing across chemical interfaces.
2.1 Crystallization
The evolutionary models presented in this work consider both the energy released as latent heat and by the phase separation of carbon and oxygen during the crystallization process. We employed the phase diagram of Horowitz et al. (2010) to obtain the crystallization temperatures and the changes in the chemical abundances due to crystallization. The new CO phase diagram of Blouin et al. (2020) yields similar results, and the azeotropic composition is not reached in our models. We have not included 22Ne distillation process (Blouin et al., 2021), a process whose occurrence is under debate, because, to date, there is not a complete phase diagram published in the literature that covers the entire range of C-O-Ne abundances. The energy released by the crystallization process is included self consistently and locally coupled to the full set of equations of stellar evolution. We considered a two-component crystallization process, where the white dwarf interior is made only of carbon and oxygen with abundance by mass and respectively (). Then, the luminosity equation considered is (see García Berro et al., 2008; Althaus et al., 2010c)):
| (1) |
where is given by:
| (2) |
and is the internal energy per gram.
In equation 1 is the energy released by nuclear reactions, which is disregarded in our white dwarf calculations, and is the energy released by neutrino emission. The third and fourth term in equation 1 correspond to the gravothermal energy release. The fifth term denotes the energy released as latent heat, where is the latent heat of crystallization and is the rate at which the solid core grows. The delta function indicates that the latent heat is released at the solidification front. We considered this latent heat release to be per crystallized ion, where is the temperature at the crystallization front. Finally, the last term corresponds to the energy released by changes in the chemical abundances. This term is usually neglected in normal stars, since it is much smaller than the energy released by nuclear reactions. However, it plays a major role in crystallizing white dwarfs, due to the phase separation process. In the case of CO white dwarfs, is dominated by the ionic contributions, and is negative. Therefore, the last term in Equation 1 will be a source of energy in those regions where the oxygen abundance increases and a sink of energy in those regions where the carbon abundance increases. Following the phase diagram of Horowitz et al. (2010) for a CO white dwarf, the oxygen abundance in the crystallizing region increases, and the surrounding liquid region is depleted in oxygen. This induces a mixing process at the region above the crystallized core due to a Rayleigh-Taylor instability. Therefore, the crystallization process will lead to a source of energy in the crystallizing regions, and a sink of energy in the layers above it, which are depleted on oxygen.
When crystallization sets in, a Rayleigh-Taylor instability rapidly induces a convective region that will characterize nearly 70% of the white dwarf mass, depending on the initial white dwarf chemical profile. We compute the resulting chemical rehomogenization assuming this mixing to be instantaneous (Isern et al., 1997). As the evolution proceeds, the crystallization front moves outward and so does the inner boundary of the mixing region, while its outer boundary barely moves outward. Isern et al. (2017) suggested that this convective mixing can produce a dynamo able to yield magnetic fields as they occur in Solar System planets.
To avoid numerical difficulties when integrating the full set of equations, we computed the crystallization energy released integrating the last term in equation 1 over the whole star during the evolutionary time-step (Isern et al., 1997). Therefore, the energy released by the phase separation process during the evolutionary time-step is:
| (3) |
where is evaluated at the crystallization boundary and
| (4) |
and are the solid and liquid abundances of oxygen at the crystallization front. The first term in the square bracket in Equation 3 corresponds to the energy released at the crystallization front, and the second term, is the energy absorbed, on average, on the convective region () driven by the Rayleigh-Taylor instability. Note that the exact initial chemical profile is crucial to asses the mixing in the liquid layers above the crystallization front, and therefore, the energy absorbed there. Thus, the exact shape of the chemical profile is crucial in determining the net energy released by the crystallization process.
2.2 sedimentation
22Ne is the most abundant trace present in the CO core white dwarfs. The 22Ne abundance in the core is roughly equal to the initial metallicity of the star. This abundance is built up during the helium burning on 14N via the reactions . The neutron excess in 22Ne with respect to the other components of the white dwarf interior, which have equal number of protons and neutrons, results in a net downward gravitational force, inducing the slow settling of 22Ne in the liquid regions toward the center of the white dwarf (Deloye & Bildsten, 2002; Althaus et al., 2010c; Camisassa et al., 2016). To compute the energy released due to 22Ne sedimentation, we add a last term to Equation 1, that corresponds to the energy released by the changes in the abundance of 22Ne. This extra term is (see García Berro et al., 2008, for details):
| (5) |
Since 22Ne is a neutron-rich isotope, the derivative is dominated by the electronic contributions. This is, an increase (decrease) in the local 22Ne abundance implies an increase (decrease) in the molecular weight per electron , forcing the degenerate electron gas to release (absorb) energy. Therefore, 22Ne sedimentation will be a source (sink) of energy in the regions where the local 22Ne abundance increases (decreases).
To compute this process, we employed the diffusion coefficients of Hughto et al. (2010). We assumed that 22Ne diffuses in a one-component plasma background consisting of a fictitious element with atomic weight () and atomic number (), defined by the average and in each layer and not assumed constant through different layers (see Camisassa et al., 2016, for details). During the crystallization process, the liquid regions are carbon enriched, and this carbon enrichment is taken into account when calculating the 22Ne sedimentation. The diffusion of 22Ne is more efficient for a lower of the background element and, therefore, 22Ne sedimentation in the liquid regions will be encouraged by the carbon enrichment in these regions.
3 Results

In Fig. 1 we show a global view of the main energy contributions to the evolution of a typical ultra-massive CO white dwarf model. This Figure shows the different luminosity contributions in our 1.16M⊙ H-rich white dwarf model with solar 22Ne abundance ( model) in terms of the logarithm of the white dwarf cooling time. We define the white dwarf cooling time as the time since the white dwarf reached the maximum effective temperature. The contribution of all the different sources and sinks of energy is equal to the total luminosity. During the entire white dwarf cooling phase, the gravothermal energy is the main energy contribution to the stellar luminosity. At early stages of the white dwarf cooling, the energy released by neutrino emission is an important sink of energy, as it is larger than the stellar luminosity. However, as the evolution proceeds, the white dwarf cools down and the neutrino emission decreases until it is overpassed by the white dwarf luminosity when the cooling age is years. The energy released by the slow settling of 22Ne is nearly constant until it rapidly drops due to the white dwarf crystallization. Therefore, the energy released by 22Ne sedimentation increases its contribution to the total luminosity as the gravothermal energy decreases. It is important to remark that, as the crystallization sets in in the inner regions of the core, 22Ne continues its settling in the outer liquid regions, and this settling is encouraged by the C enhancement in the liquid regions. When the surface luminosity reaches , crystallization starts in the center of our model, when the cooling age is about years. This process releases latent heat and gravitational energy due to the chemical redistribution of C and O. Although this process occurs at lower luminosities than in an ONe ultra-massive white dwarf with the same mass (see Fig 4. of Camisassa et al., 2019), it still occurs when the gravitational energy release is large, thus diminishing its effect on the cooling times. Finally, by the end of the cooling sequence, the temperature of the core drops below the Debye temperature, and consequently, the heat capacity is substantially reduced. Therefore, the white dwarf enters a rapid cooling phase, called the Debye cooling phase.
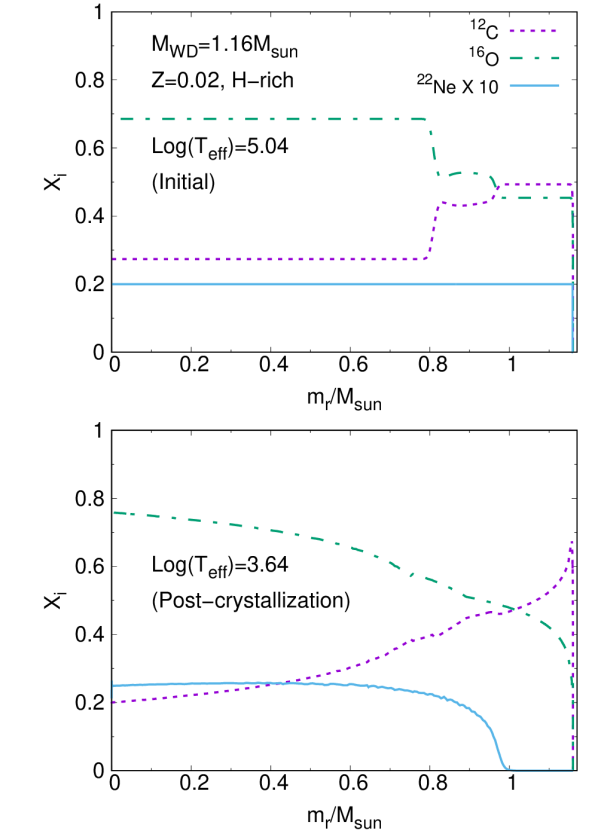
The initial and final chemical profiles of this white dwarf cooling sequence are shown in Figure 2. The abundances of the most important isotopes in this white dwarf model interior, 12C, 16O and 22Ne, are shown. Note that the 22Ne abundance is multiplied by a factor 10, for visualization purposes. The initial chemical profile is the result of the progenitor evolution through the AGB calculated in Althaus et al. (2021). The original chemical profile has been homogenized due to Rayleigh Taylor instabilities in the initial white dwarf composition (see Section 2). In the bottom panel of Figure 2, we show the final chemical profile that results of the crystallization process and 22Ne sedimentation. At this stage, more than 99% of the white dwarf model has crystallized. Note the 16O enrichment in the innermost layers and 12C enrichment in the outermost layers, as a result of phase separation due to crystallization. Since 22Ne diffusion coefficient is larger for a lower atomic number of the background, the 12C enrichment in the outermost layers encourages 22Ne sedimentation in the liquid outer regions when the inner regions are crystallized. Therefore, 22Ne sedimentation has to be calculated consistently with the crystallization process to provide accurate cooling times for white dwarfs, specially when calculating models with high 22Ne abundances.
3.1 The ultra-massive white dwarf cooling times
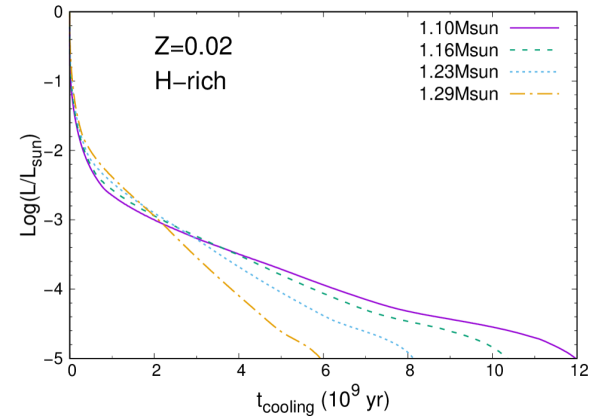
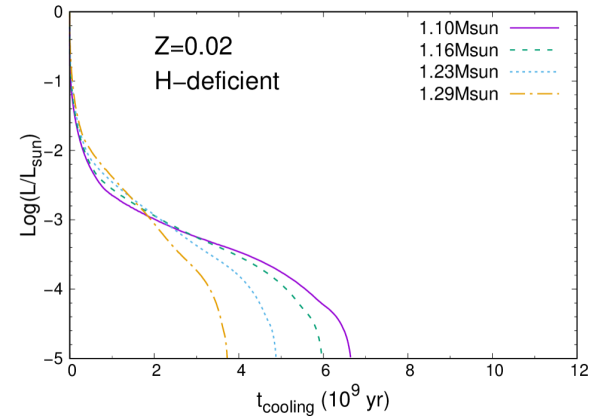
One of the main goals of this study is to provide accurate cooling times for ultra-massive white dwarf models with CO cores. In Figure 3 we show the luminosity as a function of the cooling times for all our solar metallicity (Z=0.02) models. The models with a H (He) envelope are shown in the left (right) panel of this Figure. The differences in the cooling behavior for different white dwarf masses result clear by inspecting this figure. The most massive white dwarfs evolve slower at higher luminosities, but this trend is reversed at lower luminosities, where the more massive the white dwarf is, the faster its cooling is. The short cooling times found for the most massive sequences relies on the fact that these stars enter the Debye regime at higher luminosities, due to their larger characteristic densities, and the specific heat of the ions is strongly reduced. In particular, note the fast cooling of the H-rich 1.29M⊙ white dwarf model, that reaches in years. Moreover, the H-deficient 1.29M⊙ white dwarf sequence reaches in less than years. In general lines, all our H-deficient CO ultra-massive white dwarf models evolve faster than their H-rich counterparts. This result is consistent with previous studies of hydrogen-deficient white dwarfs of Camisassa et al. (2017, 2019). The faster cooling experienced by H-deficient white dwarfs is mainly due to two reasons. First, these stars held outer layers that are more transparent to radiation, and second, the convective coupling occurs earlier in these stars, with the subsequent energy release at higher luminosities. This Figure can be compared with Figure 5 of Camisassa et al. (2019), where the authors find a similar trend for ONe ultra-massive white dwarfs. Finally, the models with other initial metallicities (Z=0.001, Z=0.04 and Z=0.06) calculated in this work are not shown on this plot, but they present a similar behaviour.
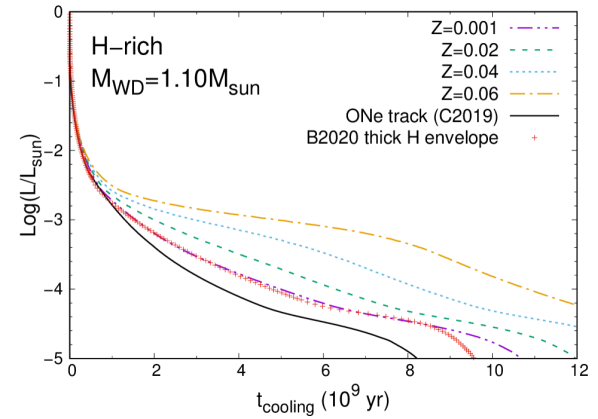
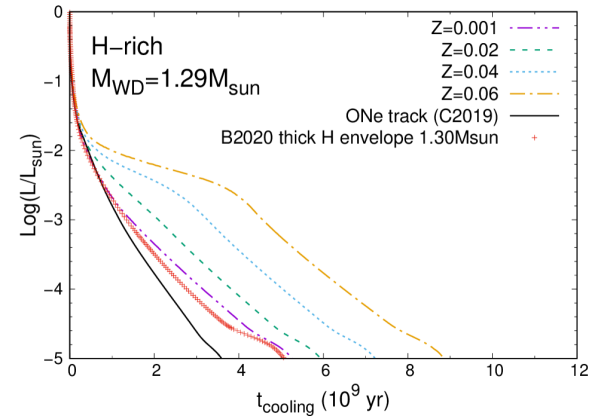
The effect on the cooling times due to the different initial metallicities (or 22Ne abundances) is shown in Figure 4, together with the comparison between our cooling times and the cooling times found in Camisassa et al. (2019) and Bédard et al. (2020). The top panel of this Figure shows the luminosity in terms of the cooling age for our H-rich 1.10M⊙ models with , , and . The H-rich ONe evolutionary sequence of Camisassa et al. (2019) and the thick H-envelope model of Bédard et al. (2020) with the same mass are shown as a solid black line and as a red line, respectively. In the bottom panel of this Figure we plot the luminosity in terms of the cooling age for our H-rich 1.29M⊙ models with , , and , together with the ONe evolutionary sequence of Camisassa et al. (2019) with the same mass and the thick H-envelope model of Bédard et al. (2020) with 1.30M⊙. A first glance of this Figure reveals that ultra-massive CO white dwarfs evolve significantly slower than their ONe counterparts. This result was already noticed in Camisassa et al. (2021), and still holds for ONe models that include 22Ne sedimentation, since this process does not impact the evolutionary times of ONe white dwarfs. Note that, even when compared with our models, where the effect of 22Ne sedimentation is not significant, ONe models evolve markedly faster. The reason for this behaviour relies on the lower thermal content that ONe white dwarfs have, since the specific heat per gram is lower in an ONe plasma than in an CO plasma. Furthermore, ONe white dwarfs crystallize at higher luminosities than CO white dwarfs with the same mass, and therefore, the impact of crystallization on their cooling times is lower.
From both panels of Figure 4 it results clear that, the higher the metallicity (or 22Ne abundance), the longer the cooling times. Since a higher 22Ne abundance results in a larger energy release by 22Ne sedimentation, longer cooling times are obtained for models with high initial . This is particularly true for the 1.10M⊙ cooling sequence with a 22Ne abundance of 0.06, that would reach the faint end of the cooling sequence () in a time longer than the age of the universe. The long cooling times obtained for this sequence are in line with the predictions of Cheng et al. (2019) for the cooling anomaly of ultra-massive white dwarfs. The ultra-massive CO white dwarfs with initial metallicity higher than experience a strong delay on their cooling times due to 22Ne sedimentation. Therefore, these stars are called "forever young white dwarfs" in Camisassa et al. (2021). If we consider a Z distribution of Casagrande et al. (2011), the percentage of white dwarfs expected to have is about 4%. Therefore, 4% of the ultra-massive CO white dwarfs should experience a strong delay on their cooling times due to 22Ne sedimentation.
Finally, the models of Bédard et al. (2020) evolve slightly faster than our models with 22Ne abundance 0.001 with the same mass. These authors did not consider the energy released by 22Ne sedimentation, and therefore, their cooling curves resemble our cooling curves in which the energy released by 22Ne sedimentation is negligible. Further, these authors did not consider the energy released by the phase separation induced by crystallization, and thus, their models evolve even faster. The differences in the chemical composition between our models and Bédard et al. (2020) will also induce differences in the cooling times, but the quantification of these differences is beyond the scope of this paper.
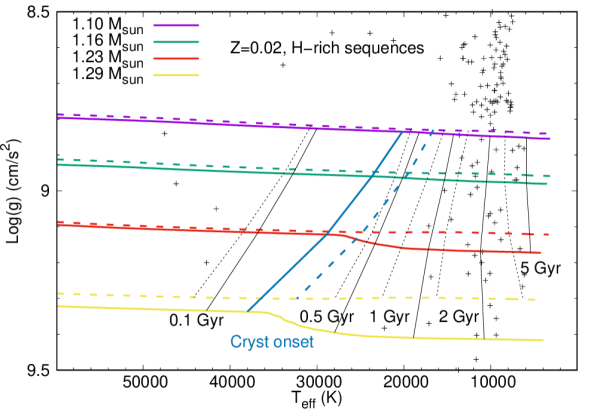
The mass-radius relations of our CO H-rich models and the ONe H-rich models of Camisassa et al. (2019) are shown on the plane in Figure 5. Cooling time isochrones of , , , and Gyrs are shown both for CO and ONe white dwarf models with dashed and solid black lines, respectively. Light-blue dashed and solid lines indicate the crystallization onset for CO and ONe white dwarf models, respectively. Crosses indicate the location of observed ultra-massive white dwarfs in the literature. This Figure reveals that ONe-core white dwarfs are more compact than their CO-core counterparts with the same mass, specially for the most massive models. Further, the isochrones show that ONe-core white dwarfs evolve significantly faster. Therefore, the core-chemical composition of an ultra-massive white dwarf is crucial when determining its mass and its cooling times using and measurements. Assuming erroneously that an ultra-massive white dwarf has CO-chemical composition, would lead to an overestimation of its mass and and incorrect determination of its cooling age. The change of slope in the isochrones reflects the fact that, at early stages of their evolution, higher mass white dwarfs evolve faster, while the opposite occurs at advances stages. Finally, crystallization occurs at lower effective temperatures in CO white dwarfs.
3.2 The colors of our ultra-massive CO models
We provide absolute magnitudes for our evolving models in Gaia and SDSS passbands, on the basis of the atmosphere models of Koester (2010); Koester & Kepler (2019). We considered pure H atmosphere models for our H-rich sequences, and pure He atmosphere models for our H-deficient sequences.
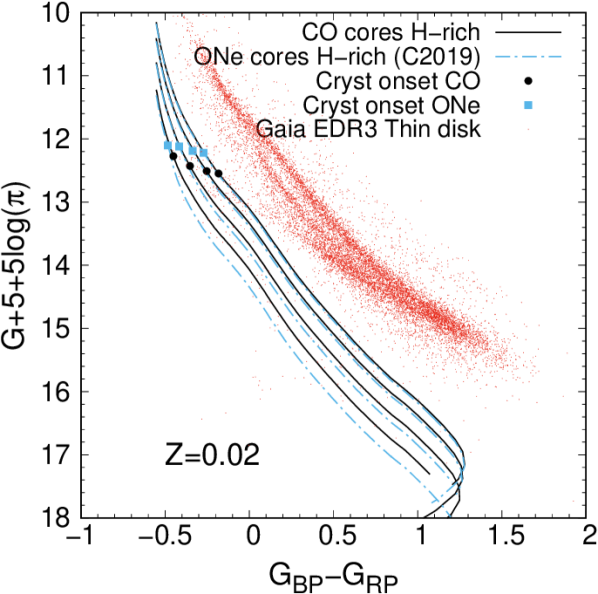
The ultra-massive H-rich CO-core cooling sequences calculated in this work are shown using solid black lines in the Gaia color magnitude diagram in Figure 6. For illustrative purposes we also show the H-rich ONe sequences with the same masses of Camisassa et al. (2019) using dot-dashed cyan lines, together with the 100 pc thin disk white dwarf population of the Gaia Early Data Release 3 (Torres et al., in preparation). The black circles (cyan squares) indicate the crystallization onset in each CO (ONe) evolutionary sequence. All sequences evolve from brighter magnitudes to fainter magnitudes as the evolution proceeds, but ONe white dwarfs evolve faster. In this Figure we can see that ultra-massive white dwarfs are fainter objects than the vast majority of white dwarfs in the Galaxy, due to their smaller characteristic radius. Moreover, ultra-massive ONe white dwarfs are more compact than their CO counterparts and, therefore, they are even fainter. This should be carefully taken into account when using the photometric properties of ultra-massive white dwarfs to determine their masses and cooling ages, since considering CO and ONe models yields different results. Finally, the crystallization process occurs at higher luminosities in ONe white dwarfs than in CO white dwarfs. Therefore, the impact of crystallization on the white dwarf cooling times is less important in an ONe white dwarf than in a CO white dwarf with the same mass. As previously noticed in Bauer et al. (2020), our models confirm that the so-called Q branch is located where CO crystallization is expected to occur, not where ONe crystallization takes place.
4 Conclusions
We present the first set of ultra-massive CO white dwarf cooling sequences in the literature that considers a realistic initial chemical profile, the energy released by latent heat and phase separation during crystallization, and the energy released by the slow sedimentation of 22Ne. The initial chemical profiles are taken from the reduced mass loss scenario in Althaus et al. (2021). A total of 32 cooling sequences have been calculated in this work. We considered four different initial metallicities , , and . This is, for each initial metallicity, we set the initial 22Ne abundance to be constant and equal to the value of . For each metallicity, four white dwarf masses were considered: , , and , and we calculated both H-rich and H-deficient sequences for each mass. We have not explored the evolution of white dwarfs more massive than because, for such massive white dwarfs, general relativistic effects on the structure and on the energetic become important. We defer the exploration of relativistic evolutionary models to a future work (Althaus et al., in preparation). We provide magnitudes in Gaia and SDSS passbands for all these models and made them publicly available.
Ultra-massive white dwarfs harbouring ONe cores evolve significantly faster than their CO counterparts. The fastest cooling in ONe white dwarfs is mainly due to three reasons. First, the thermal content in ONe white dwarfs is smaller. Second, crystallization occurs at higher luminosities in ONe white dwarfs, being its impact on the cooling times less important. And third, 22Ne sedimentation is a less efficient process in an ONe plasma than in a CO plasma. Further, ONe-core white dwarfs are more compact than CO-core white dwarfs with the same mass. These properties should be carefully taken into account when using the photometric and spectroscopic properties of ultra-massive white dwarfs to determine their masses and cooling ages, since considering CO and ONe models yields different results.
We found that the evolution of CO white dwarfs in high-metallicity environments should be strongly affected by 22Ne sedimentation. These white dwarfs evolve several Gyrs slower than CO white dwarfs coming from solar metallicity progenitors. Therefore, the initial 22Ne content in CO ultra-massive white dwarfs is crucial to determine accurate white dwarf cooling times.
We compared our ultra-massive cooling models with the models of Bédard et al. (2020) with the same mass, and found that our models cool down slower. This is because our models consider the energy released by phase separation due to crystallization and by 22Ne sedimentation, while the models of Bédard et al. (2020) neglect these energy sources, and possibly small differences in the cooling times arise due to the difference in the chemical profiles. The cooling curves of Bédard et al. (2020) resemble our cooling sequences in which the energy released by 22Ne sedimentation is negligible ().
This set of cooling sequences, together with the cooling ONe tracks of Camisassa et al. (2019) provides a powerful tool to study the ultra-massive white dwarfs in our Galaxy. A considerable fraction of the ultra-massive CO white dwarf population can also be formed as a result of merger episodes, and, in this case, their 22Ne content could be higher than (Staff et al., 2012). This set of cooling sequences can be used to study the ultra-massive white dwarf population born in stellar mergers, although the cooling times obtained for double white dwarf merger models where a complete mixing of the components occurs could be slightly larger than the cooling times presented in this paper, due to differences in the chemical profiles (Dan et al., 2014; Althaus et al., 2021). Finally, we wish to remark that the core-chemical composition of ultra-massive white dwarfs is not clear to date. There are evolutionary calculations of the progenitor stars of ultra-massive white dwarfs in the literature that predict that a CO composition may be achieved (Althaus et al., 2021; Yoon et al., 2007), and others that predict ONe composition (Siess, 2006; Schwab, 2021a). Further, it has not been possible to distinguish the core-chemical composition of ultra-massive white dwarfs from their observed properties, although a promising avenue is through Asteroseismology (Córsico et al., 2019a, b, 2021). Therefore, these cooling sequences must be considered together with the ONe models of Camisassa et al. (2019) as a full set of ultra-massive white dwarf cooling models. We hope that these models will help to shed light on the core-chemical composition of ultra-massive white dwarfs.
5 Supplementary material
The white dwarf evolutionary models presented in this paper are available for downloading. There are two sets of tables, one with hydrogen-rich models and one with hydrogen-deficient models. Each set contains 16 ultra-massive CO-core white dwarf models, with four different masses: 1.10, 1.16, 1.23 and 1.29 and four different abundances: 0.001, 0.02, 0.04 and 0.06. The abundance roughly corresponds to the initial metallicity of the star. Further, we have included the 8 ultra-massive ONe-core white dwarf models of Camisassa et al. (2019). The columns listed are, from left to right, effective temperature (in K), logarithm of the luminosity (in solar units), cooling time (in years), logarithm of the surface gravity (in CGS), stellar radius (in solar units), magnitudes in the Sloan Digital Sky Survey passbands (, , , and ) and magnitudes in the Gaia DR2 and EDR3 passbands ( G2, , , G3, , and ).
Acknowledgements
We thank the comments of our expert referee, P.-E. Tremblay that helped us to improve the original version of this work. This work was partially supported by the NASA grants 80NSSC17K0008 and 80NSSC20K0193 and the University of Colorado Boulder. This work has made use of data from the European Space Agency (ESA) mission Gaia (https://www.cosmos.esa.int/gaia), processed by the Gaia Data Processing and Analysis Consortium (DPAC, https://www.cosmos.esa.int/web/gaia/dpac/consortium). Part of this work was supported by AGENCIA through the Programa de Modernización Tecnológica BID 1728/OC-AR, by the PIP 112200801-00940 grant from CONICET, by grant G149 from University of La Plata, and by the Spanish project PID 2019-109363GB-100. ST acknowledges the support by the MINECO grant AYA-2017-86274-P and by the AGAUR (SGR-661/2017).
Data Availability Statement
Supplementary material will be available to all readers. The cooling sequences are publicly available for download at http://evolgroup.fcaglp.unlp.edu.ar/TRACKS/tracks.html.
References
- Althaus et al. (2005) Althaus L. G., Serenelli A. M., Panei J. A., Córsico A. H., García Berro E., Scóccola C. G., 2005, A&A, 435, 631
- Althaus et al. (2010a) Althaus L. G., Córsico A. H., Isern J., García Berro E., 2010a, A&ARv, 18, 471
- Althaus et al. (2010b) Althaus L. G., Córsico A. H., Bischoff Kim A., Romero A. D., Renedo I., García Berro E., Miller Bertolami M. M., 2010b, ApJ, 717, 897
- Althaus et al. (2010c) Althaus L. G., García Berro E., Renedo I., Isern J., Córsico A. H., Rohrmann R. D., 2010c, ApJ, 719, 612
- Althaus et al. (2015) Althaus L. G., Camisassa M. E., Miller Bertolami M. M., Córsico A. H., García Berro E., 2015, A&A, 576, A9
- Althaus et al. (2021) Althaus L. G., et al., 2021, A&A, 646, A30
- Bauer et al. (2020) Bauer E. B., Schwab J., Bildsten L., Cheng S., 2020, ApJ, 902, 93
- Bédard et al. (2020) Bédard A., Bergeron P., Brassard P., Fontaine G., 2020, ApJ, 901, 93
- Blouin et al. (2020) Blouin S., Daligault J., Saumon D., Bédard A., Brassard P., 2020, A&A, 640, L11
- Blouin et al. (2021) Blouin S., Daligault J., Saumon D., 2021, ApJ, 911, L5
- Bours et al. (2015) Bours M. C. P., et al., 2015, MNRAS, 450, 3966
- Caiazzo et al. (2021) Caiazzo I., et al., 2021, Nature, 595, 39
- Camisassa et al. (2016) Camisassa M. E., Althaus L. G., Córsico A. H., Vinyoles N., Serenelli A. M., Isern J., Miller Bertolami M. M., García Berro E., 2016, ApJ, 823, 158
- Camisassa et al. (2017) Camisassa M. E., Althaus L. G., Rohrmann R. D., García Berro E., Torres S., Córsico A. H., Wachlin F. C., 2017, ApJ, 839, 11
- Camisassa et al. (2019) Camisassa M. E., et al., 2019, A&A, 625, A87
- Camisassa et al. (2021) Camisassa M. E., Althaus L. G., Torres S., Córsico A. H., Rebassa Mansergas A., Tremblay P. E., Cheng S., Raddi R., 2021, A&A, 649, L7
- Campbell & Lattanzio (2008) Campbell S. W., Lattanzio J. C., 2008, A&A, 490, 769
- Caplan et al. (2021) Caplan M. E., Freeman I. F., Horowitz C. J., Cumming A., Bellinger E. P., 2021, ApJ, 919, L12
- Casagrande et al. (2011) Casagrande L., Schönrich R., Asplund M., Cassisi S., Ramírez I., Meléndez J., Bensby T., Feltzing S., 2011, A&A, 530, A138
- Cassisi et al. (2007) Cassisi S., Potekhin A. Y., Pietrinferni A., Catelan M., Salaris M., 2007, ApJ, 661, 1094
- Cheng et al. (2019) Cheng S., Cummings J. D., Ménard B., 2019, ApJ, 886, 100
- Cheng et al. (2020) Cheng S., Cummings J. D., Ménard B., Toonen S., 2020, ApJ, 891, 160
- Christensen-Dalsgaard et al. (2020) Christensen Dalsgaard J., et al., 2020, A&A, 635, A165
- Córsico et al. (2019a) Córsico A. H., Althaus L. G., Miller Bertolami M. M., Kepler S. O., 2019a, A&ARv, 27, 7
- Córsico et al. (2019b) Córsico A. H., De Gerónimo F. C., Camisassa M. E., Althaus L. G., 2019b, A&A, 632, A119
- Córsico et al. (2021) Córsico A. H., Althaus L. G., Gil Pons P., Torres S., 2021, A&A, 646, A60
- Curd et al. (2017) Curd B., Gianninas A., Bell K. J., Kilic M., Romero A. D., Allende Prieto C., Winget D. E., Winget K. I., 2017, MNRAS, 468, 239
- Dan et al. (2014) Dan M., Rosswog S., Brüggen M., Podsiadlowski P., 2014, MNRAS, 438, 14
- Deloye & Bildsten (2002) Deloye C. J., Bildsten L., 2002, ApJ, 580, 1077
- Doherty et al. (2017) Doherty C. L., Gil Pons P., Siess L., Lattanzio J. C., 2017, Publ. Astron. Soc. Australia, 34, e056
- Dominguez et al. (1996) Dominguez I., Straniero O., Tornambe A., Isern J., 1996, ApJ, 472, 783
- Dunlap & Clemens (2015) Dunlap B. H., Clemens J. C., 2015, in Dufour P., Bergeron P., Fontaine G., eds, Astronomical Society of the Pacific Conference Series Vol. 493, 19th European Workshop on White Dwarfs. p. 547
- Ferguson et al. (2005) Ferguson J. W., Alexander D. R., Allard F., Barman T., Bodnarik J. G., Hauschildt P. H., Heffner Wong A., Tamanai A., 2005, ApJ, 623, 585
- Fontaine & Brassard (2008) Fontaine G., Brassard P., 2008, PASP, 120, 1043
- Frost & Lattanzio (1996) Frost C. A., Lattanzio J. C., 1996, ApJ, 473, 383
- Gaia Collaboration et al. (2018) Gaia Collaboration et al., 2018, A&A, 616, A10
- Garcia Berro & Iben (1994) Garcia Berro E., Iben I., 1994, ApJ, 434, 306
- García Berro & Oswalt (2016) García Berro E., Oswalt T. D., 2016, New Astronomy Reviews, 72, 1
- García Berro et al. (2008) García Berro E., Althaus L. G., Córsico A. H., Isern J., 2008, ApJ, 677, 473
- Gianninas et al. (2011) Gianninas A., Bergeron P., Ruiz M. T., 2011, ApJ, 743, 138
- Gil Pons et al. (2013) Gil Pons P., Doherty C. L., Lau H., Campbell S. W., Suda T., Guilani S., Gutiérrez J., Lattanzio J. C., 2013, A&A, 557, A106
- Gil Pons et al. (2018) Gil Pons P., Doherty C. L., Gutiérrez J. L., Siess L., Campbell S. W., Lau H. B., Lattanzio J. C., 2018, Publ. Astron. Soc. Australia, 35, 38
- Haft et al. (1994) Haft M., Raffelt G., Weiss A., 1994, ApJ, 425, 222
- Hollands et al. (2020) Hollands M. A., et al., 2020, Nature Astronomy,
- Horowitz (2020) Horowitz C. J., 2020, Phys. Rev. D, 102, 083031
- Horowitz et al. (2010) Horowitz C. J., Schneider A. S., Berry D. K., 2010, Physical Review Letters, 104, 231101
- Hughto et al. (2010) Hughto J., Schneider A. S., Horowitz C. J., Berry D. K., 2010, Phys. Rev. E, 82, 066401
- Iglesias & Rogers (1996) Iglesias C. A., Rogers F. J., 1996, ApJ, 464, 943
- Isern et al. (1997) Isern J., Mochkovitch R., García Berro E., Hernanz M., 1997, ApJ, 485, 308
- Isern et al. (2017) Isern J., García-Berro E., Külebi B., Lorén-Aguilar P., 2017, ApJ, 836, L28
- Itoh et al. (1996) Itoh N., Hayashi H., Nishikawa A., Kohyama Y., 1996, ApJs, 102, 411
- Kepler et al. (2016) Kepler S. O., et al., 2016, MNRAS, 455, 3413
- Kilic et al. (2021) Kilic M., Bergeron P., Blouin S., Bédard A., 2021, MNRAS, 503, 5397
- Kleinman et al. (2013) Kleinman S. J., et al., 2013, ApJs, 204, 5
- Koester (2010) Koester D., 2010, Mem. Soc. Astron. Italiana, 81, 921
- Koester & Kepler (2019) Koester D., Kepler S. O., 2019, A&A, 628, A102
- Lorén Aguilar et al. (2009) Lorén Aguilar P., Isern J., García Berro E., 2009, A&A, 500, 1193
- Maoz et al. (2018) Maoz D., Hallakoun N., Badenes C., 2018, MNRAS, 476, 2584
- Miller Bertolami (2016) Miller Bertolami M. M., 2016, A&A, 588, A25
- Miller et al. (2021) Miller D. R., Caiazzo I., Heyl J., Richer H., 2021, arXiv e-prints, p. arXiv:2110.09668
- Mukadam et al. (2004) Mukadam A. S., et al., 2004, ApJ, 607, 982
- Nitta et al. (2016) Nitta A., et al., 2016, IAU Focus Meeting, 29, 493
- Reindl et al. (2020) Reindl N., Schaffenroth V., Miller Bertolami M. M., Geier S., Finch N. L., Barstow M. A., Casewell S. L., Taubenberger S., 2020, A&A, 638, A93
- Renedo et al. (2010) Renedo I., Althaus L. G., Miller Bertolami M. M., Romero A. D., Córsico A. H., Rohrmann R. D., García Berro E., 2010, ApJ, 717, 183
- Rohrmann (2018) Rohrmann R. D., 2018, MNRAS, 473, 457
- Rohrmann et al. (2012) Rohrmann R. D., Althaus L. G., García Berro E., Córsico A. H., Miller Bertolami M. M., 2012, A&A, 546, A119
- Salaris et al. (2013) Salaris M., Althaus L. G., García Berro E., 2013, A&A, 555, A96
- Schwab (2021a) Schwab J., 2021a, ApJ, 906, 53
- Schwab (2021b) Schwab J., 2021b, ApJ, 916, 119
- Siess (2006) Siess L., 2006, A&A, 448, 717
- Siess (2007) Siess L., 2007, A&A, 476, 893
- Siess (2010) Siess L., 2010, A&A, 512, A10
- Silva Aguirre et al. (2020) Silva Aguirre V., et al., 2020, A&A, 635, A164
- Staff et al. (2012) Staff J. E., et al., 2012, ApJ, 757, 76
- Tassoul et al. (1990) Tassoul M., Fontaine G., Winget D. E., 1990, ApJs, 72, 335
- Temmink et al. (2020) Temmink K. D., Toonen S., Zapartas E., Justham S., Gänsicke B. T., 2020, A&A, 636, A31
- Toonen et al. (2017) Toonen S., Hollands M., Gänsicke B. T., Boekholt T., 2017, A&A, 602, A16
- Vassiliadis & Wood (1993) Vassiliadis E., Wood P. R., 1993, ApJ, 413, 641
- Winget & Kepler (2008) Winget D. E., Kepler S. O., 2008, ARA&A, 46, 157
- Wood & Faulkner (1987) Wood P. R., Faulkner D. J., 1987, Proceedings of the Astronomical Society of Australia, 7, 75
- Yoon et al. (2007) Yoon S. C., Podsiadlowski P., Rosswog S., 2007, MNRAS, 380, 933