Studying the mixed transmission in a community with age heterogeneity: COVID-19 as a case study
Abstract
COVID-19 has been prevalent worldwide for about 2 years now and has brought unprecedented challenges to our society. Before vaccines were available, the main disease intervention strategies were non-pharmaceutical. Starting December 2020, in Ontario, Canada, vaccines were approved for administering to vulnerable individuals and gradually expanded to all individuals above the age of 12. As the vaccine coverage reached a satisfactory level among the eligible population, normal social activities resumed and schools reopened starting September 2021. However, when schools reopen for in-person learning, children under the age of 12 are unvaccinated and are at higher risks of contracting the virus. We propose an age-stratified model based on the age and vaccine eligibility of the individuals. We fit our model to the data in Ontario, Canada and obtain a good fitting result. The results show that a relaxed between-group contact rate may trigger future epidemic waves more easily than an increased within-group contact rate. An increasing mixed contact rate of the older group quickly amplifies the daily incidence numbers for both groups whereas an increasing mixed contact rate of the younger group mainly leads to future waves in the younger group alone. The results indicate the importance of accelerating vaccine rollout for younger individuals in mitigating disease spread.
Keywords: COVID-19, Age-stratified Model, Mixed Social Contact Pattern, Disease Mitigation Strategy
1 Introduction
COVID-19 has been prevalent worldwide for around 2 years now since the initial identification in Wuhan, China in December 2019. The global pandemic has caused more than 328,000,000 total infections and over 5,500,000 deaths worldwide [31]. In Ontario, Canada alone, the total confirmed case number of COVID-19 surpassed 970,000 and more than 10,000 population deceased due to complications of COVID-19 infection [4].
The novel pneumonia disease can be transmitted via close contact between susceptible and infected populations, similar to other pneumonia diseases such as influenza. However, recent evidences show that the majority of COVID-19 transmission may be attributed to the aerosol droplets [1, 30]. The transmission via aerosol implies that the spread of the disease may occur in a long-range, which signifies the difficulties of mitigating the disease spread.
In Ontario, before vaccines were approved, the main disease mitigation strategies were non-pharmaceutical, such as closing non-essential businesses, practising social distancing, setting limitations of indoor gathering size, requiring mandatory face-covering etc. The non-pharmaceutical strategies are effective in mitigating the disease spread but disrupt normal social activities and cause huge economic loss. Therefore, aggressive strategies can only be imposed in a short period and are not practical in long term. Progressing into the second year of the pandemic, vaccines were approved by Health Canada in December 2020 and quickly rolled out across the province.
In the initial stage of the vaccine rollout program, vaccines were administered to the senior population or other vulnerable individuals with underlying health conditions. Starting in late May 2021, Health Canada expanded the criteria so that all individuals above the age of 12 were eligible for receiving vaccines. The vaccine for children between the age of 5 to 11 was approved recently in late November 2021 but the rollout takes time and only of the children in the age group are fully vaccinated up to now [2].
Clinical trail evidences show that vaccines offer a high protection efficacy for vaccinated individuals that reduces the probability of infection to a large extent [31]. As the vaccine coverage steadily increased and reached a satisfactory level among eligible individuals, the province lifted majority of the restrictive measures in July 2021. During this time, unvaccinated children were on the summer break and weren’t on high risks of transmitting the disease because of limited contacts within the household.
Starting in September 2021, schools reopen and in-person learning resumes. In-person learning environment inevitably creates a larger social gathering size, larger contact numbers between the children, and a higher infection probability in the indoor setting. Evidences show that children are at a lower risk of developing serious symptoms after contracting the virus and therefore the within-group transmission may not raise serious concerns. However, children may transmit the disease to elder family members within the household after school. Infected elder individuals are more likely to develop serious symptoms and need medical attention, which causes stress on the provincial health system.
Mathematical models have been used extensively in studying COVID-19 since the initial emergence of the disease, see [13, 15, 18, 19, 21, 25, 27, 29, 32] for example. The aforementioned studies focus on modeling the initial wave of the pandemic and provide valuable insights in short-term predictions and disease intervention strategies. Age-stratified models were proposed to study the heterogeneity in social contact patterns among a susceptible population in early stage of the disease [5, 7, 8, 20]. Statistical analyses were applied in studying various aspects of the disease spread, such as identifying the impact of undiagnosed cases in COVID-19 [10], the importance of household transmission [24], and suggestions for testing policy [16]. As the disease evolves, particularly with the rollout of vaccines and resumption of normal social activities, models need to be revisited to gain better understanding of the disease spread.
In this paper, we propose an age-stratified model where individuals in the older group are eligible for receiving vaccines while the individuals in the younger group are not. We fit the model to the COVID-19 data in Ontario, Canada for illustration. In Ontario, the schools reopen starting in September 2021 and the vaccines for children haven’t been approved by then. The individuals above the age of 12 are eligible for receiving vaccines but breakthrough infections may occur due to relaxed social distancing. The main objective of this paper is to identify the relative importance of within-group transmission and between-group transmission and shed light on future disease mitigation strategies.
2 Methods
2.1 Data
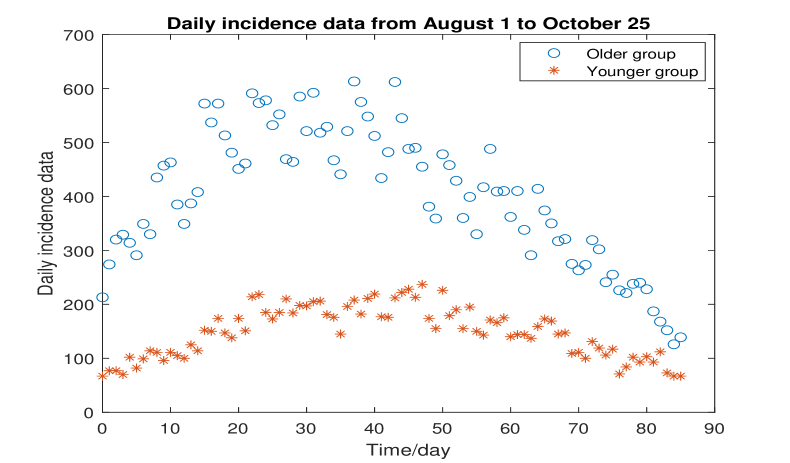
We accessed the COVID-19 data in Ontario from the online data catalogue in Ontario government [26]. The data contains demographic information of individuals who are confirmed of positive COVID-19 infection among all 34 health units across Ontario, such as age, sex, and location of the reporting health unit. Figure 1 shows the daily incidence number between Aug. 1, 2021 and Oct. 25, 2021, based on the estimated symptom onset date recorded in [26]. In the aforementioned time window, individuals who are above the age of 12 are eligible for receiving vaccines but individuals who are below the age of 12 haven’t been approved for receiving vaccines yet. Therefore, in this study, we divide the entire population in Ontario into two groups: the older group and the younger group, where individuals are above/below the age of 12 respectively. Figure 1 demonstrates the daily incidence case number for each group separately.
2.2 The model
We propose a compartmental model that stratifies the entire population into the following compartments: susceptible class (), vaccinated class (), exposed class (), asymptomatic class (), unreported symptomatic class (), confirmed infected class (), recovered class (), and the deceased class (). Moreover, within each compartment, we further stratify individuals into the older group and the younger group, as denoted by for for example. Figure 2 demonstrates the flowchart of the model. Note that within the time window between August and October, the individuals below the age of 12 are not eligible for receiving vaccines and therefore, the compartment comprises of vaccinated individuals of the older group only.
In the model, individuals in the exposed class () are individuals who have been infected with the COVID-19 virus but are still in the incubation period and are not contagious yet. Vaccinated individuals are at a lower risk of contracting the virus but may still become infected because the vaccine efficacy is not Asymptomatic individuals in class () are those who are contagious but show no symptoms of infection. On the other hand, individuals in class () show mild symptoms and are also contagious but do not seek medical resources for diagnosis. Individuals in class () are those who are confirmed with the COVID-19 infection and are in quarantine at home if they experience mild to moderate symptoms or are in the hospital if they show severe symptoms. Because individuals in class () follow the public health protocols, we assume that they maintain a very low possibility of transmitting the disease. Individuals in all the asymptomatic classes, unreported symptomatic class, and reported infected class may recover and are no longer transmissible and therefore move to the recovered class ().
Based on the aforementioned discussions, the model for the older group, where individuals are above the age of 12 and are eligible to be vaccinated is
| (2.1) | ||||
In (2.2), represents the within-group transmission of the susceptible population, where are the infectious contact rates between susceptible individuals and asymptomatic/unreported symptomatic individuals in the older group. Moreover, represents the between-group transmission, where are the contact rates between susceptible individuals in the older group and the asymptomatic/unreported infected individuals in the younger group.
Similarly, is the within-group transmission of the vaccinated individuals, where are the contact rates between vaccinated individuals and asymptomatic/unreported symptomatic individuals in the older group. Furthermore, is the between-group transmission of the vaccinated individuals, where are the contact rates between the vaccinated individuals and the asymptomatic/unreported symptomatic individuals in the younger group. Because vaccinated individuals are at lower risk of transmitting the disease, we introduce the factor in to indicate the reduced probability of infection where is the vaccine efficacy and
The model for the younger group is similar but without the vaccinated compartment because individuals below the age of 12 are not eligible for receiving vaccines. The model is
| (2.2) | ||||
where is the within-group transmission of the susceptible individuals, and is the between-group transmission of the susceptible individuals.
In (2.2)-(2.2), is the proportion of the exposed individuals who move to the asymptomatic class and is the proportion of the exposed individuals who move to the unreported symptomatic class. This leaves as the proportion of the exposed individuals who eventually move to the reported symptomatic class. We assume that are the same for both the older and the younger groups because there is no evidence so far that suggests the proportions of asymptomatic individuals and symptomatic individuals differ significantly among different age groups.
Susceptible individuals in the older group transfer to the vaccinated class at a rate of The parameter will be estimated below from the data in Figure 1. Exposed individuals in the older and the younger group move to either the asymptomatic class/unreported symptomatic class/reported infected class at a rate of for respectively. Based on [14, 17], we fix for because evidence shows that individuals who have contracted the virus generally have an incubation period of 2-3 days before they become contagious.
Asymptomatic individuals in the older group and the younger group move to the recovered class at a rate of and respectively. Similarly, the unreported infected individuals and the confirmed infected individuals in the older/younger group recover from the infection at a rate of and for . We assume that where based on [18], which indicates that in average, infected individuals may transmit the disease within a period of 7 days until they recover and are no longer contagious.
Unreported infected individuals may seek diagnosis from medical facilities if the symptoms persist or their heath deteriorates over time and therefore move to the reported infected class at a rate of In [17], the authors analyzed the patients’ data and recorded that infected individuals waited for an average of 4.6 days after observing symptoms before they sought diagnosis. Hence, in our study, we assume that for
2.3 The reproduction number
We first calculate the basic reproduction number for the age-structured model (2.2)-(2.2). Direct calculations show that
which leads to the total population of the older group as a constant Similarly, the total population in the younger group also remains as a constant Hence, the disease-free equilibrium of (2.2)-(2.2) is
Following the next generation matrix method for compartmental models in [28], we obtain
It follows that
| (2.3) |
where
To predict the severity of the disease spread at an arbitrary time of the epidemics, we calculate the effective reproduction number , where is the total susceptible population at time t and is the total susceptible population at the initial time when the epidemic starts [6, 23]. Biologically, the effective reproduction number implies that the disease persists if and diminishes if
2.4 Parameter estimation
Based on the census data in Ontario, the total population of the older group at the beginning of the pandemic is 12,932,471 and the total population of the younger group is 1,801,543. The number of cumulative infections until July 31, 2021 for the older group is 555,583 whereas the total infection case for the younger group is 50,156 [2]. The vaccine coverage data shows that a total number of 10,582,731 individuals received at least one dose and a total of 9,147,534 individuals are fully vaccinated with two doses. We average the data to obtain the estimated initial population of the vaccinated compartment It follows that the initial susceptible population for the older group is Similarly, the initial susceptible population for the younger group is On August 1, the reported infection number for the older group is 200 and the reported infection number for the younger group is 18, which leads to and respectively.
We fit the model (2.2), (2.2) to the daily incidence data in Figure 1 by the Markov Chain Monte Carlo (MCMC) method and adopt the adaptive Metropolis-Hastings algorithm to carry out this approach [9]. We run the algorithm for 10,000 iterations with a burn-in of the first 7,000 iterations. Geweke convergence test is employed to diagnose the convergence of the Markov chains. The estimated parameters and the initial data are listed in Table 1.
| Parameter | Definition | Estimated Mean Value | Standard Deviation | Data Source |
| Contact rate between and | Fitted | |||
| Contact rate between and | Fitted | |||
| Transition rate from to | Fitted | |||
| Contact rate between and | Fitted | |||
| Contact rate between and | Fitted | |||
| Contact rate reduction between and | Fitted | |||
| Transition rate from to | [17] | |||
| Transition rate from to | [17] | |||
| Proportionality of transferred to | [22] | |||
| Proportionality of transferred to | [22] | |||
| Recovery rate of | [18] | |||
| Recovery rate of | [18] | |||
| Recovery rate of | [18] | |||
| Transition rate from to | [18] | |||
| Disease death rate of | Fitted | |||
| Contact rate between and | Fitted | |||
| Contact rate between and | Fitted | |||
| Disease death rate of | Fitted | |||
| Initial Value | Definition | Estimated Mean Value | Standard Deviation | Data Source |
| Initial susceptible population of group-1 | [2] | |||
| Initial vaccinated population | [2] | |||
| Initial exposed population of group-1 | 912.8571 | Fitted | ||
| Initial asymptomatic population of group-1 | Fitted | |||
| Initial unreported population of group-1 | Fitted | |||
| Initial reported case number of group-1 | [2] | |||
| Initial susceptible population of group-2 | [2] | |||
| Initial exposed population of group-2 | Fitted | |||
| Initial asymptomatic population of group-2 | Fitted | |||
| Initial unreported population of group-2 | Fitted | |||
| Initial reported case number of group-2 | [2] |
3 Results
(\@slowromancapi@) Fitting results
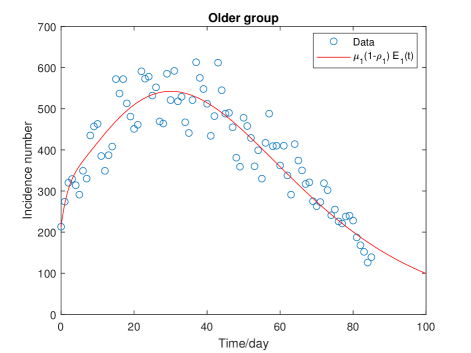
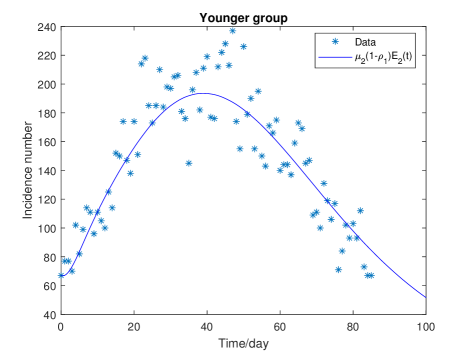
Figure 3 shows the fitting result of the daily incidence data in Figure 1 to the older group (2.2) and the younger group (2.2) respectively. As shown in Figure 3, the daily incidence data increases initially but then declines. The data shows the fourth wave of COVID-19 in Ontario, which is before the new variant emerges in Canada. The initial increase of the daily incidence case number may be attributed to the reopening in August and September, when the vaccine program steadily rolls out. It is then followed by a gradual decline, which is due to a combination of a few factors, such as a high vaccine coverage among eligible individuals, implementation of health protocols etc. Figure 3 indicates that the daily incidence data changes in the same pattern for both the older and the younger groups but the infected case number peaks slightly later in the younger group than the older group.
Under the current set of parameters in Table 1, the prediction of (2.2), (2.2) indicates that the disease dies out eventually. The prediction is confirmed by the effective reproduction number by substituting the parameter values in Table 1. However, starting in November and afterwards, vaccinated individuals may experience higher probabilities of infection because of the gradual decline of vaccine protection efficacy. Meanwhile, before December, individuals in the younger group are still not eligible for receiving vaccines but are at higher risks of infection. This is mainly because children stay indoors more often due to the weather condition and will contract the virus more easily if they follow the same health protocols as before. We will explore different scenarios below by increasing the within-group contact rate and the between-group contact rate.
(\@slowromancapii@) Comparing the relative importance of the within-group and between-group transmission
Next, we analyze the impact of and on future epidemic waves and compare the relative importance of the within-group contact rate and the between-group contact rate on the final epidemic size. By increasing the contact rate or , we obtain a similar pattern of the future waves for both the older group and the younger group and hence show only the result of the older group.
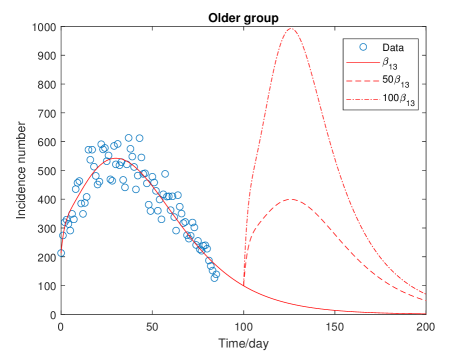
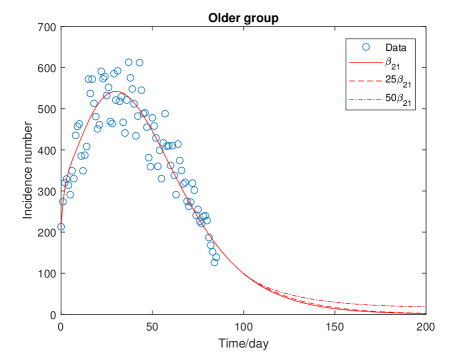
Figure 4a shows that the daily incidence number of the older group increases and initiates a further wave if the within-group contact rate increases. The further epidemic wave achieves a higher peak if the contact rate is larger. However, the peak size of epidemics is relatively small compared to the peak size of the fourth wave even if the contact rate is larger and is on an order of different magnitude.
However, Figure 4b shows that an increasing between-group contact rate triggers a future epidemic wave of a large size. The peak size of future epidemic waves possibly exceeds the peak size of the fourth wave if the between-group contact rate of the older group is sufficiently large. Figure 4 shows that the between-group contact rate of the older group imposes a much larger impact on future epidemic waves compared to the within-group contact rate.
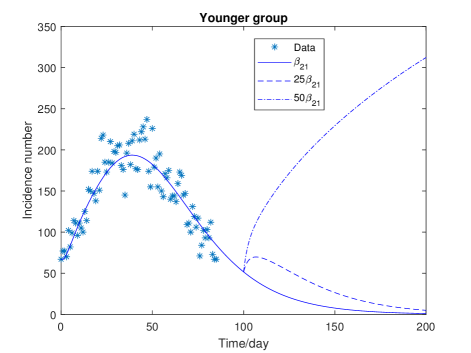
Next, we increase the within-group contact rate of the younger group Figure 5a demonstrates that the daily incidence number of the older group declines monotonically even if increases significantly. However, the daily incidence number of the younger group shifts to a gradual increase from the original decline if increases, as shown in Figure Figure 5b. More importantly, the daily incidence number of the younger group increases rapidly and forms a new epidemic wave of the size much larger than the fourth wave if is relatively large.
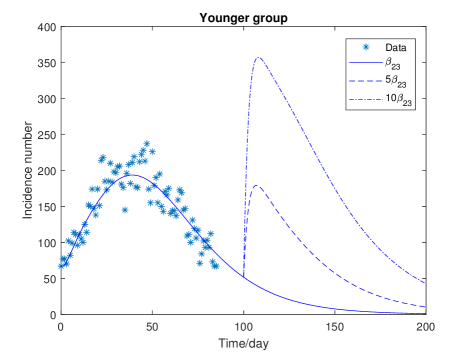
We also examine how the between-group contact rate of the younger group may trigger the future epidemic waves. Figure 6a shows that the daily incidence number of the older group decreases monotonically if increases. However, by comparing Figure 5a and Figure Figure 6a, we observe that the daily incidence number of the older group is more sensitive to than even though a steady decline holds for both varying and in reasonable ranges. Figure 6b indicates that an increasing between-group contact rate of the younger group leads to a rapid increase in the daily incidence number of the younger group. The new wave reaches the peak of a larger size than the fourth wave in a short time and then declines.
Overall, Figure 4, Figure 5, Figure 6 demonstrate that an increasing between-group contact rate in either the older group or the younger group may trigger future epidemic waves. The difference is that an increasing between-group contact rate of the older group leads to rapid growths of the daily incidence numbers of both groups whereas an increasing between-group contact rate of the younger group impacts more heavily on the younger group alone. The results indicate that a mixed transmission in different age groups plays an important role in triggering future waves and hence confirms the importance of vaccinating the younger group. The results also shed light on the demographic structure among the infected individuals in future waves: reported cases in the younger group will constitute a heavier proportion in the total infected individuals.


(\@slowromancapiii@) Sensitivity analysis
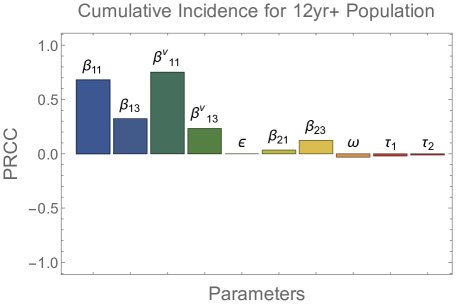
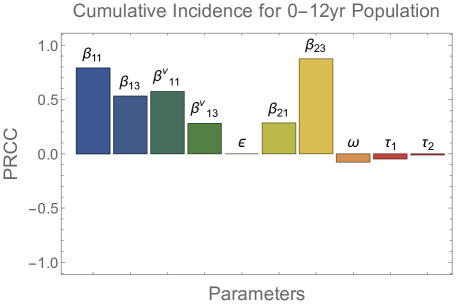
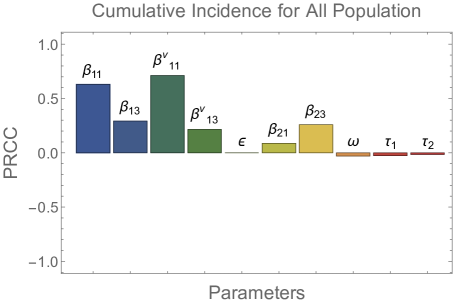
In this section, we conduct sensitivity analysis to investigate the sensitivity of the total cumulative infection and infection number in each age-group on the estimated parameters. For each parameter, Latin Hypercube Sampling [3, 12] is adopted to generate parameter values with assumed ranges and distributions as specified in Table 2. We generate 3000 sets of parameter values for the analysis. By using these sets of values, partial rank correlation coefficients (PRCC) are calculated to determine the impact of varying parameters on the number of cumulative infections of COVID-19 between August and October, 2021 [11]. The PRCC indices range between -1 and 1, with positive (negative) values indicating a positive (negative) relationship and magnitudes indicating the relative level of impact on the quantity of interest, with a magnitude of 0 having almost no impact and 1 having the most influential impact.
| Parameter | Lower Bound | Upper Bound | Distribution |
| 0 | T | ||
| 0 | T | ||
| 0 | T | ||
| 0 | T | ||
| 0 | 1 | T | |
| 0 | T | ||
| 0 | T | ||
| 0 | T | ||
| 0 | 0.3 | T | |
| 0 | 0.3 | T |
-
•
indicates triangular distribution with its peak value from Table 1.
Figure 7 shows the PRCC for cumulative incidence number of COVID-19 infection for the older group, the younger group, and the entire population in Ontario between August 1 and October 25, 2021. Figure 7a, Figure 7b, Figure 7c demonstrate that the transition rate from unreported infected class to reported infected class in respective group and vaccination rate in the older group have negative impact on the number of cumulative infections. The result is not surprising because individuals in the reported infected class are excluded from social activities due to self-isolation or hospitalization and therefore unable to transmit the pathogen whereas vaccinated individuals gain immunity and become less susceptible to infection. Comparing , vaccination rate has a stronger influence than the reporting rates and , which implies that vaccination is a more effective means to control the spread of disease than reporting infected cases. Moreover, reporting rate of the older group has a relatively larger impact than reporting rate of the younger group because the majority of infected population are adults.
4 Conclusion and Discussion
Since the initial identification of COVID-19 in Wuhan, China, the transmissible disease quickly escalates and becomes a global pandemic for about 2 years up to now. In Ontario, Canada, during the first year of the disease prevalence, the main intervention strategies have been nonpharmaceutical, such as provincial-wise lock down, keeping social distancing etc. due to the lack of effective vaccines. Such interventions are effective in mitigating the disease spread but cause significant economic loss at the same time and therefore are not long-lasting.
Progressing to the second year of the pandemic, in Ontario, starting from December 2020, the vaccine program gradually rolls out. The initial phase of the vaccine rollout targets the seniors population or vulnerable individuals and then gradually expands to individuals who are above the age of 12. The vaccine for children between the age of 5 to 11 was approved by Health Canada in late November but the rollout takes time and only of the children in the age of 5-11 are fully vaccinated by now [2].
In this paper, we propose an age-stratified model that divides the entire population in Ontario into two groups: the older group where individuals are above the age of 12 and are eligible to receive vaccines and the younger group where individuals are below the age of 12 and are not eligible to receive vaccines. We fit the model to the daily incidence data of each group in Ontario between August 1, 2021 and October 25, 2021 and obtain a good fitting result.
The results demonstrate that between-group contact rate plays a more important role in triggering future waves than the within-group contact rate. The increasing between-group contact rate of the older group shifts the daily incidence number of either group from the decline to a rapid growth. However, an increasing between-group contact rate of the younger group mainly leads to a new epidemic wave in the younger group only. The results confirm the importance of achieving a high vaccine coverage in the younger group in order to mitigate the disease spread.
A new variant B.1.1.529 emerges in late November, 2021 in multiple African countries and quickly spreads to Canada in December. Early data indicate that the new variant is highly transmissible compared to other variants. Moreover, data show that currently, vaccines offer a much lower protection efficacy for even fully vaccinated individuals. Our model can be extended to study the invasion of the new variant, which leaves as future work.
Acknowledgement
XW is grateful for funding from the NSERC of Canada (RGPIN-2020-06825 and DGECR-2020-00369).
References
- [1] Azimi, P., Keshavarz, Z., Laurent, J.G.C., Stephens, B. and Allen, J.G. (2021). Mechanistic transmission modeling of COVID-19 on the Diamond Princess cruise ship demonstrates the importance of aerosol transmission. Proceedings of the National Academy of Sciences, 118, e2015482118.
-
[2]
Age stratified data of COVID-19 cases in Ontario (2021).
Available from: https://www.publichealthontario.ca/en/data-and-analysis/infectious-disease/covid-19-data-surveillance. - [3] Blower, S.M. and Dowlatabadi, H. (1994). Sensitivity and uncertainty analysis of complex models of disease transmission: an HIV model, as an example. International Statistical Review/Revue Internationale de Statistique, 229–243.
- [4] COVID-19 Data Repository by the Center for Systems Science and Engineering (CSSE) at Johns Hopkins University. Available from: https://github.com/CSSEGISandData/COVID-19.
- [5] Davies, N.G., Klepac, P., Liu, Y. et al. (2020). Age-dependent effects in the transmission and control of COVID-19 epidemics. Nature Medicine, 26, 1205–1211.
- [6] Diekmann, O. and Heesterbeek, J.A.P. (2000). Mathematical Epidemiology of Infectious Diseases: Model Building, Analysis and Interpretation, John Wiley.
- [7] Fields, R., Humphrey, L., Flynn-Primrose, D., Mohammadi, Z., Nahirniak, M., Thommes, E.W. and Cojocaru, M.G. (2021). Age-stratified transmission model of COVID-19 in Ontario with human mobility during pandemic’s first wave. Heliyon, 7, e07905.
- [8] Gabriele-Rivet, V., Spence, K.L., Ogden, N.H., Fazil, A., Turgeon, P., Otten, A., Waddell, L.A. and Ng, V. (2021). Modelling the impact of age-stratified public health measures on SARS-CoV-2 transmission in Canada. Royal Society open science, 8, 210834.
- [9] Haario, H., Laine, M., Mira, A. and Saksman, E. (2006). DRAM: Efficient adaptive MCMC. Statistics and Computing, 16, 339–354.
- [10] Hamadeh, A., Feng, Z., Niergarth, J. and Wong, W.W. (2021). Estimation of COVID-19 period prevalence and the undiagnosed population in Canadian provinces: model-based analysis. JMIR Public Health and Surveillance, 7, e26409.
- [11] Hamby, D.M. (1994). A review of techniques for parameter sensitivity analysis of environmental models. Environmental Monitoring and Assessment, 32, 135–154.
- [12] Helton, J.C., Johnson, J.D., Sallaberry, C.J. and Storlie, C.B. (2006). Survey of sampling-based methods for uncertainty and sensitivity analysis. Reliability Engineering & System Safety, 91, 1175–1209.
- [13] He, S., Tang, S. and Rong, L. (2020). A discrete stochastic model of the COVID-19 outbreak: Forecast and control. Mathematical Biosciences and Engineering, 17, 2792-2804.
- [14] He, X., Lau, E.H.Y., Wu, P. et al. (2020). Temporal dynamics in viral shedding and transmissibility of COVID-19. Nature Medicine, 1–4.
- [15] Iwata, K. and Miyakoshi, C. (2020). A simulation on potential secondary spread of novel coronavirus in an exported country using a stochastic epidemic SEIR model. Journal of Clinical Medicine, 9, 944.
- [16] Lawless, J.F. and Yan, P. (2021). On testing for infections during epidemics, with application to Covid-19 in Ontario, Canada. Infectious Disease Modelling, 6, 930–941.
- [17] Li, Q., Guan, X., Wu, P., Wang, X., Zhou, L., Tong, Y. et al. (2020). Early transmission dynamics in Wuhan, China, of novel coronavirus-infected pneumonia, New England Journal of Medicine, 382, 1199–1207.
- [18] Liu, Z., Magal, P., Seydi, O. and Webb, G. (2020). Understanding unreported cases in the COVID-19 epidemic outbreak in Wuhan, China, and the importance of major public health interventions. Biology, 9, 50.
- [19] Liu, Z., Magal, P., Seydi, O. and Webb, G. (2020). A COVID-19 epidemic model with latency period. Infectious Disease Modelling, 5, 323–337.
- [20] McCarthy, Z., Xiao, Y., Scarabel, F., Tang, B., Bragazzi, N.L., Nah, K., Heffernan, J.M., Asgary, A., Murty, V.K., Ogden, N.H. and Wu, J. (2020). Quantifying the shift in social contact patterns in response to non-pharmaceutical interventions. Journal of Mathematics in Industry, 10, 1–25.
- [21] Moyles, I.R., Heffernan, J.M. and Kong, J.D. (2021). Cost and social distancing dynamics in a mathematical model of COVID-19 with application to Ontario, Canada. Royal Society Open Science, 8, 201770.
- [22] Nishiura, H., Kobayashi, T., Miyama, T. et al. (2020). Estimation of the asymptomatic ratio of novel coronavirus infections (COVID-19). International Journal of Infectious Diseases, 94, 154–155.
- [23] Nishiura, H. and Chowell, G. (2009). The effective reproduction number as a prelude to statistical estimation of time-dependent epidemic trends, in Mathematical and Statistical Estimation Approaches in Epidemiology, Springer.
- [24] Paul, L.A., Daneman, N., Schwartz, K.L., Brown, K.A., Whelan, M., Chan, E. and Buchan, S.A. (2021). Association of age and pediatric household transmission of SARS-CoV-2 infection. JAMA Pediatrics, 175, 1151–1158.
- [25] Ruan, S. (2020). Likelihood of survival of coronavirus disease 2019. The Lancet Infectious Diseases, 20, 630–631.
-
[26]
Status of COVID-19 cases in Ontario (2021).
Available from: https://www.ontario.ca/page/2019-novel-coronavirus. - [27] Tang, B., Wang, X., Li, Q., Bragazzi, N.L., Tang, S., Xiao, Y. and Wu, J. (2020). Estimation of the transmission risk of the 2019-nCoV and its implication for public health interventions. Journal of Clinical Medicine, 9, 462.
- [28] Van den Driessche, P. and Watmough, J. (2002). Reproduction numbers and sub-threshold endemic equilibria for compartmental models of disease transmission, Mathematical Biosciences, 180 , 29–48.
- [29] Wang, X. (2020). Studying social awareness of physical distancing in mitigating COVID-19 transmission, Mathematical Biosciences and Engineering, 17, 7428–7441.
- [30] Wang, C.C., Prather, K.A., Sznitman, J., Jimenez, J.L., Lakdawala, S.S., Tufekci, Z. and Marr, L.C. (2021). Airborne transmission of respiratory viruses. Science, 373, eabd9149.
-
[31]
WHO Coronavirus (COVID-19) Dashboard (2022).
Available from: https://covid19.who.int/. - [32] Zhao, H. and Feng, Z. (2020). Staggered release policies for COVID-19 control: Costs and benefits of relaxing restrictions by age and risk. Mathematical Biosciences, 326, 108405.