Revisiting the Dark Matter Interpretation of Excess Rates in Semiconductors
Abstract
In light of recent results from low-threshold dark matter detectors, we revisit the possibility of a common dark matter origin for multiple excesses across numerous direct detection experiments, with a focus on the excess rates in semiconductor detectors. We explore the interpretation of the low-threshold calorimetric excess rates above 40 eV in the silicon SuperCDMS Cryogenic Phonon Detector and above 100 eV in the germanium EDELWEISS Surface detector as arising from a common but unknown origin, and demonstrate a compatible fit for the observed energy spectra in both experiments, which follow a power law of index . Despite the intriguing scaling of the normalization of these two excess rates with approximately the square of the mass number , we argue that the possibility of common origin by dark matter scattering via nuclear recoils is strongly disfavored, even allowing for exotic condensed matter effects in an as-yet unmeasured kinematic regime, due to the unphysically-large dark matter velocity required to give comparable rates in the different energy ranges of the silicon and germanium excesses. We also investigate the possibility of inelastic nuclear scattering by cosmic ray neutrons, solar neutrinos, and photons as the origin, and quantitatively disfavor all three based on known fluxes of particles.
I Introduction
Direct detection experiments searching for particle dark matter (DM) with masses below 1 GeV have made significant advancements in the last decade, driven by lower thresholds, improved resolution, and sophisticated analysis techniques Fuss et al. (2022). These experiments are on the forefront of new technological development, and have demonstrated sensitivity to individual electron-hole pair creation at the eV energy scale Crisler et al. (2018); Abramoff et al. (2019); Barak et al. (2020); Agnese et al. (2018); Castelló-Mor (2020); Arnaud et al. (2020) as well as eV-scale calorimetry enabling direct energy measurements independent of charge production Alkhatib et al. (2020); Armengaud et al. (2019); Abdelhameed et al. (2019). An important distinction between ionization and calorimetric detectors is that ionization detectors are all limited by uncalibrated, non-radiogenic backgrounds which are often referred to as dark rates. A dark rate can in principle arise from any source that produces anomalous ionization events in a detector, with an irreducible contribution from thermal processes at the detector temperature. Substantial effort is under way to better characterize these dark rates Barak et al. (2022); Du et al. (2022). On the other hand, calorimetric detectors currently have higher energy thresholds but do not suffer from the dark rates mentioned above. This complementarity offers an interesting window on new physics when the two detector types are taken together, as was previously done in Ref. Kurinsky et al. (2020).
In this paper, we continue in the spirit of Ref. Kurinsky et al. (2020) by performing a joint analysis of the two most recent results from calorimetric semiconductor detectors, the silicon SuperCDMS Cryogenic Phonon Detector (SuperCDMS CPD) Alkhatib et al. (2020) and the germanium EDELWEISS Surface detector (EDELWEISS-Surf) Armengaud et al. (2019). Both experiments observe a statistically significant excess event rate above known background sources near threshold. Our analysis here differs from Ref. Kurinsky et al. (2020) because recent work has sharply constrained our previously-proposed signal models: the plasmon production channel from nuclear scattering is only a small part of the total spectrum from the Migdal effect in solid-state systems and cannot account for the observed spectral shape Kozaczuk and Lin (2020a); Knapen et al. (2021), and a fast DM subcomponent is excluded by XENON1T except for a very narrow range of DM velocities Harnik et al. (2021). That said, our approach is similar in that we consider novel inelastic nuclear scattering channels where the relationship between the deposited energy and the momentum transfer from the DM differs from (where is the mass of the nucleus) expected from free-particle elastic scattering.111Inelasticity here refers exclusively to detector response and is not to be confused with inelastic DM, which is a mass splitting between different DM states Tucker-Smith and Weiner (2001). Indeed, given that the energy scales of the excess are close to the lattice displacement energy, many-body effects may be expected to be important Kahn et al. (2021), and collective effects do substantially extend the reach of semiconductor ionization detectors to sub-GeV DM through the Migdal effect Knapen et al. (2021), compared to calculations which assume isolated atom targets Ibe et al. (2018); Dolan et al. (2018); Bell et al. (2020); Essig et al. (2020); Liu et al. (2020).
This paper is organized as follows. In Sec. II, we review the recent progress in understanding the persistent excesses in low-threshold detectors, and perform a combined fit to the SuperCDMS CPD and Edelweiss-Surf excesses, demonstrating an intriguing consistency in spectral index and normalization which is suggestive of a possible DM interpretation. In Sec. III, we use a phenomenological model of the detector response, parametrized by the dynamic structure factor, to attempt to explain both excesses in the context of inelastic DM-nuclear scattering. We find that such an interpretation is inconsistent even allowing for exotic structure factors, largely due to the fact that the allowed region for the silicon excess rate requires dark matter masses small enough that they have insufficient kinetic energy to yield the measured germanium rate at higher energies. In Sec. IV, we argue that the excess is also inconsistent with nuclear scattering from known particle sources, namely cosmic-ray neutrons, photons, and neutrinos, as well as secondary interactions. We conclude in Sec. V with our summary of this puzzling situation: the calorimetric excesses remain robustly mysterious.
II Combined analysis of semiconductor excesses
We noted in Ref. Kurinsky et al. (2020) that there was significant discrepancy at the time among the excesses in the silicon ionization detectors SuperCDMS HVeV, DAMIC at SNOLAB, and SENSEI Aguilar-Arevalo et al. (2019); Abramoff et al. (2019); Agnese et al. (2018), each of which observed different single-electron dark rates. SENSEI has since released new results Barak et al. (2020) from a detector operated with shallow 225 m.w.e. overburden that reduced their measured single(multiple)-electron dark rate to 5(0.05) Hz/kg, consistent with the DAMIC single-electron dark rate of 7 Hz/kg Aguilar-Arevalo et al. (2019) despite the increased shielding and 6000 m.w.e. overburden at SNOLAB. This resolved the initial tension mentioned in Ref. Kurinsky et al. (2020) and indicated some unrelated origin for the single(multiple)-electron dark rate background in the SuperCDMS HVeV detector of 1700(13) Hz/kg Agnese et al. (2018); Amaral et al. (2020). Moreover, recent work Du et al. (2022) has demonstrated consistency between some of these dark rates and secondary background processes, such as from Cherenkov emission, indicating a potential radiogenic contribution to these backgrounds.
Thus, since there has been much progress toward understanding the excesses in ionization detectors, we now focus exclusively on a common interpretation of semiconductor calorimetric excesses, which remain mysterious. The SuperCDMS CPD Alkhatib et al. (2020) excess in silicon is analogous to the earlier EDELWEISS-Surf measurement in germanium Armengaud et al. (2019) in that it measures the total recoil energy deposited in the detector , regardless of the distribution of the primary event energy into heat or charge (less any persistent defect energies which are on the order of 4 eV per defect Jiang et al. (2018) and are neglected in this analysis). Both detectors are also notably operated on the surface with minimal shielding. Whereas in Ref. Kurinsky et al. (2020), we focused primarily on qualitative arguments to motivate further interest in these excesses, here we perform a more quantitative analysis of the SuperCDMS CPD Alkhatib et al. (2020) and EDELWEISS-Surf Armengaud et al. (2019) excess rates.
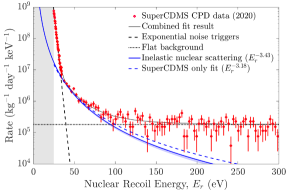
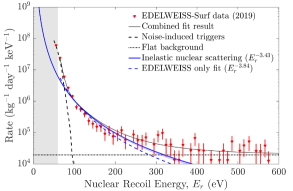
The SuperCDMS CPD result is of particular interest because its threshold (25 eV) is considerably lower than that of EDELWEISS-Surf (60 eV). Both detectors measure an approximately exponential background near threshold which is likely from noise triggers that are not removed by the analysis cuts. In the case of EDELWEISS-Surf, a model for these noise-induced triggers was published in Ref. Armengaud et al. (2019) and has been incorporated into this analysis directly, with no free parameters. For SuperCDMS CPD, these triggers are likely coming from environmental noise, and thus do strictly follow an exponential in energy. At higher energies, both detectors are limited by “flat” radiogenic backgrounds (e.g., Compton scattering Ramanathan et al. (2017)) on the order of cts kg-1 day-1 keV-1, as is to be expected for detectors operating on the surface. However, between these two distinct features, both detectors observe a statistically significant excess of events. EDELWEISS explored in great detail the possibility that these excess events in germanium come from elastic or Migdal222Ref. Armengaud et al. (2019) uses the isolated atom formalism Ibe et al. (2018) to calculate these rates in germanium, which neglects important collective effects Kozaczuk and Lin (2020b); that said, the isolated atom approach was the only calculation in the literature at the time of publication. scattering of DM particles and found that neither gives a good spectral match to the data Armengaud et al. (2019).
We simultaneously fit the digitized SuperCDMS CPD and EDELWEISS-Surf data to the following model: a flat background for each detector (1 parameter each), a model for noise triggers leaking above threshold (consisting of a 2-parameter exponential for SuperCDMS CPD and a 0-parameter model for EDELWEISS-Surf taken directly from Ref. Armengaud et al. (2019) and scaled by signal efficiency to compare with data), and a power law component in recoil energy for the excess (with independent normalization for each detector and a common power law index for both, 3 parameters total):
| (1) |
where . We write the normalization of the excess in the suggestive form because the DM model we present in Sec. III will contain an overall normalization of the DM-nucleon cross section proportional to and a detector-dependent factor which will be or for DM which couples to nucleons or protons, respectively (here is the mass number and is the atomic number of the target). Under the assumption of a common origin between the two detectors, the common normalization cancels yielding only a detector-dependent ratio . This joint fit provides a best fit power law index of and a Ge-to-Si normalization ratio of . The results of this fit are shown in Fig. 1 and presented in Table 1.333A similar analysis was recently performed on excess rates in sapphire Heikinheimo et al. (2021), which focused instead on the potential creation of defects through an exotic power-law nuclear scattering channel. We also perform individual fits to each detector spectrum, by allowing a power law index which differs for each dataset. Notably, the fits when including the EDELWEISS-Surf data are worse, which would be significantly improved by adding additional fit parameters to capture the systematic uncertainties present in the high-side tail of the noise-induced trigger model for that data.
| -value | ||||||
|---|---|---|---|---|---|---|
| Combined fit (Fig. 1) | 227.2/174 | |||||
| SuperCDMS CPD Alkhatib et al. (2020) only | n/a | n/a | 121.5/121 | |||
| EDELWEISS-Surf Armengaud et al. (2019) only | n/a | n/a | 101.3/52 |
The fact that these two independent datasets from different collaborations with different sensor technologies and different target materials (but comparable mK temperatures) measure an excess of events at low energies following compatible power laws is by itself interesting.444Curiously, the prediction of the Migdal effect from Ref. Knapen et al. (2021) is a power law with index at these energies, but the total rate is inconsistent with the interpretation of these events as coming from DM scattering through the Migdal effect, and furthermore the large energy deposit to the electronic system would likely result in excess ionization yields which are not seen in the ionization detectors at these energies Arnaud et al. (2020); Aguilar-Arevalo et al. (2020). Independent of their respective rates, this common power law is potentially indicative of a similar (or even identical) physical process as the origin of these events in each detector. Notably, the excess rates in each of these detectors can also be individually fit to an exponential, rather than a power law; however, the different energy ranges of the two excess rates exclude the possibility of a common exponential decay constant. In addition to the common power law index , the fact that the ratio of the is consistent with the ratio of the square of the mass numbers of the two targets, , is intriguing given that the standard benchmark model of spin-independent DM-nuclear scattering scales precisely in this fashion.
III Dark matter interpretation through exotic structure factors
To see whether the observed excess might be consistent with a DM interpretation yielding a power-law energy spectrum , here we consider a generic formalism for calculating the rates for DM-nuclear scattering on solid-state targets using an empirical parametrization of the dynamic structure factor that allows for physically-allowed, but nontrivial, collective effects without necessarily requiring a microscopic interpretation. In what follows, we will refer to the energy deposited by the DM as rather than , to emphasize the fact that collective effects may play a role and that we are not dealing with the elastic recoil energy of a single isolated nucleus.
Assuming nothing about the DM-detector system other than the validity of the Born approximation, the DM-nuclear scattering rate may be expressed in terms of the dynamic structure factor Trickle et al. (2020), which encapsulates the response of the target to a perturbation of the ion density,
| (2) |
Here, is the ground state of the system, runs over all final states, and is the density operator in Fourier space,
| (3) |
where are the positions of all the nuclei in the target and is the detector volume. When the dynamic structure factor is isotropic, , the differential DM scattering rate per unit target mass can be obtained from the structure factor as Trickle et al. (2020)
| (4) |
where is the local DM density; is the fiducial DM-proton or DM-nucleon cross section; or depending on whether the DM couples to protons or all nucleons, respectively; is the target mass density; is the DM mean inverse speed; and is the minimum DM speed required to deposit energy ,
| (5) |
We have assumed a heavy mediator such that the cross section is independent of (i.e. ), both for simplicity and to more easily make contact with experimental limits making the same assumption Lewin and Smith (1996). Similarly, in the DM mass range we will be interested in, there is insufficient momentum to probe nuclear substructure and so we also set the nuclear form factor to unity. It is clear from Eq. (4) that a choice of fully determines the spectral shape of the differential scattering rate, given a choice of DM velocity distribution. The integrated rate requires further input from the DM interaction strength, parametrized by .
A first-principles computation of the structure factor is possible in specific simplified models, including treating and as single-particle harmonic oscillator states or plane waves Kahn et al. (2021); Knapen et al. (2021). However, when considering the energy deposit to the scattered nucleus alone (in contrast to the electronic energy spectrum noted in Footnote 4), such a model either yields the ordinary flat spectrum of elastic scattering when , or a steeply-falling spectrum when , where is the optical phonon energy in Si or Ge and is the maximum momentum transfer. Both of these spectral shapes are clearly inconsistent with the data.
To attempt to reproduce the observed power-law spectrum, we first suppose that the structure factor is dominated by a single-quasiparticle excitation, representing a single scattered nucleus interacting with the surrounding electron density. In this case, the dynamic structure factor may be parametrized as
| (6) |
The function is known as the static structure factor and parametrizes departures from the free-particle dispersion relation: if , the dispersion relation is as expected for elastic nuclear recoil, but static structure factors which differ from unity permit different dispersions. Furthermore, for any choice of , in Eq. (6) automatically satisfies the “-sum rule”
| (7) |
which is a consistency condition on physically-realizable dynamical structure factors imposed by causality and conservation of mass.
We now make an ansatz for the form of designed specifically to yield the desired power-law spectrum. Suppose that the static structure factor is isotropic and itself follows a power law,
| (8) |
over a limited range of around a fiducial momentum value . The prefactor may of course be absorbed into , but is explicitly separated here to better illustrate typical kinematics: if , its typical momentum is , and in order for to have support at and , we must have for in silicon. Indeed, the fact that (so for near ) reflects the highly inelastic nature of the scattering interpretation of the excess: much more energy is deposited for a given momentum transfer than would be expected from elastic scattering. The free parameters in this model are thus the momentum scale and the power law index . We emphatically do not attempt any microscopic explanation of such a structure factor, but simply note that the (uncalibrated) energy regime we are concerned with here is just above the typical displacement energy in Si and Ge required to remove a nucleus from its lattice site, and thus we might expect qualitatively different behavior than in the single-phonon or high-energy ballistic recoil regimes, perhaps due to binding potential effects which distort the outgoing wave function, and/or interactions of the charged recoiling ion with the electron system.
Plugging in the power law ansatz for into Eq. (4), and rearranging to emphasize the similarities to Eq. (1), yields
| (9) |
where we have defined the dimension-1 quantity
| (10) |
such that the minimum velocity becomes
| (11) |
Note that for the elastic case with . If is independent of (which is approximately true for sufficiently large ), then Eq. (9) reduces to
| (12) |
and the spectrum is (by construction) exactly a power law with . Including the effects of will distort the spectrum for smaller , since less kinetic energy and less momentum are available for scattering, as well as for small which pushes the scattering to the high-velocity tail. Therefore, Eq. (12) is approximate and results from fitting the full spectrum to a power law. In particular, taking yields up to velocity-suppression effects (which would begin to increase the effective , rapidly in the case of Ge).
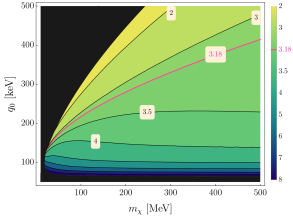
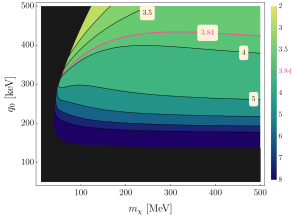
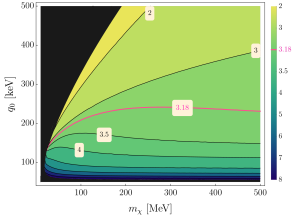
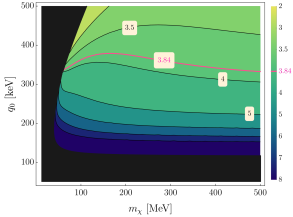
Figure 2 shows the results of fitting the Si and Ge spectra with a power law, as a function of and with for . We see that achieving the index of preferred by the data is allowed in Si for a wide range of values for both and . The higher energies of the excess in Ge make the same power law fit difficult because of the effects of velocity suppression, yielding a much narrower parameter space which does not overlap in with the Si best-fit contours except at the largest DM masses. At this stage, the difficulty of fitting both spectra simultaneously is clear, at least assuming that Si and Ge have comparable structure factors.
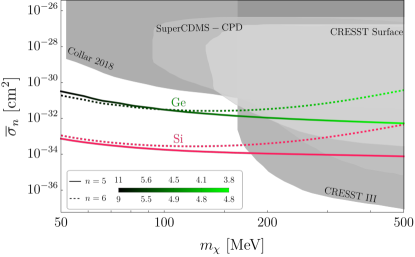
Once the power-law dependence of is fixed, the normalization of the spectrum is also fixed up to the overall scaling by . For the same dependence of and taking , the magenta solid (dashed) line in Fig. 3 shows the preferred region of and which yields an integrated rate of 0.6 Hz/kg in silicon for eV, and also yields a spectrum with the individual best-fit power law index for the CPD data in that energy range. Points on the magenta curves in Fig. 3 correspond to taking parameters along the corresponding magenta contours in Fig. 2. We see that heavier dark matter masses are robustly excluded by CRESST-III Abdelhameed et al. (2019), but intriguingly, the preferred region for lower DM masses is not excluded by any nuclear scattering experiment. Note that including an additional elastic term in the structure factor which has support at the same values of amounts to taking in a regime of distinct from the one where the inelastic structure factor has support. Since the sum rule in Eq. (7) fixes the normalization of the structure factor at all , such an elastic contribution would only serve to increase the rate, and therefore in principle this could push the preferred values of slightly lower. However, for , DM with velocity below the lab-frame galactic escape velocity cannot yield an elastic nuclear recoil in Si with energy above 40 eV, so all contributions to the observed excess above the exponential noise trigger must come from the inelastic structure factor.
Taking the same structure factor parameters along the Si best-fit contours in Fig. 2, the green line in Fig. 3 shows the region of and which yields a total rate of 1.3 Hz/kg in germanium for eV, with the gradient indicating the power law dependence of the spectrum. Not only is the cross section inconsistent with Si, but the Ge spectrum is everywhere too steep to match the best-fit value of , except near which is excluded by several other experiments. It is possible that the cross sections may be brought into agreement by widely differing values of (or equivalently ) between Si and Ge, but the fact that the allowed region for Si is restricted to means that only DM on the high-velocity tail of the DM distribution has enough kinetic energy to generate events in the 200 eV range, regardless of the structure factor. This will always serve to steepen the power law index beyond what is observed in the data and renders the simultaneous DM interpretation of the SuperCDMS CPD and EDELWEISS-Surf data highly implausible.
Even attempting to explain one or the other of the excesses, rather than both, requires an extremely peculiar inelastic dispersion which arises from . That said, systems with such a dispersion, where the energy of the excitation decreases with increasing momentum, are not unheard of; indeed, superfluid helium exhibits this phenomenology between the maxon and roton regions Donnelly et al. (1981), as do plasmons in some transition metal dichalcogenides van Wezel et al. (2011). Testing this explanation of the excess would require measuring the structure factor in semiconductors with neutron scattering, exactly as was done to determine the structure factor of helium, but with momentum transfers on the order of and energy deposits in the 40–100 eV energy range.
IV Ruling out known particle sources
Since even rather unusual condensed matter effects are unable to furnish a consistent DM interpretation, and given that both detectors were operated on the surface, we also examine the possibility that the excess is due to cosmic-ray (CR) neutron scattering. The CR neutron spectrum at ground level is very close to flat in , where is the CR neutron energy,
| (13) |
varying only by factors over 10 orders of magnitude between and Gordon et al. (2005); Sato and Niita (2006). Here is the approximate CR neutron flux at sea level. This spectrum translates to a CR neutron velocity distribution . In the case of elastic scattering parametrized by a neutron-nucleus cross section , this leads to an energy spectrum
| (14) |
which has the wrong power-law index to match the observed excess. Moreover, for Si, taking , where is the neutron scattering length in Si, the total rate between 40 and 100 eV is Hz/kg, a factor of 10 below the measured excess rate. In order to achieve a power-law spectrum and an integrated rate of 1 Hz/kg, one would have to postulate a neutron energy spectrum with a total neutron flux more than 5 orders of magnitude larger than since the different neutron spectrum implies a different normalization for neutrons of the appropriate energy. Even if we further speculate a peculiar inelastic dispersion from a nontrivial structure factor , which could reconcile the spectral index of the excess with the observed log-flat CR neutron spectrum, the large observed rate would still require a substantial additional flux of neutrons that is not observed.
Similar reasoning can rule out nuclear recoils induced from known fluxes of either incident neutrinos or photons. While exotic structure factors of the kind considered in Sec. III can change the spectral shape, the overall normalization is still driven by the total cross section for photons or neutrinos scattering off an individual nucleus,
| (15) | ||||
| (16) |
where is the weak charge of a nucleus with neutrons and protons, and we have given the numerical values for silicon . For the photon cross section, we have assumed coherent Thomson scattering from X-ray or gamma-ray photons with , which dominates over other photonuclear processes such as Delbrück scattering and resonant scattering Berghaus et al. (2021). For the neutrino cross section we have assumed coherent scattering with and sufficiently low momentum transfer that the nuclear form factor is approximately unity, a reasonable approximation even for elastic scattering in the energy range relevant for the excesses. The total rate per unit mass for incident particle is , where is the number density of nuclei in Si, is the flux of particles in question, and its cross section with nuclei.
For neutrinos, the total flux at the surface is dominated by keV solar neutrinos, Hz/cm2 Baxter et al. (2021). The largest the rate can possibly be is if all of these neutrinos contributed to scattering (of course, this would also require a highly inelastic structure factor), in which case the total rate would be at most
| (17) |
clearly ruling out solar neutrinos.
We can estimate the total photon flux from the measured Compton rate in the SuperCDMS CPD detector, which is approximately events kg-1 day-1 keV-1 at low energies. If we conservatively assume this rate is flat out to 1 MeV and integrate over this full range, we get an integrated rate of . The Compton cross section per electron is approximately , so the ratio of nuclear Thomson to Compton cross sections (accounting for the electrons per nucleus) is in Si. An upper bound on the total nuclear scattering rate from these photons can be obtained by rescaling the measured Compton rate, yielding for silicon
| (18) |
which is close to the observed excess rate. However, the maximum elastic recoil energy for in Si is 77 eV, so to explain the excess with elastic scattering, all of the photons contributing to the Compton rate must have energies around or above 1 MeV, and the photon spectrum must be a power law with the correct index. Including inelastic structure factors will not improve the situation. In order to take advantage of the large number of photons at low energies, we would need , which would suppress the total rate well below that of the observed excess. Furthermore, the flat background rate of the EDELWEISS-Surf detector is actually lower than in the SuperCDMS CPD data, indicating that the excess rates scale inversely to the ratio of radiogenic ionization backgrounds; this fact additionally disfavors a traditional radiogenic origin of these rates.
An alternative possibility is that secondary interactions in material surrounding the detector may contribute to this low energy background, such as Cherenkov emission, decay of metastable states, or thermal events coupling into the detector via clamps. In the case of Cherenkov emission, this possibility was excluded in the analysis presented in Ref. Du et al. (2022). For the second case, we would expect a Poisson distribution of events in energy, which does not resemble the power law we have shown in this work; even a Poisson distribution with small mean would resemble an exponential with common decay constant between both detectors, which as argued in Sec. II is inconsistent with the distinct energy regimes of the two excesses. For both Cherenkov emission and metastable states, events would have to be modeled on a case-by-case basis as in Ref. Du et al. (2022), which involves enough free parameters that any analysis is fundamentally underdetermined, and thus while it is possible to create a power law in a limited regime, this explanation would be demonstrative but not fundamental proof of this mechanism. The thermal coupling scenario is largely ruled out for athermal detectors such as SuperCDMS CPD, as thermal events in surrounding materials can usually be rejected by pulse shape discrimination Kim et al. (2020).
In summary, all NR explanations for the measured excesses from fluxes of known particles seem rather implausible, and indeed all could easily be falsified with additional shielding in future runs of the experiments. However, this analysis also reveals the importance of developing new, lower energy neutron calibration methods which could be used to probe the low-energy, low- kinematic regimes considered in this analysis. The methods used in this paper are useful for excluding possible event origins based on allowable structure factors, but we stress the importance of measuring the features of this inelastic scattering regime.
V Conclusions
We have demonstrated that the SuperCDMS CPD and EDELWEISS-Surf excess rates can be modeled by a common power law of index . Using a novel approach to quantitatively parametrize a physically-allowable dynamic structure factor which could yield such a power-law spectrum in the uncalibrated kinematic regime where inelastic effects may be expected, we argue that these two excess rates cannot be explained by a common origin involving inelastic nuclear recoil. In particular, the SuperCDMS CPD silicon data excludes the DM explanation for the EDELWEISS-Surf germanium excess, but itself could still be consistent with DM of mass MeV scattering through a highly-inelastic, novel nuclear recoil channel. Moreover, the rates from both of these experiments are too high to be explained by nuclear scattering from any standard backgrounds, including neutrons, solar neutrinos, or photons. We thus conclude that these excesses are likely not due to a novel inelastic scattering process as originally proposed in Ref. Kurinsky et al. (2020), which bolsters the evidence for detector effects as a likely origin. That said, our analysis demonstrates the value of exploring compatibility between low-energy experimental excess rates in widely-varying detector environments, which can be a powerful tool for disentangling complicated new physics at these energies.
Acknowledgments. None of the observations in this paper would be possible without the experimental results we cite, but also without private conversations with the collaborations responsible. We thus want to acknowledge (in alphabetical order) Ray Bunker, Alvaro Chavarria, Enectali Figueroa-Feliciano, Lauren Hsu, Paolo Privitera, Florian Reindl, and Belina von Krosigk. We thank Gordon Baym, Dan Hooper, Rocky Kolb, and Ben Safdi for useful conversations related to the content of this paper. We are especially grateful to Julian Billiard, Juan Collar, Rouven Essig, Juan Estrada, Jules Gascon, Matt Pyle, Alan Robinson, and Felix Wagner for their feedback on early drafts of this analysis. We thank the Gordon and Betty Moore Foundation and the American Physical Society for the support of the “New Directions in Light Dark Matter” workshop where the key idea for this work was conceived. We thank the EXCESS workshop organizers and participants for continuing the discussion of these experimental excess rates. P.A. acknowledges support from the Gordon and Betty Moore Foundation through EPiQS grant GBMF-9452. The work of Y.K. is supported in part by US Department of Energy grant DE-SC0015655. L.K.W. assisted in the theoretical modeling and editing of the paper, and was supported by the U.S. Department of Energy, Office of Science, Office of Basic Energy Sciences, Computational Materials Sciences program under Award Number DE-SC0020177. Fermilab is operated by Fermi Research Alliance, LLC, under Contract No. DE-AC02-07CH11359 with the US Department of Energy. This material is based upon work supported by the U.S. Department of Energy, Office of Science, National Quantum Information Science Research Centers, Quantum Science Center. This work was supported in part by the Kavli Institute for Cosmological Physics at the University of Chicago through an endowment from the Kavli Foundation and its founder Fred Kavli.
References
- Fuss et al. (2022) A. Fuss, M. Kaznacheeva, F. Reindl, and F. Wagner, eds., EXCESS workshop: Descriptions of rising low-energy spectra (2022) arXiv:2202.05097 [astro-ph.IM] .
- Crisler et al. (2018) M. Crisler, R. Essig, J. Estrada, G. Fernandez, J. Tiffenberg, M. Sofo haro, T. Volansky, and T.-T. Yu (SENSEI), Phys. Rev. Lett. 121, 061803 (2018), arXiv:1804.00088 [hep-ex] .
- Abramoff et al. (2019) O. Abramoff, L. Barak, I. M. Bloch, L. Chaplinsky, M. Crisler, Dawa, A. Drlica-Wagner, R. Essig, J. Estrada, E. Etzion, and et al., Physical Review Letters 122 (2019), 10.1103/physrevlett.122.161801.
- Barak et al. (2020) L. Barak, I. M. Bloch, M. Cababie, G. Cancelo, L. Chaplinsky, F. Chierchie, M. Crisler, A. Drlica-Wagner, R. Essig, J. Estrada, E. Etzion, G. F. Moroni, D. Gift, S. Munagavalasa, A. Orly, D. Rodrigues, A. Singal, M. S. Haro, L. Stefanazzi, J. Tiffenberg, S. Uemura, T. Volansky, and T.-T. Yu, “Sensei: Direct-detection results on sub-gev dark matter from a new skipper-ccd,” (2020), arXiv:2004.11378 [astro-ph.CO] .
- Agnese et al. (2018) R. Agnese, T. Aralis, T. Aramaki, I. Arnquist, E. Azadbakht, W. Baker, S. Banik, D. Barker, D. Bauer, T. Binder, and et al., Physical Review Letters 121 (2018), 10.1103/physrevlett.121.051301.
- Castelló-Mor (2020) N. Castelló-Mor (DAMIC-M), Nucl. Instrum. Meth. A 958, 162933 (2020), arXiv:2001.01476 [physics.ins-det] .
- Arnaud et al. (2020) Q. Arnaud et al. (EDELWEISS Collaboration), Phys. Rev. Lett. 125, 141301 (2020).
- Alkhatib et al. (2020) I. Alkhatib et al., “Light dark matter search with a high-resolution athermal phonon detector operated above ground,” (2020), arXiv:2007.14289 [hep-ex] .
- Armengaud et al. (2019) E. Armengaud, C. Augier, A. Benoît, A. Benoit, L. Bergé, J. Billard, A. Broniatowski, P. Camus, A. Cazes, M. Chapellier, and et al., Physical Review D 99 (2019), 10.1103/physrevd.99.082003.
- Abdelhameed et al. (2019) A. Abdelhameed, G. Angloher, P. Bauer, A. Bento, E. Bertoldo, C. Bucci, L. Canonica, A. D’Addabbo, X. Defay, S. Di Lorenzo, and et al., Physical Review D 100 (2019), 10.1103/physrevd.100.102002.
- Barak et al. (2022) L. Barak et al. (SENSEI), Phys. Rev. Applied 17, 014022 (2022), arXiv:2106.08347 [physics.ins-det] .
- Du et al. (2022) P. Du, D. Egana-Ugrinovic, R. Essig, and M. Sholapurkar, Phys. Rev. X 12, 011009 (2022), arXiv:2011.13939 [hep-ph] .
- Kurinsky et al. (2020) N. Kurinsky, D. Baxter, Y. Kahn, and G. Krnjaic, Phys. Rev. D 102, 015017 (2020).
- Kozaczuk and Lin (2020a) J. Kozaczuk and T. Lin, Phys. Rev. D 101, 123012 (2020a), arXiv:2003.12077 [hep-ph] .
- Knapen et al. (2021) S. Knapen, J. Kozaczuk, and T. Lin, Phys. Rev. Lett. 127, 081805 (2021).
- Harnik et al. (2021) R. Harnik, R. Plestid, M. Pospelov, and H. Ramani, Phys. Rev. D 103, 075029 (2021), arXiv:2010.11190 [hep-ph] .
- Tucker-Smith and Weiner (2001) D. Tucker-Smith and N. Weiner, Phys. Rev. D 64, 043502 (2001), arXiv:hep-ph/0101138 .
- Kahn et al. (2021) Y. Kahn, G. Krnjaic, and B. Mandava, Phys. Rev. Lett. 127, 081804 (2021).
- Ibe et al. (2018) M. Ibe, W. Nakano, Y. Shoji, and K. Suzuki, JHEP 03, 194 (2018), arXiv:1707.07258 [hep-ph] .
- Dolan et al. (2018) M. J. Dolan, F. Kahlhoefer, and C. McCabe, Phys. Rev. Lett. 121, 101801 (2018), arXiv:1711.09906 [hep-ph] .
- Bell et al. (2020) N. F. Bell, J. B. Dent, J. L. Newstead, S. Sabharwal, and T. J. Weiler, Phys. Rev. D 101, 015012 (2020), arXiv:1905.00046 [hep-ph] .
- Essig et al. (2020) R. Essig, J. Pradler, M. Sholapurkar, and T.-T. Yu, Phys. Rev. Lett. 124, 021801 (2020).
- Liu et al. (2020) C. P. Liu, C.-P. Wu, H.-C. Chi, and J.-W. Chen, arXiv e-prints , arXiv:2007.10965 (2020), arXiv:2007.10965 [hep-ph] .
- Aguilar-Arevalo et al. (2019) A. Aguilar-Arevalo et al. (DAMIC Collaboration), Phys. Rev. Lett. 123, 181802 (2019).
- Amaral et al. (2020) D. W. Amaral et al. (SuperCDMS Collaboration), Phys. Rev. D 102, 091101 (2020).
- Jiang et al. (2018) M. Jiang, H. Xiao, S. Peng, G. Yang, Z. Liu, L. Qiao, and X. Zu, Nanoscale research letters 13, 133 (2018).
- Ramanathan et al. (2017) K. Ramanathan et al., Phys. Rev. D 96, 042002 (2017), arXiv:1706.06053 [physics.ins-det] .
- Kozaczuk and Lin (2020b) J. Kozaczuk and T. Lin, Phys. Rev. D 101, 123012 (2020b).
- Heikinheimo et al. (2021) M. Heikinheimo, S. Sassi, K. Nordlund, K. Tuominen, and N. Mirabolfathi, (2021), arXiv:2112.14495 [hep-ph] .
- Aguilar-Arevalo et al. (2020) A. Aguilar-Arevalo et al. (DAMIC Collaboration), Phys. Rev. Lett. 125, 241803 (2020).
- Trickle et al. (2020) T. Trickle, Z. Zhang, K. M. Zurek, K. Inzani, and S. Griffin, JHEP 03, 036 (2020), arXiv:1910.08092 [hep-ph] .
- Lewin and Smith (1996) J. D. Lewin and P. F. Smith, Astroparticle Physics 6, 87 (1996).
- Angloher et al. (2017) G. Angloher et al. (CRESST), Eur. Phys. J. C 77, 637 (2017), arXiv:1707.06749 [astro-ph.CO] .
- Collar (2018) J. I. Collar, Phys. Rev. D 98, 023005 (2018).
- Donnelly et al. (1981) R. Donnelly, J. Donnelly, and R. Hills, Journal of Low Temperature Physics 44, 471 (1981).
- van Wezel et al. (2011) J. van Wezel, R. Schuster, A. König, M. Knupfer, J. van den Brink, H. Berger, and B. Büchner, Physical Review Letters 107, 176404 (2011).
- Gordon et al. (2005) M. Gordon, P. Goldhagen, K. Rodbell, T. Zabel, H. Tang, J. Clem, and P. Bailey, Nuclear Science, IEEE Transactions on 51, 3427 (2005).
- Sato and Niita (2006) T. Sato and K. Niita, Radiation research 166, 544 (2006).
- Berghaus et al. (2021) K. V. Berghaus, R. Essig, Y. Hochberg, Y. Shoji, and M. Sholapurkar, (2021), arXiv:2112.09702 [hep-ph] .
- Baxter et al. (2021) D. Baxter et al., Eur. Phys. J. C 81, 907 (2021), arXiv:2105.00599 [hep-ex] .
- Kim et al. (2020) H. L. Kim, H. J. Kim, I. Kim, S. R. Kim, Y. D. Kim, Y. H. Kim, D. H. Kwon, J. A. Jeon, M. H. Lee, M. K. Lee, and J. H. So, Journal of Low Temperature Physics 199, 1082 (2020).