A Comprehensive Benchmark Analysis for Sand Dust Image Reconstruction
Abstract.
Numerous sand dust image enhancement algorithms have been proposed in recent years. To our best knowledge, however, most methods evaluated their performance with no-reference way using few selected real-world images from internet. It is unclear how to quantitatively analysis the performance of the algorithms in a supervised way and how we could gauge the progress in the field. Moreover, due to the absence of large-scale benchmark datasets, there is no well-known report of data-driven based method for single image sand dust removal up till now. To advance the development of deep learning-based algorithms for sand dust image reconstruction, while enabling supervised objective evaluation of algorithm performance. In this paper, we presented a comprehensive perceptual study and analysis of real-world sand dust images, then constructed a Sand-dust Image Reconstruction Benchmark (SIRB) for training Convolutional Neural Networks (CNNs) and evaluating algorithms performance. In addition, we adopted the existing image transformation neural network trained on SIRB as baseline to illustrate the generalization of SIRB for training CNNs. Finally, we conducted the qualitative and quantitative evaluation to demonstrate the performance and limitations of the current sand dust removal algorithms, which shed light on future research in the field of sand dust image reconstruction.
1. Introduction
In sandstorm weather, affected by Mai scattering, the blue-violet light is absorbed by sand dust particles much more quickly compared with red and orange light. (Zhi et al., 2016) The images captured in outdoor scenes often suffer from color cast, poor visibility, and fainted surfaces, which play an adverse role in various remote-based computer vision tasks and seriously interferes with the performance of intelligent information processing system. In contrast to haze imaging conditions, where the illumination is dominated by global atmospheric light with the same R, G, B values, degraded images in sand dust weather have obvious prior characteristics for shifting, concentration and sequential due to varying degrees of attenuation of R, G, B values. Eliminating color cast and hazy is essential for enhancing the visibility of sand dust images, which, however, due to its heavily ill-posed nature is very challenging.
To address the issues, many studies have been proposed (Dhara et al., 2020; Peng et al., 2018; Shi et al., 2019a; Gao et al., 2020; Yu et al., 2016; Cheng et al., 2020; Wang et al., 2016, 2021; Shi et al., 2019b; Park and Eom, 2021; Gao et al., 2021; Xu et al., 2020; Fu et al., 2014), which can be roughly divided into two strategies including image restoration (Dhara et al., 2020; Peng et al., 2018; Shi et al., 2019a; Gao et al., 2020; Yu et al., 2016) and image enhancement (Cheng et al., 2020; Wang et al., 2016, 2021; Shi et al., 2019b; Park and Eom, 2021; Gao et al., 2021; Xu et al., 2020; Fu et al., 2014). The sand dust image restoration algorithms are designed based on the atmospheric scattering model. Commonly, they estimate the transmission and global atmosphere light value via prior knowledge (He et al., 2010), and then put the intermediate variables into the physics model to restore the clear images. The enhancement-based strategies improve the clarity of sand dust images by compensating the color channel, balancing the brightness, and stretching the contrast. These algorithms all can improve the image quality to a certain extent, however, there are still exist some issues cannot be ignored. In general, the atmospheric scattering model is adopted to describe the generation process of haze image, which is slightly far-fetched used in sand dust removal task. For image enhancement algorithms, the processed images often suffer color distortion due to the scholars are excessive focus on sandstorm removal without considering the overall visual perception. Image sand dust removal, as an ill-posed issue, has not been effectively solved.
Recent years have witnessed significant advances in deep learning, which has attracted extensive attention in the field of image processing (He et al., 2016; Simonyan and Zisserman, 2014; Goodfellow et al., 2014; Isola et al., 2017; Zhu et al., 2017) because of its strong ability to fit data. Many scholars adopted deep learning to process degraded images in complex environments, such as image dehazing (Qin et al., 2020; Li et al., 2017; Ren et al., 2016; Dong et al., 2020; Anvari and Athitsos, 2020), image deraining (Chen and Li, 2021; Wang et al., 2020a, b; Yasarla et al., 2020; Deng et al., 2020) and underwater image enhancement (Anwar et al., 2018; Guo et al., 2019; Uplavikar et al., 2019; Fu and Cao, 2020; Wang et al., 2019), etc. The image reconstruction algorithms based on deep learning in complex environment have achieved remarkable performance, which mainly benefit from the proposal of some outstanding benchmarks (Li et al., 2018; Ancuti et al., 2018; Zhang et al., 2020; Zhang and Patel, 2018; Li et al., 2019a; Fu et al., 2017; Liu et al., 2020; Li et al., 2019b; Berman et al., 2020). Unfortunately, the development of learning based sand dust image reconstruction algorithms is lagging due to the absence of large-scale benchmark datasets. Additionally, the lack of publicly available dataset makes it is hard to evaluate the performance of sand dust removal algorithms using full-reference metrics.
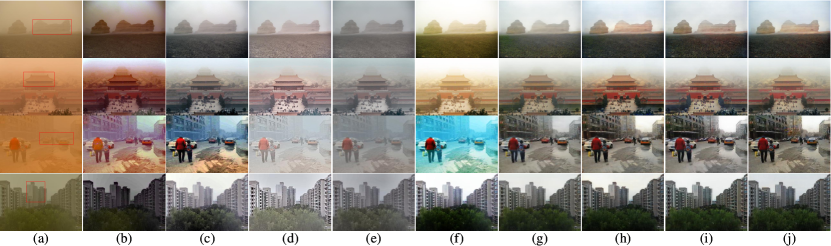
To bridge the gaps, in this paper, we simulated the distribution of sand dust images, and proposed a large-scale sand dust image reconstruction benchmark for evaluating algorithms performance and training CNNs. As shown in Figure 1, we trained the CNNs on the constructed dataset, and compared the results with the prior algorithms. One can see that CNNs have obvious advantages in terms of color correction and dust removal.
The main contributions of this work are summarized as follows:
-
•
We proposed a single image sand dust removal benchmark named Sand-dust Image Reconstruction Benchmark (SIRB) which contains 16000 synthetic images and 230 real-world sand dust images, covering a wide range of sandstorm degraded scenes;
-
•
We introduced a set of full-reference and non-reference strategies to evaluate the performance of the algorithms both qualitatively and quantitatively, which provide comprehensive insights into the strengths and limitations of current sand dust image enhancement methods;
-
•
With the constructed SIRB, we trained a classical image transformation CNNs model as baseline and compared the CNNs with the existing sand dust removal methods. The evaluation and analysis will provide some constructive inspiration for future research of data-driven based sand dust removal algorithms.
2. Existing Methodology and Evaluation Metric
2.1. Single image sand dust removal algorithms
Recently, numerous sand dust image methods have been proposed (Dhara et al., 2020; Peng et al., 2018; Shi et al., 2019a; Gao et al., 2020; Yu et al., 2016; Cheng et al., 2020; Wang et al., 2016, 2021; Shi et al., 2019b; Park and Eom, 2021; Gao et al., 2021; Xu et al., 2020; Fu et al., 2014) which can be roughly divided into two classes. One line of research is the restoration algorithms, and another line is tries to modify the pixel values using the prior knowledge to enhance visual quality of the image.
2.1.1. Physical model based algorithms
Image restoration algorithms are designed based on atmospheric scattering model, the physical model was proposed by McCartney (McCartney, 1976) is widely used in haze removal task and can be written as:
| (1) |
To obtain the haze-free image, the atmospheric scattering model can be rewritten as the following:
| (2) |
where is haze image; is the corresponding haze-free image of ; is the transmission; is the global atmosphere light of the haze image, it is a scalar and can be expressed as:
| (3) |
when ==, we can get the color balanced haze images. But in sand dust weather, the principle of >> always be followed. The main task of sand dust image restoration using atmospheric scattering model is how to estimate t(x) and A accurately.
At present, the Dark Channel Prior (DCP) algorithm (He et al., 2010) is commonly used to estimate the necessary parameters in the physical model. Based on halo-reduced dark channel prior, Shi et al. (Shi et al., 2019a) proposed a method for sand dust image enhancement, which including color correction in the LAB color space via gray world theory and dust removal using a halo-reduced DCP dehazing algorithm. Gao et al. (Gao et al., 2020) presented a sand dust image restoration algorithm based on reversing the blue channel prior which improves the visibility of sand dust degraded images via DCP theory. Yu et al. (Yu et al., 2016) proposed a method based on atmospheric scattering model and information loss constraint to eliminate the sand dust. Specifically, they optimized the initial atmospheric light value using the constraint of information loss and estimated the coarse transmission with DCP theory simultaneously, and then refined the coarse transmission by the fast guide filter.
However, there are some issues should be of concern. Although researchers have balanced the color of sand dust images before using the atmospheric scattering model, it is still a little far-fetched in logic to apply the dehazing model on sand dust removal task. Meanwhile, the existing prior knowledge cannot effectively estimate the transmission of the sky area, it is easily causing the color distortion of the output images in sky or highlight regions.
2.1.2. Non-model based algorithms
Non-model based algorithms aim to adjust the pixel values using the prior knowledge to enhance visual quality of sandstorm degraded images. Cheng et al. (Cheng et al., 2020) proposed a fast sand dust image enhancement algorithm based on channel compensation and guided image filtering, which can recover the fading characteristics of sand dust degraded images in a short time and improve the clarity of the images. Park et al. (Park and Eom, 2021) presented a method using successive color balance with coincident chromatic histogram for sand dust image enhancement. To enhance the degraded images, Xu et al. (Xu et al., 2020) designed an alternative edge-preserving color image decomposition model based on the tensor least squares (TLS) framework and the statistical feature of natural color images. Built upon fusion principles, Fu et al. (Fu et al., 2014) proposed an approach by fusing the inputs with the weight maps which contain important features to increase the visual quality of the sand dust degraded image.
In contrast to image dehazing tasks (He et al., 2010; Berman et al., 2016; Ancuti and Ancuti, 2013), sand dust enhancement algorithms require to consider more external factors. Despite the prolific work, both the comprehensive study and insightful analysis of sand dust image enhancement algorithms remain largely unsatisfactory due to the complex distribution of sand dust degraded images. The currently algorithms of sand dust enhancement can mitigate the visual impact of sand to a certain extent, however, there still existing some issues in the algorithms for incomplete dust removal, loss of detail information and color distortion.
2.2. Sand dust image quality evaluation
2.2.1. Non-reference metrics
Non-reference metrics refers to directly calculate the visual quality of the results when the reference images does not exist. Due to the lack of sandstorm benchmark dataset, most researchers using only non-reference metrics to evaluate the performance of sand dust removal algorithms. In addition to the basic evaluation metrics such as Average Gradient (AG), Edge Intensity (EI) and Information Entropy (IE), the non-reference evaluation strategies for Natural Image Quality Evaluator (NIQE) (Mittal et al., 2012), Spatial–Spectral Entropy-based Quality (SSEQ) (Liu et al., 2014), and Blind Image Quality Indices (BIQI) (Moorthy and Bovik, 2009) are also effective to measure the algorithms performance.
2.2.2. Full-reference metrics
Full-reference evaluation metrics often be employed to measure the performance of the image processing algorithms. Mean Square Error (MSE) and Peak-Signal to Noise Ratio (PSNR) are used to calculate the errors in pixel level; Structural Similarity (SSIM) (Wang et al., 2004) and Feature Similarity-color (FSIMc) (Zhang et al., 2011) can measure the similarity structural between the output and reference images; And CIE94 (McDonald and Smith, 1995) and CIEDE2000 (Sharma et al., 2005) often be chosen to calculate the chromatic aberration. In fact, it is practically impossible to simultaneously capture a real degraded scene and the corresponding ground truth image for complex environment. That increases the difficulty for researchers to compute the full-reference metrics. For this reason, many datasets (Li et al., 2018; Ancuti et al., 2018; Zhang et al., 2020; Zhang and Patel, 2018; Li et al., 2019a; Fu et al., 2017; Liu et al., 2020; Li et al., 2019b; Berman et al., 2020) were presented to bridge the gap, which greatly promote the development of the algorithms in related fields.
Actually, the performance of an algorithm cannot be fully evaluated only using the non-reference metrics. It is still necessary to calculate the full-reference metrics with paired samples. To our best knowledge, however, there is no publicly available dataset suitable for evaluating full-reference metrics of the sand dust removal algorithms up till now. Furthermore, the absence of the large-scale sandstorm dataset seriously hinders the development of data-driven based sand dust image reconstruction algorithms.
| Training Set | ||||
| Subsets | Number | Dust intensity | Category | Attenuation coefficient |
| SIRB-T(L) | 3900 | Light | Synthetic | [0.3,0.4] |
| SIRB-T(M) | 3900 | Medium | Synthetic | [0.4,0.5] |
| SIRB-T(D) | 3900 | Dense | Synthetic | [0.5,0.6] |
| SIRB-T(H) | 3900 | Hybrid | Synthetic | [0.3,0.6] |
| Evaluating Set | ||||
| Subsets | Number | Dust intensity | Category | Attenuation coefficient |
| SIRB-E(L) | 100 | Light | Synthetic | [0.3,0.4] |
| SIRB-E(M) | 100 | Medium | Synthetic | [0.4,0.5] |
| SIRB-E(D) | 100 | Dense | Synthetic | [0.5,0.6] |
| SIRB-E(H) | 100 | Hybrid | Synthetic | [0.3,0.6] |
| RSTS | 230 | Hybrid | Real | [0,1] |
3. Sand dust Image Reconstruction Benchmark
3.1. The characteristics of sand dust images
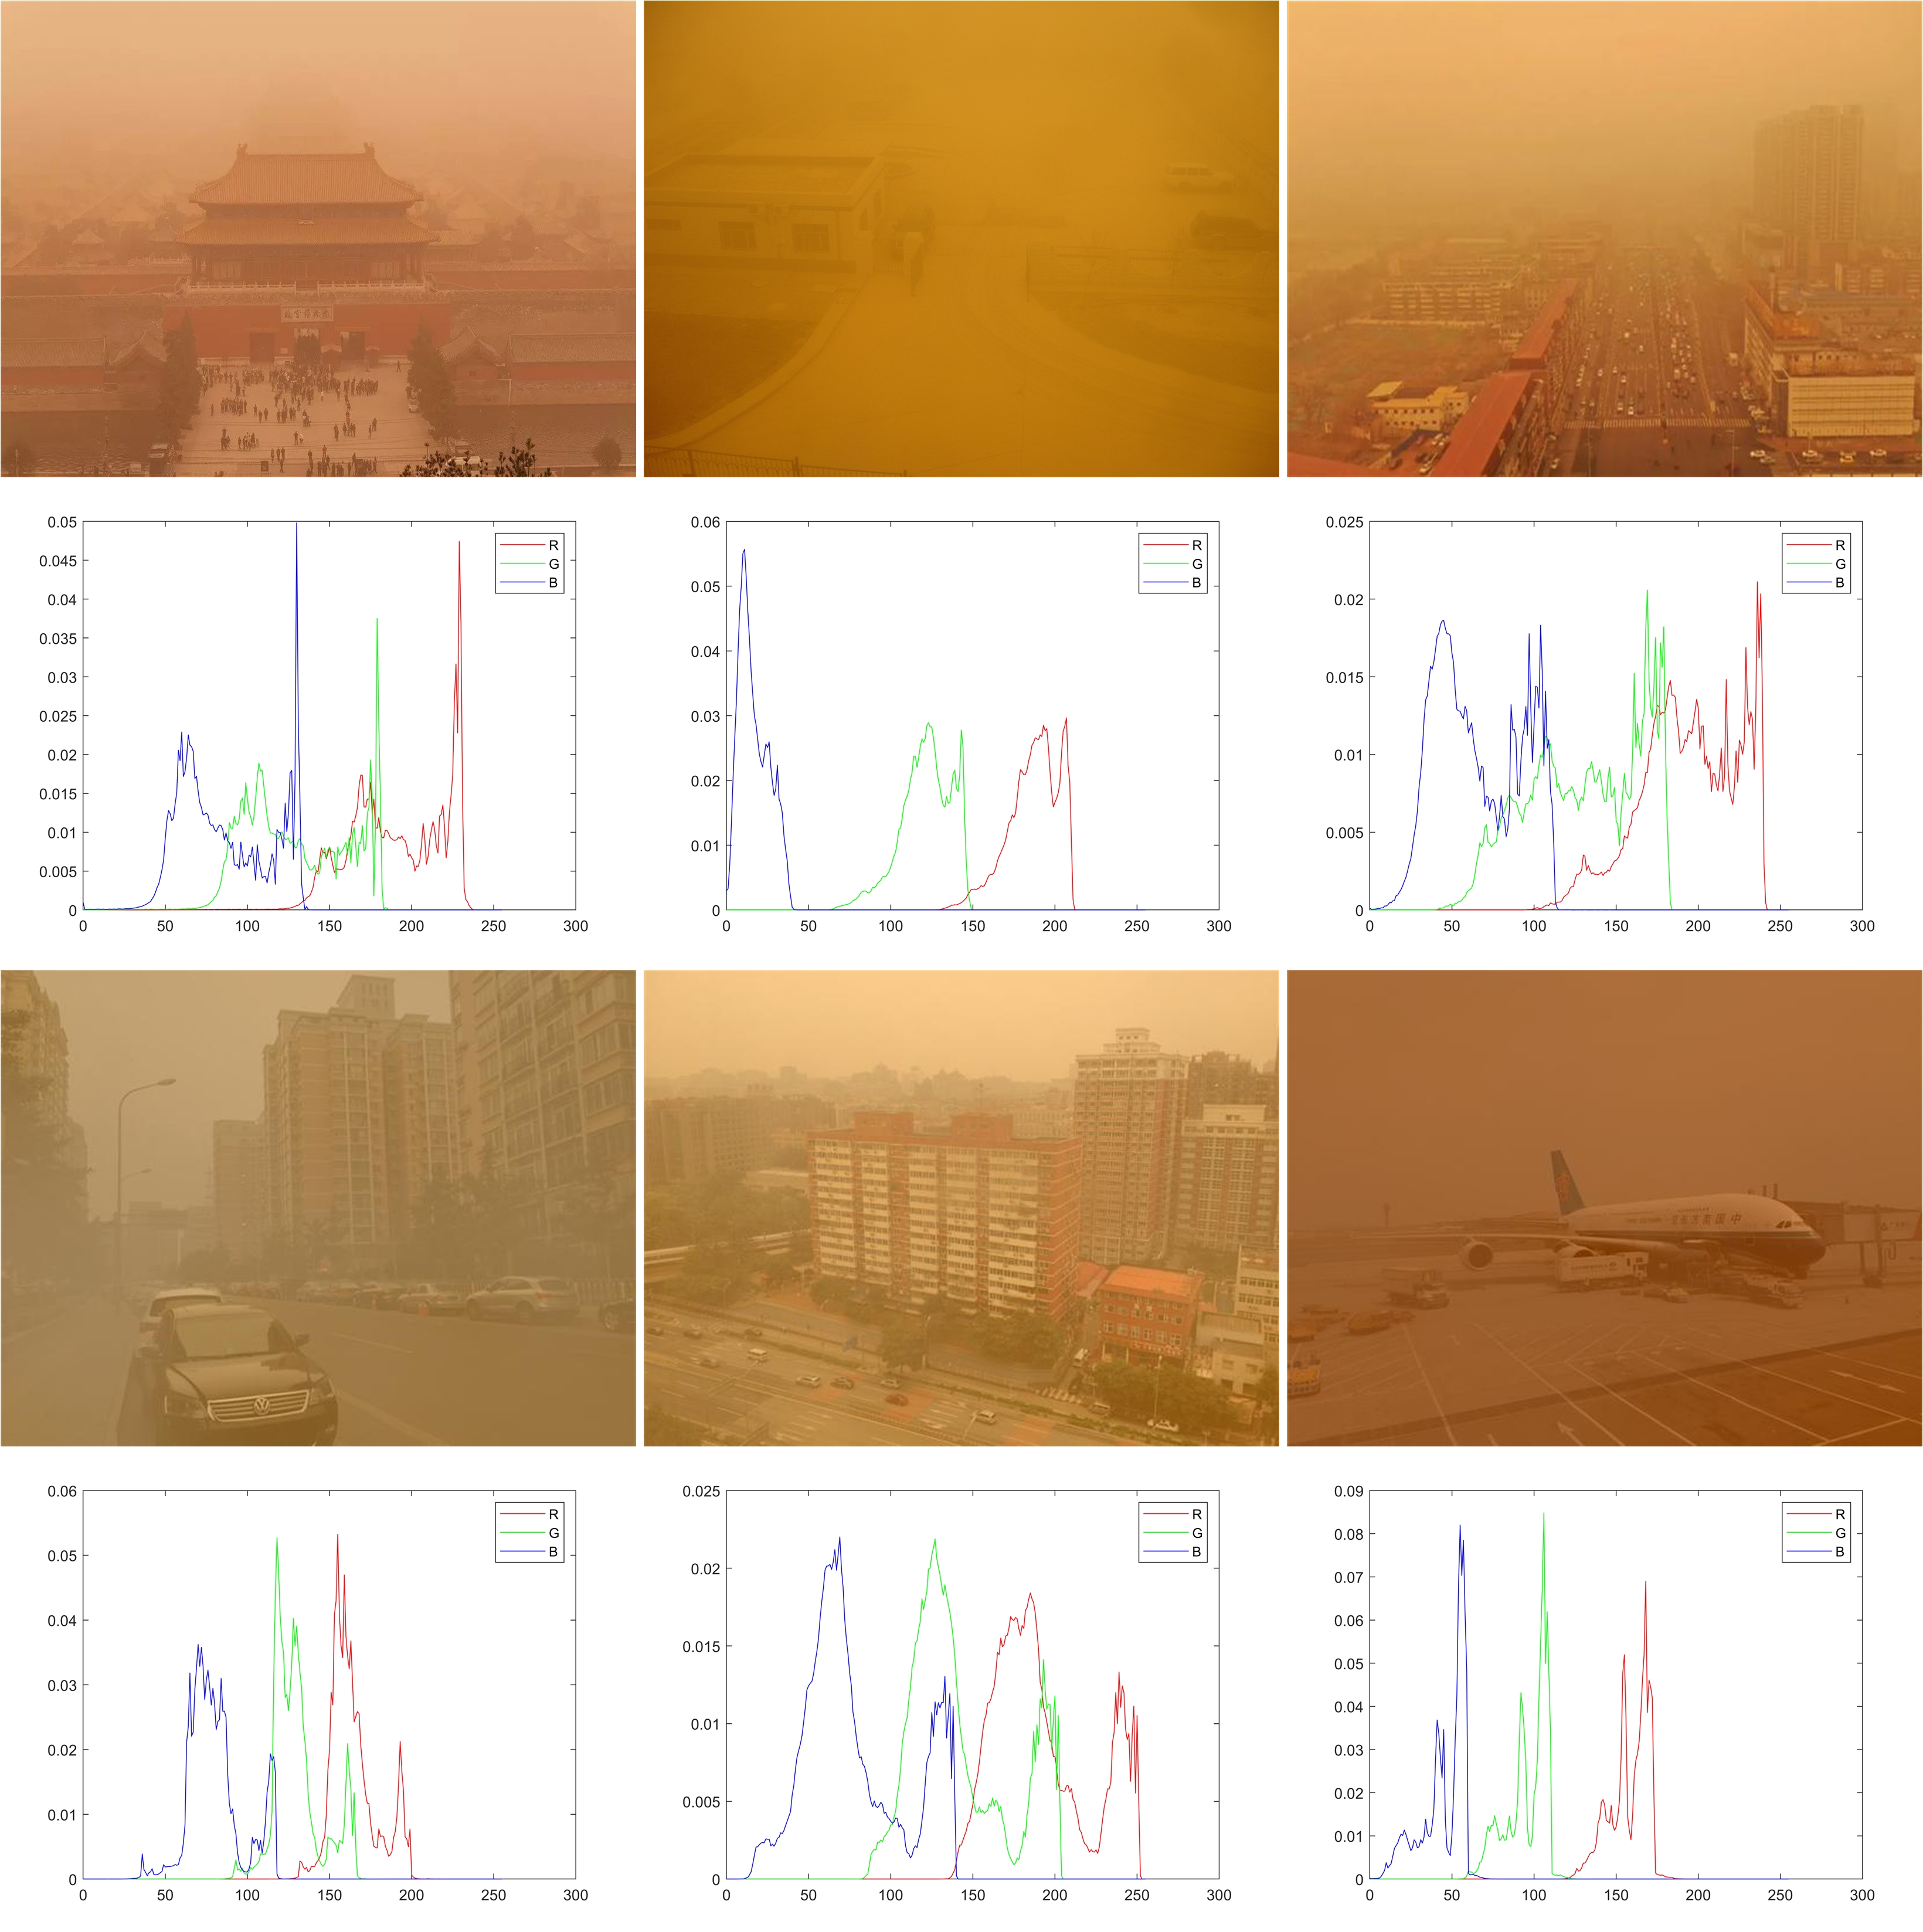
The distribution of sand dust images has obvious prior characteristics for shifting, concentration, and sequential. Where shifting refers to that affected by Mai scattering, the R, G, B channels of sand dust images are dispersed; Concentration demonstrates that the pixel values in R, G, B channels are concentrated in a certain interval; Sequential refers to that the shifting distribution of R, G, B channels are in order according to G, B, R. We provide some histogram comparison examples of real-world sandstorm images and synthetic images, as shown in Figure 2, the distribution of synthetic images meets all properties of real-world sandstorm images.
3.2. The proposed synthesis strategies
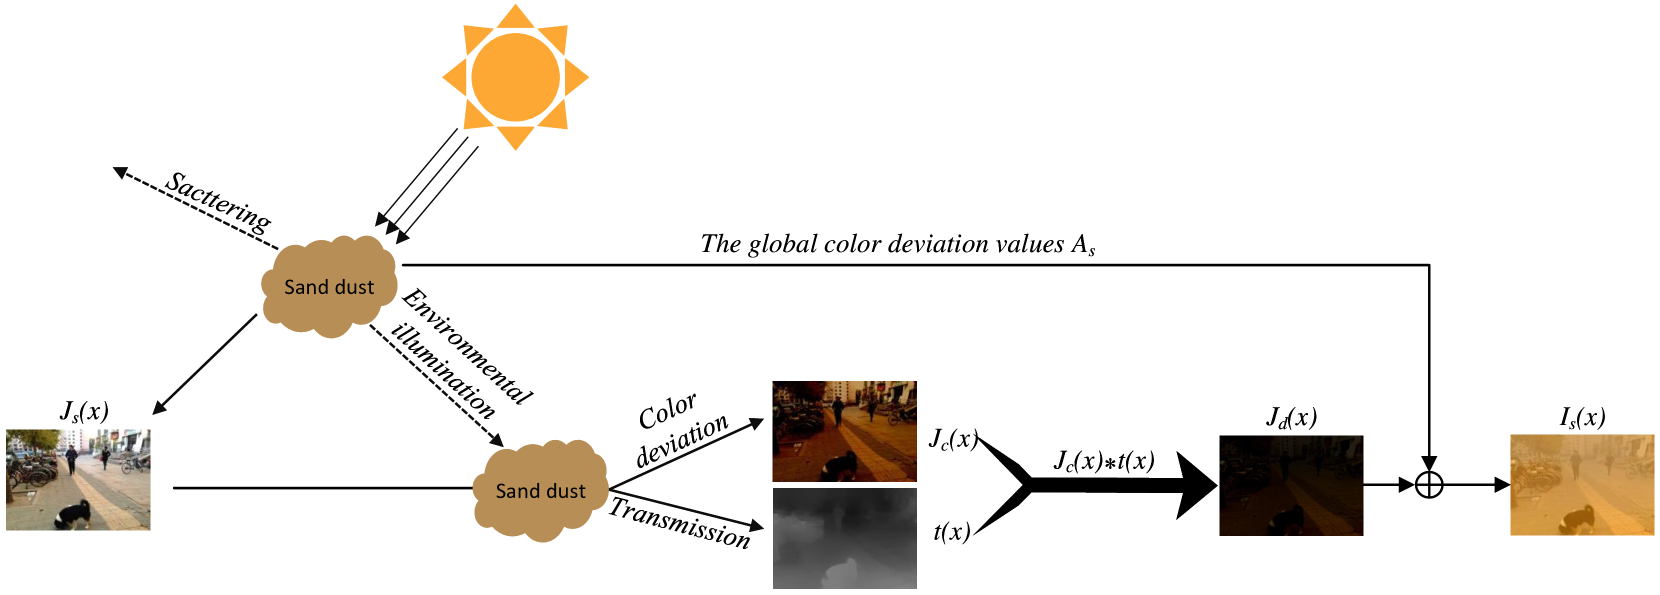
It is worth noting that under the sandstorm weather, the atmospheric scattering model does not hold any longer due to the radius of particles in sand dust is nearly 25m (Ryde, 1941), which is much larger than haze (0.01m1m) and fog (1m10m) (Narasimhan and Nayar, 2002). Considering the attenuation effect of sand dust floating in the atmosphere on RGB channels, we proposed a novel sand dust scattering model. The mathematical expression of the model is written as the following:
| (4) |
| (5) |
where is the synthetic image; is the corresponding reference image of ; is the global color deviation value of the sand dust image; is the complementary color of ; is the transmission of ; is the attenuation coefficient of the dust, it represents the density of dust in the image; is the scene depth.
The flowchart of the proposed scattering model as shown in Figure 3. We adopted to describe the influence of the reflected light scattered by sand dust particles to the pixels at the coordinate position on the image. represents the distribution characteristics of dust on the basis of . The mathematical expression of them are written as:
| (6) |
| (7) |
The value of changes quite little in the same sand dust scene, so we assume it as a certain value. By applying at , we can obtain the pixel’s imaging in sandstorm weather.
The clear images in SIRB all selected from RESIDE (Li et al., 2018). We carefully excluded those scenes with haze to ensure the original images are suitable enough for synthesizing sand dust images. In addition, due to the yellow sunlight may confuse the neural network, the scenes containing sunrise and sunset were also eliminated. Under the condition of ensuring the diversity of the scenes as much as possible, we totally screened 4000 clear images including traffic, buildings, streets, woods, etc. as original samples for the benchmark.
We adopted (Liu et al., 2015) to estimate the scene depth and altered the dust intensity by randomly selecting from the uniform distribution interval [0.3, 0.6]. Finally, we synthesized the training set SIRB-T and evaluating set SIRB-E, resulting in a total of 16000 paired synthetic sand dust images. To further evaluate the application value of the sand dust algorithms, we used the key words ”sandstorm”, ”sand dust weather” and ”sand dust” to retrieve images from the Internet (). And constructed a Real-world Sandstorm Testing Set (RSTS), which is composed of 230 real-world sand dust images. The structure of SIRB is shown in Table 1, SIRB-T including four training subsets, which are named as SIRB-T(L), SIRB-T(M), SIRB-T(D), and SIRB-T(H), respectively; SIRB-E consists of four evaluation subsets and named as SIRB-E(L), SIRB-E(M), SIRB-E(D), and SIRB-E(H), respectively. Where “T” short for training and “E” denotes evaluation; “L”, “M”, “D”, and “H” represent the images with light, medium, dense and hybrid sand dust density, respectively.
| Metrics | CIDC (Dhara et al., 2020) | FBE (Fu et al., 2014) | HRDCP (Shi et al., 2019a) | NGT (Shi et al., 2019b) | TTFIO (Al-Ameen, 2016) | Pix2pix (Isola et al., 2017) | Reference images | Real-world sand dust images |
|---|---|---|---|---|---|---|---|---|
| SIRB-E(L) | ||||||||
| NIQE↓ | 4.3632 | 4.3282 | 4.7565 | 4.243 | 4.8254 | 4.9222 | 4.9142 | \ |
| SSEQ↓ | 13.897 | 12.66 | 10.8126 | 14.6643 | 14.706 | 8.6928 | 14.2559 | |
| BIQI↓ | 28.8989 | 27.1753 | 29.1914 | 30.4207 | 26.2888 | 20.0077 | 22.7995 | |
| SIRB-E(M) | ||||||||
| NIQE↓ | 4.5131 | 4.4494 | 4.7682 | 4.4573 | 4.879 | 4.8446 | 4.9142 | \ |
| SSEQ↓ | 15.0067 | 13.7058 | 12.2437 | 16.1395 | 15.4367 | 8.7683 | 14.2559 | |
| BIQI↓ | 30.8213 | 28.756 | 25.7518 | 31.9037 | 28.1029 | 20.8456 | 22.7995 | |
| SIRB-E(D) | ||||||||
| NIQE↓ | 4.8926 | 4.9114 | 4.9507 | 4.923 | 5.3241 | 4.8101 | 4.9142 | \ |
| SSEQ↓ | 15.8064 | 14.7349 | 14.6102 | 17.7692 | 16.4857 | 8.8167 | 14.2559 | |
| BIQI↓ | 32.4881 | 30.6915 | 24.6167 | 32.8375 | 30.278 | 21.6453 | 22.7995 | |
| SIRB-E(H) | ||||||||
| NIQE↓ | 4.6019 | 4.5309 | 4.8667 | 4.5477 | 5.0053 | 4.8897 | 4.9142 | \ |
| SSEQ↓ | 15.0674 | 13.7526 | 12.8604 | 16.3487 | 15.6197 | 8.6616 | 14.2559 | |
| BIQI↓ | 30.716 | 28.8654 | 26.8795 | 31.4879 | 28.1405 | 20.8184 | 22.7995 | |
| RSTS | ||||||||
| NIQE↓ | 4.4634 | 4.3783 | 4.3576 | 4.5757 | 4.8264 | 4.2971 | \ | 8.5704 |
| SSEQ↓ | 23.0548 | 21.7397 | 21.3578 | 24.269 | 27.312 | 20.6379 | 27.4906 | |
| BIQI↓ | 33.8807 | 30.7382 | 26.834 | 32.9201 | 32.8246 | 25.6253 | 28.3195 | |
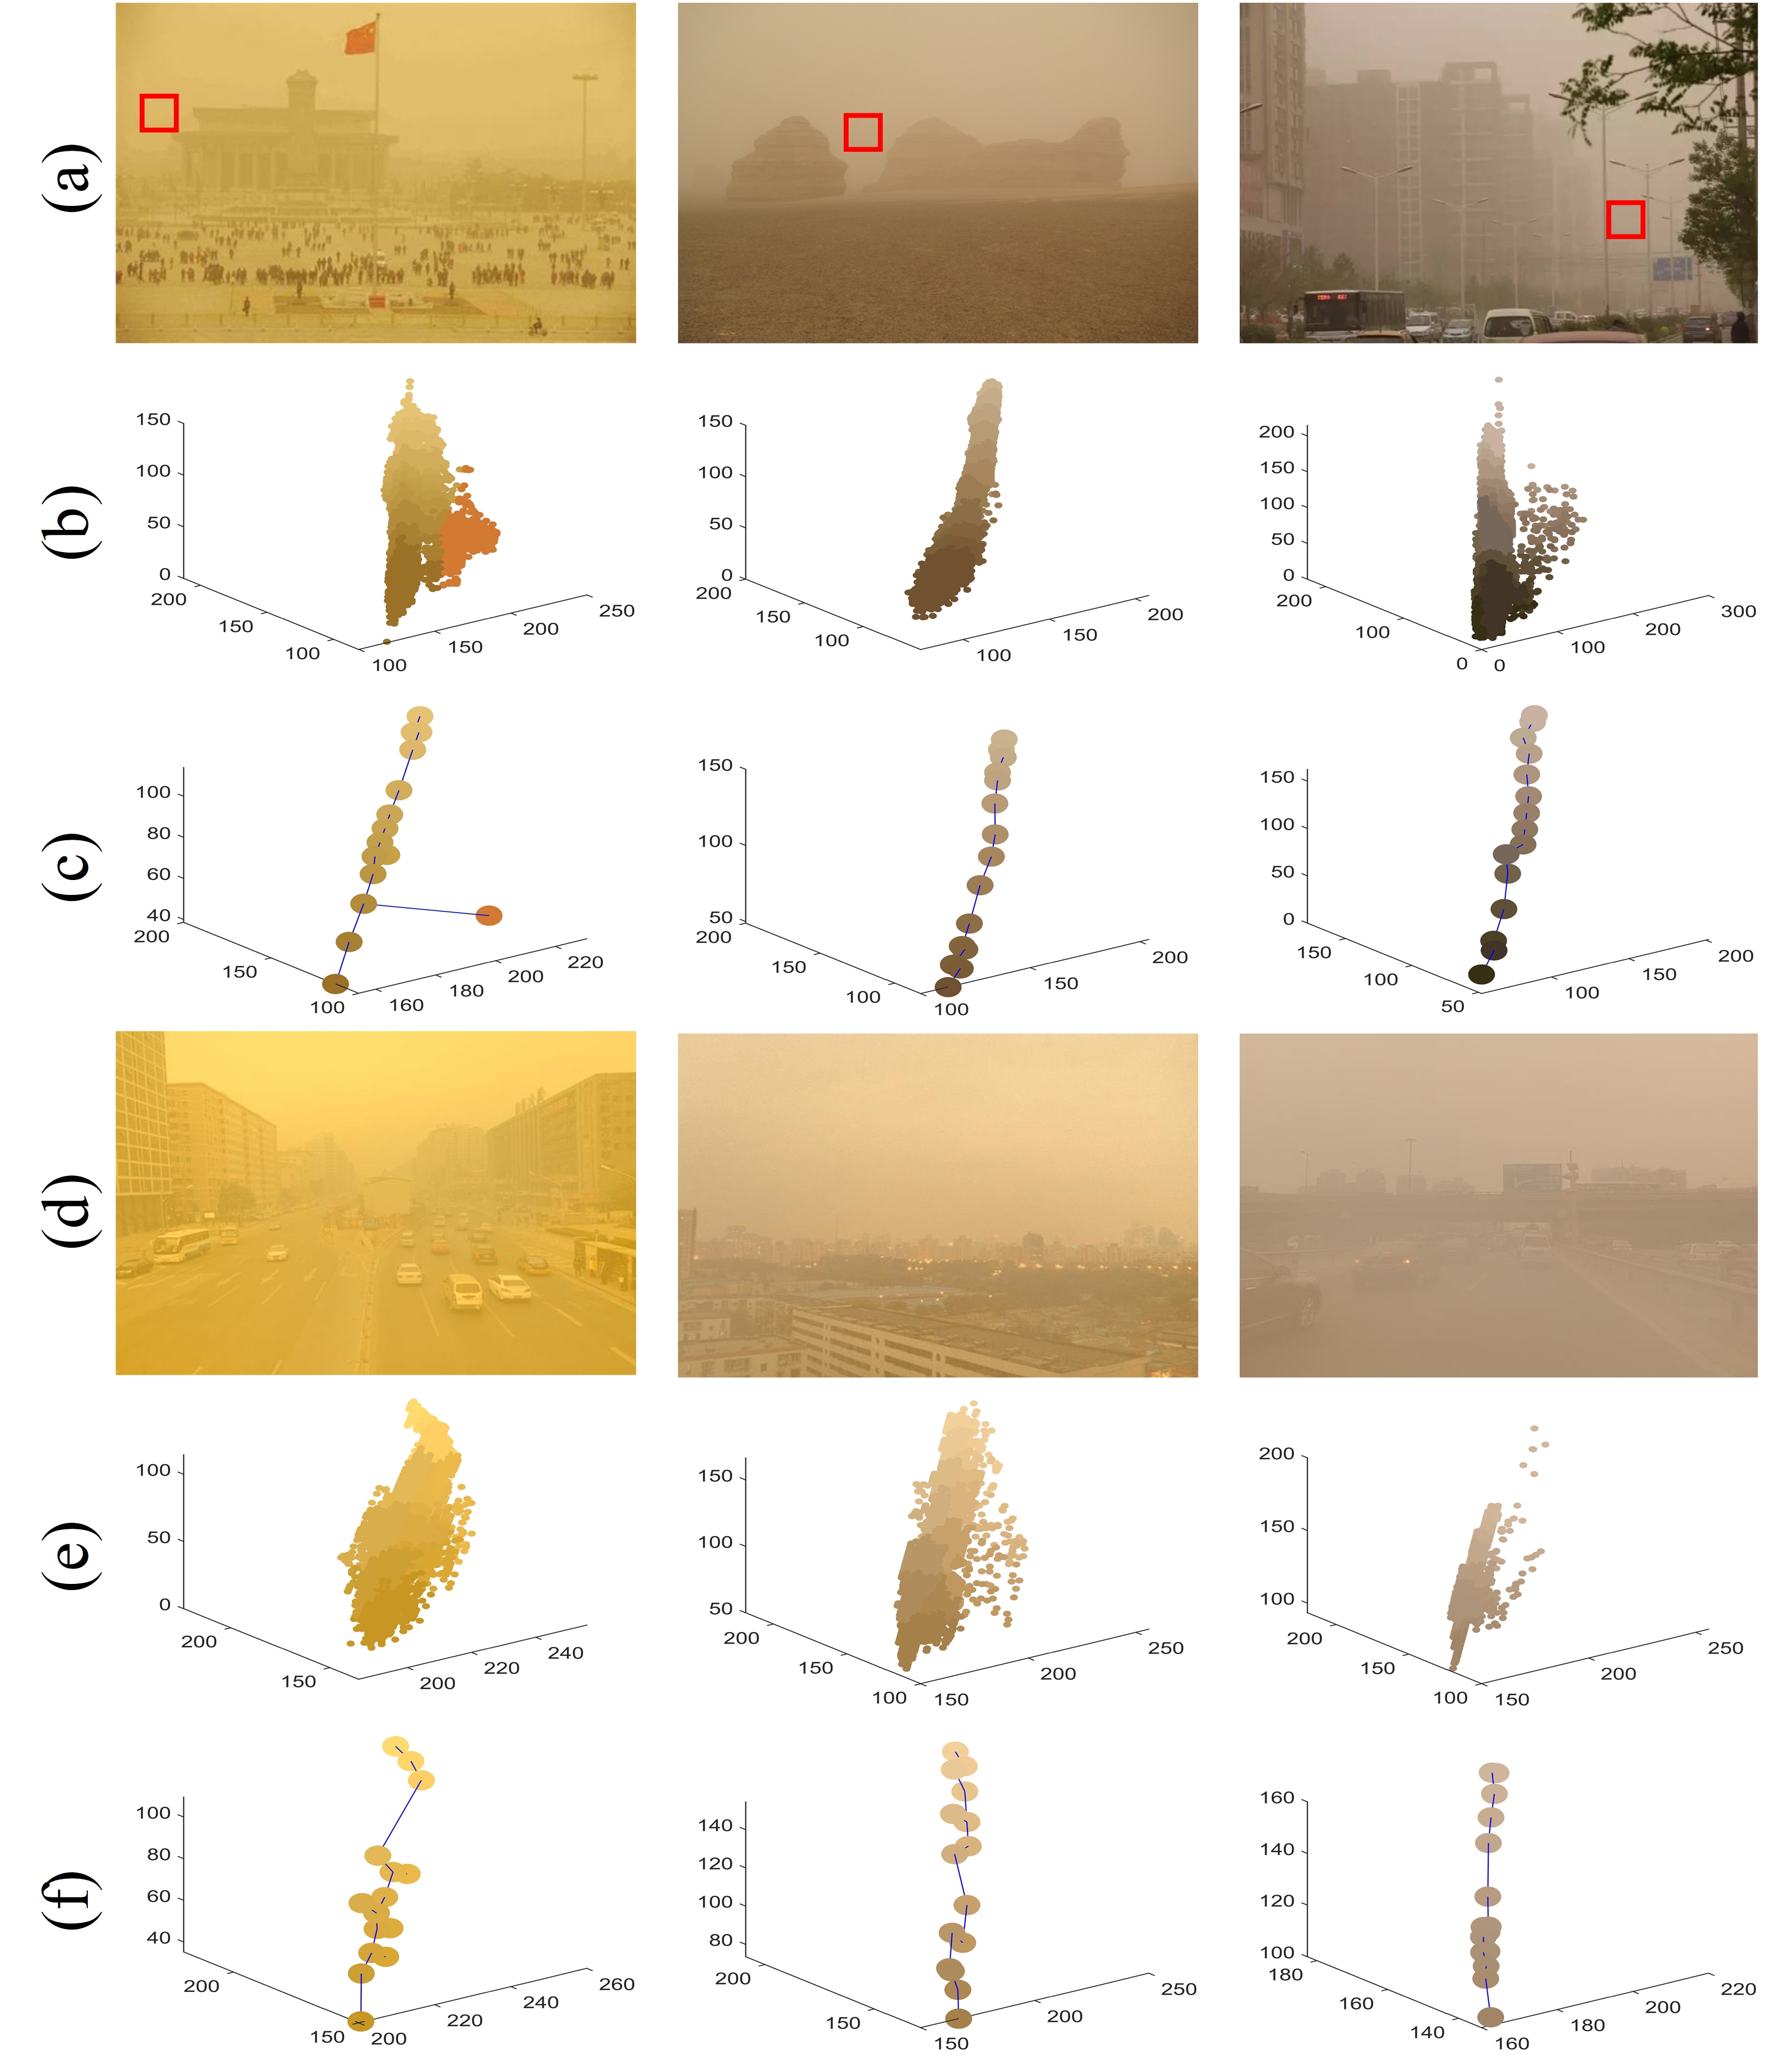
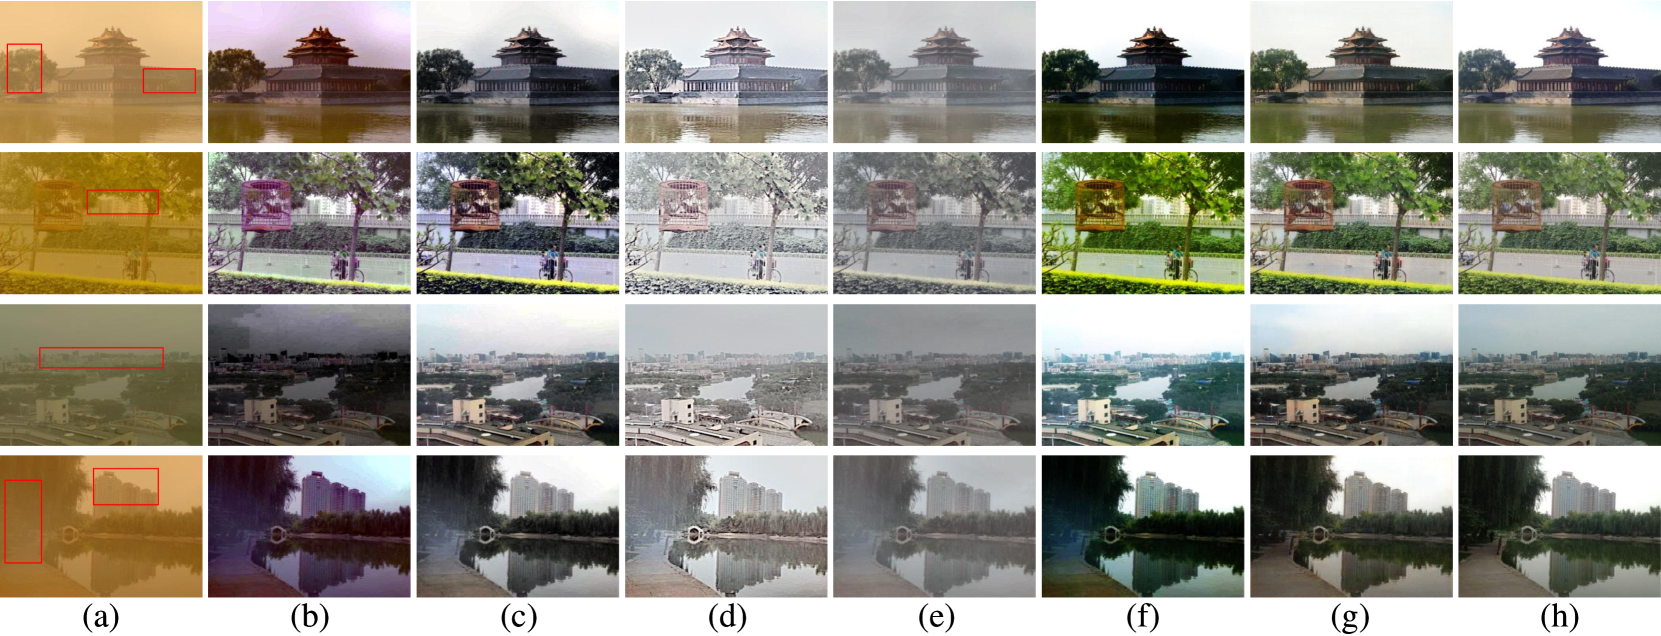
Figure 4 shows the color quantization and cluster of the sand dust images, of the synthetic images were selected from the red rectangles of the real-world degraded images in the same column. As shown in Figure 4(b) and (e), we extracted the images hue through color quantization method and adopted Eq.8 as the loss function of K-means to cluster the color distribution in LAB space.
| (8) |
| (9) |
| (10) |
where is the pixel number; is the sample in LAB space; represents the center point corresponding to the cluster and we set the number of cluster to 15; is the number of iterations; is the average value of the current cluster.
We repeatedly calculate Eq.9 and Eq.10, and update the corresponding parameters until converges. The clustering results are shown in Figure 4(c) and (f). For sand dust images, the sand dust concentration and the color shift tend to increase with the depth of field, and the spatial distribution of color categories should be approximately a straight line. In Figure 4, synthetic results are similar to the real-world degraded images both in terms of statistical characteristics and visual perception.
To the best of our current knowledge, SIRB is the first large scale sand dust images benchmark dataset, which has great potential for training the CNNs and evaluating the performance of sand dust removal algorithms.
4. Evaluation and Discussion
Due to the absence of reference images, most studies using few selected real-world images from internet to evaluate the performance of sand dust removal algorithms. However, that cannot provide a comprehensive assessment of the algorithm’s performance. Based on the constructed SIRB, we evaluated 5 representative algorithms of sand dust removal including CIDC (Dhara et al., 2020), FBE (Fu et al., 2014), HRDCP (Shi et al., 2019a), NGT (Shi et al., 2019b), TTFIO (Al-Ameen, 2016). For the fairness of comparison, all the codes of the algorithms are from the website of their authors. Furthermore, to illustrate the general applicability of SIRB for training CNNs, we trained Pix2Pix (Isola et al., 2017) on SIRB-T(L), SIRB-T(M), SIRB-T(D) and SIRB-T(H) respectively as baseline, and marked them as Pix2pix-L, Pix2pix-M, Pix2pix-D and Pix2pix-H. In the following, we will compare the performance of the algorithms on SIRB-E and RSTS both qualitatively and quantitatively.
| Metrics | CIDC (Dhara et al., 2020) | FBE (Fu et al., 2014) | HRDCP (Shi et al., 2019a) | NGT (Shi et al., 2019b) | TTFIO (Al-Ameen, 2016) | Pix2pix (Isola et al., 2017) | Reference images |
|---|---|---|---|---|---|---|---|
| SIRB-E(L) | |||||||
| PSNR(dB)↑ | 15.9212 | 20.1792 | 11.6168 | 14.8567 | 18.4317 | 24.5471 | |
| MSE()↓ | 19.4965 | 7.3057 | 47.7826 | 23.803 | 11.1207 | 2.6383 | 0 |
| SSIM↑ | 0.5369 | 0.7292 | 0.575 | 0.6614 | 0.5754 | 0.8177 | 1 |
| FSIMc↑ | 0.9088 | 0.9225 | 0.8109 | 0.8994 | 0.916 | 0.9322 | 1 |
| CIE94↓ | 21.0675 | 10.8067 | 25.0726 | 17.5628 | 17.8953 | 7.0081 | 0 |
| CIEDE2000↓ | 39.2437 | 23.5664 | 29.9438 | 25.9552 | 40.7036 | 18.1497 | 0 |
| SIRB-E(M) | |||||||
| PSNR(dB)↑ | 15.3509 | 18.9701 | 10.7092 | 13.8026 | 17.0033 | 23.9323 | |
| MSE()↓ | 21.996 | 9.822 | 59.0351 | 29.9207 | 16.2594 | 3.0561 | 0 |
| SSIM↑ | 0.5073 | 0.6811 | 0.5536 | 0.5962 | 0.4978 | 0.7935 | 1 |
| FSIMc↑ | 0.8853 | 0.9068 | 0.8189 | 0.8431 | 0.8924 | 0.9208 | 1 |
| CIE94↓ | 21.8312 | 12.2343 | 27.7036 | 19.5966 | 19.6172 | 7.2978 | 0 |
| CIEDE2000↓ | 40.1243 | 24.3841 | 30.6187 | 27.0389 | 39.839 | 18.2889 | 0 |
| SIRB-E(D) | |||||||
| PSNR(dB)↑ | 14.8224 | 17.8168 | 9.9632 | 13.0396 | 15.5809 | 23.0025 | |
| MSE()↓ | 24.3192 | 12.6623 | 69.9469 | 35.1292 | 23.1261 | 3.8136 | 0 |
| SSIM↑ | 0.476 | 0.6291 | 0.5194 | 0.5381 | 0.434 | 0.7609 | 1 |
| FSIMc↑ | 0.8593 | 0.8855 | 0.8065 | 0.7888 | 0.8659 | 0.9064 | 1 |
| CIE94↓ | 22.5045 | 13.8246 | 29.9714 | 21.2139 | 21.5307 | 7.9267 | 0 |
| CIEDE2000↓ | 40.6899 | 25.9296 | 31.2957 | 27.9186 | 38.8379 | 18.988 | 0 |
| SIRB-E(H) | |||||||
| PSNR(dB)↑ | 15.4827 | 18.9324 | 10.8071 | 13.9506 | 16.9514 | 23.9422 | |
| MSE()↓ | 21.3386 | 10.111 | 58.1206 | 28.9367 | 17.008 | 3.039 | 0 |
| SSIM↑ | 0.5097 | 0.6799 | 0.5477 | 0.6025 | 0.4989 | 0.7926 | 1 |
| FSIMc↑ | 0.8869 | 0.906 | 0.8108 | 0.8476 | 0.8937 | 0.9204 | 1 |
| CIE94↓ | 21.5635 | 12.3904 | 27.4295 | 19.2932 | 19.6119 | 7.3264 | 0 |
| CIEDE2000↓ | 39.8556 | 24.7188 | 30.7003 | 26.9774 | 39.6975 | 18.2764 | 0 |
4.1. Qualitative evaluation
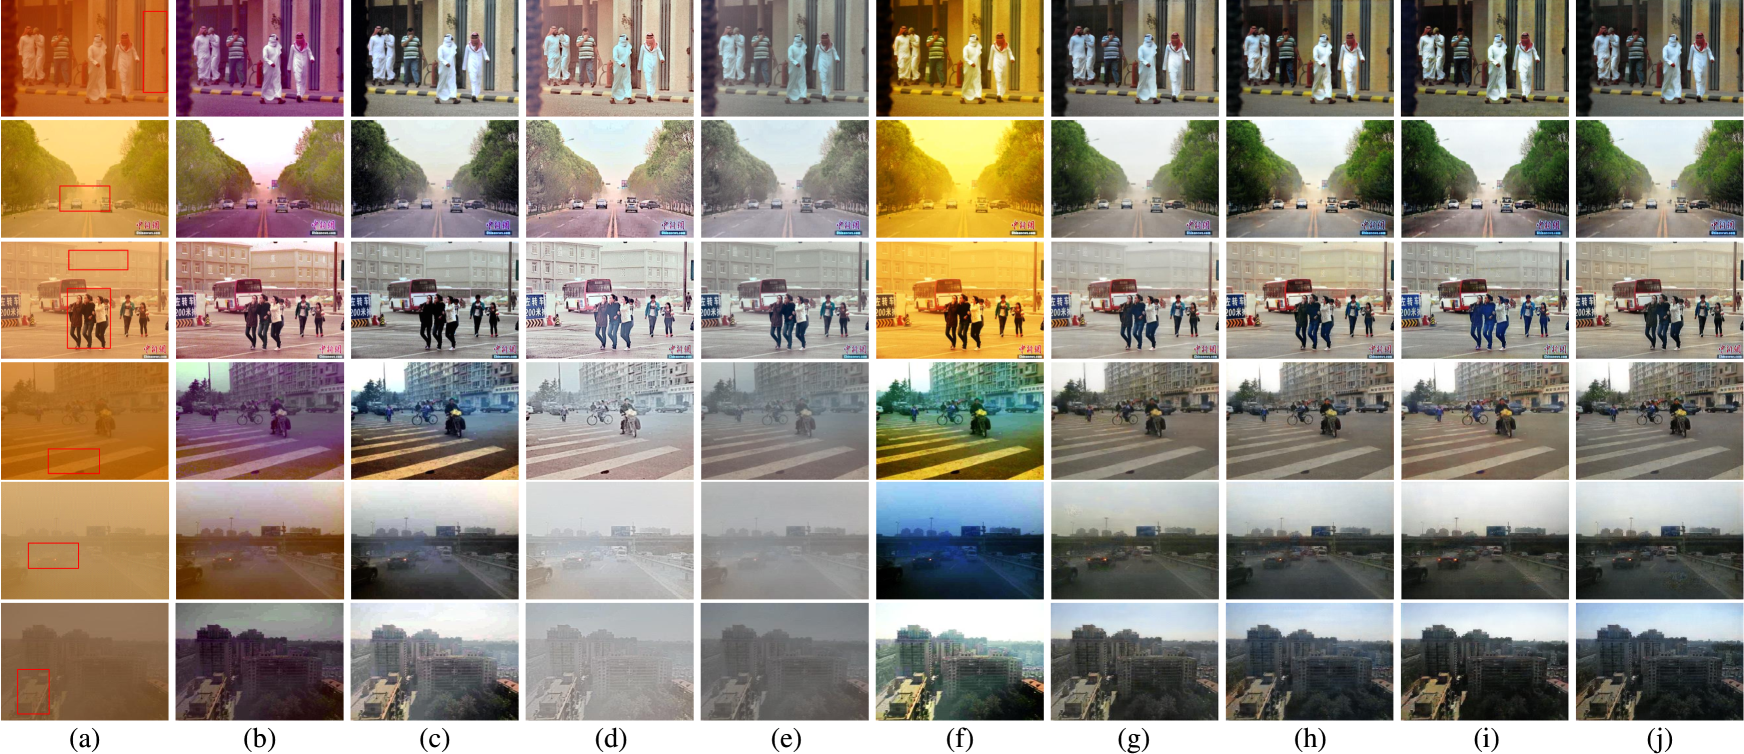
As shown in Figure 5, We provided several synthetic and real-word sand dust degraded images from SIRB as the comparison samples, please zoom in for a better illustration. The color correction ability of CIDC (Dhara et al., 2020) is the weakest, followed by TTFIO (Al-Ameen, 2016), the results of them have obvious color distortion issues. In the comparisons, HRDCP (Shi et al., 2019a) and NGT (Shi et al., 2019b) can effectively correct the color, but the noise was amplified as well, there still existing residue dust in the images. For FBE (Fu et al., 2014), it can effectively correct the color and improve the clarity of the images, but the results are slightly dark and with low saturation. In Figure 5, The results of the CNNs are visually more pleasing, as shown in the red marked areas, the color correction ability of Pix2pix-L is stronger than the other three training strategies, but the dust removal ability is relatively weak, the area in the deep scenes of the results are still hazy; While the dust removal ability of Pix2pix-D is better than the other three training strategies, but it is weak in term of color correction, the local area still exist the issue of color shift. Moreover, in the local area with high dust concentration, Pix2pix may loss the detail information, it is a noteworthy issue in future sand dust image reconstruction research.
In the comparison experiment, we found that the performance of CNNs is affected by the training dataset to a large extent. Pix2pix-L can correct the color effectively, but the background is still hazy. On the contrary, Pix2pix-D has stronger dust removal ability, but there is slight color distortion in local areas. Overall, the Pix2pix-M and Pix-pix-H can keep better balance between color correction and dust removal. Scholars should choose different training strategies according to the demands of their sand dust removal tasks.
4.2. Quantitative evaluation
4.2.1. Non-reference evaluation
We tested the performance of the algorithms on synthetic evaluation datasets and RSTS with three non-reference metrics including NIQE, SSEQ, and BIQI. The average scores are shown in Table 2, where the lower metrics indicate the less distortion and more natural of the results.
In Table 2, the best performance, the second best and the third best are highlighted in red, green, and blue respectively. The metrics of Pix2pix are the average values of the CNNs trained on four subsets. Clearly, compared with the traditional algorithms, Pix2pix has the absolute advantage in the performance of indicators both synthetic datasets and RSTS. In addition, we evaluated the image quality of real-world sand dust degraded images and reference images, and marked them in bold. It is undeniable that though the non-reference evaluation algorithms had claimed they took the human visual perception into account, but the metrics of the reference images provide evidence that the evaluation algorithms without reference may not always be accurate. The scores of reference images are even higher than most results of the comparison algorithms. In addition, for the algorithms tested on RSTS, the scores of their results are even higher than original degraded images, which are unfair evaluations from the perspective of human visual perception. Although the non-reference metrics can rank the algorithms performance to some extent, they are intrinsically limited due to the unavailability to comprehensive study and analyze the results, especially their poor alignment with human perception for the images with extremely serious color deviation in such sandstorm environment.
| Image sizes | CIDC (Dhara et al., 2020) | FBE (Fu et al., 2014) | HRDCP (Shi et al., 2019a) | NGT (Shi et al., 2019b) | TTFIO (Al-Ameen, 2016) | Pix2pix (Isola et al., 2017) |
|---|---|---|---|---|---|---|
| 256×256 | 0.1356 | 0.0891 | 0.4268 | 0.037 | 0.016 | 0.0148 |
| 512×512 | 0.6493 | 0.2957 | 1.6464 | 0.111 | 0.0837 | 0.0235 |
| 1024×1024 | 2.8163 | 1.1904 | 6.767 | 0.4032 | 0.675 | 0.0691 |
4.2.2. Full-reference evaluation
To some extent, by using the reference images, the metrics of full-reference evaluation strategy can provide realistic feedback of the comparison algorithms, although there might be differences between the reference images and the real ground truth images. To complement the one-sided of the non-reference evaluation, we evaluated the algorithms by calculating pixel error, structural error, and color deviation.
Pixel error is one of the most intuitive criteria for people to perceive image quality, we employed two most popular indicators PSNR and MSE to measure the pixel error. As shown in Table 3, we present the average metrics of the algorithms on the synthetic evaluation datasets, the result with higher PSNR and lower MSE scores means it is closer to the reference image in term of content. In Table 3, Pix2pix (Isola et al., 2017) has the best overall performance, and FBE (Fu et al., 2014) ranks the second-best overall performance in pixel error, followed by TTFIO (Al-Ameen, 2016). As shown in Figures 1 and 5, CIDC (Dhara et al., 2020) and HRDCP (Shi et al., 2019a) amplified the noise when removing sand and dust, leading to the larger pixel error in the results.
We adopted SSIM and FSIMc to measure the structural information of the results, which are widely used to evaluate the structure differences between two images. The higher SSIM and FSIMc scores denote the structure of the results are closer to the reference images. We measured the structural errors of the algorithms on four evaluation subsets, and we also provide the metrics of the reference images as the target line. In Table 3, as the traditional algorithms, FBE (Fu et al., 2014) has the second best overall performance, followed by TTFIO (Al-Ameen, 2016), but there is still an obvious gap between the traditional algorithms and CNNs based method.
The most intuitive feature of the sand dust images is color shift. Whether the issue of color distortion can be properly handled is directly reflect the color correction ability of the algorithms, which also an important reference to evaluate the performance of the algorithms. To refine the evaluation strategies, we supplemented CIE94 and CIEDE2000 to measure the color correction ability of the algorithms. The average metrics of the algorithms on the synthetic evaluation sets as shown in Table 3, the lower CIE94 and CIEDE2000 metrics mean the result is closer to the reference image in term of color consistency. In Figures 1 and 5, the results of CIDC (Dhara et al., 2020) and TTFIO (Al-Ameen, 2016) still exist the issue of color distortion, that is the reason why both of them have higher CIE94 and CIEDE2000 metrics. Compared with traditional algorithms, the color correction ability of CNNs based method still shows the clear advantage. The experiments demonstrate that the learning based algorithms have great potential in sand dust removal task.
4.2.3. Execution time
We evaluated the execution time of the algorithms by using Matlab2016a on a PC with an Intel(R) Core (TM) i5-9400 CPU@2.90GHz, 16GB RAM and network on a NVIDIA GeForce RTX2070 GPU. For fairness comparison, all the codes of the algorithms are from the website of their authors. As shown in Table 4, we compared the average runtime for the sand dust images with different sizes. The running time of Pix2pix (Isola et al., 2017) was taken from the average execution time of Pix2pix-L, Pix2pix-M, Pix2pix-D and Pix2pix-H. In Table 4, NGT (Shi et al., 2019b), TTFIO (Al-Ameen, 2016) and Pix2pix can meet the requirements of real-time processing when handling 256256 images. With the increase of image size, the processing speed of the algorithms became slower, especially for traditional algorithms. The most time-consuming algorithm is HRDCP (Shi et al., 2019a), the average running time of it is 6.767s when handling 10241024 images. The processing speed of Pix2pix on 10241024 images is about 15FPS, that means when the images size is less than 10241024, Pix2pix can theoretically meet the needs of real-time processing in practical deployment.
5. Conclusion and Future Research
In this paper, we constructed a novel large-scale dataset named SIRB, which provide a supervised way to benchmark the performance of the algorithms. The dataset enabled us to conduct a thorough survey of the current sand dust removal algorithms. Moreover, we trained Pix2pix as baseline on SIRB-T and discussed the impact of training dataset for the performance of the network. Extensive experiments demonstrate that the data-driven based method superiority over the traditional algorithms in terms of qualitative and quantitative evaluation. To further compare the practical value of the algorithms, we implemented the time complexity analysis experiment. The experiment demonstrate that data-driven based method has an absolute advantage in execution time which shows the great potential of CNNs in the deployment of sand dust video processing. Several overarching observations and empirical findings are summarized as:
-
•
Pix2pix trained on SIRB-T can remove the sandstorm to some extent, however, in the areas with dense sand dust concentration, the intensity of detail information is too weak, which may cause local information distorted in the reconstruction images. How to better preserve the detail information in sand dust removal task needs further research and discussion.
-
•
In CNNs, the appropriate prior knowledge may play a positive role in training. We advocate a combination of appropriate priors and data-driven algorithms to make their advantages complementary.
-
•
In the execution time experiment, we found that besides processing the single image, the data-driven method also has the potential for video processing. It is possible to handle high-resolution images in real time by cutting redundant branches and deleting unnecessary parameters of the network.
Although the proposed method can generate visually realistic sand dust images, based on the experiments and analysis there still some issues cannot be ignored. Specifically, due to the inaccurate estimation of depth, some synthetic images have dense sand dust concentration in the foreground and low concentration in the background; In addition, how to expand the sand dust intensity and environment types more suitable for training CNNs are still the focus in our future research.
Acknowledgements.
This work is supported by National Key Research and Development Program of China(2019YFB1312102) and Natural Science Foundation of Hebei Province(F2019202364).Appendix A A Comprehensive Benchmark Analysis for Sand Dust Image Reconstruction: Supplementary Material
A.1. Further study of the sand dust degraded images feature
A.1.1. Irreversible sand dust distribution
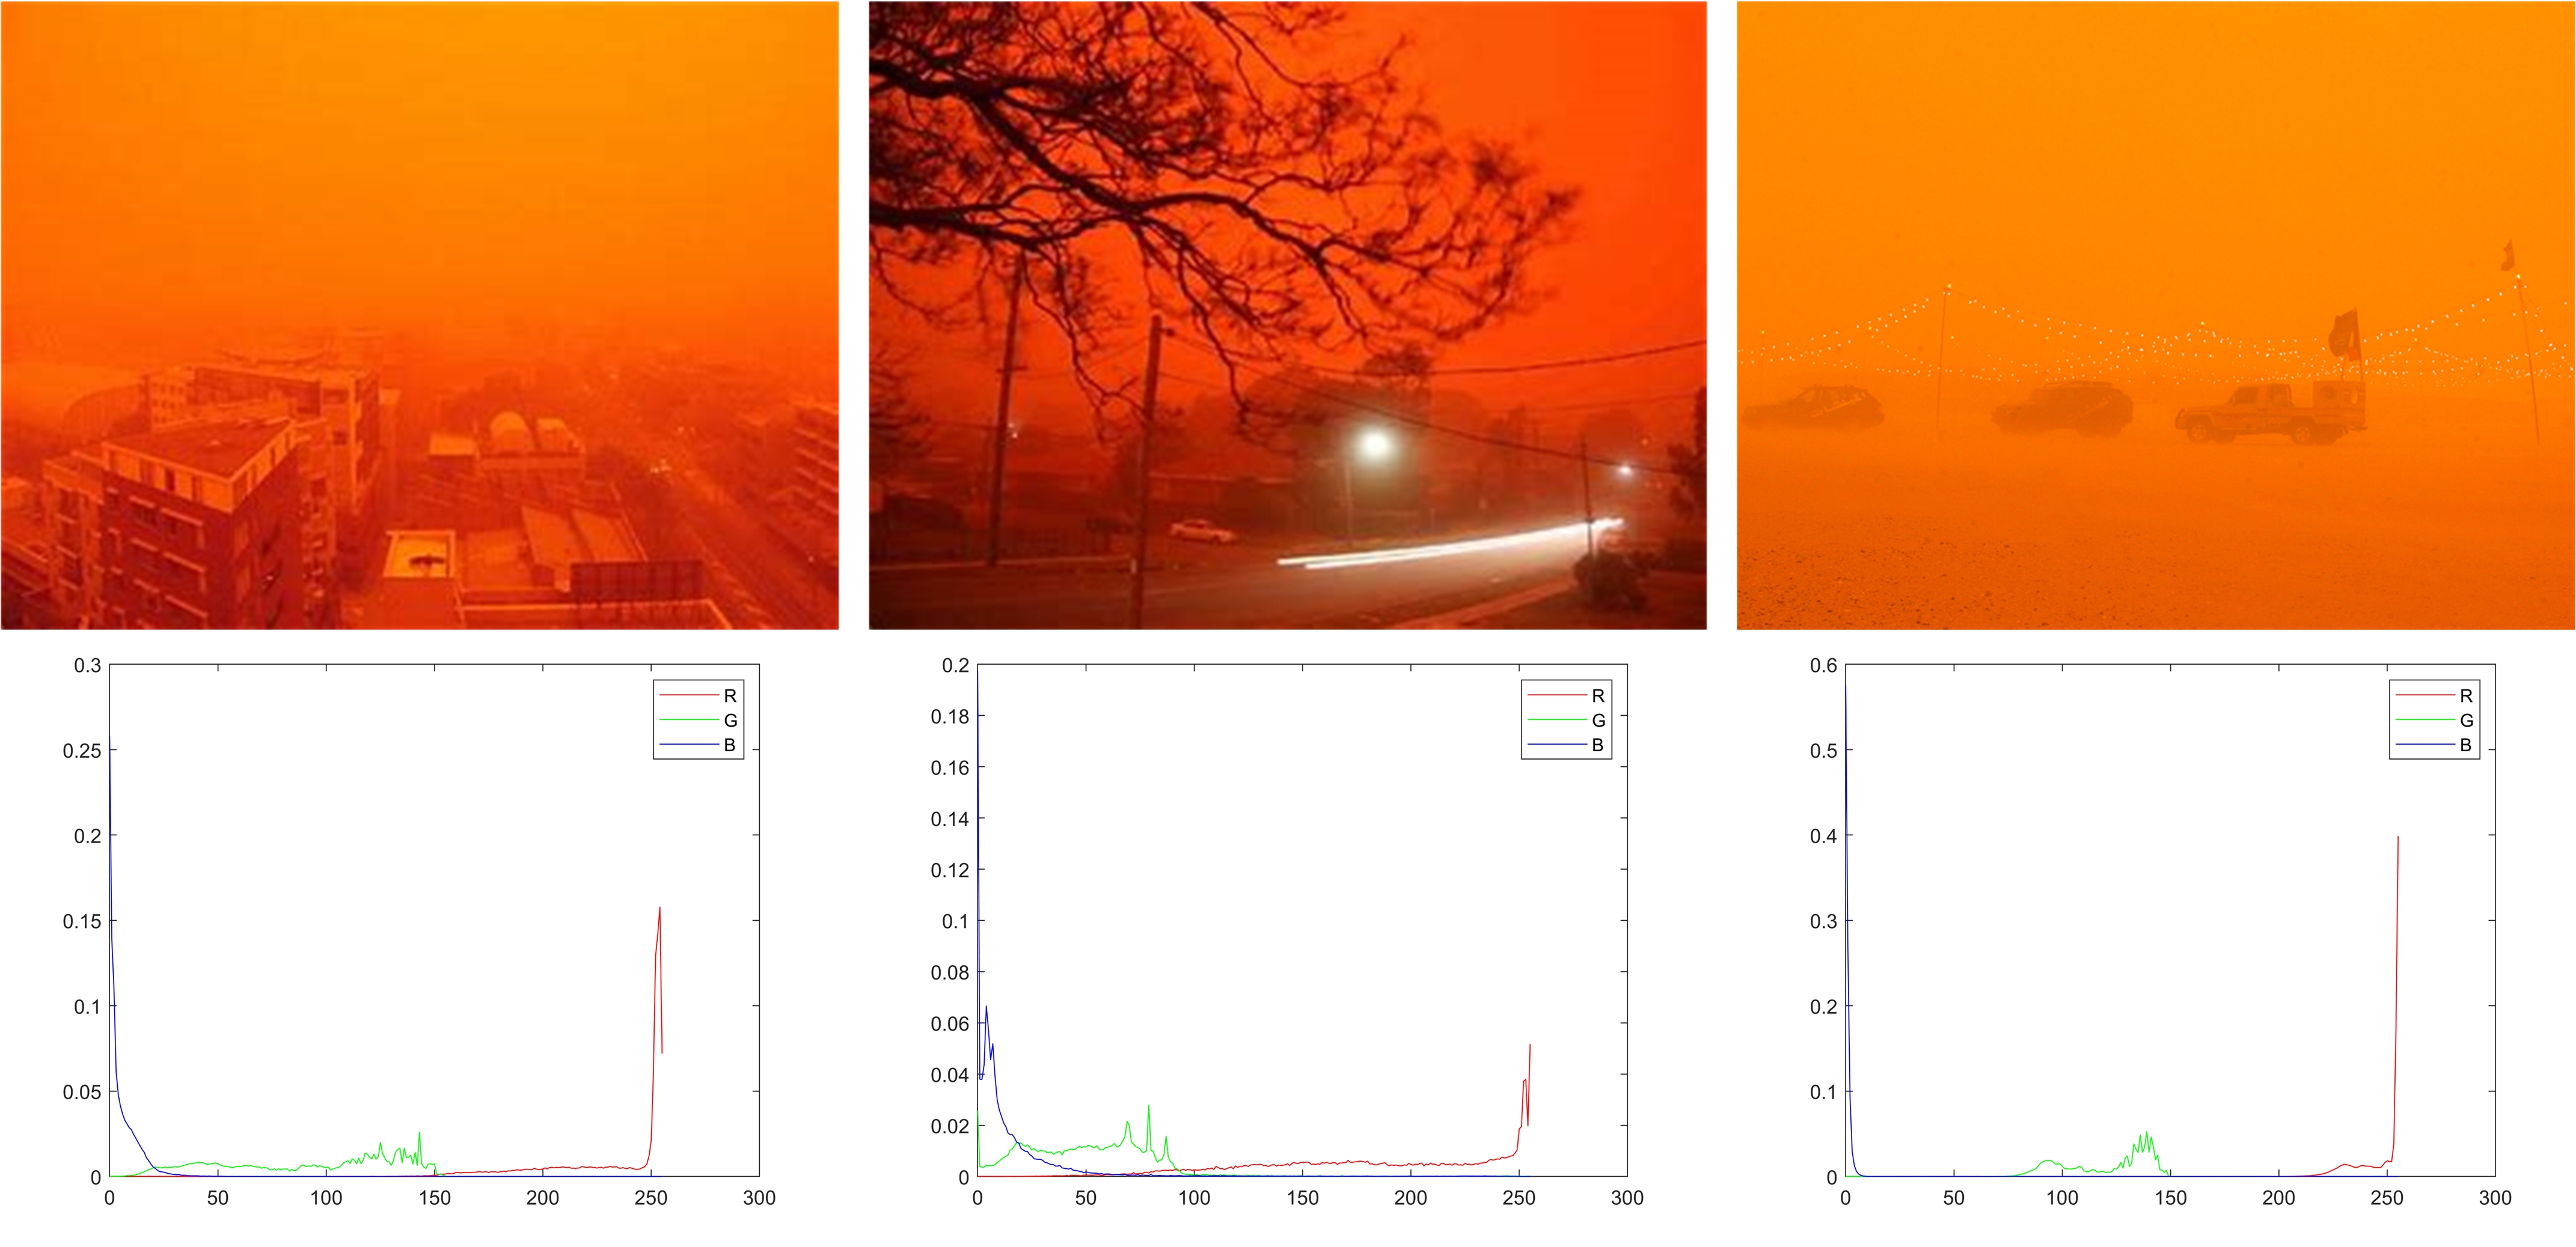
To improve the quality of the dataset, we have done much research on the color deviation distribution of real-world sand dust images. Almost all sand dust images retain complete RGB channel information except for the few images with extremely serious color deviation. As shown in Figure 6, a large amount of color information was lost due to the extremely serious color shifting. The energy of B is almost 0, while the energy of R is overflows to 255, that situations are irreversible, so we will not further analyze and discuss it in the article.
A.2. More results synthesized by the proposed method
A.2.1. Controllable synthetic results generated by proposed method
In SIRB, the hyper-parameters and , can be changed to generate controllable synthetic sand dust images. The sandstorm environment is too complex, the diversity of color deviation and dust intensity could play a positive role in training neural networks with better generalization ability.
Global color deviation values To improve the diversity and authenticity of the dataset, we carried out empirical research on real-world sandstorm images to obtain the sand distribution and all the global color deviation values of the synthetic images are taken from the area of maximum depth in real-world sandstorm images. The global color deviation values of SIRB are shown in Table 5, and the values all following the principle of >>. To avoid the loss of color information due to the underflow or overflow of pixels, the global color deviation values in SIRB all can limit the original information to a valid interval.
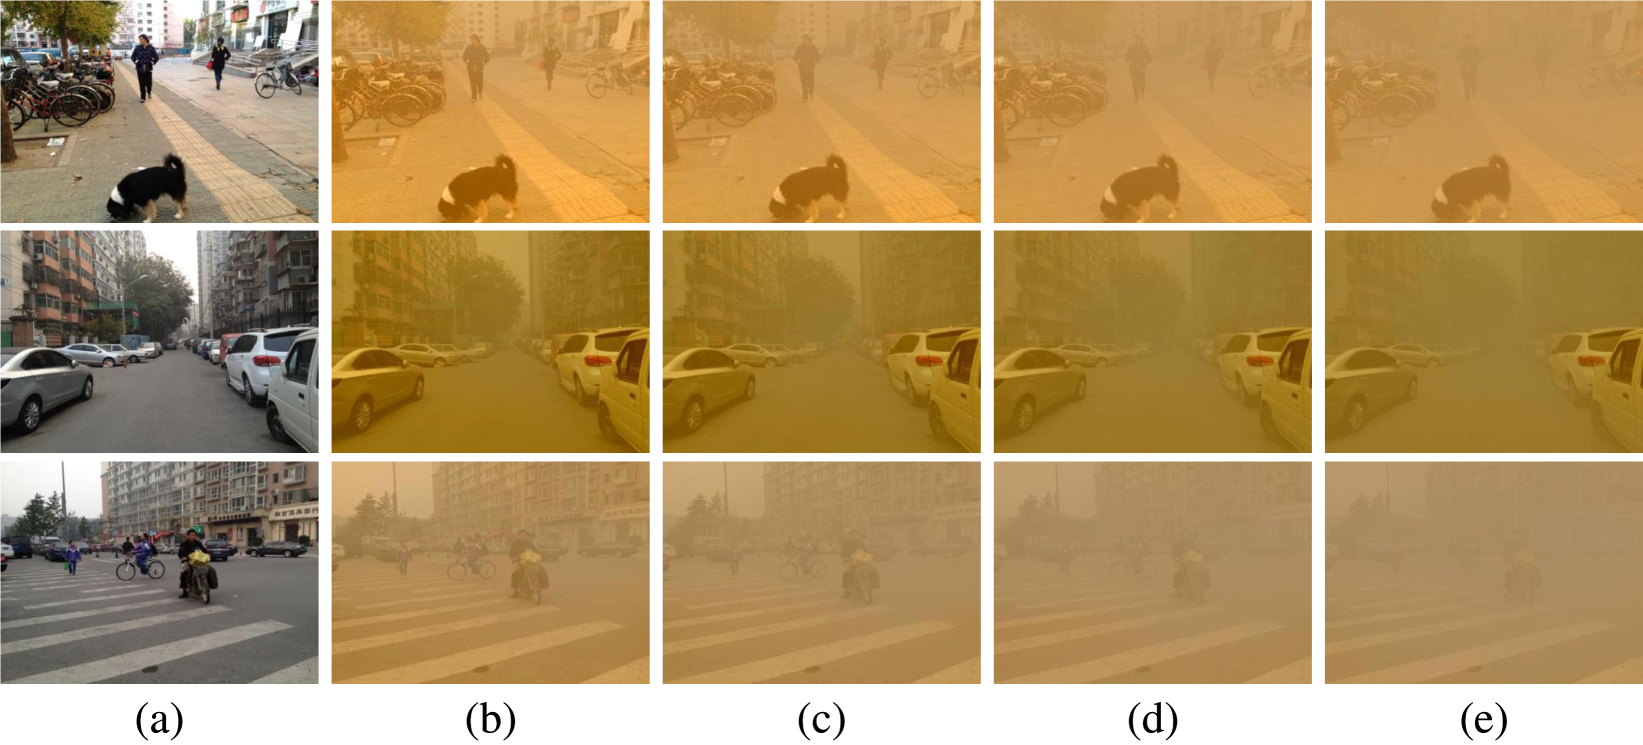
Sand dust intensity To improve the quality of the synthetic images, we set the lower and upper limits of to 0.3 and 0.6, respectively. As shown in Figure 7, we provide three synthetic samples to illustrate the effect of on the synthesis results. With the increasing of , the concentration of sand dust is higher, and the images become more hazy.
A.2.2. Visual results on public datasets
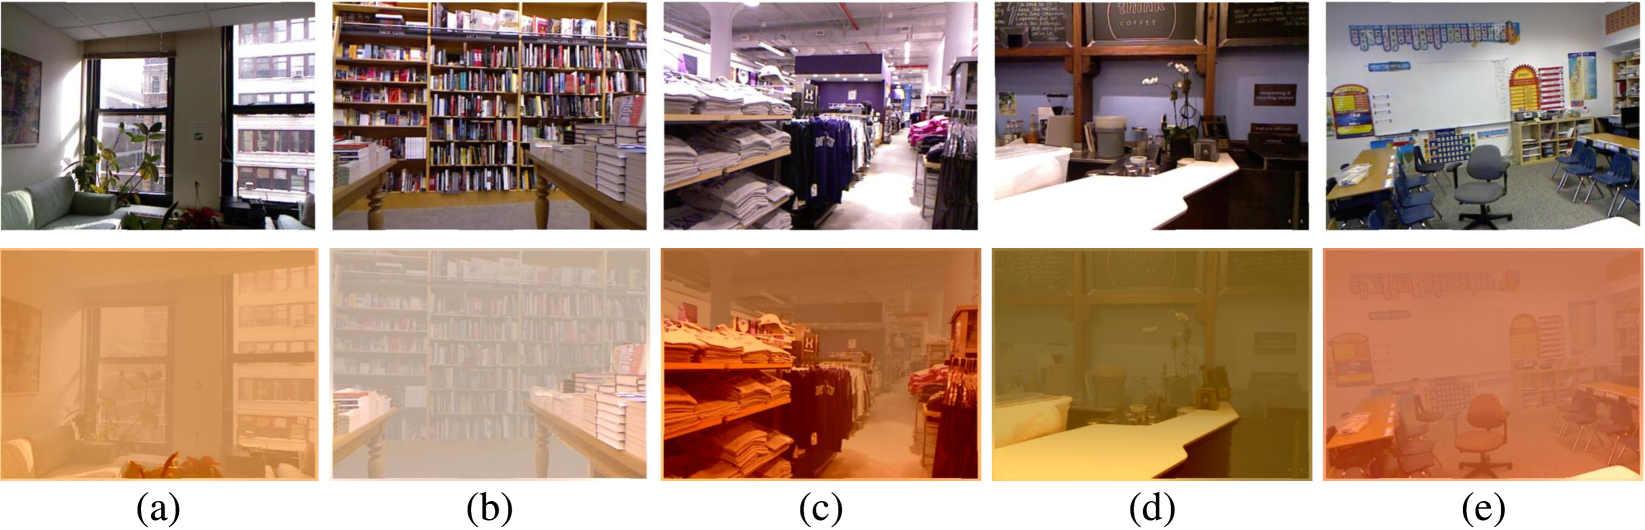
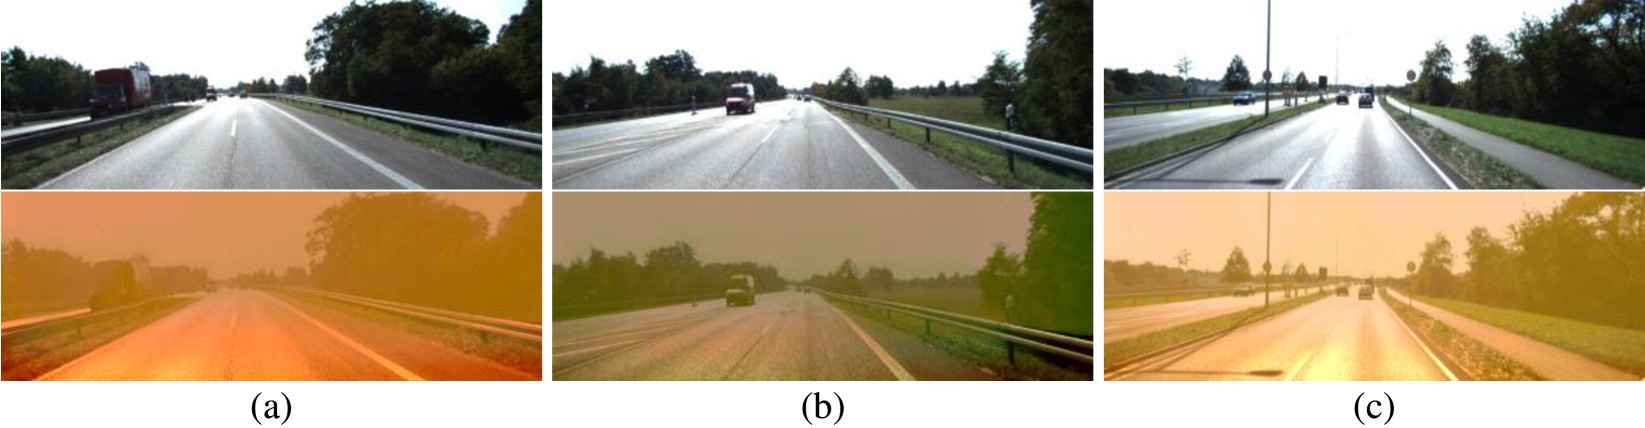
We synthesized the sand dust images using NYU (Silberman et al., 2012) and KITTI (Geiger et al., 2012) datasets to further illustrate the generality of the proposed synthesis method. As shown in Figures 8 and 9, the proposed synthesis method can simulate the characteristics of the sandstorm degraded image both indoor and outdoor scene. That means we can synthesize more valuable sand dust images based on the public datasets for training neural network and evaluating the performance of the sand dust removal algorithms.
| Color | R | G | B | Hex | |
|---|---|---|---|---|---|
| 0.78431 | 0.58039 | 0.38824 | #C89463 | ||
| 0.77647 | 0.52157 | 0.23922 | #C6853D | ||
| 0.75686 | 0.44314 | 0.21569 | #C17137 | ||
| 0.73333 | 0.61176 | 0.52941 | #BB9C87 | ||
| 0.72549 | 0.66275 | 0.61176 | #B9A99C | ||
| 0.72549 | 0.4549 | 0.33333 | #B97455 | ||
| 0.71765 | 0.55686 | 0.33725 | #B78E56 | ||
| 0.7098 | 0.43529 | 0.29412 | #B56F4B | ||
| 0.70196 | 0.47843 | 0.26275 | #B37A43 | ||
| 0.70196 | 0.56863 | 0.38824 | #B39163 | ||
| 0.6549 | 0.44314 | 0.20784 | #A77135 | ||
| 0.64706 | 0.53725 | 0.38039 | #A58961 | ||
| 0.63137 | 0.2902 | 0.06275 | #A14A10 | ||
| 0.59608 | 0.38824 | 0.22353 | #986339 | ||
| 0.59216 | 0.47843 | 0.21961 | #977A38 | ||
| 0.54902 | 0.43137 | 0.21961 | #8C6E38 | ||
| 0.51765 | 0.40392 | 0.29804 | #84674C | ||
| 0.5098 | 0.41176 | 0.20392 | #826934 | ||
| 0.4902 | 0.43137 | 0.2902 | #7D6E4A | ||
| 0.48627 | 0.46275 | 0.41569 | #7C766A | ||
| 0.43529 | 0.33725 | 0.2 | #6F5633 |
A.3. More comparisons of sand dust removal algorithms
A.3.1. Visual comparisons on SIRB
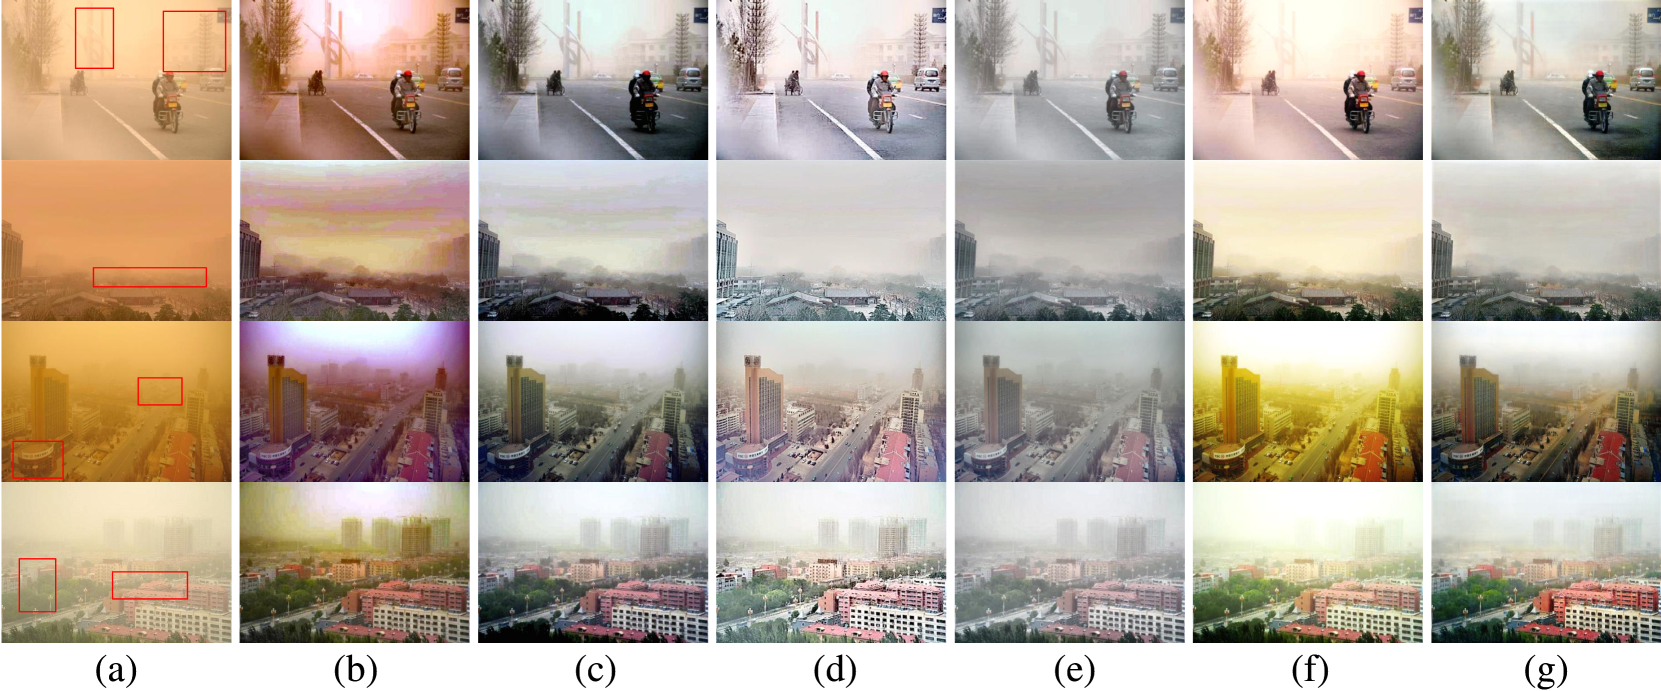
As shown in Figures 10 and 11, we present some visual comparisons on SIRB. Figure 10 is the comparisons on SIRB-E, and Figure 11 is the results on RSTS. In Figure 10, the results of Pix2pix trained on SIRB-T are visually closer to the reference images. The distribution of real-world sand dust images is complex and changeable, and diversity synthesis strategy is useful for for training deep neural networks with better generalizability. As shown in Figure 11, one can see that traditional algorithms generally exist the issues such as color distortion and incomplete dust removal, etc. The approach based on deep learning is better than the existing sand dust removal algorithms in terms of color correction and dust elimination both synthetic images and real-world sand dust images, which shed light the future research of sand dust image reconstruction.
References
- (1)
- Al-Ameen (2016) Zohair Al-Ameen. 2016. Visibility enhancement for images captured in dusty weather via tuned tri-threshold fuzzy intensification operators. International Journal of Intelligent Systems and Applications 8, 8 (2016), 10.
- Ancuti and Ancuti (2013) Codruta Orniana Ancuti and Cosmin Ancuti. 2013. Single image dehazing by multi-scale fusion. IEEE transactions on image processing: a publication of the IEEE Signal Processing Society 22, 8 (2013), 3271–3282.
- Ancuti et al. (2018) Codruta O Ancuti, Cosmin Ancuti, Radu Timofte, and Christophe De Vleeschouwer. 2018. O-haze: a dehazing benchmark with real hazy and haze-free outdoor images. In Proceedings of the IEEE conference on computer vision and pattern recognition workshops. 754–762.
- Anvari and Athitsos (2020) Zahra Anvari and Vassilis Athitsos. 2020. Dehaze-GLCGAN: unpaired single image de-hazing via adversarial training. arXiv preprint arXiv:2008.06632 (2020).
- Anwar et al. (2018) Saeed Anwar, Chongyi Li, and Fatih Porikli. 2018. Deep underwater image enhancement. arXiv preprint arXiv:1807.03528 (2018).
- Berman et al. (2016) Dana Berman, Shai Avidan, et al. 2016. Non-local image dehazing. In Proceedings of the IEEE conference on computer vision and pattern recognition. 1674–1682.
- Berman et al. (2020) Dana Berman, Deborah Levy, Shai Avidan, and Tali Treibitz. 2020. Underwater Single Image Color Restoration Using Haze-Lines and a New Quantitative Dataset. IEEE Transactions on Pattern Analysis and Machine Intelligence (2020).
- Chen and Li (2021) Chenghao Chen and Hao Li. 2021. Robust Representation Learning with Feedback for Single Image Deraining. In Proceedings of the IEEE/CVF Conference on Computer Vision and Pattern Recognition. 7742–7751.
- Cheng et al. (2020) Yaqiao Cheng, Zhenhong Jia, Huicheng Lai, Jie Yang, and Nikola K Kasabov. 2020. A fast sand-dust image enhancement algorithm by blue channel compensation and guided image filtering. IEEE Access 8 (2020), 196690–196699.
- Deng et al. (2020) Sen Deng, Mingqiang Wei, Jun Wang, Yidan Feng, Luming Liang, Haoran Xie, Fu Lee Wang, and Meng Wang. 2020. Detail-recovery image deraining via context aggregation networks. In Proceedings of the IEEE/CVF conference on computer vision and pattern recognition. 14560–14569.
- Dhara et al. (2020) Sobhan Kanti Dhara, Mayukh Roy, Debashis Sen, and Prabir Kumar Biswas. 2020. Color cast dependent image dehazing via adaptive airlight refinement and non-linear color balancing. IEEE Transactions on Circuits and Systems for Video Technology 31, 5 (2020), 2076–2081.
- Dong et al. (2020) Yu Dong, Yihao Liu, He Zhang, Shifeng Chen, and Yu Qiao. 2020. FD-GAN: Generative adversarial networks with fusion-discriminator for single image dehazing. In Proceedings of the AAAI Conference on Artificial Intelligence, Vol. 34. 10729–10736.
- Fu and Cao (2020) Xueyang Fu and Xiangyong Cao. 2020. Underwater image enhancement with global–local networks and compressed-histogram equalization. Signal Processing: Image Communication 86 (2020), 115892.
- Fu et al. (2017) Xueyang Fu, Jiabin Huang, Delu Zeng, Yue Huang, Xinghao Ding, and John Paisley. 2017. Removing rain from single images via a deep detail network. In Proceedings of the IEEE Conference on Computer Vision and Pattern Recognition. 3855–3863.
- Fu et al. (2014) Xueyang Fu, Yue Huang, Delu Zeng, Xiao-Ping Zhang, and Xinghao Ding. 2014. A fusion-based enhancing approach for single sandstorm image. In 2014 IEEE 16th International Workshop on Multimedia Signal Processing (MMSP). IEEE, 1–5.
- Gao et al. (2020) GuXue Gao, HuiCheng Lai, ZhenHong Jia, YueQin Liu, and YaLi Wang. 2020. Sand-dust image restoration based on reversing the blue channel prior. IEEE Photonics Journal 12, 2 (2020), 1–16.
- Gao et al. (2021) GuXue Gao, HuiCheng Lai, YueQin Liu, LieJun Wang, and ZhenHong Jia. 2021. Sandstorm image enhancement based on YUV space. Optik 226 (2021), 165659.
- Geiger et al. (2012) Andreas Geiger, Philip Lenz, and Raquel Urtasun. 2012. Are we ready for autonomous driving? the kitti vision benchmark suite. In 2012 IEEE conference on computer vision and pattern recognition. IEEE, 3354–3361.
- Goodfellow et al. (2014) Ian Goodfellow, Jean Pouget-Abadie, Mehdi Mirza, Bing Xu, David Warde-Farley, Sherjil Ozair, Aaron Courville, and Yoshua Bengio. 2014. Generative adversarial nets. Advances in neural information processing systems 27 (2014).
- Guo et al. (2019) Yecai Guo, Hanyu Li, and Peixian Zhuang. 2019. Underwater image enhancement using a multiscale dense generative adversarial network. IEEE Journal of Oceanic Engineering 45, 3 (2019), 862–870.
- He et al. (2010) Kaiming He, Jian Sun, and Xiaoou Tang. 2010. Single image haze removal using dark channel prior. IEEE transactions on pattern analysis and machine intelligence 33, 12 (2010), 2341–2353.
- He et al. (2016) Kaiming He, Xiangyu Zhang, Shaoqing Ren, and Jian Sun. 2016. Deep residual learning for image recognition. In Proceedings of the IEEE conference on computer vision and pattern recognition. 770–778.
- Isola et al. (2017) Phillip Isola, Jun-Yan Zhu, Tinghui Zhou, and Alexei A Efros. 2017. Image-to-image translation with conditional adversarial networks. In Proceedings of the IEEE conference on computer vision and pattern recognition. 1125–1134.
- Li et al. (2017) Boyi Li, Xiulian Peng, Zhangyang Wang, Jizheng Xu, and Dan Feng. 2017. Aod-net: All-in-one dehazing network. In Proceedings of the IEEE international conference on computer vision. 4770–4778.
- Li et al. (2018) Boyi Li, Wenqi Ren, Dengpan Fu, Dacheng Tao, Dan Feng, Wenjun Zeng, and Zhangyang Wang. 2018. Benchmarking single-image dehazing and beyond. IEEE Transactions on Image Processing 28, 1 (2018), 492–505.
- Li et al. (2019b) Chongyi Li, Chunle Guo, Wenqi Ren, Runmin Cong, Junhui Hou, Sam Kwong, and Dacheng Tao. 2019b. An underwater image enhancement benchmark dataset and beyond. IEEE Transactions on Image Processing 29 (2019), 4376–4389.
- Li et al. (2019a) Ruoteng Li, Loong-Fah Cheong, and Robby T Tan. 2019a. Heavy rain image restoration: Integrating physics model and conditional adversarial learning. In Proceedings of the IEEE/CVF Conference on Computer Vision and Pattern Recognition. 1633–1642.
- Liu et al. (2015) Fayao Liu, Chunhua Shen, Guosheng Lin, and Ian Reid. 2015. Learning depth from single monocular images using deep convolutional neural fields. IEEE transactions on pattern analysis and machine intelligence 38, 10 (2015), 2024–2039.
- Liu et al. (2014) Lixiong Liu, Bao Liu, Hua Huang, and Alan Conrad Bovik. 2014. No-reference image quality assessment based on spatial and spectral entropies. Signal processing: Image communication 29, 8 (2014), 856–863.
- Liu et al. (2020) Risheng Liu, Xin Fan, Ming Zhu, Minjun Hou, and Zhongxuan Luo. 2020. Real-world underwater enhancement: Challenges, benchmarks, and solutions under natural light. IEEE Transactions on Circuits and Systems for Video Technology 30, 12 (2020), 4861–4875.
- McCartney (1976) Earl J McCartney. 1976. Optics of the atmosphere: scattering by molecules and particles. New York (1976).
- McDonald and Smith (1995) Roderick McDonald and KJ Smith. 1995. CIE94-a new colour-difference formula. Journal of the Society of Dyers and Colourists 111, 12 (1995), 376–379.
- Mittal et al. (2012) Anish Mittal, Rajiv Soundararajan, and Alan C Bovik. 2012. Making a “completely blind” image quality analyzer. IEEE Signal processing letters 20, 3 (2012), 209–212.
- Moorthy and Bovik (2009) AK Moorthy and AC Bovik. 2009. A modular framework for constructing blind universal quality indices. IEEE Signal Processing Letters 17 (2009), 7.
- Narasimhan and Nayar (2002) Srinivasa G Narasimhan and Shree K Nayar. 2002. Vision and the atmosphere. International journal of computer vision 48, 3 (2002), 233–254.
- Park and Eom (2021) Tae Hee Park and Il Kyu Eom. 2021. Sand-Dust Image Enhancement Using Successive Color Balance With Coincident Chromatic Histogram. IEEE Access 9 (2021), 19749–19760.
- Peng et al. (2018) Yan-Tsung Peng, Keming Cao, and Pamela C Cosman. 2018. Generalization of the dark channel prior for single image restoration. IEEE Transactions on Image Processing 27, 6 (2018), 2856–2868.
- Qin et al. (2020) Xu Qin, Zhilin Wang, Yuanchao Bai, Xiaodong Xie, and Huizhu Jia. 2020. FFA-Net: Feature fusion attention network for single image dehazing. In Proceedings of the AAAI Conference on Artificial Intelligence, Vol. 34. 11908–11915.
- Ren et al. (2016) Wenqi Ren, Si Liu, Hua Zhang, Jinshan Pan, Xiaochun Cao, and Ming-Hsuan Yang. 2016. Single image dehazing via multi-scale convolutional neural networks. In European conference on computer vision. Springer, 154–169.
- Ryde (1941) JW Ryde. 1941. Echo intensities and attenuation due to clouds, rain, hail, sand and dust storms at centimetre wavelengths. Report 7831 (1941), 22–24.
- Sharma et al. (2005) Gaurav Sharma, Wencheng Wu, and Edul N Dalal. 2005. The CIEDE2000 color-difference formula: Implementation notes, supplementary test data, and mathematical observations. Color Research & Application: Endorsed by Inter-Society Color Council, The Colour Group (Great Britain), Canadian Society for Color, Color Science Association of Japan, Dutch Society for the Study of Color, The Swedish Colour Centre Foundation, Colour Society of Australia, Centre Français de la Couleur 30, 1 (2005), 21–30.
- Shi et al. (2019a) Zhenghao Shi, Yaning Feng, Minghua Zhao, Erhu Zhang, and Lifeng He. 2019a. Let you see in sand dust weather: A method based on halo-reduced dark channel prior dehazing for sand-dust image enhancement. IEEE Access 7 (2019), 116722–116733.
- Shi et al. (2019b) Zhenghao Shi, Yaning Feng, Minghua Zhao, Erhu Zhang, and Lifeng He. 2019b. Normalised gamma transformation-based contrast-limited adaptive histogram equalisation with colour correction for sand–dust image enhancement. IET Image Processing 14, 4 (2019), 747–756.
- Silberman et al. (2012) Nathan Silberman, Derek Hoiem, Pushmeet Kohli, and Rob Fergus. 2012. Indoor segmentation and support inference from rgbd images. In European conference on computer vision. Springer, 746–760.
- Simonyan and Zisserman (2014) Karen Simonyan and Andrew Zisserman. 2014. Very deep convolutional networks for large-scale image recognition. arXiv preprint arXiv:1409.1556 (2014).
- Uplavikar et al. (2019) Pritish M Uplavikar, Zhenyu Wu, and Zhangyang Wang. 2019. All-in-One Underwater Image Enhancement Using Domain-Adversarial Learning.. In CVPR Workshops. 1–8.
- Wang et al. (2021) Bo Wang, Bowen Wei, Zitong Kang, Li Hu, and Chongyi Li. 2021. Fast color balance and multi-path fusion for sandstorm image enhancement. Signal, Image and Video Processing 15, 3 (2021), 637–644.
- Wang et al. (2020a) Cong Wang, Yutong Wu, Zhixun Su, and Junyang Chen. 2020a. Joint self-attention and scale-aggregation for self-calibrated deraining network. In Proceedings of the 28th ACM International Conference on Multimedia. 2517–2525.
- Wang et al. (2020b) Cong Wang, Xiaoying Xing, Yutong Wu, Zhixun Su, and Junyang Chen. 2020b. DCSFN: deep cross-scale fusion network for single image rain removal. In Proceedings of the 28th ACM international conference on multimedia. 1643–1651.
- Wang et al. (2016) Jian Wang, Yanwei Pang, Yuqing He, and Changshu Liu. 2016. Enhancement for dust-sand storm images. In International Conference on Multimedia Modeling. Springer, 842–849.
- Wang et al. (2019) Nan Wang, Yabin Zhou, Fenglei Han, Haitao Zhu, and Jingzheng Yao. 2019. UWGAN: underwater GAN for real-world underwater color restoration and dehazing. arXiv preprint arXiv:1912.10269 (2019).
- Wang et al. (2004) Zhou Wang, Alan C Bovik, Hamid R Sheikh, and Eero P Simoncelli. 2004. Image quality assessment: from error visibility to structural similarity. IEEE transactions on image processing 13, 4 (2004), 600–612.
- Xu et al. (2020) Guanlei Xu, Xiaotong Wang, and Xiaogang Xu. 2020. Single image enhancement in sandstorm weather via tensor least square. IEEE CAA J. Autom. Sinica 7, 6 (2020), 1649–1661.
- Yasarla et al. (2020) Rajeev Yasarla, Vishwanath A Sindagi, and Vishal M Patel. 2020. Syn2Real transfer learning for image deraining using Gaussian processes. In Proceedings of the IEEE/CVF conference on computer vision and pattern recognition. 2726–2736.
- Yu et al. (2016) Shunyuan Yu, Hong Zhu, Jing Wang, Zhengfang Fu, Shan Xue, and Hua Shi. 2016. Single sand-dust image restoration using information loss constraint. Journal of Modern Optics 63, 21 (2016), 2121–2130.
- Zhang and Patel (2018) He Zhang and Vishal M Patel. 2018. Density-aware single image de-raining using a multi-stream dense network. In Proceedings of the IEEE conference on computer vision and pattern recognition. 695–704.
- Zhang et al. (2020) Jing Zhang, Yang Cao, Zheng-Jun Zha, and Dacheng Tao. 2020. Nighttime dehazing with a synthetic benchmark. In Proceedings of the 28th ACM International Conference on Multimedia. 2355–2363.
- Zhang et al. (2011) Lin Zhang, Lei Zhang, Xuanqin Mou, and David Zhang. 2011. FSIM: A feature similarity index for image quality assessment. IEEE transactions on Image Processing 20, 8 (2011), 2378–2386.
- Zhi et al. (2016) Ning Zhi, Shanjun Mao, and Mei Li. 2016. Visibility restoration algorithm of dust-degraded images(in Chinese). Journal of Image and Graphics 21, 12 (2016), 1585–1592.
- Zhu et al. (2017) Jun-Yan Zhu, Taesung Park, Phillip Isola, and Alexei A Efros. 2017. Unpaired image-to-image translation using cycle-consistent adversarial networks. In Proceedings of the IEEE international conference on computer vision. 2223–2232.