AFL: Non-intrusive Feedback-driven Fuzzing for Microcontroller Firmware
Abstract.
Fuzzing is one of the most effective approaches to finding software flaws. However, applying it to microcontroller firmware incurs many challenges. For example, rehosting-based solutions cannot accurately model peripheral behaviors and thus cannot be used to fuzz the corresponding driver code. In this work, we present AFL, a hardware-in-the-loop approach to fuzzing microcontroller firmware. It leverages debugging tools in existing embedded system development to construct an AFL-compatible fuzzing framework. Specifically, we use the debug dongle to bridge the fuzzing environment on the PC and the target firmware on the microcontroller device. To collect code coverage information without costly code instrumentation, AFL relies on the ARM ETM hardware debugging feature, which transparently collects the instruction trace and streams the results to the PC. However, the raw ETM data is obscure and needs enormous computing resources to recover the actual instruction flow. We therefore propose an alternative representation of code coverage, which retains the same path sensitivity as the original AFL algorithm, but can directly work on the raw ETM data without matching them with disassembled instructions. To further reduce the workload, we use the DWT hardware feature to selectively collect runtime information of interest. We evaluated AFL on two real evaluation boards from two major vendors: NXP and STMicroelectronics. With our prototype, we discovered ten zero-day bugs in the driver code shipped with the SDK of STMicroelectronics and three zero-day bugs in the SDK of NXP. Eight CVEs have been allocated for them. Considering the wide adoption of vendor SDKs in real products, our results are alarming.
1. Introduction
Internet-of-Things (IoT) has become an integral part of our digital lives. For example, many people install smart thermostats to remotely control the temperature and humidity of their homes. Smart alarm systems are used to monitor home and workplace and raise alarms when detecting burglars. Fitness trackers and smart health bands are also widely used to continuously monitor personal health data such as heart rate and blood oxygen level. The key component of many IoT devices is the microcontroller unit (MCU), which is a tiny, custom-built, and cost-efficient system-on-chip (SoC) (MarketWatch, Inc, 2022).
The rapid evolution of the MCU ecosystem, on the one hand, has made our lives easier and more convenient than ever before, on the other hand, it also introduces a large number of vulnerable MCU products in the wild. For example, several high-profile vulnerabilities have been reported recently for the ESP8266 and ESP32 communication and WiFi co-processors, which have been adopted in millions of IoT devices. These vulnerabilities (e.g., EAP client crash, zero PMK installation and beacon frame crash (ONE Tech, 2020)) allow the adversaries to hijack or crash the session of ESP32/ESP8266 products. Meanwhile, vulnerabilities of the FreeRTOS TCP/IP stack can be used to launch remote code execution and steal private information (ZIMPERIUM, 2018a, b). More recently, BadAlloc (AZ Defender team, 2021) leaves a large number of IoT devices exposed to adversaries. The compromise of an MCU product may lead to serious consequences such as privacy leakage, financial loss, or even human injury and death. To prevent or mitigate such attacks, extensive security testing during the development phase is imperative.
| Basic Method | Solutions |
|
|
|
|
|
||||||||||
|---|---|---|---|---|---|---|---|---|---|---|---|---|---|---|---|---|
| Rehosting | HALucinator (Clements et al., 2020), P2IM (Feng et al., 2020), Emu (Zhou et al., 2021), etc. | ✓ | ✗ | ✓ | N | N | ||||||||||
| Porting | Para-rehosting (Wenqiang Li, Le Guan, Jingqiang Lin, Jiameng Shi and Fengjun Li, 2021) | ✓ | ✗ | ✓ | Y | N | ||||||||||
| Forwarding Hardware Interactions | Avatar (Zaddach et al., 2014), Avatar2 (Muench et al., 2018), SURROGATES (Koscher et al., 2015), Inception (Corteggiani et al., 2018), etc. | ✓ | ✗∗ | ✗∗ | N | Y | ||||||||||
| Fully On-device Execution | AFL (proposed) | ✓ | ✓ | ✓ | N | Y |
However, existing firmware security testing approaches demonstrate their own limitations when applied to embedded firmware testing (see Table 1 for an overview of the issues). For example, the emulation-based rehosting technique with application to firmware analysis has been extensively studied in recent years (Clements et al., 2020; Feng et al., 2020; Mera et al., 2021; Zhou et al., 2021; Johnson et al., 2021; Gustafson et al., 2019; Cao et al., 2020), but accurately modeling the behavior of diverse peripherals remains the main research challenge. Several approaches such as P2IM (Feng et al., 2020), DICE (Mera et al., 2021), Laelaps (Cao et al., 2020), PRETENDER (Gustafson et al., 2019), Emu (Zhou et al., 2021), and Jetset (Johnson et al., 2021) propose to learn an approximate peripheral model using the symbolic execution, access-pattern matching, and machine learning techniques. However, the learned models are inaccurate in general. With inaccurate models, such rehosting approaches cannot boot firmware with complex peripherals such as USB. When the execution trace is not exactly the same as that on the real device, even though the firmware can be “successfully” booted, it is inadequate for many security analysis tasks. The emulation-based rehosting technique is typically used to test hardware-independent code after the target firmware has passed through the booting process.
Another direction is to leverage the hardware abstraction layer (HAL) available in MCU firmware to avoid modeling peripherals. For example, HALucinator (Clements et al., 2020) automatically detects HAL libraries and replaces them with host implementations. Para-rehosting (Wenqiang Li, Le Guan, Jingqiang Lin, Jiameng Shi and Fengjun Li, 2021) provides common HAL backend implementations to help port MCU firmware to native hosts. However, both approaches cannot test the peripheral driver which never runs.
Finally, some hardware-in-the-loop (HITL) solutions run the firmware in the QEMU emulator while forwarding peripheral I/O operations to real devices (Zaddach et al., 2014; Muench et al., 2018; Koscher et al., 2015; Corteggiani et al., 2018). Although high fidelity is preserved, these HITL-based approaches require frequent and expensive switching (and syncing) between QEMU and hardware, incurring significant performance overhead. For example, the emulation speed is in the order of tens of instructions per second when frequent hardware interaction is needed (Zaddach et al., 2014). As a result, these approaches are typically used to analyze hardware independent code after the firmware is fully booted with the help of the forwarding mechanism. To the best of our knowledge, none of the existing HITL work supports firmware fuzzing.
In this work, we propose a new fuzzing solution called micro-AFL (AFL), which is specifically designed for ARM-based MCU devices, to assist developers in locating potential software bugs in the firmware. While our approach can cover the entire software stack, in this paper we focus on its use in testing the low-layer code such as peripheral drivers, which we believe is not properly supported by the existing work. By running the target firmware directly on the target device, our approach supports full-stack testing with high fidelity. AFL requires developers to have access to the prototype development boards and JTAG- or SWD-based debug dongles, which are essential hardware tools available and used in virtually every embedded system development environment.
AFL is designed to be modularized and extensible so that existing mature fuzzers can be directly integrated (e.g., we adopt AFL (Zalewski, 2010) in our prototype implementation but any other fuzzers can be used as a drop-in replacement). To achieve this goal, (i) AFL decouples the execution engine from the rest of a fuzzer (collectively called fuzzing manager in this paper). Specifically, we run the target firmware on the real hardware, and run the fuzzing manager on the PC that coordinates the fuzzing process with the help of the debug dongle. The execution information is also streamed to the fuzzing manager where the analysis is conducted. In this way, we keep the fuzzing manager on the PC agnostic to the execution engine. (ii) To enable communication between the development board and the PC, we re-purpose the debug dongles, which have the highest level of control to the board. Therefore, AFL can efficiently and effectively feed the testcases over the board, pull the run-time execution status, and start/suspend/stop the target. (iii) Finally, to collect code coverage information of each testcase, which is essential for grey-box feedback-driven fuzzers, AFL leverages a hardware feature called Embedded Trace Macrocell (ETM) (ARM, 2011b) that transparently generates the instruction trace. The trace is streamed directly to the PC via five additional pinouts (four for data and one for clock). Although ETM incurs additional cost, we adopt it in this work for two reasons. First, it enables transparent trace collection. In other words, no code instrumentation is required. This feature makes our work free from rewriting the binary, since most of the third-party libraries are distributed as stripped binaries and no robust binary rewriting tool is available to facilitate instrumentation-based trace collection. Second, we argue that prototype development boards with ETM pinouts are only needed in the development phase. After the firmware has been fully tested, the released products do not need to be equipped with these features. This small investment at the development stage yields a good return on investment (ROI) for manufacturers in the long term, considering the expensive recalls that may happen later.
AFL features two key components: online trace collector and offline trace analyzer. They collect ETM data on the device and parse the results on the PC respectively. When a testcase is available on PC (generated by AFL), AFL sends it into a reserved memory on the board via the debug dongle. At the point where the testcase is consumed for the first time, the online trace collector activates ETM to collect the instruction trace, and streams the data to the PC. While collecting the ETM stream, the online trace collector also applies configurable filters via the Data Watchpoint and Trace (DWT) unit (ARM, 2010) to suppress unnecessary ETM packet generation. This not only reduces the amount of tracing data for transmission, but also avoids analyzing useless packets on PC.
The offline trace analyzer runs on the PC and processes the raw ETM data. The result is provided to AFL to maintain the bitmap of code coverage. Decoding the raw ETM data to get the branch information is expensive since it needs to disassemble the firmware and align the instructions with the raw trace (Ge et al., 2017) (see RQ1 in Section 4). We address this problem by using a kind of special basic block generated at runtime. This allows us to directly use the raw ETM data without disassembling, but still retains path-sensitivity needed to calculate code coverage. The offline trace analyzer also uses a software based approach to filter out uninteresting ETM packets that cannot be filtered by the online trace collector.
We have implemented a prototype of AFL using the SEGGER MCU debugging solution (SEGGER Microcontroller, 2022a). Then, we used the prototype to test SDKs from two major MCU chip vendors, i.e., NXP Semiconductors (NXP Semiconductors, 2021b) and STMicroelectronics (STMicroelectronics, 2021). In particular, we used the USB driver fuzzing as a case study in our evaluation. At the time of writing, we have uncovered 13 bugs residing in the USB drivers that were not known previously. All of them have been confirmed by the vendors and the patches have been released or scheduled with the newest SDK releases.
In summary, our contributions are three-fold:
-
•
We propose AFL, the first fuzzing tool that is applicable to the driver code of MCU firmware. AFL decouples the execution engine from the fuzzing manager so that existing fuzzing tools can be easily integrated.
-
•
We propose using ARM ETM for non-intrusive feedback collection. To improve performance, AFL adopts Linear Code Sequence And Jump (LCSAJ) analysis to directly process raw ETM data without expensive disassembling.
-
•
We have implemented and evaluated our prototype against two SDKs from major MCU chip vendors. We used the USB driver as a case study to show how our prototype can fuzz real-world driver code. The tool has helped us find 13 previously unknown bugs with 8 CVEs allocations.
The source code and the firmware samples used in the evaluation are available at https://github.com/MCUSec/microAFL for future research on this topic.
2. Background
2.1. American Fuzzy Lop (AFL)
Fuzz testing is an automated testing technique used to discover coding errors and security vulnerabilities in software. It involves inputting abnormal testcases to the software-under-test in an attempt to make it crash. American Fuzzy Lop (AFL) (Michal Zalewski, 2021) is one of the most successful fuzzing tools. We roughly split it into two main components for easy presentation: an execution engine and a fuzzing manager. While the former is responsible for running a testcase with the target program, the latter is responsible for generating new testcases by mutation based on a genetic algorithm, coordinating the execution, analyzing the execution information, etc. Concretely, AFL first instruments the target program so when the program is executed, the branch information can be generated and recorded. The fuzzing manager then forks a new process as the execution engine to run the program with the current testcase. During execution, the instrumented target program consumes the testcase and records the collected branch coverage information into a local bitmap. The fuzzing manager also aggregates all the local bitmaps into a global bitmap, and compares the newly generated local bitmap to the global one to decide if a new path has been discovered. A testcase that can increase branch coverage is considered interesting and will be used in the genetic algorithm to calculate the subsequent testcases. To report a bug, the fuzzing manager monitors the execution status of the target program and leverages crash information as indicators.
2.2. Analysis of MCU Firmware
MCU is a special-purpose System-on-Chip that cares about real-time processing capability, low power consumption and costs. They are widely used in different application fields, such as wearable, smart home, industrial automation, etc. The execution environment of MCU firmware is significantly different from the traditional OSs, making many existing binary analysis tools including AFL inapplicable.
Unlike traditional software which assumes an OS layer that provides an abstract view of hardware, MCU firmware runs on bare metal or only includes an OS library (e.g., RTOS) for simple multi-task management. Therefore, it compiles the driver code of peripherals and the application code together to form a single-address-space program. The peripheral I/O operation is performed by accessing the memory-mapped registers. Due to the diversity of peripherals, dynamic analysis of MCU firmware is extremely challenging. Although the rehosting technique has made some breakthroughs to test the hardware-independent part of the firmware (Clements et al., 2020; Feng et al., 2020; Mera et al., 2021; Zhou et al., 2021; Johnson et al., 2021; Gustafson et al., 2019; Cao et al., 2020; Wenqiang Li, Le Guan, Jingqiang Lin, Jiameng Shi and Fengjun Li, 2021), no existing work can test the driver code.
2.3. Hardware-Supported Instruction Trace Collection
Program instruction trace is helpful in many program analysis applications, such as performance profiling (Milenkovic et al., 2008; Bhansali et al., 2006), fuzz testing (Chen et al., 2019), control flow integrity enforcement (Ge et al., 2017), root cause analysis (Cui et al., 2018; Du et al., 2020), debugging (Ning and Zhang, 2017), etc. Compared with software instrumentation, modern processors support capturing the instruction traces by hardware components to reduce the overhead. For instance, Intel incorporates its hardware instruction trace feature, known as Processor Trace or PT (Intel, 2016) to all its Core processors starting from Broadwell. The counterpart of ARM is called Embedded Trace Macrocell (ETM) (ARM, 2007) or Program Trace Macrocell (PTM) (Lee et al., 2017)111ETM and PTM are similar techniques for different Arm processor lines. We use ETM to refer to both in this paper.. These implementations are quite similar to each other. Both are designed to efficiently rebuild the whole instruction trace assuming that the corresponding machine code is available. More specifically, a dedicated hardware component emits a stream of control flow packets. Then a decoder is used to reconstruct a unique execution path by matching the control flow data to the disassembled machine code.
2.3.1. Trace Collecting
ARM MCUs can optionally implement a buffer for trace storage on the chip, termed Embedded Trace Buffer (ETB). However, based on our study, ETB is rarely supported on real chips. Alternatively, ARM also supports streaming the trace data to an external debugger via a physical parallel port, called Cortex Debug+ETM connector (ARM, 2011a). This is the solution used by AFL.
2.3.2. Instruction Flow Reconstruction
To reconstruct the execution flow, a decoder is needed to interpret the trace packets and align them with the disassembled instructions. Control flow packets carry information about a) whether a conditional branch is taken or not b) the target of an indirect branch c) asynchronous events such as exceptions.
Conditional Branches.
ARM ETM uses one bit in the P-header packet to encode whether the condition of an instruction is true (encoded as E or 1) or false (encoded as N or 0). True means the corresponding instruction is executed. The reason for this design is that in ARM, almost all instructions can be conditionally executed. Taking the addeq instruction as an example, the add operation is conducted only if the Z flag is set. When this instruction is a branching instruction, such as beq, E indicates that the branch is taken whereas N indicates the branch is not taken.
Indirect Branches.
The indirect branch includes indirect calls and function returns. Since the target of an indirect branch can only be determined at run time, ARM ETM emits a packet containing the target address when an indirect branch happens. Such information is encoded into a branch packet.
Asynchronous Events.
An asynchronous exception could change the control flow at any execution point. Since the current execution location can already be recovered by the P-headers, the branch source information is unneeded. In particular, the branch source is calculated by adding the length of executed instructions from the last branch (determined by P-headers) to the base address of the last branch target (determined by the previous branch packet). ETM encodes asynchronous events using existing branch packets, but extends them with supplementary information. For example, it can indicate whether this branch is caused by an exception rather than a normal call instruction. It also indicates the corresponding exception number if this is an exception. Moreover, ARM MCUs re-purpose existing instructions for exception returns. Put simply, if an instruction results in a control flow transfer of a set of predefined values (EXC_RETURN), then this is treated as a return from exception and the hardware is responsible for fetching the correct target instruction pointer from the exception stack. ETM further emits a return from exception packet to encode such an event. With this mechanism, exception entries and returns can be properly paired.
Direct Branches.
With the aforementioned information, the decoder can already recover the whole execution flow by aligning the trace data with the disassembled instructions. Note that the trace information about the direct branches is not needed, since the target of a direct branch could be determined by checking the corresponding branch instruction. However, ETM optionally supports emitting branch packets for direct branches, making it easier to recover the instruction flow at direct branches.
2.3.3. Trace Filtering
It is generally unnecessary to collect the entire instruction trace over time because an analyst might be only interested in a particular code region. Trace filtering allows for suspending trace collection under certain conditions. ARM ETM supports event-based filtering. It defines a set of ETM event resources that become active when the corresponding event occurs. These events can be configured by different comparators provided by the hardware. When there is a match, the corresponding event becomes active. For example, when the instruction pointer matches the value in an address comparator, the corresponding event resource is active.
The trace generation is controlled in three ways. First, when an event is active, it can directly enable tracing. When it is inactive, the tracing is disabled. Second, a code region can be included or excluded from tracing. This is achieved by setting a pair of address comparators. Finally, it can be controlled by the trace start/stop block. If an event happens, tracing is started. The tracing does not stop until the block receives a stop signal, which is specified by another event resource. Unfortunately, only the last method is supported by ARM MCUs (ARM, 2007). Worse, the comparator resources, which are provided by the DWT unit, are very limited. This poses a significant challenge for us to effectively filter the execution trace we care about.
3. AFL Design
In this section, we begin with an overview of the AFL architecture, and then delve into the detailed design of two critical components, the online trace collector and the offline trace analyzer, as well as their interaction with the AFL framework.
3.1. Overview
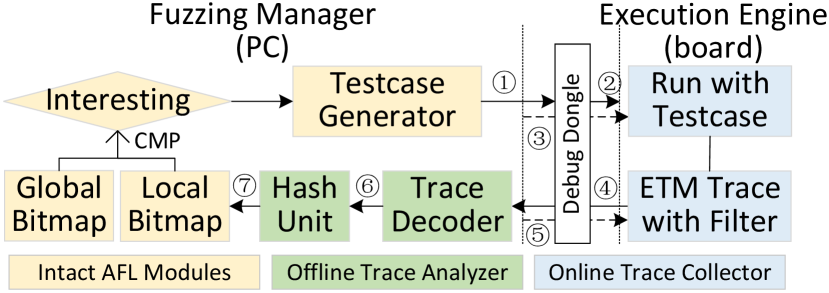
AFL is a new fuzzing tool designed for MCU firmware, with a focus on peripheral driver code. The fundamental idea is to inherit the sophisticated genetic algorithm of AFL while replacing its process-based execution engine with two critical components, an online trace collector and an offline trace analyzer, as shown in Figure 1. This design enables AFL to test all the code in firmware, including peripheral drivers and closed source libraries.
As illustrated in Figure 1, the host PC and target board communicate via a debug dongle, a must-have tool for embedded system development. To begin with, the host PC feeds the testcase via the debug dongle into a reserved memory on the target board (①) and directs the target to begin execution (②). Once the target firmware has reached the point where testcase is firstly consumed, the host PC sends the command to activate the ETM function (③). Then, while the firmware is executing, the generated instruction trace is synchronously streamed to the host PC via the debug dongle (④). After completing one round of execution, the host PC sends another command to deactivate ETM (⑤). The collected trace information is then used to reconstruct the execution paths. AFL adopts a novel scheme for representing branch edges (⑥). The final result is mapped into the bitmap to determine whether a new path has been discovered and guide the generation of new testcases following the same genetic algorithm of AFL (⑦).
3.2. Low-level Device Control and Fuzzing Scheduling
We use the JTAG or SWD interface for low-level control of the target device. Through these interfaces, the debug dongle can directly access the processor registers and the device memory (including the memory-mapped system configuration registers) via the Debug Access Port (ARM, 2021b). It also gives us the lowest control over the target device. This is important because fuzzing often causes the target device to enter a non-responsive state. If this happens, we can force a reset via the low-level JTAG/SWD command without human involvement.
We also need to send testcases to the target device. Depending on the generation algorithm, the size of a testcase can be as large as several megabytes. We leverage the SEGGER RTT (real time transfer) protocol (SEGGER, 2021) for high-speed transmission. Under the hood, RTT uses AHB-AP (Advanced High-performance Bus - Access Port) (ARM, 2021a) to access memory in the background. Not only can it provide enough bandwidth, but also enables parallel scheduling. Specifically, we transmit the subsequent testcase in the background while the target is running against the current testcase. Moreover, we conduct the analysis of the previous testcase on PC in parallel with the target execution. By scheduling all the tasks in a pipeline, AFL achieves optimized performance.
3.3. Online Trace Collector
The online trace collector is responsible for collecting the ETM instruction trace during the firmware execution. It needs to solve two major challenges: 1) how to feed testcases to the target board from PC, 2) how to selectively collect a minimal but sufficient instruction trace of interesting code snippets.
3.3.1. Testcase Feeding
We reserve two fixed arrays to hold testcases, one for the current test and the other for the subsequent test, which is transmitted in the background during the current test to improve parallelism. The communication channel being used is SEGGER RTT as mentioned before. These arrays are declared in a noinit section so that the libc constructors will not interfere with them during initialization. The size of arrays can be configured as needed.
3.3.2. Trace Collection and Filtering
To collect the execution trace, we can instrument the firmware so that each basic block transition can be recorded and streamed to the PC. However, two challenges need to be addressed. a) The instrumentation requires additional memory space and computing resources that resource-restricted MCU chips may not afford b) The current binary rewriting techniques still face some fundamental technical issues (e.g., current disassemblers cannot disambiguate between references and literal values precisely), especially when the target binary is stripped.
To tackle this problem, AFL leverages the ETM hardware feature to generate the instruction trace. The collection is transparent to the firmware. Therefore, no software instrumentation is needed and no additional overhead is incurred. By default, ETM collects all the branch information which is sufficient to recover the full instruction trace of a testcase. However, based on our experiments, this is sub-optimal (see RQ2 in Section 4). In particular, lots of irrelevant packets have to be transmitted and analyzed. For example, the booting process of an MCU is fixed and never influenced by a testcase. We can safely avoid collecting ETM data during device booting to save resources. Moreover, even if we have the abundant resources to do so, the irrelevant packets add noises to the fuzzer that cannot be easily removed. For example, some MCU firmware is multi-tasked. Collecting all the trace information means all the tasks are traced. This brings about non-determinism that leads to a different trace at each run even if the testcase is the same.
We use the DWT hardware feature to filter out irrelevant ETM packets. However, in ARM MCUs, DWT only implements a limited number of comparators (four in a typical implementation) that can be used as filters. We have to prioritize its usage to maximally reduce irrelevant packets. Based on the ETM triggering methods mentioned in Section 2.3.3, we design two kinds of online filters, namely address-based filter and event-based filter. When an MCU has more comparator resources, these filters can be combined to generate more fine-grained traces.
Address-based Filter.
This filter allows analysts to specify a continuous code region to be traced. It works the best when we are interested in a particular library. This mode consumes two comparators to configure the region start and end.
Event-based Filter.
AFL also supports event-based filters in which certain events trigger the on/off switch of ETM. The event can be either executing an instruction in a particular memory range or reading/writing a particular value from/to a particular address. Both consume two comparators. We call the former instruction trigger and the latter data trigger.
The instruction trigger is very useful in skipping the device booting process. We use the code snippet in Listing 1 as an example. Lines 4-7 are part of device booting and they have nothing to do with the testcase. Line 12 is the main logic of the firmware, which is put in an infinite loop. This is the paradigm in MCU programming – the main operation is executed constantly to sense environmental data and process them accordingly in a loop. We tame the code by adding three lines (9, 13, 14). Note although AFL does not require the source code of the target library, the source code that invokes the target library is needed to make it easy to tame the fuzzing process. fuzz_stop is a flag that marks whether the fuzzing should stop. It can be changed by the firmware when the testcase has been used up or by the debug dongle asynchronously. By configuring the instruction address at line 9 to start ETM and configuring the instruction address at line 14 to stop ETM, AFL can effectively focus on the main logic of the firmware.
The data trigger provides fine-grained tracing capability, which we leverage to trace a specified task. More specifically, in the multi-task environment, we use the data trigger mode to filter out the execution trace of other tasks and the OS kernel, such as interrupt handlers and scheduling, which is considered as noise to the fuzzer. We observe that in the RTOS environment, each task has its task control block (TCB) in a fixed location regardless of the testcase being used. Therefore we can configure DWT to turn on ETM when the global pointer that points to the TCB of the current task (e.g., pxCurrentTCB in FreeRTOS) is written with the TCB address of the target task. When any other value is written to that pointer, indicating the target task is swapped out, ETM is turned off.
3.4. Offline Trace Analyzer
For each testcase execution, the offline trace analyzer processes the ETM packets from the target device. It first recovers the branch information without decoding the raw ETM data. This is achieved using a kind of special basic block. Then, the branch information derived from the basic block transitions is used to update the bitmap of code coverage maintained by AFL. All the other AFL components are intact, including the new path identification module, the genetic algorithm to generate new testcases, etc.
3.4.1. Calculating Branch Information without Decoding ETM
AFL uses the branch (edge) coverage information to identify novel execution paths. To capture branch information, AFL (in QEMU mode) dynamically captures basic block transitions and uses the address of basic blocks to populate the bitmap following the code below (Michal Zalewski, 2021).
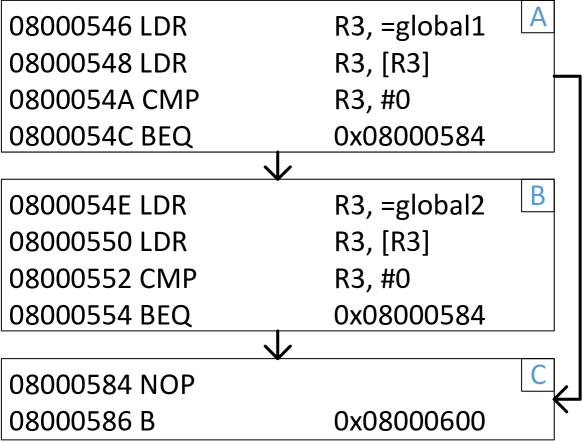
In Listing 2, shared_mem refers to the local bitmap of the current testcase and block_address is the address of the current basic block. In line 1, block_address is fed to a simple hash function to get a random identification of the current basic block, denoted as cur_location. For the path shown in Figure 2, the basic block transition sequence is , and for the path , the basic block transition sequence is . Following the code shown above, these two paths generate two different bitmaps, which AFL can leverage in finding interesting testcases.
Using ETM trace, we can recover the same branch coverage information. Concretely, by walking along the disassembled instruction sequence and aligning it with decoded ETM packets, we can recover the whole instruction trace and further rebuild the same branch information as AFL. However, this incurs non-trivial overhead according to the literature (Ge et al., 2017) and it is also verified by our experiments (see Section 4.1).
To avoid expensive code disassembling and ETM decoding, we propose a novel mechanism to capture branch coverage information directly using the raw ETM packets. A straightforward idea is to use the target address of every ETM branch packet as the start of each basic block. However, it cannot differentiate the two paths in Figure 2, because the conditional branches at addresses and do not generate any branch packet no matter the branch is taken or not. Fortunately, we found in the ETM manual (ARM, 2007) that this behavior can be overridden by setting the eighth bit of the ETMCR register. In particular, with this option enabled, ETM will generate branch packets for direct branches that are actually taken. Therefore, the path would emit a sequence of ETM packets (), while the path would emit a sequence of ETM packets (). Here, is a bit in the P-header which means the condition of an instruction is true while means the opposite, as mentioned in Section 2.3.2. As can be seen, the latter path directly jumps from the basic block to since the branch condition at address is true. A branch packet with target is thus emitted following the bit. On the contrary, for the former, the branch condition at address is false and therefore no branch packet is generated there. However, the branch condition at address is true, which leads to a branch packet with target . By comparing the two ETM traces, it is obvious that we can differentiate the two paths since the P-header bits in between the two branch targets are different.
To explain the branch coverage information AFL captures, we first explain a kind of special basic block generated with linear code sequence and jump (LCSAJ) analysis (Yates and Malevris, 1995). We call it LCSAJ_BB. A LCSAJ_BB is an instruction sequence starting from the last taken branch target and ending with the following branch instruction which is actually taken. Under this definition, the basic block A alone is a LCSAJ_BB in the path , while in path , the basic block A concatenated with basic block B constitutes a LCSAJ_BB since the branch at the end of is not taken. In AFL, we represent a LCSAJ_BB by combining the base address obtained from the previous branch target and the P-header bitstream before the next LCSAJ_BB, formally donated as . For example, the LCSAJ_BB for in path is encoded as (, 1111), while the LCSAJ_BB for in path is encoded as (, 11101111). Note this information can be obtained without referring to the assembly code. In Section 3.4.2, we explain how to use LCSAJ_BB transitions to calculate branch coverage to bridge with AFL. It is worth noting that our approach does not generate the same bitmap as AFL does. However, it achieves the same path sensitivity since any change in basic block transitions will be reflected on the change in the corresponding LCSAJ_BB (either or ).
Nondeterminism.
Although the online trace collector can already filter out a substantial amount of relevant ETM packets, limited by the hardware, it still emits many noisy packets. For example, there is no mechanism to suppress the tracing of exception handlers, which happen non-deterministically. This will add instability to the fuzzer because the same testcase would generate different execution traces in different runs. To address the issue, AFL also provides an offline exception filter. Specifically, we leverage the exception information embedded in the ETM branch packets to figure out the exception entry points and exit points. The analyst can choose whether or not to discard the ETM trace generated during the handler execution. Again, no disassembling is needed in this process.
3.4.2. Mapping Branch Information to the Bitmap
In this section, we explain how to map LCSAJ_BB-based branch information to the bitmap maintained by AFL. Following the AFL design shown in Listing 2, our goal is to transform a LCSAJ_BB denoted by into a unique number, which will be used to replace of role of cur_location (unique identification for the basic block) in Listing 2. To sufficiently diffuse the information contained in each LCSAJ_BB, we adopt a lightweight hash algorithm based on MurMurHash (Austin Appleby, 2011). The output is a random integer . As mentioned before, the whole algorithm replaces line 1 of Listing 2. We split the bitstream into chunks of 5-bits and apply bit-wise XOR on them, yielding a number ranging from 0 to 31 (i.e., FoldAndXor()). Then, is used to mix with and shift . The result is further split into two parts and mixed with some magic numbers. While this design is ad-hoc, it effectively randomizes the encoded LCSAJ_BBs such that the resulting does not incur too many collisions on the AFL bitmap based on our evaluation.
MAP_SIZE length of bitmap in bytes
3.5. Crash/Hang Detection
AFL relies on the built-in exception handling mechanism to detect abnormal firmware behaviors. Specifically, we use the vector catching feature (ARM, 2020) to mark the exceptions in concerns, such as Hard Fault, Mem Manage, Bus Fault, Usage Fault, etc. These exceptions indicate critical system errors and thus can be used as crash signals. With vector catching, when such an exception happens, instead of trapping to the corresponding handlers, the chip enters debug state which can be automatically captured by the debug dongle. Then, AFL further checks the Fault Status Registers and Fault Address Registers to examine the root cause. To notify the fuzzing manager of a successful execution, at the end of the tested code, we place a BKPT instruction with a magic number as the argument. If the current test terminates correctly, the execution will enter debug state at this BKPT instruction. We further check the value of the argument to confirm a successful execution. Lastly, if the fuzzing manager does not capture any debug state in a specified amount of time (we use two seconds as an empirical value), a hang is marked.
4. Implementation and Evaluation
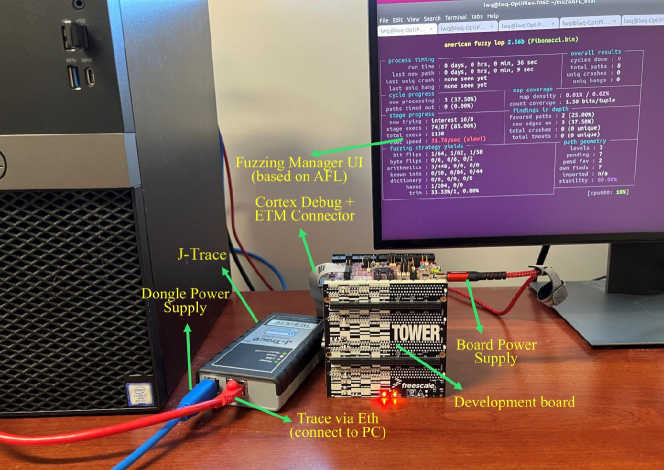
We have implemented a prototype of AFL on top of AFL2.56 (Zalewski, 2010) by adding 2,000 lines of C code on the PC side. We used the SEGGER J-Trace Pro debug dongle (SEGGER Microcontroller, 2022b) to control the communication between the host PC and the target ARM Cortex-M evaluation boards. The control logic was implemented on the PC side using the SDK provided by SEGGER (SEGGER Microcontroller, 2022a). In Figure 3, we show the setup in which we used our prototype to fuzz a firmware sample for the NXP TWR-K64F120M evaluation board. The key components are annotated corresponding to the architecture diagram in Figure 1.
We evaluated the performance of our AFL prototype to answer five research questions. The answers are expected to demonstrate the unique strengths of AFL and its effectiveness as a new fuzzing solution for embedded firmware testing.
-
RQ1:
Does the LCSAJ_BB-based approach that directly processes raw ETM trace improve performance compared to approaches that fully recover the instruction flow?
-
RQ2:
Do online filters help to improve the performance of AFL?
-
RQ3:
How much overhead does AFL introduce to (each sub-process of) a single round of fuzzing?
-
RQ4:
What is the overall performance of AFL and how is it compared with existing work?
-
RQ5:
How effective is AFL in locating bugs in the peripheral drivers of real-world firmware?
Experiment Settings.
The PC running the fuzzing manager is equipped with an Intel Core i7-8700 CPU@3.2GHz and 8 GB DDR4 RAM and SSD storage. We used the NXP TWR-K64F120M evaluation board as the execution engine and its corresponding SDKs for the performance experiments from RQ1 to RQ4. To answer RQ5, we present a detailed case study about the real-world bugs that we found after a long-term fuzzing on the evaluation boards NXP TWR-K64F120M and STM32H7B3I-EVAL and towards various projects in their corresponding SDKs. Both boards have ETM pinouts available.
Firmware Samples Used in Evaluation.
For RQ1 to RQ4, we used the sample code provided in the NXP SDK. First, the sample Fibonacci implements a recursive function that calculates Fibonacci(1,000,000). This sample does not involve any peripheral and serves as the baseline in our evaluation. Second, the sample I2C involves the usage of a simple peripheral I2C. It merely communicates with the PC over the I2C bus. Third, the sample UART involves the usages of UART, which also communicates with the PC. Forth, the sample USB uses the evaluation board as the USB host to access a USB disk formatted as the FAT file system. Fifth, the sample SD Card recognizes and initializes a micro SD card inserted into the on-board SD card slot. Sixth, the sample Enet uses Ethernet to communicate with the PC over IPv4. Finally, the sample MMCAU uses the hardware Crypto Acceleration Unit (CAU) (NXP Semiconductors, 2021a) to complete cryptography operations such as AES, DES3, SHA, etc. Note the library of CAU is closed source. We list the firmware information including the size and the number of basic blocks in Listing 2. For RQ5, we used the sample code provided in the NXP SDK and STM32 SDK. While we tested multiple drivers in both SDKs, we specifically chose USB as a case study to demonstrate the capability of AFL in finding bugs in complex peripherals. The application-level logic of all the samples is very simple, because we do not attempt to find bugs at high-level code. Rather, we make sure that the core peripheral functions are included in the sample, with the goal to feed abnormal inputs to the low-level driver code to trigger bugs.
[t] Sample BB# Size (bytes) Dis&Dec* AFL w/o Filter AFL Fibonacci 9,927 12,064 100,830 33,386 104,394 I2C 13,343 14,888 112,666 27,732 116,487 UART 9,899 12,856 37,003 21,087 50,571 USB 36,431 40,024 465 2,211 2,236 SD Card 21,104 25,328 592 2,207 2,335 Enet 14,475 18,504 685 1,089 1,116 MMCAU 12,186 17,712 58,155 26,393 74,830 * Fully disassemble firmware and decode ETM data. The same filtering mechanism was applied as AFL.
4.1. Overhead of Fully Recovering Instruction Flow
As discussed in Section 3.4.1, AFL reduces processing overhead by avoiding disassembling the firmware and aligning the ETM trace to recover the full instruction flow. In this section, we demonstrate how using the LCSAJ_BB-based approach can reduce performance overhead on PC. In the implementation of the base line approach (fully disassembling firmware and decoding ETM data), we used the popular disassembly framework, Capstone (Nguyen Anh Quynh, 2021). We followed the firmware execution by aligning the collected ETM packets with disassembled instructions. Whenever a new basic block was met, we disassembled the whole basic block at once, which was also cached for future use. After recovering the instruction trace, we followed Listing 2 to populate the bitmap. It is worth mentioning that we applied the same filtering strategy as AFL to ensure a fair comparison. We measured the total number of executions for each sample in one hour. The results are shown in column 4 of Table 2. Compared with the performance of AFL (column 6), we confirm that AFL is generally much faster than the disassembly-based approach. We observed 1.03x - 4.81x improvement on average.
4.2. Filter Performance
To answer RQ2, we disabled the proposed online filters and compared the performance of AFL with and without filters. As before, we recorded the number of executions within one hour. The results are shown in columns 6 and 5 of Table 2 respectively. First, we can see that online filters improve the performance of AFL in general in all samples that we have tested. For very large samples (e.g., the Enet, USB and SD Card), the filter improves the performance of AFL slightly. However, for less complex samples such as the MMCAU, the improvement becomes very significant. This is because without filters, ETM needs to collect the entire instruction trace beginning from ResetISR to the end of each run, which not only increases the burden of the debug dongle in transferring the raw trace, but also requires more time for the offline decoder to decode and map them into the bitmap. For larger samples, since the execution time is longer for each run, the overhead can be amortized in the entire execution.
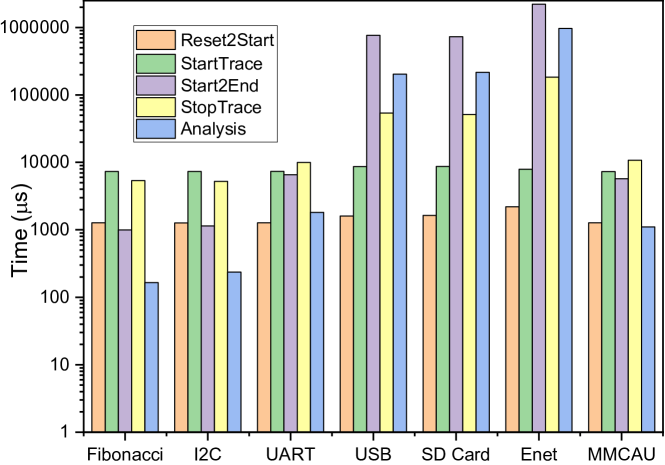
4.3. Overhead Breakdown
Each fuzzing round consists of five sub-processes. (1) Reset2Start measures the time from device booting (i.e., the start of Reset_Handler) to the fuzzing start point (i.e., start reading the testcase). Note we did not collect the branch coverage information during this sub-process since it remains the same among all the testcases. (2) StartTrace measures the time spent on preparing a test, including the transmission of the testcase from PC to the board and configuration of ETM and DWT functions. (3) Start2End is the time spent from the fuzzing start point to the end point. The branch coverage information is collected for this sub-process. (4) StopTrace is the time spent on disabling the ETM trace and waiting for the completion of the ETM trace transmission. (5) Analysis is time spent on analyzing the ETM packets.
In this experiment, we measured the execution time of each sub-process to assess its impact on the overall overhead. We calculated the average execution time over 1,000 rounds of executions for each sample. Figure 4 presents the breakdown of the execution time. We can see that the execution time for the Reset2Start and StartTrace sub-processes stay stable in all samples, while the execution time for the other sub-processes increases as the firmware becomes more complex. This is because more ETM packets were generated in more sophisticated firmware samples. This will increase the overhead of not only the StopTrace operations due to waiting for the completion of the trace transmission, but also the Analysis operations due to the increased decoding and hashing computation. We also observed that the execution is very fast for simple firmware. For them, the overhead is dominated by the StartTrace and StopTrace sub-processes, which are black-box functions provided in SEGGER SDK. As the firmware becomes more complex, it takes longer to complete the Start2End sub-process and analyze the massive instruction trace.
| Project | Time(s) | Executions | Exec/sec | Paths | Crashes/Hangs |
|---|---|---|---|---|---|
| I2C | 172,893 | 5,340,552 | 30.8893 | 2 | 0/0 |
| UART | 172,838 | 1,947,980 | 11.2706 | 27 | 1/0 |
| USB | 172,803 | 148,398 | 0.8588 | 201 | 0/500 |
| SD Card | 171,693 | 149,063 | 0.8682 | 53 | 0/0 |
| Enet | 174,675 | 52,961 | 0.3032 | 84 | 14/0 |
| MMCAU | 173,180 | 3,268,671 | 18.8744 | 95 | 0/0 |
4.4. Overall Performance of AFL
We evaluated the efficiency of the AFL framework in fuzzing real-world firmware samples to answer RQ4. We ran each firmware for around two days and recorded the number of executions, the total execution time, the number of covered paths, and the number of crashes and hangs, as shown in Table 3.
We would also like to point out that, when the generated trace is very large (e.g., over 200 MB), the debug dongle became insufficiently reliable. The buffer inside the debug dongle might be depleted and this led to overflow and trace loss. If this happened, we had to force quit the execution and reset the faulty cycle. This resulted in a lower execution rate since we have to discard the faulty executions. In rare cases, the error in the debug dongle became undetectable. If that happened, we also observed some false positives. This explains the false positives in the table. When we replayed the same testcases that triggered crashes/hangs during fuzzing, the results could not be reproduced.
| Sample | P2IM | Emu | Avatar2 | AFL |
|---|---|---|---|---|
| Console | 139,860 | 29,513 | 1,766 | 8,261 |
| Fibonacci | 209,478 | 904,617 | 2,623 | 8,670 |
Comparison with Existing Work.
As explained in Section 1, AFL is the first work that can efficiently fuzz peripheral drivers for MCU devices. The most related work includes Avatar (Zaddach et al., 2014) which emulates the firmware in QEMU but forwards peripheral operations to the real development board, and pure emulation-based solutions such as P2IM (Feng et al., 2020) and Emu (Zhou et al., 2021). The original Avatar only leverages the real hardware to pass the firmware initialization phase and then uses symbolic execution to analyze the code that never accesses peripherals. Later, it was substantially re-engineered for multi-target orchestration purpose in Avatar2 (Muench et al., 2018). However, fuzzing is not supported by default on both. Emulation-based approaches provide great scalability but cannot guarantee sufficient fidelity for fuzzing driver code. For example, firmware with complex peripherals cannot be booted.
In this section, we ignore fuzzing effectiveness, but focus on the raw fuzzing speed achieved by AFL, Avatar2, P2IM and Emu. We selected Avatar2 in our experiments for its active development and more friendly API design. Two samples were used. Apart from the Fibonacci sample mentioned before, we evaluated a Console firmware sample which was also used in P2IM (Feng et al., 2020) and Emu (Zhou et al., 2021). It provides a simple interactive shell via the UART peripheral. It is worth noting that we tried to use the firmware with more complex peripherals such as USB or Ethernet, but none of the related work can support them. Indeed, Avatar2 does not support DMA which is indispensable for complex peripherals. P2IM and Emu failed to emulate USB or Ethernet and thus cannot boot the firmware. We augmented the original Avatar2 framework with fuzzing capability, and also improved the stability of the JLink (the name of SEGGER’s debugging solution) target to manage the development board and to coordinate the fuzzing process222https://github.com/avatartwo/avatar2/pull/96, similar to what we did in AFL. The firmware starts execution in QEMU and forwards the I/O requests to the development board when needed. For P2IM and Emu, we directly built the systems using the source code indicated in the original papers. However, we made some tweaks in fuzzing Fibonacci. Specifically, P2IM and Emu mark the end of an execution only when all the bytes in a testcase are used up. This led to constant time-out in fuzzing Fibonacci. We addressed this issue by manually inserting into the source code many invocations of getchar() to emulate consuming testcases.
The results are summarized in Table 4. Emulation-based solutions outperform hardware-in-the-loop solutions significantly because of the higher computation power. More importantly, they avoid the time-consuming synchronization between the PC and the board. AFL on the other hand outperforms Avatar2 since it suffers less from synchronization. The gap is narrowed for the computation-intensive tasks (Fibonacci) because they do not frequently access peripherals and thus avoid synchronization.
4.5. Real-world Firmware Fuzzing
To demonstrate the capability of AFL in finding bugs in the real world, we fuzzed multiple samples with complex peripheral drivers for two days, including Ethernet, USB and SD card. After running the fuzzer for two days for each sample, we found ten previously unknown bugs in the USB drivers released with the STM32 SDK, and three in NXP SDK. In what follows, we use USB as a case study to show how AFL can efficiently find bugs in complex driver code.
Our fuzzer focused on the USB enumeration process in which the USB device is recognized by the host. In our evaluation, we used the MCU board as a USB host and a SanDisk USB disk as a USB device. We assume the USB disk is malicious and can send arbitrary data to the MCU board. We manually identified the program points where data are received from the USB disk and replaced them with the testcases generated by AFL.
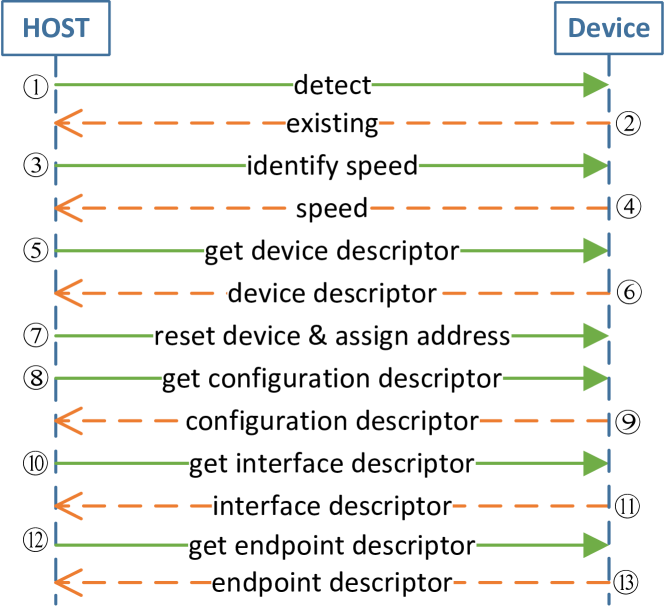
As shown in Figure 5, USB enumeration is very complex and involves multiple rounds of interactions. Most importantly, the USB device is required to send multiple descriptors to specify the device’s properties. When the USB host parses these descriptors, memory bugs could occur if the relevant fields are not sanitized properly. In our two-day fuzzing campaign, we have uncovered 13 previously undisclosed vulnerabilities. All of them have been reported to vendors and patched. Note that these bugs influence all the MCU devices using STM32 SDK or NXP SDK. We categorize the bugs we found as follows.
Unsanitized Length Attributes in Descriptors.
Lots of bugs were caused by the failure to properly sanitize the length fields in different descriptors. For example, the attribute bMaxPacketSize of the device descriptor (⑥) defines the allowed maximum size of the packet transmitted from the host to the device. If this value is maliciously specified and not checked, the driver in the MCU host would wrongly configure a faulty pipe and allocate a buffer of unexpected size, causing a denial of service. We found similar bugs in parsing the field wTotalLength of the configuration descriptor (⑨), interface descriptor (⑪) and endpoint descriptor (⑬), and the field wMaxPacketSize of the endpoint descriptor ⑬. The consequences of these bugs range from buffer overflow to denial of service. The relevant CVEs in this category found by our tool include CVE-2021-34259, CVE-2021-34260, CVE-2021-34268, CVE-2021-38258 and CVE-2021-38260.
Missed Hardware Support Checking.
The field bmAttributes in the configuration descriptor indicates different kinds of power parameters of the configuration. When the respective bit is set, the USB driver attempts to activate the remote wake-up feature in order to save power. However, the driver does not check if the device implements this function, and the system will hang as a result of a failed request. CVE-2021-34261 belongs to this category.
Illogical Endpoint Address.
The field bEndpointAddress in the endpoint descriptor specifies the identification of the endpoint. The host should generally establish an IN endpoint and an OUT endpoint for data reception and transmission. The driver takes this for granted and does not check the contents of the endpoint descriptor. When a malformed endpoint descriptor specifies the same direction, the host may lose the IN pipe or OUT pipe, leading to system hanging. CVE-2021-34267 belongs to this category.
Unchecked Polling Interval.
The filed bInterval in the endpoint descriptor indicates the interval for polling endpoint data transmission. It will be used to specify different polling intervals for individual USB applications, such as audio streaming. When this value is negative, the polling logic will hang the device. CVE-2021-34262 belongs to this category.
5. Discussions
Fuzzing Driver Code.
Fuzzing peripheral drivers is different from fuzzing normal libraries because peripheral drivers need to interact with the external physical world, which brings lots of nondeterminism in fuzzing. In addition, peripheral behaviors are typically modeled as a state machine, whose state transition is triggered by many kinds of events such as interrupts and MMIO interactions. Consequently, effectively fuzzing peripheral drivers needs profound domain knowledge, as we have demonstrated in fuzzing the USB enumeration implementation. Because of this, the code harness for fuzzing a peripheral driver is typically conducted case-by-case. As a general guideline, we should find the program points where the driver interacts with the hardware peripherals. These are places that take inputs from untrusted sources and should thus be tamed to read the testcases. We plan to fuzz more complex drivers in the future.
Applicability.
Our approach relies on the ETM hardware feature and therefore cannot be used to test chips without this feature. Fortunately, based on our experience, ETM is very popular among MCU chips. The real problem is that only a small portion of development boards have physical pinouts to interface with ETM, due to the additional cost in PCB design. We argue this does not influence the applicability of our tool in performing in-house testing or fuzzing vendor SDKs. First, developers can easily assemble a PCB board with ETM pinouts (SFUPTOWNMAKER, 2022). Second, the result of fuzzing an SDK is typically applicable to other SDKs of the same chip vendor. Specifically, chip vendors tend to maintain a common set of device drivers for similar product lines. If a single development board has the ETM pinouts, the discovered bugs could apply to other chips. Taking STM32 MCUs as an example, initially, our tool found CVE-2021-34268 for the STM32H7 series chips since we only have access to an STM32H7B3I-EVAL board which is ETM-enabled. However, the bug affects almost all the product lines of STM32 chips including STM32F4333https://github.com/STMicroelectronics/STM32CubeF4/blob/2f3b26f16559f7af495727a98253067a31182cfc/Middlewares/ST/STM32_USB_Host_Library/Core/Src/usbh_ctlreq.c#L355, STM32F1444https://github.com/STMicroelectronics/STM32CubeF1/blob/f5aaa9b45492d70585ade1dac4d1e33d5531c171/Middlewares/ST/STM32_USB_Host_Library/Core/Src/usbh_ctlreq.c#L360, etc.
6. Related work
6.1. MCU Firmware Fuzzing
Existing approaches for MCU firmware fuzzing can be classified into five categories as shown in Figure 4 of the work by Li et al (Wenqiang Li, Le Guan, Jingqiang Lin, Jiameng Shi and Fengjun Li, 2021). Emulation is the most intuitive method. However, full emulation of various MCU in the market is impossible. Existing QEMU-based solutions, such as P2IM (Feng et al., 2020), DICE (Mera et al., 2021), Laelaps (Cao et al., 2020), PRETENDER (Gustafson et al., 2019), Emu (Zhou et al., 2021), and Jetset (Johnson et al., 2021) make a trade-off by utilizing a variety of methods, like machine-learning, symbolic execution and so on, to approximate the behavior of the peripherals in order to run the firmware successfully. HALucinator (Clements et al., 2020) simplifies the process even further by abstracting and replacing the hardware interface without performing any actual peripheral functions. All of them demonstrate good performance and cost-effectiveness. As with HALucinator, para-rehosting (Wenqiang Li, Le Guan, Jingqiang Lin, Jiameng Shi and Fengjun Li, 2021) also provides a uniform platform by abstracting an MCU on the commodity hardware in order to benefit from the off-the-shelf test suites such as AFL (Zalewski, 2010) and AddressSanitizer (Serebryany et al., 2012) with the most powerful capability. Furthermore, it can greatly improve the fuzzing performance. Both techniques, however, are not able to delve into the driver layer. Although the peripheral forwarding mechanisms (e.g., Avatar (Zaddach et al., 2014)) interact with hardware, they are primarily used to support the upper layer’s fuzzing. Also, full firmware synchronization between the emulator and the real device will incur additional overhead.
6.2. Peripheral Vulnerability Detection
USBFuzz (Peng and Payer, 2020) proposed a framework to apply fuzzing to the commodity OS USB driver by using an emulated USB device in a virtualized kernel. The emulated USB device feeds the testcases and breaks the hardware/software barrier. However, this approach cannot be used in MCU firmware fuzzing, because a) unlike the kernel in a commodity OS host, MCU cannot run any existing fuzzer due to lack of MMU b) no out-of-box device emulators are available for MCU c) MCU peripherals are multifarious and heterogeneous. Therefore, the MCU peripherals still have to be considered individually.
Facedancer (Kate Temkin, Mikaela Szekely, 2020), an early effort for fuzzing MCU USB drivers, proposed to use a board which responded with a variety of descriptors and disguised itself as different USB devices. Working as the man in the middle between the fuzzer and the target MCU, the board helps to feed the testcase and check the operating state. However, this dummy fuzzing approach is not effective in most cases, since it cannot obtain any feedback from the target to generate the bitmap and guide the testcase generation. Besides, the board supported only USB drivers.
FIRMUSB (Hernandez et al., 2017) took a domain-specific approach for detecting USB vulnerabilities. To identify non-compliant behaviors, it contrasted the model generated from known USB databases and retrieved by symbolic execution. So, FIRMUSB could detect vulnerabilities of the binary firmware without running it on the real board. However, similar to FaceDance, this effort focuses on testing USB firmware only.
7. Conclusion
We propose AFL, a non-intrusive feedback-driven fuzzing platform for MCU firmware, particularly targeting the low-level peripheral drivers. AFL decouples the execution engine from the original AFL framework and uses the development board to execute the testcase. To enable communication between the execution engine and the rest of AFL, we leverage the debug dongle commonly available in the embedded system development environment. To effectively obtain instruction trace, we rely on the ETM and DWT hardware features. Finally, we propose using dynamic basic blocks to reduce the overhead of decoding and analyzing the ETM data. We have evaluated our prototype implementation against SDKs from the two popular MCU vendors: NXP and STMicroelectronics. The prototype has helped us find 13 zero-day bugs in the USB stack shipped with the vendor SDKs, and eight CVEs have been allocated.
Acknowledgements.
We thank engineers from SEGGER Microcontroller for their tireless technical support in using JLink SDK and permitting us to distribute our work as an open-source project. We thank Dr. Kang Li from Baidu Security and Dr. Kyu Hyung Lee from the University of Georgia for their insightful comments. This work was supported in part by NSF IIS-2014552, the Ripple University Blockchain Research Initiative and a grant from the University of Georgia Research Foundation, Inc.References
- (1)
- ARM (2007) ARM. 2007. Embedded Trace Macrocell Architecture Specification ETMv1.0 to ETMv3.4. https://developer.arm.com/documentation/ihi0014/latest. (Retrieved: 2022-01-24).
- ARM (2010) ARM. 2010. Cortex-M4 Technical Reference Manual. https://documentation-service.arm.com/static/5f19da2a20b7cf4bc524d99a. (Retrieved: 2022-01-24).
- ARM (2011a) ARM. 2011a. Cortex-M Debug Connectors. https://documentation-service.arm.com/static/5fce6c49e167456a35b36af1. (Retrieved: 2022-01-24).
- ARM (2011b) ARM. 2011b. Embedded Trace Macrocell, ETMv1.0 to ETMv3.5. http://infocenter.arm.com/help/topic/com.arm.doc.ihi0014q/IHI0014Q_etm_architecture_spec.pdf. (Retrieved: 2022-01-24).
- ARM (2020) ARM. 2020. Fault status registers and fault address registers. https://developer.arm.com/documentation/ddi0337/e/exceptions/abort-model/fault-status-registers-and-fault-address-registers. (Retrieved: 2022-01-24).
- ARM (2021a) ARM. 2021a. CoreSight Components Technical Reference Manual: AHB-AP. https://developer.arm.com/documentation/ddi0337/h/debug/about-the-ahb-ap. (Retrieved: 2022-01-24).
- ARM (2021b) ARM. 2021b. CoreSight Components Technical Reference Manual: Debug Access Port. https://developer.arm.com/documentation/ddi0314/h/Debug-Access-Port. (Retrieved: 2022-01-24).
- Austin Appleby (2011) Austin Appleby. 2011. MurmurHash. https://sites.google.com/site/murmurhash/. (Retrieved: 2022-01-24).
- AZ Defender team (2021) AZ Defender team. 2021. ”BadAlloc” – Memory allocation vulnerabilities could affect wide range of IoT and OT devices in industrial, medical, and enterprise networks. https://msrc-blog.microsoft.com/2021/04/29/badalloc-memory-allocation-vulnerabilities-could-affect-wide-range-of-iot-and-ot-devices-in-industrial-medical-and-enterprise-networks/. (Retrieved: 2022-01-24).
- Bhansali et al. (2006) Sanjay Bhansali, Wen-Ke Chen, Stuart De Jong, Andrew Edwards, Ron Murray, Milenko Drinić, Darek Mihočka, and Joe Chau. 2006. Framework for instruction-level tracing and analysis of program executions. In Proceedings of the 2nd international conference on Virtual execution environments. 154–163.
- Cao et al. (2020) Chen Cao, Le Guan, Jiang Ming, and Peng Liu. 2020. Device-agnostic Firmware Execution is Possible: A Concolic Execution Approach for Peripheral Emulation. In Proceedings of the 36th Annual Computer Security Applications Conference.
- Chen et al. (2019) Yaohui Chen, Dongliang Mu, Jun Xu, Zhichuang Sun, Wenbo Shen, Xinyu Xing, Long Lu, and Bing Mao. 2019. Ptrix: Efficient hardware-assisted fuzzing for cots binary. In Proceedings of the 2019 ACM Asia Conference on Computer and Communications Security. 633–645.
- Clements et al. (2020) Abraham A Clements, Eric Gustafson, Tobias Scharnowski, Paul Grosen, David Fritz, Christopher Kruegel, Giovanni Vigna, Saurabh Bagchi, and Mathias Payer. 2020. HALucinator: Firmware Re-hosting Through Abstraction Layer Emulation. In 29th USENIX Security Symposium (USENIX Security 20). 1201–1218.
- Corteggiani et al. (2018) Nassim Corteggiani, Giovanni Camurati, and Aurélien Francillon. 2018. Inception: System-Wide Security Testing of Real-World Embedded Systems Software. In 27th USENIX Security Symposium (USENIX Security 18). Baltimore, MD, 309–326.
- Cui et al. (2018) Weidong Cui, Xinyang Ge, Baris Kasikci, Ben Niu, Upamanyu Sharma, Ruoyu Wang, and Insu Yun. 2018. REPT: Reverse Debugging of Failures in Deployed Software. In 13th USENIX Symposium on Operating Systems Design and Implementation (OSDI 18). Carlsbad, CA, 17–32.
- Du et al. (2020) Yunlan Du, Zhenyu Ning, Jun Xu, Zhilong Wang, Yueh-Hsun Lin, Fengwei Zhang, Xinyu Xing, and Bing Mao. 2020. HART: Hardware-Assisted Kernel Module Tracing on Arm. In European Symposium on Research in Computer Security. Springer, 316–337.
- Feng et al. (2020) Bo Feng, Alejandro Mera, and Long Lu. 2020. P2IM: Scalable and Hardware-independent Firmware Testing via Automatic Peripheral Interface Modeling. In 29th USENIX Security Symposium (USENIX Security 20). 1237–1254.
- Ge et al. (2017) Xinyang Ge, Weidong Cui, and Trent Jaeger. 2017. Griffin: Guarding control flows using intel processor trace. ACM SIGPLAN Notices 52, 4 (2017), 585–598.
- Gustafson et al. (2019) Eric Gustafson, Marius Muench, Chad Spensky, Nilo Redini, Aravind Machiry, Yanick Fratantonio, Davide Balzarotti, Aurélien Francillon, Yung Ryn Choe, Christophe Kruegel, and Giovanni Vigna. 2019. Toward the Analysis of Embedded Firmware through Automated Re-hosting. In RAID 2019. 135–150.
- Hernandez et al. (2017) Grant Hernandez, Farhaan Fowze, Dave Tian, Tuba Yavuz, and Kevin RB Butler. 2017. Firmusb: Vetting usb device firmware using domain informed symbolic execution. In Proceedings of the 2017 ACM SIGSAC Conference on Computer and Communications Security. 2245–2262.
- Intel (2016) Intel. 2016. Intel 64 and IA-32 Architectures Software Developer’s Manual. https://www.intel.com/content/dam/www/public/us/en/documents/manuals/64-ia-32-architectures-software-developer-vol-3c-part-3-manual.pdf. (Retrieved: 2022-01-24).
- Johnson et al. (2021) Evan Johnson, Maxwell Bland, YiFei Zhu, Joshua Mason, Stephen Checkoway, Stefan Savage, and Kirill Levchenko. 2021. Jetset: Targeted Firmware Rehosting for Embedded Systems. In 30th USENIX Security Symposium.
- Kate Temkin, Mikaela Szekely (2020) Kate Temkin, Mikaela Szekely. 2020. Facedancer. https://github.com/usb-tools/Facedancer. (Retrieved: 2022-01-24).
- Koscher et al. (2015) Karl Koscher, Tadayoshi Kohno, and David Molnar. 2015. SURROGATES: Enabling Near-Real-Time Dynamic Analyses of Embedded Systems. In 9th USENIX Workshop on Offensive Technologies (WOOT’15). Washington, D.C.
- Lee et al. (2017) Yongje Lee, Jinyong Lee, Ingoo Heo, Dongil Hwang, and Yunheung Paek. 2017. Using CoreSight PTM to Integrate CRA Monitoring IPs in an ARM-Based SoC. ACM Transactions on Design Automation of Electronic Systems (TODAES) 22, 3 (2017), 1–25.
- MarketWatch, Inc (2022) MarketWatch, Inc. 2022. IoT Microcontroller (MCU) Market Size 2021 Global Trend, Top Manufacturers, Regions Analysis and Leading 20 Countries and Forecast by 2027. https://www.marketwatch.com/press-release/iot-microcontroller-mcu-market-in-2022-113-cagr-with-top-countries-data-what-would-be-the-size-of-iot-microcontroller-mcu-industry-in-2027-latest-126-pages-report-2022-01-16. (Retrieved: 2022-01-24).
- Mera et al. (2021) A. Mera, B. Feng, L. Lu, and E. Kirda. 2021. DICE: Automatic Emulation of DMA Input Channels for Dynamic Firmware Analysis. In 2021 IEEE Symposium on Security and Privacy (SP). Los Alamitos, CA, USA, 302–318.
- Michal Zalewski (2021) Michal Zalewski. 2021. Technical ”whitepaper” for afl-fuzz. https://lcamtuf.coredump.cx/afl/technical_details.txt. (Retrieved: 2022-01-24).
- Milenkovic et al. (2008) Milena Milenkovic, Scott Jones, Frank Levine, and Enio Pineda. 2008. Performance inspector tools with instruction tracing and per-thread/function profiling. In Linux Symposium.
- Muench et al. (2018) Marius Muench, Aurélien Francillon, and Davide Balzarotti. 2018. Avatar2: A Multi-target Orchestration Platform. In Workshop on Binary Analysis Research.
- Nguyen Anh Quynh (2021) Nguyen Anh Quynh. 2021. Capstone Engine. https://github.com/aquynh/capstone. (Retrieved: 2022-01-24).
- Ning and Zhang (2017) Zhenyu Ning and Fengwei Zhang. 2017. Ninja: Towards Transparent Tracing and Debugging on ARM. In 26th USENIX Security Symposium (USENIX Security 17). 33–49.
- NXP Semiconductors (2021a) NXP Semiconductors. 2021a. CAUAP: Crypto Acceleration Unit (CAU) and MmCAU Software Library. https://www.nxp.com/design/development-boards/tower-development-boards/mcu-and-processor-modules/kinetis-modules/crypto-acceleration-unit-cau-and-mmcau-software-library:CAUAP. (Retrieved: 2022-01-24).
- NXP Semiconductors (2021b) NXP Semiconductors. 2021b. NXP Semiconductors Official Site. https://www.nxp.com/. (Retrieved: 2022-01-24).
- ONE Tech (2020) ONE Tech. 2020. WiFi Vulnerabilities on ESP32/ESP8266 IoT Devices. https://www.onetech.ai/en/blog/wifi-vulnerabilities-on-esp32-esp8266-iot-devices. (Retrieved: 2022-01-24).
- Peng and Payer (2020) Hui Peng and Mathias Payer. 2020. USBFuzz: A Framework for Fuzzing USB Drivers by Device Emulation. In 29th USENIX Security Symposium (USENIX Security 20). 2559–2575.
- SEGGER (2021) SEGGER. 2021. J-Link RTT – Real Time Transfer. https://www.segger.com/products/debug-probes/j-link/technology/about-real-time-transfer/. (Retrieved: 2022-01-24).
- SEGGER Microcontroller (2022a) SEGGER Microcontroller. 2022a. J-Link SDK - Integrate J-Link Support into Applications. https://www.segger.com/products/debug-probes/j-link/technology/j-link-sdk/. (Retrieved: 2022-01-24).
- SEGGER Microcontroller (2022b) SEGGER Microcontroller. 2022b. J-Trace PRO — The leading trace solution. https://www.segger.com/products/debug-probes/j-trace/. (Retrieved: 2022-01-24).
- Serebryany et al. (2012) Konstantin Serebryany, Derek Bruening, Alexander Potapenko, and Dmitriy Vyukov. 2012. AddressSanitizer: A fast address sanity checker. In 2012 USENIX Annual Technical Conference (USENIX ATC 12). 309–318.
- SFUPTOWNMAKER (2022) SFUPTOWNMAKER. 2022. PCB Basics. https://learn.sparkfun.com/tutorials/pcb-basics/all. (Retrieved: 2022-01-24).
- STMicroelectronics (2021) STMicroelectronics. 2021. STMicroelectronics: Home. https://www.st.com/content/st_com/en.html. (Retrieved: 2022-01-24).
- Wenqiang Li, Le Guan, Jingqiang Lin, Jiameng Shi and Fengjun Li (2021) Wenqiang Li, Le Guan, Jingqiang Lin, Jiameng Shi and Fengjun Li. 2021. From Library Portability to Para-rehosting: Natively Executing Open-source Microcontroller OSs on Commodity Hardware. In NDSS 2021.
- Yates and Malevris (1995) Derek F Yates and Nicos Malevris. 1995. The effort required by LCSAJ testing: an assessment via a new path generation strategy. Software Quality Journal 4, 3 (1995), 227–242.
- Zaddach et al. (2014) Jonas Zaddach, Luca Bruno, Aurelien Francillon, and Davide Balzarotti. 2014. Avatar: A Framework to Support Dynamic Security Analysis of Embedded Systems’ Firmwares. In Proceedings of the 2014 Network and Distributed System Security Symposium (NDSS’14).
- Zalewski (2010) Michal Zalewski. 2010. American Fuzzy Lop. http://lcamtuf.coredump.cx/afl/. (Retrieved: 2022-01-24).
- Zhou et al. (2021) Wei Zhou, Le Guan, Peng Liu, and Yuqing Zhang. 2021. Automatic Firmware Emulation through Invalidity-guided Knowledge Inference. In 30th USENIX Security Symposium (USENIX Security 21).
- ZIMPERIUM (2018a) ZIMPERIUM. 2018a. FreeRTOS TCP/IP Stack Vulnerabilities Put A Wide Range of Devices at Risk of Compromise: From Smart Homes to Critical Infrastructure Systems. https://blog.zimperium.com/freertos-tcpip-stack-vulnerabilities-put-wide-range-devices-risk-compromise-smart-homes-critical-infrastructure-systems/. (Retrieved: 2022-01-24).
- ZIMPERIUM (2018b) ZIMPERIUM. 2018b. FreeRTOS TCP/IP Stack Vulnerabilities – The Details. https://blog.zimperium.com/freertos-tcpip-stack-vulnerabilities-details/. (Retrieved: 2022-01-24).