Monolithic Kerr and electro-optic hybrid microcombs
Abstract
Advances in microresonator-based soliton generation promise chip-scale integration of optical frequency comb for applications spanning from time keeping to frequency synthesis. Miniaturized cavities harness Kerr nonlinearity and enable terahertz soliton repetition rates. However, such high repetition rates are not amenable to direct electronic detection. Here, we demonstrate hybrid Kerr and electro-optic microcombs using the lithium niobate thin film that exhibits both Kerr and Pockels nonlinearities. By interleaving the high-repetition-rate Kerr soliton comb with the low-repetition-rate electro-optic comb on the same waveguide, the wide Kerr soliton mode spacing is divided within a single chip, allowing for subsequent electronic detection and feedback control of the soliton repetition rate. Our work establishes an integrated electronic interface to Kerr solitons of terahertz repetition rates, paving the path towards chipscale optical-to-microwave frequency division and comb locking.
I Introduction
Optical frequency combs are precision spectral rulers that have revolutionized frequency and time measurements Diddams, Vahala, and Udem (2020). Since early demonstrations of frequency combs with solid-state mode-locked lasers, persistent efforts have been made to advance the comb technology from laboratory concepts to field deployment Fortier and Baumann (2019). An important progress is the soliton mode-locking in high-quality-factor Kerr microresonators Herr et al. (2014); Xue et al. (2015) which pushes comb systems towards integrated chips Xiang et al. (2021) for portable operation Stern et al. (2018). Due to the tight optical confinement in a microresonator, the Kerr () nonlinearity is enhanced, leading to sub-milliwatt comb initiation Chang et al. (2020); Ji et al. (2017) as well as new avenues for studying soliton physics Yang et al. (2016); Cole et al. (2017); Weng et al. (2020); Tikan et al. (2021). The versatile waveguide dispersion control further permits broadband comb operation Li et al. (2017); Pfeiffer et al. (2017); Gong et al. (2020a); Yu et al. (2016); Liu et al. (2021); He et al. (2021). To date, a multitude of nanophotonic material platforms Kippenberg et al. (2018) have been developed to support soliton microcomb sources which have already enabled new capabilities in optical clock Newman et al. (2019); Drake et al. (2019), optical frequency synthesis Spencer et al. (2018), spectroscopy Dutt et al. (2018); Suh et al. (2016) and etc Kippenberg et al. (2018).
To further the integration of microcomb systems for scalable production and high volume applications, efforts have been made to integrate soliton initiation circuitry onto chip Raja et al. (2019); Jin et al. (2021); Stern et al. (2018); Xiang et al. (2021). Another key element is the detection and control of the soliton repetition rates Del’Haye, Papp, and Diddams (2012); Yu et al. (2019); Drake et al. (2019); Wang et al. (2020). Despite that Kerr solitons with microwave repetition rates are achievable Liu et al. (2020); Yang et al. (2018), broadband self-referenceable solitons often exhibit much wider mode spacings in the terahertz range which are usually not amenable to direct photodetection Pfeiffer et al. (2017); Li et al. (2017); Zhang et al. (2019a). Previous works divided such high soliton repetition rates by the use of a separate Kerr microcomb device Spencer et al. (2018); Wang et al. (2020) or off-chip electro-optic (EO) modulators Del’Haye, Papp, and Diddams (2012); Yu et al. (2019); Drake et al. (2019). Under cascaded phase modulation, dense sidebands can be created between neighboring soliton comb lines to facilitate the electronic detection and stabilization of the soliton repetition rate Del’Haye, Papp, and Diddams (2012).
Meanwhile, a flurry of studies have been devoted to exploiting the additional nonlinearity existing in non-centrosymmetric Kerr microcomb materials Jung et al. (2014); Wilson et al. (2019); He et al. (2019). Not only do they unveil novel nonlinear dynamics Bruch et al. (2021); Guo et al. (2018), they also bring about opportunities to extend Kerr microcomb system functionalities, such as phase-matched frequency doubling Lu et al. (2019); Luo et al. (2018); Bruch et al. (2018), and EO modulation Wang et al. (2019); Zhang et al. (2019b, 2021).
Here, we demonstrate an integrated approach to detect and control the high repetition rate of Kerr solitons using a monolithic hybrid Kerr and EO microcombs circuit patterned on a single z-cut lithium niobate (LN) thin film. Owing to the coexistence of Kerr () and Pockels () nonlinearities on this emerging nanophotonic platform He et al. (2019); Gong et al. (2019); Okawachi et al. (2020); Yu et al. (2020); Wang et al. (2019); Zhang et al. (2019b); Gong et al. (2020b), Kerr soliton and EO combs can be produced simultaneously within a single photonic circuit. The fast solitons and slow EO pulses converge onto a common output waveguide and lead to optical-heterodyning between the two pulse trains. In this way, a soliton repetition rate of 334 GHz is divided down to a low frequency RF beatnote which can be processed electronically and monitored in real time. We then show the dependence of soliton repetition rate on pump frequency and pump power, and further stabilize it to an external microwave reference. Our work establishes an integrated interface connecting terahertz-rate Kerr solitons and readily detectable microwaves, providing a path for on-chip photonic frequency division as well as comb locking.
II Results
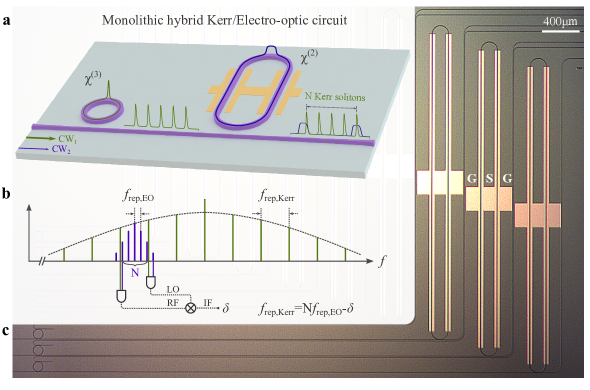
Experimental scheme and on-chip hybrid Kerr and EO circuit. Fig. 1a illustrates the schematic of a LN thin film hybrid Kerr and EO microcombs circuit. The Kerr soliton microcomb is generated by a c.w. telecom-band pump laser, while the EO comb is sourced by an auxiliary c.w. laser and driven by an RF reference synthesizer. When the RF frequency is tuned to match the EO microring FSR, an EO comb is formed and spectrally positioned in between adjacent soliton forming modes. The neighboring soliton and EO comb lines yield four low-frequency RF heterodyne beat notes. By subsequently mixing a selected pair of the beat notes, e.g., as shown in Fig. 1b, the Kerr soliton repetition rate () is given by
| (1) |
with denoting the number of EO sidebands between the two soliton modes, being the EO comb repetition rate and representing the frequency difference of the two selected beat notes (Fig. 1b). The involvement of the other RF heterodyne beat notes will be discussed in a later section. Note that the measurement of is independent of the EO comb pump laser frequency and its frequency noise, which are cancelled in the coherent mixing process.
Our hybrid Kerr and EO circuits are monolithically fabricated on a millimeter-sized z-cut LN thin film (see Methods), as shown in Fig. 1c. The circuit consists of a microring Kerr soliton generator and a microring EO comb generator that are serially coupled to a common bus waveguide. The bus waveguide couples separate pump sources into the two microrings and delivers the resulting interleaved hybrid combs for detection. A separate drop-port waveguide is added alongside the Kerr soliton microring for direct access of the soliton spectrum. This convenient circuit configuration requires only one pair of optical input and output ports to produce and access the hybrid Kerr soliton and EO combs for measurement. The use of the auxiliary laser to generate the EO comb can be eliminated, for example, by electro-optically aligning an EO microring resonance to a soliton comb line.
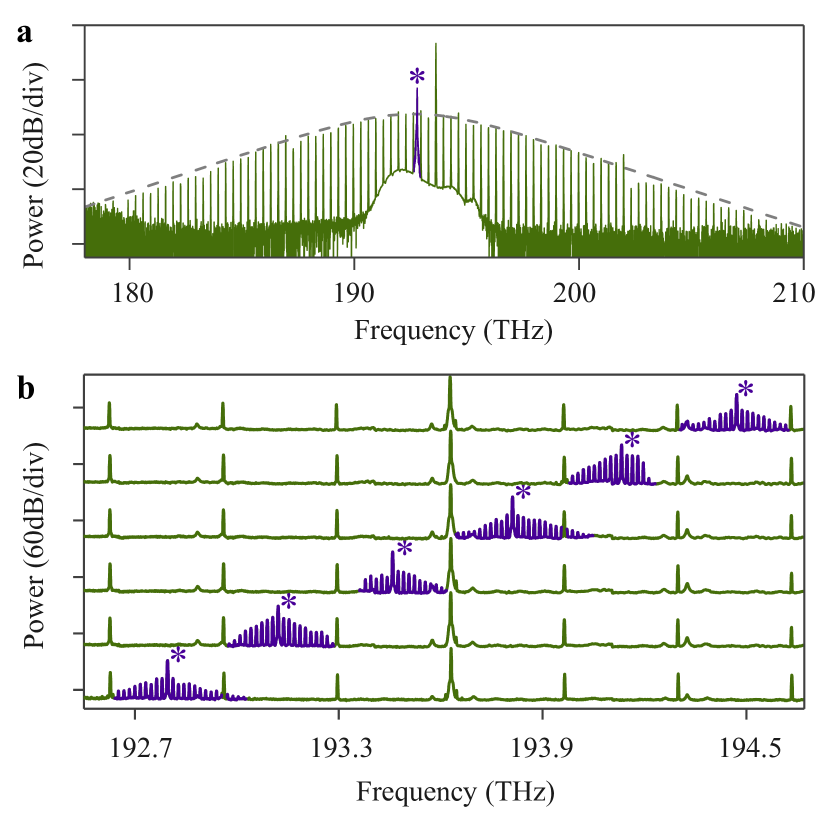
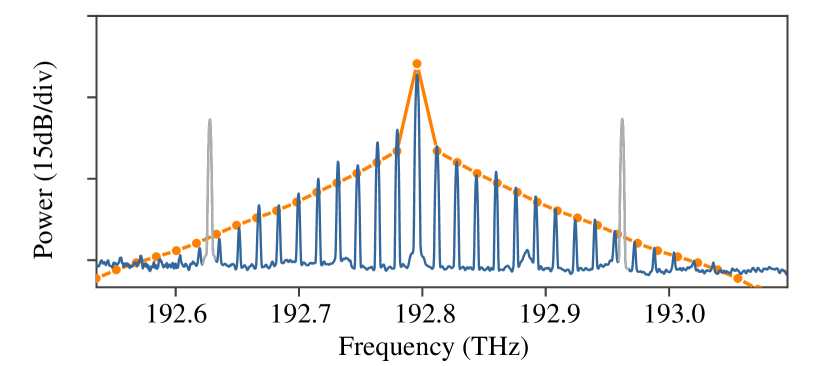
Hybrid Kerr soliton and EO microcombs generation. The Kerr soliton microring is geometrically engineered to exhibit anomalous dispersion for the modes at telecom wavelengths (see Methods). The microring coupling rates to external waveguides are adjusted to favor soliton formation over the stimulated Raman scattering (SRS) Gong et al. (2020b, a) (see Methods). A soliton comb can be generated under an on-chip pump power of 50 mW at 1549.5 nm, featuring a 334-GHz mode spacing. By leveraging the photorefractive effect in z-cut LN microrings, soliton mode-locking is triggered by slowly scanning the red-detuned c.w. pump wavelength He et al. (2019); Gong et al. (2018).
The EO comb, generated in a racetrack microring-based EO modulator, harnesses resonantly enhanced EO modulation strength Zhang et al. (2019b). Favorable phase-matching condition for the EO comb is achieved by tailoring the microring geometries (see Methods). Here, in-plane electric fields are applied across the microring to modulate the modes through the LN EO tensor component (5.4 pm/V Yariv, Yariv, and Yeh (2007)). The gap between the microring and the in-plane GSG gold electrodes is set to be 2 m to provide strong RF drive fields while not attenuating the intracavity optical fields.
Similar to Kerr soliton generation, the auxiliary c.w. pump can be steadily launched into a resonance of the EO microring from the red-detuned region. In experiments, a 1.5-mW on-chip optical pump and an RF drive with an approximately 14-V peak amplitude were used to generate the EO combs (Fig. 2). The pump power was set below the thresholds of Kerr four-wave mixing and SRS which otherwise could disturb the EO comb formation. The RF modulation field was provided by a microwave synthesizer running at a frequency close to the microring FSR ( 16 GHz). The measured microcomb spectra under different EO pump wavelengths are shown in Fig. 2b. At certain wavelengths, mode-crossings between the EO comb modes and other cavity modes are present and causes the asymmetry of the comb profile (see Supplementary Note 1). By selecting a suitable pump wavelength, well-developed EO comb can be obtained to bridge the gap of adjacent soliton lines. In the following measurement, we chose to pump the resonance at 1556 nm.
The hybrid combs spectrum output from the bus waveguide (Fig. 2a) shows that the Kerr soliton comb spectral profile remains largely intact after passing through the EO microring. This is because the likelihood for soliton comb lines being aligned with EO microring resonances is low. Meanwhile, one can also obtain an unfiltered soliton spectrum from the drop-port of the soliton microring (see Supplementary Note 2). Here, the circuit allows both combs to exploit identical polarization state (), facilitating the following heterodyne measurement.
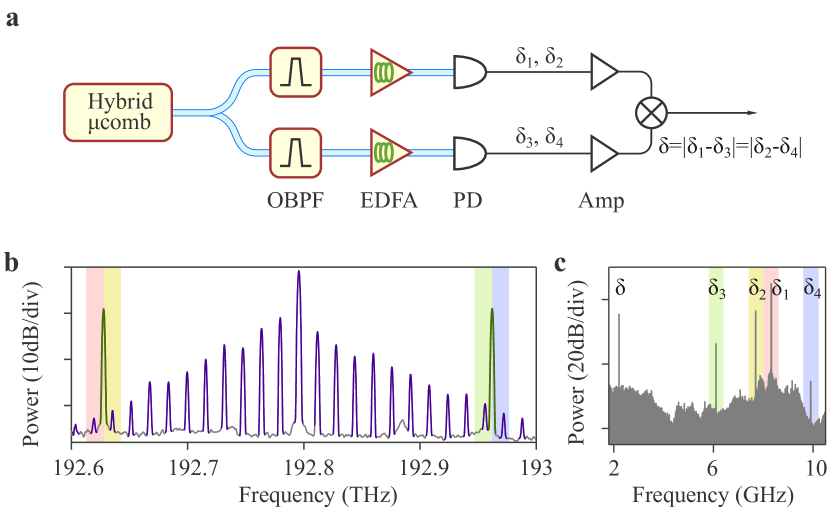
Detection and control of . The experimental scheme for real-time electronically accessing is illustrated in Fig. 3a. The outgoing hybrid microcombs are split into two paths to access different optical-heterodyne beat notes. Two tunable OBPFs are utilized to select the target soliton comb lines and nearby EO comb lines (highlighted in Fig. 3b) for optical-heterodyne detection. In the upper path, the lower-frequency soliton mode along with two adjacent EO comb modes yield a pair of beat notes at 8.3 GHz and 7.7 GHz respectively, with the constraint of . Likewise, another pair of beat notes are generated at 6.1 GHz and 9.9 GHz in the lower path, with . To identify the two comb modes by which a beat note is generated in each path, one can slightly tune the EO drive frequency () while observing how the beat note shifts. For example, when is increased, the beat note (at or ) formed by the soliton mode and the interior EO comb mode will shift to lower frequencies, as the interior EO comb mode comes closer to the soliton mode. Conversely, the other beat note (at or ) formed by the soliton mode and the exterior EO comb mode will shift to higher frequencies.
To access , we then mix two of the RF beat notes from different paths and record their frequency difference, 2.2 GHz. Fig. 3c shows a typical RF spectrum at the output of the RF mixer, whose input RF/LO frequency range is from 3.7 to 8.5 GHz. Due to the limited conversion efficiency and finite isolation of the mixer, residual input RF beat notes can still been seen on the mixer output spectrum. They are shown here for illustration purpose, and can be further suppressed with RF filters. At last, we arrive at , based on the measurement shown in Fig. 3. Note that the sign before should be reversed in the calculation if .
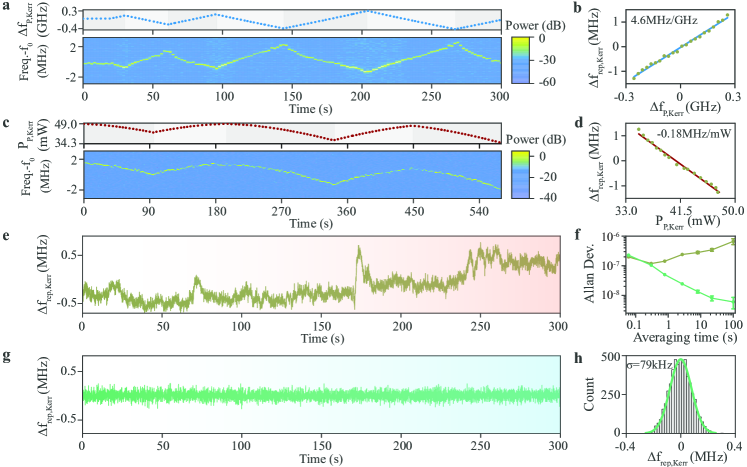
The electronic access of allows us to investigate and quantify the tunability of in LN microcombs. We vary the Kerr pump frequency and pump power separately while monitoring to infer the change in . Fig. 4a shows the measured beat note spectra as pump frequency is modulated. The -to-pump-frequency tuning rate is extracted to be 4.6 MHz/GHz under an on-chip pump power of 50mW (Fig. 4b). Here, the pump laser frequency is piezo controlled by an arbitrary function generator and calibrated with a wavelength meter. On the other hand, one can also tune by varying the pump power, e.g., via an external acousto-optic modulator (Fig. 4c). The -to-pump-power tuning rate is found to be -0.18 MHz/mW around the 41.5-mW operating point (Fig. 4d).
We move on to characterize the frequency stability of the free-running . The drift of is reflected in , since is set by a reference RF synthesizer and has negligible frequency drift within the measurement time span (see Methods). Due to the limited amplitude of the beat note, we chose to use an electronic spectrum analyzer instead of a frequency counter Drake et al. (2019); Zhang et al. (2019a); Del’Haye, Papp, and Diddams (2012) to capture (see Methods). A time series measurement of is presented in Fig 4e, where the Kerr soliton comb is free-running. The corresponding Allan deviations (Fig 4f) reveal a fractional-frequency stability of 1.6 for 1-s measurements, which translates to a 53.4-kHz fluctuation in . The observed 1-s Allan deviation is 36 times higher than the previously reported value from a silica microtoroid of similar FSR Zhang et al. (2019a). Several factors may contribute to the larger instability. First, LN is known to exhibit photorefactive effect which may introduce cavity resonance oscillations Sun et al. (2017). Second, the Kerr soliton pump laser used here (TSL-710, Santec) has 10 times broader short-term linewidth than the laser used in Zhang et al. (2019a). Furthermore, our fiber-to-chip edge coupling tends to be more sensitive to the environmental perturbations than the fiber-taper setup. The mitigation of these drifts will be subject of future investigations, for example, by minimizing the technical noise sources mentioned above and also by operating the Kerr soliton at a quiet point, as demonstrated in Yi et al. (2017); Lucas et al. (2020).
For proof-of-concept stabilization of , we build a simple computer-aided feedback control loop (see Methods) to improve frequency stability. We digitally sample and compare it to a frequency setpoint, and use the generated error signal to adjust the Kerr soliton pump laser frequency to compensate for the drift. Due to the latency (60 ms) of this digital approach, the effective feedback control bandwdith is limited to 17 Hz. Fig. 4g shows the stabilized with much reduced long-term drift compared with the free-running case (Fig. 4e). Allan deviations of the in-loop also reveal better long-term stability, e.g., a two order of magnitude improvement is achieved for 100-s measurements (Fig. 4f). Additionally, the in-loop frequency drift distribution is shown in Fig. 4h, exhibiting a standard deviation of 79 kHz. For future improvement, we believe that a higher beat note SNR enabled by a stronger EO comb will permit the use of a faster frequency locker to improve both the long-term and short-term stability of (see Methods).
III Discussion
In summary, we demonstrate a monolithic, hybrid Kerr and EO combs platform based on a LN thin film which permits the electronic access and control of terahertz Kerr soliton repetition rates by leveraging the simultaneous Kerr and Pockels nonlinearities inherent to LN. The monolithic circuit integrates Kerr soliton and EO microcombs on a single chip, and provides an on-chip interface between fast Kerr solitons and readily detectable microwaves. We also point out opportunities for further improvement of this chip platform. For example, EO microring modulation efficiency can be enhanced by either accessing a larger LN EO tensor component which is 6 times higher than used here or incorporating a microwave resonator Zhang et al. (2019b); Rueda et al. (2019). The need for the auxiliary pump laser could also be relaxed by aligning a soliton mode to the target EO microring mode. The demonstrated monolithic scheme thus holds great promise for the future development of fully integrated optical frequency divider on the LN thin-film platform for optical clock application, as well as study of soliton dynamics in hybrid Kerr and EO systems. It should be also noted that the hybrid comb architecture demonstrated here can be extended to other materials platforms that possess simultaneous Kerr and Pockels nonlinearities, such as AlN Liu et al. (2021), AlGaAs Chang et al. (2020), and GaP Wilson et al. (2019).
Methods
Device design. We simulate microring dispersion with a finite-difference method solver (FIMMWAVE, Photon Design). To obtain suitable dispersion for Kerr soliton and EO microcomb generation, we adopt an air-clad partially etched waveguide structure, where the LN etching depth is 380 nm leaving a 200-nm un-etched LN slab above . The Kerr soliton microring top-width and radius are designed to be 1.4 m, and 60 m respectively to yield a 6 MHz at 1550 nm. The top width of the EO microring is set to be 1.95 m, giving rise to a low 2.5 kHz. A 30 ∘ sidewall angle is included in the simulation to reflect the plasma etching-angle of the fabricated devices. The extracted microring dispersion profiles are presented in Supplementary Note 1.
The Kerr soliton microring is constructed in an add-drop configuration. The drop-port waveguide directly guides solitons out of the chip, while the through-port waveguide couples to the following EO microring and delivers the hybrid combs for detection.
To favor Kerr soliton formation over SRS, the intracavity pump mode threshold energy for SRS () needs to be raised above the threshold for soliton generation () Gong et al. (2020b, a). In practice, we fix the drop-port coupling rate () and adjust the through-port coupling rate () to raise over . The Kerr soliton microring modes exhibit a typical intrinsic decay rate of 106 MHz and 13 MHz (900-nm coupling gap) in the telecom band. For example, in order to generate a Kerr soliton with a 5.6-THz FWHM, should be made smaller than 72 MHz. Here, we assume that , and are constant across the modes of interest, and the dominant Raman gain () center Gong et al. (2020b, a) overlaps a local soliton forming mode. In the experiment, we adopted a 850-nm through-port-Kerr-microring coupling gap, which yields a 58 MHz and leads to successful soliton generation (Fig. 2). SRS is also suppressed in the EO microring, since the intracavity pump mode energy is far below . The EO microring exhibits a typical intrinsic decay rate of 60 MHz and a waveguide coupling rate of 20 MHz (600-nm coupling gap). The measured resonance spectra of both microrings are shown in Supplementary Note 1.
To allow for efficient interaction between the applied in-plane RF field and EO microring modes, we place 200-nm-thick GSG gold electrodes closely along the microring, keeping a 2 m gap between them (Fig. 1c). The resonance EO tuning efficiency (DC) is estimated to be 1.5 pm/V based on COMSOL simulations and perturbation theory Teraoka, Arnold, and Vollmer (2003). The simulation of EO microcomb generation and EO microring DC tuning characterization are detailed in Supplementary Notes 3 and 4 respectively.
Nanofabrication. The device fabrication started with a bare congruent LNOI wafer (NANOLN), which consists of a 600-nm-thick z-cut LN layer, a 2-m-thick thermal layer and a 500-m-thick Si substrate. First, the LN layer was thinned down to the target 580-nm thickness by argon () plasma etching Gong et al. (2020a). We then used electron beam lithography (EBL) to pattern the photonic circuits, and transferred the patterns into the LN layer with plasma etching. The etching depth is about 380 nm, leaving a 200-nm-thick LN slab unetched. Afterwards, we defined the electrode patterns via aligned EBL, deposited gold via thermal evaporation, and finished the fabrication with lift-off.
Microwave drive and feedback control circuitry. The 16-GHz microwave drive signal was generated by a commercial RF synthesizer (DS Instruments, SG24000H, phase noise -83 dBc/Hz at 100 Hz-10 kHz offsets). The drive signal was amplified and passed through a 50- terminated RF circulator before being delivered to the on-chip electrodes Zhang et al. (2019b) via a GSG RF probe (ACP-40-A-GSG-200, FormFactor).
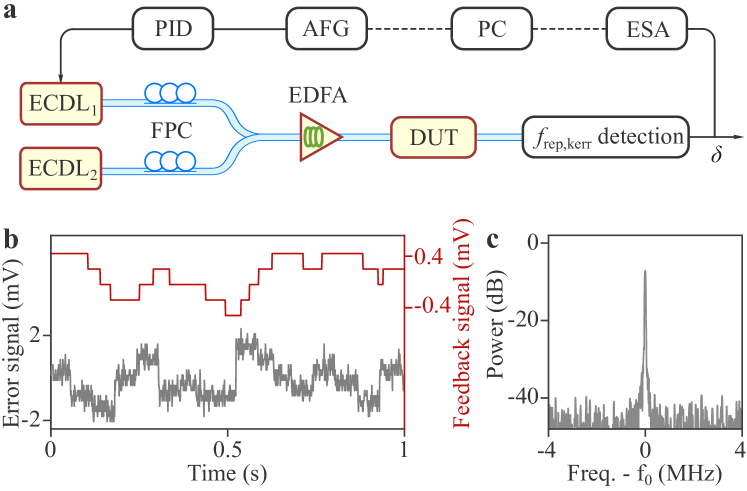
The proof-of-concept slow-speed feedback loop for stabilizing is shown in Fig. 5a. We used an electronic spectrum analyzer (N9020a, Agilent) to capture with the built-in peak-search function. The recorded was then compared to a frequency setpoint on a computer. The frequency errors were converted to a voltage waveform by an arbitrary function generator (NI USB-6251). We fed the error signal to a proportional-integral-derivative controller (DigiLock 110, Toptica) to generate the feedback signal for adjusting the Kerr pump laser frequency via its internal piezoelectric transducer.
Each feedback loop took approximately 60 ms to complete, translating to an effective feedback bandwidth of 17 Hz. While it took 9 ms for the ESA to scan over a 8-MHz frequency span (1000 data points, 40-kHz RBW) and find , most latency came from the computer executing the LabVIEW program (on Windows 10 operating system) and communication between the computer and instruments. Fig. 5c shows one example of the generated error signal and the corresponding feedback signal. The error signal was proportional to the frequency error by a ratio of 0.1 MHz/mV. The feedback signal drove the Kerr pump laser piezoelectric transducer, which has a frequency tunability of -3.3 MHz/mV and a 1-kHz actuation bandwidth, to reduce drifts. The on-chip Kerr pump power is fixed at 50 mW during the process.
In the current system, the beat note exhibits an optimal SNR of 30 dB at a 40-kHz RBW with the peak power reaching -17 dBm (Fig. 5b). The SNR is currently limited by the available EO comb sideband power (Fig. 3b). Since the EO comb is free-running during the measurement, cavity-pump detuning could drift and thus cause the EO comb line power to fluctuate. These factors combined prevent the fast locking of . We anticipate that the use of a microwave resonator Zhang et al. (2019b); Rueda et al. (2019) and Pound-Drever-Hall stabilization technique Stone et al. (2018) will improve the beat note SNR. A larger SNR, e.g., 53 dB at a 40-kHz RBW, could allow using a frequency counter to directly read , and a fast frequency locker (D2-135, Vescent Photonics, 500 kHz locking bandwidth) to enhance both the short-term and long-term stability of .
Data availability The data that support the findings of this study are available from the corresponding author upon reasonable request.
Code availability The codes used for simulations are available from the corresponding author upon reasonable request.
Acknowledgements. This work was supported by DARPA under its ACES program. H.X.T acknowledges support from NSF Center for Quantum Networks (EEC-1941583). Funding for materials used for this study is partially provided by DOE (DE-SC0019406). The authors thank Yong Sun, Sean Rinehart, Kelly Woods and Michael Rooks for assistance in the device fabrication.
Author contributions. H.X.T and Z.G. conceived the idea. Z.G. performed the device design, fabrication and measurement with the assistance from M.S., J.L, and J.S., Z.G. and M.S. performed the simulations. Z.G. and H.X.T. wrote the manuscript with the input from all other authors. H.X.T supervised the project.
Competing interests. The authors declare no competing interests.
Additional information. Supplementary information accompanies this manuscript.
references
- Diddams, Vahala, and Udem (2020) S. A. Diddams, K. Vahala, and T. Udem, “Optical frequency combs: Coherently uniting the electromagnetic spectrum,” Science 369, eaay3676 (2020).
- Fortier and Baumann (2019) T. Fortier and E. Baumann, “20 years of developments in optical frequency comb technology and applications,” Commun. Phys. 2, 153 (2019).
- Herr et al. (2014) T. Herr, V. Brasch, J. D. Jost, C. Y. Wang, N. M. Kondratiev, M. L. Gorodetsky, and T. J. Kippenberg, “Temporal solitons in optical microresonators,” Nat. Photon. 8, 145 (2014).
- Xue et al. (2015) X. Xue, Y. Xuan, Y. Liu, P.-H. Wang, S. Chen, J. Wang, D. E. Leaird, M. Qi, and A. M. Weiner, “Mode-locked dark pulse kerr combs in normal-dispersion microresonators,” Nat. Photon. 9, 594 (2015).
- Xiang et al. (2021) C. Xiang, J. Liu, J. Guo, L. Chang, R. N. Wang, W. Weng, J. Peters, W. Xie, Z. Zhang, J. Riemensberger, J. Selvidge, T. J. Kippenberg, and J. E. Bowers, “Laser soliton microcombs heterogeneously integrated on silicon,” Science 373, 99 (2021).
- Stern et al. (2018) B. Stern, X. Ji, Y. Okawachi, A. L. Gaeta, and M. Lipson, “Battery-operated integrated frequency comb generator,” Nature 562, 401 (2018).
- Chang et al. (2020) L. Chang, W. Xie, H. Shu, Q.-F. Yang, B. Shen, A. Boes, J. D. Peters, W. Jin, C. Xiang, S. Liu, G. Moille, S.-P. Yu, X. Wang, K. Srinivasan, S. B. Papp, K. Vahala, and J. E. Bowers, “Ultra-efficient frequency comb generation in algaas-on-insulator microresonators,” Nature Communications 11, 1331 (2020).
- Ji et al. (2017) X. Ji, F. A. S. Barbosa, S. P. Roberts, A. Dutt, J. Cardenas, Y. Okawachi, A. Bryant, A. L. Gaeta, and M. Lipson, “Ultra-low-loss on-chip resonators with sub-milliwatt parametric oscillation threshold,” Optica 4, 619 (2017).
- Yang et al. (2016) Q.-F. Yang, X. Yi, K. Y. Yang, and K. Vahala, “Stokes solitons in optical microcavities,” Nat. Phys. 13, 53 (2016).
- Cole et al. (2017) D. C. Cole, E. S. Lamb, P. Del’Haye, S. A. Diddams, and S. B. Papp, “Soliton crystals in kerr resonators,” Nat. Photon. 11, 671 (2017).
- Weng et al. (2020) W. Weng, R. Bouchand, E. Lucas, E. Obrzud, T. Herr, and T. J. Kippenberg, “Heteronuclear soliton molecules in optical microresonators,” Nature Communications 11, 2402 (2020).
- Tikan et al. (2021) A. Tikan, K. Riemensberger, J. Komagata, S. Hönl, C. Churaev, M. Skehan, H. Guo, R. N. Wang, J. Liu, P. Seidler, and T. J. Kippenberg, “Emergent nonlinear phenomena in a driven dissipative photonic dimer,” Nature Physics 17, 604 (2021).
- Li et al. (2017) Q. Li, T. C. Briles, D. A. Westly, T. E. Drake, J. R. Stone, B. R. Ilic, S. A. Diddams, S. B. Papp, and K. Srinivasan, “Stably accessing octave-spanning microresonator frequency combs in the soliton regime,” Optica 4, 193 (2017).
- Pfeiffer et al. (2017) M. H. P. Pfeiffer, C. Herkommer, J. Liu, H. Guo, M. Karpov, E. Lucas, M. Zervas, and T. J. Kippenberg, “Octave-spanning dissipative kerr soliton frequency combs in si_3n_4 microresonators,” Optica 4, 684 (2017).
- Gong et al. (2020a) Z. Gong, X. Liu, Y. Xu, and H. X. Tang, “Near-octave lithium niobate soliton microcomb,” Optica 7, 1275 (2020a).
- Yu et al. (2016) M. Yu, Y. Okawachi, A. G. Griffith, M. Lipson, and A. L. Gaeta, “Mode-locked mid-infrared frequency combs in a silicon microresonator,” Optica 3, 854 (2016).
- Liu et al. (2021) X. Liu, Z. Gong, A. W. Bruch, J. B. Surya, J. Lu, and H. X. Tang, “Aluminum nitride nanophotonics for beyond-octave soliton microcomb generation and self-referencing,” Nat. Commun. 12, 5428 (2021).
- He et al. (2021) Y. He, R. Lopez-Rios, Q. Yang, J. Ling, M. Li, K. Vahala, and Q. Lin, “Octave-spanning lithium niobate soliton microcombs,” in Conference on Lasers and Electro-Optics (Optical Society of America, 2021) p. STu2G.1.
- Kippenberg et al. (2018) T. J. Kippenberg, A. L. Gaeta, M. Lipson, and M. L. Gorodetsky, “Dissipative kerr solitons in optical microresonators,” Science 361, eaan8083 (2018).
- Newman et al. (2019) Z. L. Newman, V. Maurice, T. Drake, J. R. Stone, T. C. Briles, D. T. Spencer, C. Fredrick, Q. Li, D. Westly, B. R. Ilic, B. Shen, M.-G. Suh, K. Y. Yang, C. Johnson, D. M. S. Johnson, L. Hollberg, K. J. Vahala, K. Srinivasan, S. A. Diddams, J. Kitching, S. B. Papp, and M. T. Hummon, “Architecture for the photonic integration of an optical atomic clock,” Optica 6, 680 (2019).
- Drake et al. (2019) T. E. Drake, T. C. Briles, J. R. Stone, D. T. Spencer, D. R. Carlson, D. D. Hickstein, Q. Li, D. Westly, K. Srinivasan, S. A. Diddams, and S. B. Papp, “Terahertz-rate kerr-microresonator optical clockwork,” Phys. Rev. X 9, 031023 (2019).
- Spencer et al. (2018) D. T. Spencer, T. Drake, T. C. Briles, J. Stone, L. C. Sinclair, C. Fredrick, Q. Li, D. Westly, B. R. Ilic, A. Bluestone, N. Volet, T. Komljenovic, L. Chang, S. H. Lee, D. Y. Oh, M.-G. Suh, K. Y. Yang, M. H. P. Pfeiffer, T. J. Kippenberg, E. Norberg, L. Theogarajan, K. Vahala, N. R. Newbury, K. Srinivasan, J. E. Bowers, S. A. Diddams, and S. B. Papp, “An optical-frequency synthesizer using integrated photonics,” Nature 557, 81 (2018).
- Dutt et al. (2018) A. Dutt, C. Joshi, X. Ji, J. Cardenas, Y. Okawachi, K. Luke, A. L. Gaeta, and M. Lipson, “On-chip dual-comb source for spectroscopy,” Sci. Adv. 4, e1701858 (2018).
- Suh et al. (2016) M.-G. Suh, Q.-F. Yang, K. Y. Yang, X. Yi, and K. J. Vahala, “Microresonator soliton dual-comb spectroscopy,” Science 354, 600 (2016).
- Raja et al. (2019) A. S. Raja, A. S. Voloshin, H. Guo, S. E. Agafonova, J. Liu, A. S. Gorodnitskiy, M. Karpov, N. G. Pavlov, E. Lucas, R. R. Galiev, A. E. Shitikov, J. D. Jost, M. L. Gorodetsky, and T. J. Kippenberg, “Electrically pumped photonic integrated soliton microcomb,” Nat. Commun. 10, 680 (2019).
- Jin et al. (2021) W. Jin, Q.-F. Yang, L. Chang, B. Shen, H. Wang, , M. A. Leal, L. Wu, M. Gao, A. Feshali, M. Paniccia, K. J. Vahala, and J. E. Bowers, “Hertz-linewidth semiconductor lasers using cmos-ready ultra-high-q microresonators,” Nature Photonics 15, 346 (2021).
- Del’Haye, Papp, and Diddams (2012) P. Del’Haye, S. B. Papp, and S. A. Diddams, “Hybrid electro-optically modulated microcombs,” Phys. Rev. Lett. 109, 263901 (2012).
- Yu et al. (2019) S.-P. Yu, T. C. Briles, G. T. Moille, X. Lu, S. A. Diddams, K. Srinivasan, and S. B. Papp, “Tuning kerr-soliton frequency combs to atomic resonances,” Phys. Rev. Appl. 11, 044017 (2019).
- Wang et al. (2020) B. Wang, Z. Yang, X. Zhang, and X. Yi, “Vernier frequency division with dual-microresonator solitons,” Nat. Commun. 11, 3975 (2020).
- Liu et al. (2020) J. Liu, E. Lucas, A. S. Raja, J. He, J. Riemensberger, R. N. Wang, M. Karpov, H. Guo, R. Bouchand, and T. J. Kippenberg, “Photonic microwave generation in the x- and k-band using integrated soliton microcombs,” Nature Photonics 14, 486 (2020).
- Yang et al. (2018) K. Y. Yang, D. Y. Oh, S. H. Lee, Q.-F. Yang, X. Yi, B. Shen, H. Wang, and K. Vahala, “Bridging ultrahigh-q devices and photonic circuits,” Nature Photonics 12, 297 (2018).
- Zhang et al. (2019a) S. Zhang, J. M. Silver, X. Shang, L. Del Bino, N. M. Ridler, and P. Del’Haye, “Terahertz wave generation using a soliton microcomb,” Opt. Express 27, 35257 (2019a).
- Jung et al. (2014) H. Jung, R. Stoll, X. Guo, D. Fischer, and H. X. Tang, “Green, red, and ir frequency comb line generation from single ir pump in aln microring resonator,” Optica 1, 396 (2014).
- Wilson et al. (2019) D. J. Wilson, K. Schneider, S. Hönl, M. Anderson, Y. Baumgartner, L. Czornomaz, T. J. Kippenberg, and P. Seidler, “Integrated gallium phosphide nonlinear photonics,” Nat. Photon. 14, 57 (2019).
- He et al. (2019) Y. He, Q.-F. Yang, J. Ling, R. Luo, H. Liang, M. Li, B. Shen, H. Wang, K. Vahala, and Q. Lin, “Self-starting bi-chromatic linbo3 soliton microcomb,” Optica 6, 1138 (2019).
- Bruch et al. (2021) A. W. Bruch, X. Liu, Z. Gong, J. B. Surya, M. Li, C.-L. Zou, and H. X. Tang, “Pockels soliton microcomb,” Nat. Photon. 15, 21 (2021).
- Guo et al. (2018) X. Guo, C.-L. Zou, H. Jung, Z. Gong, A. Bruch, L. Jiang, and H. X. Tang, “Efficient generation of a near-visible frequency comb via cherenkov-like radiation from a kerr microcomb,” Phys. Rev. Applied 10, 014012 (2018).
- Lu et al. (2019) J. Lu, J. B. Surya, X. Liu, A. W. Bruch, Z. Gong, Y. Xu, and H. X. Tang, “Periodically poled thin-film lithium niobate microring resonators with a second-harmonic generation efficiency of 250,000%/w,” Optica 6, 1455 (2019).
- Luo et al. (2018) R. Luo, Y. He, H. Liang, M. Li, and Q. Lin, “Highly tunable efficient second-harmonic generation in a lithium niobate nanophotonic waveguide,” Optica 5, 1006 (2018).
- Bruch et al. (2018) A. W. Bruch, X. Liu, X. Guo, J. B. Surya, Z. Gong, L. Zhang, J. Wang, J. Yan, and H. X. Tang, “17000%/w second-harmonic conversion efficiency in single-crystalline aluminum nitride microresonators,” Appl. Phys. Lett. 113, 131102 (2018).
- Wang et al. (2019) C. Wang, M. Zhang, M. Yu, R. Zhu, H. Hu, and M. Loncar, “Monolithic lithium niobate photonic circuits for kerr frequency comb generation and modulation,” Nat. Commun. 10, 978 (2019).
- Zhang et al. (2019b) M. Zhang, B. Buscaino, C. Wang, A. Shams-Ansari, C. Reimer, R. Zhu, J. M. Kahn, and M. Lončar, “Broadband electro-optic frequency comb generation in a lithium niobate microring resonator,” Nature 568, 373 (2019b).
- Zhang et al. (2021) M. Zhang, C. Wang, P. Kharel, D. Zhu, and M. Lončar, “Integrated lithium niobate electro-optic modulators: when performance meets scalability,” Optica 8, 652 (2021).
- Gong et al. (2019) Z. Gong, X. Liu, Y. Xu, M. Xu, J. B. Surya, J. Lu, A. Bruch, C. Zou, and H. X. Tang, “Soliton microcomb generation at 2 m in z-cut lithium niobate microring resonators,” Opt. Lett. 44, 3182 (2019).
- Okawachi et al. (2020) Y. Okawachi, M. Yu, B. Desiatov, B. Y. Kim, T. Hansson, M. Lončar, and A. L. Gaeta, “Chip-based self-referencing using integrated lithium niobate waveguides,” Optica 7, 702 (2020).
- Yu et al. (2020) M. Yu, Y. Okawachi, R. Cheng, C. Wang, M. Zhang, A. L. Gaeta, and M. Lončar, “Raman lasing and soliton mode-locking in lithium niobate microresonators,” Light: Science & Applications 9, 9 (2020).
- Gong et al. (2020b) Z. Gong, M. Li, X. Liu, Y. Xu, J. Lu, A. Bruch, J. B. Surya, C. Zou, and H. X. Tang, “Photonic dissipation control for kerr soliton generation in strongly raman-active media,” Phys. Rev. Lett. 125, 183901 (2020b).
- Gong et al. (2018) Z. Gong, A. Bruch, M. Shen, X. Guo, H. Jung, L. Fan, X. Liu, L. Zhang, J. Wang, J. Li, J. Yan, and H. X. Tang, “High-fidelity cavity soliton generation in crystalline AlN micro-ring resonators,” Opt. Lett. 43, 4366 (2018).
- Yariv, Yariv, and Yeh (2007) A. Yariv, P. Yariv, and P. Yeh, Photonics: Optical Electronics in Modern Communications, Oxford series in electrical and computer engineering (Oxford University Press, 2007).
- Sun et al. (2017) X. Sun, H. Liang, R. Luo, W. C. Jiang, X.-C. Zhang, and Q. Lin, “Nonlinear optical oscillation dynamics in high-q lithium niobate microresonators,” Opt. Express 25, 13504 (2017).
- Yi et al. (2017) X. Yi, Q.-F. Yang, X. Zhang, K. Y. Yang, X. Li, and K. Vahala, “Single-mode dispersive waves and soliton microcomb dynamics,” Nature Communications 8, 14869 (2017).
- Lucas et al. (2020) E. Lucas, P. Brochard, R. Bouchand, S. Schilt, T. Südmeyer, and T. J. Kippenberg, “Ultralow-noise photonic microwave synthesis using a soliton microcomb-based transfer oscillator,” Nature Communications 11, 374 (2020).
- Rueda et al. (2019) A. Rueda, F. Sedlmeir, M. Kumari, G. Leuchs, and H. G. L. Schwefel, “Resonant electro-optic frequency comb,” Nature 568, 378 (2019).
- Teraoka, Arnold, and Vollmer (2003) I. Teraoka, S. Arnold, and F. Vollmer, “Perturbation approach to resonance shifts of whispering-gallery modes in a dielectric microsphere as a probe of a surrounding medium,” J. Opt. Soc. Am. B 20, 1937 (2003).
- Stone et al. (2018) J. R. Stone, T. C. Briles, T. E. Drake, D. T. Spencer, D. R. Carlson, S. A. Diddams, and S. B. Papp, “Thermal and nonlinear dissipative-soliton dynamics in kerr-microresonator frequency combs,” Phys. Rev. Lett. 121, 063902 (2018).
Monolithic Kerr and electro-optic hybrid microcombs, Gong et al.
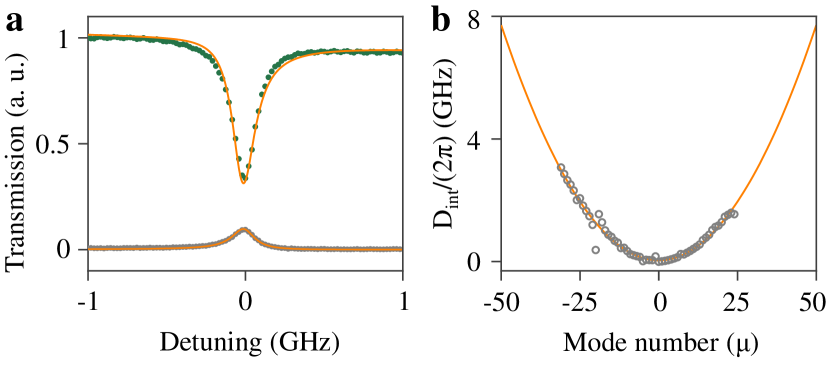
Supplementary Figure 6a shows typical resonant spectra of the pump mode used for Kerr soliton generation, measured respectively from the through-port and drop-port waveguides. The dip in the through-port (peak in the drop-port) spectrum corresponds to a resonance at 1549.5 nm. The mode intrinsic decay rate and external coupling rates can be extracted by fitting the spectra and found to be 106 MHz, 13 MHz (drop-port), and 58 MHz (through-port) respectively. The mode integrated dispersion is measured Huang et al. (2015) and shown in Supplementary Figure 6b. Here, the dispersion measurement is limited by our laser scanning range (1480 nm to 1640 nm). A quadratic fitting reveals a dominant second order dispersion of 6 MHz Herr et al. (2014) over the telecomb band, agreeing well with the simulation presented in the main text.
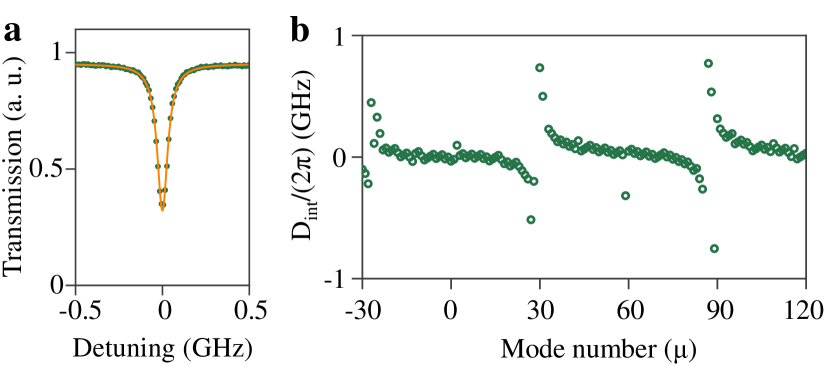
A typical EO microring resonance spectrum at 1556 nm is shown in Supplementary Figure 7a. The mode intrinsic decay rate and external coupling rate are extracted to be 60 MHz and 20 MHz respectively. The measured integrated dispersion around the pump mode is presented in Supplementary Figure 7b. Strong mode-crossings are observed around = -30, = 30 and = 90, causing local resonance frequency shifts which could distort EO comb spectrum. In particular, mode-crossings around = 30 and = 90 may be responsible for EO comb profile distortions at 193.4 THz and 194.2 THz respectively (see the second and fourth spectra in Fig. 2b of the main text). To mitigate mode-crossings, one could introduce a single-mode ”filtering” section along the EO microring Kordts et al. (2016).
The Mach-Zehnder interferometer (MZI) used for microring dispersion measurement Huang et al. (2015) has a FSR of 50.2 MHz. Due to the relatively small EO microring dispersion (, estimated to be 2.5 kHz), we are unable to accurately extract the actual value within the vicinity of the pump mode before strong mode-crossings show up. We expect that reducing the MZI FSR, e.g., down to 200 kHz, can help improve measurement accuracy.
Supplementary Note 2:
Outgoing Kerr soliton microcomb from the drop-port waveguide
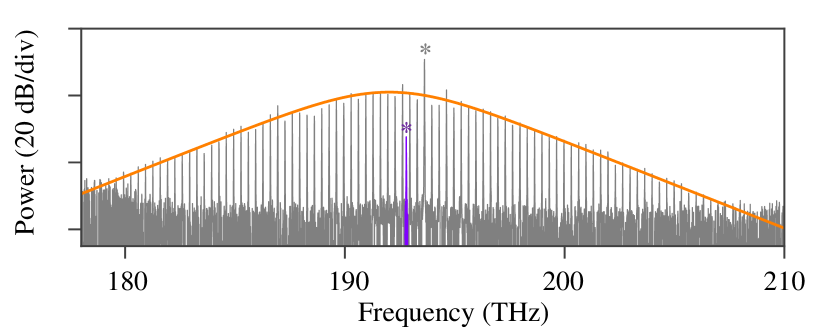
The add-drop configuration of the Kerr soliton microring allows for direct access of the soliton microcomb from the drop-port waveguide, where the soliton is not filtered by the EO microring. Supplementary Figure 8 shows one example of the outgoing Kerr soliton spectrum from the drop-port waveguide. The soliton spectrum exhibits a FWHM of 5.9 THz under a 60-mW on-chip pump power. Here, a weak EO pump signal appears on the spectrum. This may be due to residual reflection in between facets and couplers.
Supplementary Note 3:
Numerical simulations of electro-optic microcomb generation
In the EO microring, the normalized electric field of a mode (by the sqaure root of its photon number) can be written as
| (2) |
where , and denote the spatial distribution, angular frequency and azimuthal number of the mode respectively. Optical modes are mutually orthogonal and their electric field distributions satisfy
| (3) | ||||
with referring to the vacuum (relative) permittivity. Now, consider that the EO microring is modulated by a strong in-plane RF electric field with an angular frequency of and an amplitude distribution of ( is in units of V/m, representing the RF drive strength) respectively, the EO interaction Hamiltonian between the optical modes and can be given by
| (4) |
where is the total electric field of the two optical modes and the RF drive. and are the Bosonic operators of the two optical modes. Here, we neglect high-frequency rotating terms and only consider the dominant electric field components of the modes and the RF drive (along LN Y-axis). Based on Eq. 3 and 4, we introduce the EO coupling strength () as
| (5) |
Note that in order to achieve effective coupling between the two optical modes, the RF field azimuthal distribution needs to compensate the phase mismatch between optical modes, i.e., .
In the experiment, the RF drive is strong and its frequency is set close to the EO microring FSR, leading to an effective linear coupling between adjacent modes under non-depletion approximation Rueda et al. (2019). The linearised interaction Hamiltonian among modes can be written as
| (6) |
Assuming that is constant across the modes of interest and the RF drive has a 14-V peak amplitude, can be estimated as 280 MHz via COMSOL simulations.
Based on the system Hamiltonian ( , ignoring Kerr and Raman effects), the mean field dynamics of each mode can be derived as follows
| (7) |
where , with denoting the pump resonance (pump field) angular frequency, and representing the EO microring FSR. is the total decay rate for the mode, consisting of intrinsic cavity decay rate () and coupling rate to the external bus waveguide (). The functions in Eq. 7 accounts for the phase-matching condition.
We move on to simulate EO microcomb formation by numerically solving the coupled mode equations (Eq. 7) using experimental parameters. The simulated spectrum is shown in Supplementary Figure 9, which agrees well with measured spectrum.
Supplementary Note 4:
Characterization of EO microring DC tuning
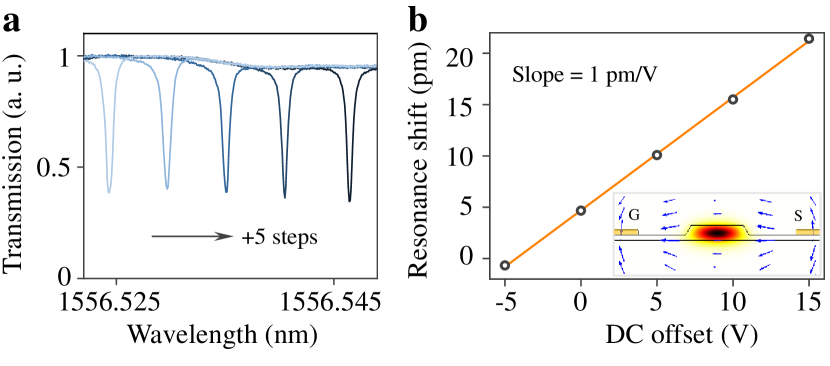
Finally, we experimentally and numerically characterized the modulator DC tuning efficiency. To avoid cancellation of EO modulation (a GSG probe was used here), we applied DC voltages across one racetrack arm and measured resonance spectra. The shifted resonance spectra under different DC offsets are plotted in Supplementary Figure 10a. The resonance tuning efficiency is extracted to be 1 pm/V for modulating one racetrack arm, which infers a 2-pm/V tuning efficiency for modulating the entire microring in a push-pull manner Wang et al. (2018). The inferred tuning efficiency is a bit higher than the simulated one (1.5 pm/V). The difference may be due to the mode crossing Xue et al. (2015) and uncertainties in material parameters. In simulations, LN refractive indices along Y(X)-axis and Z-axis are set as 2.21 and 2.14 respectively; LN DC dielectric constants along Y(X)-axis and Z-axis are set as 80 and 30 respectively.
references
- Huang et al. (2015) S.-W. Huang, H. Zhou, J. Yang, J. F. McMillan, A. Matsko, M. Yu, D.-L. Kwong, L. Maleki, and C. W. Wong, “Mode-locked ultrashort pulse generation from on-chip normal dispersion microresonators,” Phys. Rev. Lett. 114, 053901 (2015).
- Herr et al. (2014) T. Herr, V. Brasch, J. D. Jost, C. Y. Wang, N. M. Kondratiev, M. L. Gorodetsky, and T. J. Kippenberg, “Temporal solitons in optical microresonators,” Nat. Photon. 8, 145 (2014).
- Kordts et al. (2016) A. Kordts, M. H. P. Pfeiffer, H. Guo, V. Brasch, and T. J. Kippenberg, “Higher order mode suppression in high-q anomalous dispersion sin microresonators for temporal dissipative kerr soliton formation,” Opt. Lett. 41, 452 (2016).
- Rueda et al. (2019) A. Rueda, F. Sedlmeir, M. Kumari, G. Leuchs, and H. G. L. Schwefel, “Resonant electro-optic frequency comb,” Nature 568, 378 (2019).
- Wang et al. (2018) C. Wang, M. Zhang, B. Stern, M. Lipson, and M. Lončar, “Nanophotonic lithium niobate electro-optic modulators,” Opt. Express 26, 1547 (2018).
- Xue et al. (2015) X. Xue, Y. Xuan, P.-H. Wang, Y. Liu, D. E. Leaird, M. Qi, and A. M. Weiner, “Normal-dispersion microcombs enabled by controllable mode interactions,” Laser & Photonics Reviews 9, L23 (2015).