Low-mass members of nearby young stellar moving groups from Gaia EDR3
Abstract
Gaia EDR3 offers greatly improved kinematics for nearby objects, including members of nearby young stellar moving groups (NYMGs). In this study, we aim to identify low-mass NYMG members (spectral types of M0 to mid-L) in Gaia EDR3. We calculated spatio-kinematic membership probabilities utilising a Bayesian membership probability calculation scheme developed in our previous study. We evaluated stellar youth primarily based on colour-magnitude diagram positions. Combining spatio-kinematic membership assessment and youth evaluation, we identified 2900 low-mass NYMG candidate members including 700 previously claimed members. In the set of 2200 new candidate members, 550 appear to be young based on NUV brightness. Our pilot spectroscopic study with WiFeS on the ANU 2.3-m telescope observed 78 candidates, with 79 per cent confirmed as members. Using our new member sample, we estimated an isochronal age of the Pictoris Moving Group. The mean age (10 Myr), which is around half the age of recent estimates, suggests either a truly younger age of the Pictoris Moving Group or inaccuracies in contemporary isochrones. As the main results of this study, we provide lists of newly confirmed and candidate low-mass NYMG members.
keywords:
(Galaxy:) open clusters and associations – (Galaxy:) solar neighborhood – stars: low-mass – stars: late-type – (stars:) brown dwarfs1 Introduction
Nearby, young stellar moving groups (NYMGs hereafter) are loose stellar associations whose members are gravitationally unbound (Zuckerman & Song, 2004). Their young ages (150 Myr) and proximity (mean distances 100 pc) provide unique opportunities in contemporary astronomy. Members spanning various spectral types with well-defined ages are used in studying empirical isochrones (Herczeg & Hillenbrand, 2015; Liu et al., 2016). They have been prime targets for direct imaging of exoplanets and used as a laboratory for studying planetary formation and evolution (Marois et al., 2008, 2010; Lagrange et al., 2010; Chauvin et al., 2017).
Their brown dwarf members are also excellent analogs to directly imaged giant exoplanets (Faherty et al., 2013a, b).
Moreover, because their lowest mass members can be identified more easily compared to older and/or more distant stellar groups, NYMGs are also useful for investigating stellar mass functions (Kraus et al., 2014; Shkolnik et al., 2017). As sparse groups, studying the formation environment of NYMGs is crucial to understanding the evolution and dispersion of clusters (Schlieder et al., 2012).
Because of their importance and utility, the identification of NYMGs and their members has been a hot topic over the past two decades (e.g., Zuckerman et al. 2001; Zuckerman & Song 2004; Murphy et al. 2010; Schlieder et al. 2012; Rodriguez et al. 2013; Malo et al. 2013; Gagné et al. 2014; Shkolnik et al. 2017; Bell et al. 2017; Gagné et al. 2018a; Schneider et al. 2019). These co-moving members of NYMGs are identified primarily based on their spatial position and velocity. While the keys in the identification of NYMG members are the same (i.e., using their spatial position and motion), details in the selection differ between various authors (e.g., Schlieder et al. 2012; Shkolnik et al. 2012; Rodriguez et al. 2013; Malo et al. 2013; Gagné et al. 2014; Riedel et al. 2017; Crundall et al. 2019). One of the most successful NYMG membership identification schemes is the BANYAN series which is based on Bayesian statistics (Malo et al., 2013; Gagné et al., 2014, 2018a). Similar to the BANYAN method, we have developed a membership probability calculation scheme, the Bayesian Analysis of Moving Groups (BAMG; Lee & Song 2018, Paper I). BAMG offers several improvements over BANYAN such as using a more realistic field star model (Paper I) and less dependency on the initial choice of members (Lee & Song, 2019a, Paper II). The most recent version of the BAMG code updates the groups based on the unsupervised machine learning analysis of nine known NYMGs (Lee & Song, 2019b, Paper III). Using 652 previously confirmed members of the nine NYMGs, our unsupervised machine learning analysis recognized eight distinct groups. In this paper, we utilise the properties of the eight recognized moving groups to identify previously unknown low-mass members included in the Gaia EDR3 catalogue.
The most recent data release from the Gaia mission (Gaia Collaboration et al., 2016), Gaia Early Data Release 3 (EDR3) (Gaia Collaboration et al., 2021) enables the identification of very low-mass NYMG members thanks to precise parallax measurements. The available parallax information can also be used for the assessment of youth (150 Myr) from colour-magnitude diagrams because young stars and brown dwarfs are over-luminous compared to their older counterparts. Additionally, Gaia EDR3 includes RV measurements (Seabroke et al., 2021) for some stars down to early-M type stars, which makes a complete set of astrometric parameters to calculate robust NYMG membership probabilities. In this study, we present 2200 new low-mass (spectral types of M0 to mid-L) NYMG candidate members identified by a combined assessment of their spatio-kinematic membership and youth.
We describe the method in Section 2 followed by the results in Section 3, including the pilot spectroscopic observations. The population statistics of young nearby objects are discussed in Section 4, including a reassessment of the isochronal age of the Pictoris Moving Group using the newly confirmed membership. The conclusion and summary of this paper are presented in Section 5.
2 Method
To be assessed as a new member of a NYMG, a candidate’s position, velocity, and age should be consistent with those of known NYMG members. For identifying low-mass NYMG members, we apply two restrictions to Gaia EDR3 at the beginning of this study: distance and colour. We limit distance to 150 pc and colour to 1.8, which corresponds to a spectral type of M0V or later. These two restrictions retain 1.5 million sources. Beginning with this initial dataset, candidates are selected based on their spatio-kinematic membership and a youth assessment.
2.1 Spatio-kinematic membership assessment
Spatio-kinematic membership is assessed using the Bayesian Analysis of Moving Groups code (BAMG111Calculation is available at http://movinggroups.org; Lee & Song 2018, 2019a, Paper I and II). This tool requires ellipsoidal models of the NYMGs under consideration. The ellipsoidal models in positional space () and velocity space () are treated independently, which assumes the correlation between spatial and kinematic properties is small enough to be neglected. A recent study by Lee & Song (2019b, Paper III) evaluated all known NYMGs (150 Myr and a mean distance 100 pc: 9 groups) and identified 8 groups: TW Hydrae Association (TWA), Pictoris Moving Group (BPMG), Carina Association (Carina), Argus Association (Argus), AB Doradus Moving Group (ABDor), and Volans-Carina Association (VCA), 32 Ori-Columba Association (ThOrCol), Tucana-Horologium-Columba Association (TucCol). Using an iterative model construction method described in Paper II, we constructed ellipsoidal models of these 8 NYMGs. Table 1 describes the parameters of our adopted ellipsoidal NYMG models.
| Name | ||||||||||||||||||
|---|---|---|---|---|---|---|---|---|---|---|---|---|---|---|---|---|---|---|
| pc | pc | km s-1 | km s-1 | |||||||||||||||
| TWA | 15.0 | -48.9 | 23.7 | 12.6 | 6.3 | 5.2 | -134 | -14 | 7 | -12.4 | -18.6 | -5.8 | 2.7 | 1.6 | 1.1 | -134 | -11 | -54 |
| BPMG | 25.4 | -0.2 | -20.7 | 31.2 | 15.8 | 8.0 | -166 | -11 | -21 | -9.4 | -15.8 | -8.8 | 2.5 | 1.7 | 1.0 | -180 | 24 | -57 |
| ThOrCol | -47.5 | -41.6 | -28.8 | 45.2 | 16.0 | 6.0 | -161 | 3 | 21 | -11.2 | -21.7 | -7.9 | 4.8 | 2.7 | 2.4 | -134 | 46 | 69 |
| TucCol | 17.3 | -24.0 | -38.2 | 19.1 | 10.5 | 3.3 | 124 | -36 | 20 | -9.1 | -20.6 | -2.7 | 4.4 | 2.6 | 1.7 | -172 | 44 | -47 |
| Carina | -6.0 | -86.0 | -36.4 | 51.0 | 26.8 | 20.5 | -129 | -40 | -158 | -12.4 | -21.7 | -4.1 | 3.6 | 2.9 | 1.8 | 175 | 13 | -34 |
| Argus | 10.7 | -121.3 | -19.9 | 37.2 | 23.6 | 6.1 | 116 | -4 | 0 | -23.0 | -14.0 | -5.9 | 2.8 | 2.2 | 1.2 | -156 | 7 | 25 |
| ABDor | -0.9 | 3.5 | -11.0 | 28.3 | 23.7 | 22.8 | -163 | 18 | 76 | -12.1 | -23.4 | -9.7 | 10.6 | 4.8 | 3.9 | -149 | 27 | 11 |
| VCA | 20.9 | -83.2 | -15.7 | 4.1 | 3.0 | 1.9 | -72 | 8 | -72 | -16.0 | -29.6 | -1.1 | 5.4 | 0.9 | 0.6 | -103 | 8 | 15 |
In the spatio-kinematic membership probability () calculation, a candidate’s six astrometric parameters are required: R.A., Dec., proper motions in R.A. and Dec., distance, and radial velocity (RV). In the case of missing RV, a less robust membership probability can still be calculated by marginalising over RV. In Gaia EDR3, only a subset of sources has RV measurements (31,000 of the 1.5 million sources).
To be considered as potential candidate members, we adopt a threshold of 90 per cent as was used in Paper II. If an EDR source has 90 per cent in any of the eight NYMGs considered in this paper, then the source is retained as a candidate member. Sources having a marginal value (90 per cent) for a group but the sum of across multiple groups over the threshold (90) are retained; they are considered as having ambiguous membership status for a single group. For more details on the BAMG algorithm and the definition of these moving groups, we refer the reader to Papers I, II, and III and references therein (Lee & Song, 2018, 2019a, 2019b).
2.2 Youth assessment
In 6-D position and velocity space, NYMG members show overdensities in certain regions. However, even in such ranges, old field stars appear to be the dominant population. This means that any membership survey solely based on spatio-kinematics (i.e., position and velocity) will suffer from false positives from old interlopers. Therefore, an assessment of youth is a pivotal step in any reliable NYMG membership survey. Young low-mass stars have strong surface magnetic fields manifested as strong X-ray emission and/or chromospheric UV emission (Kastner et al., 1997; Rodriguez et al., 2013). Strong H emission and stronger Li absorption compared to field stars are also used as signs of youth (Zuckerman & Song, 2004; Song et al., 2012; Murphy et al., 2013). In the low-mass regime, young objects (150 Myr) are still contracting after their formation (Burrows et al., 2001; Marley et al., 2007), making them over-luminous on colour-magnitude diagrams (CMDs). The high-quality parallaxes and sensitive photometry of Gaia EDR3 can therefore be used to readily select young object candidates.
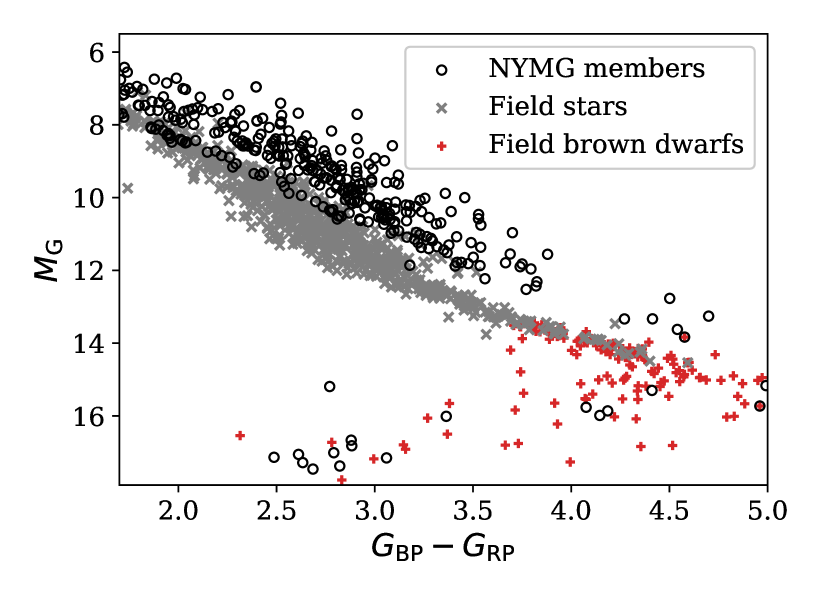
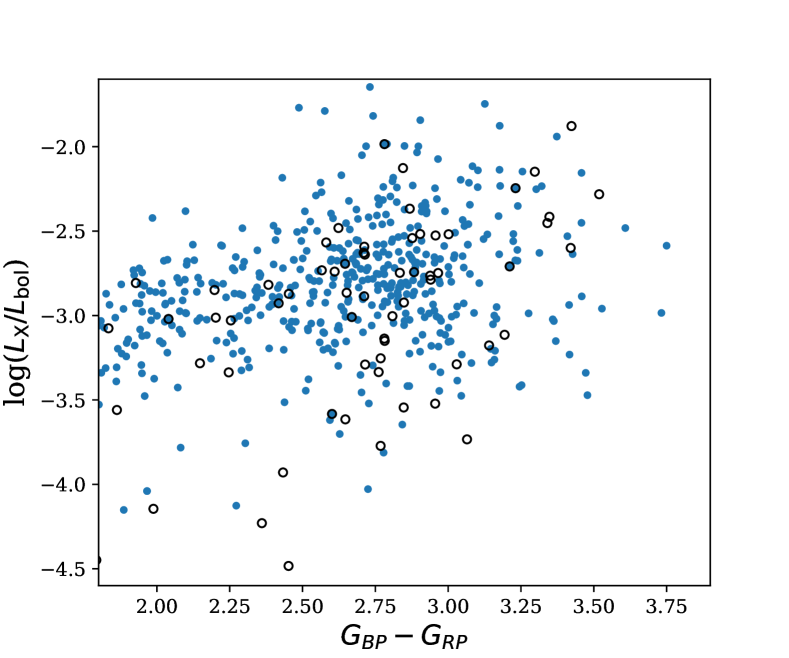
We evaluated youth (150 Myr) primarily based on CMDs with magnitudes from GALEX DR5 (Bianchi et al., 2011) and X-ray luminosities () from the Second ROSAT All-Sky Survey Point Source Catalog (2RXS; Boller et al. 2016) used as supplementary evidence of youth. A CMD of bona fide NYMG members from Paper II and field stars is shown in Fig. 1. The NYMG members are well separated from field stars in the range 14 mag. At 14 mag, colours of known NYMG members which are mostly brown dwarfs become bluer. =14 corresponds to 2500-2700 K (BHAC15; Baraffe et al. 2015). The objects with an effective temperature cooler than 2700 K are defined as ultracool dwarfs (Kirkpatrick et al., 1997), which correspond to spectral types of M7 or later. In this study, we split candidate members at =14 for effective youth assessment [14 mag; cool dwarfs (M0 to mid-M), 14 mag; ultracool dwarfs (late-M to mid-L)].
2.2.1 Cool dwarfs
Stellar youth (150 Myr) for cool dwarfs was evaluated primarily based on the vs colour-magnitude diagram (Fig. 1), which well separates NYMG members (10-150 Myr) from old field stars. However, these young and old stars cannot be perfectly distinguished at a sharp boundary, rather there is a combination of some young and old stars at the boundary region; this combination might be caused by uncertainties on data (colour, magnitude, and parallax), multiplicity, and/or a mixture of young field stars.
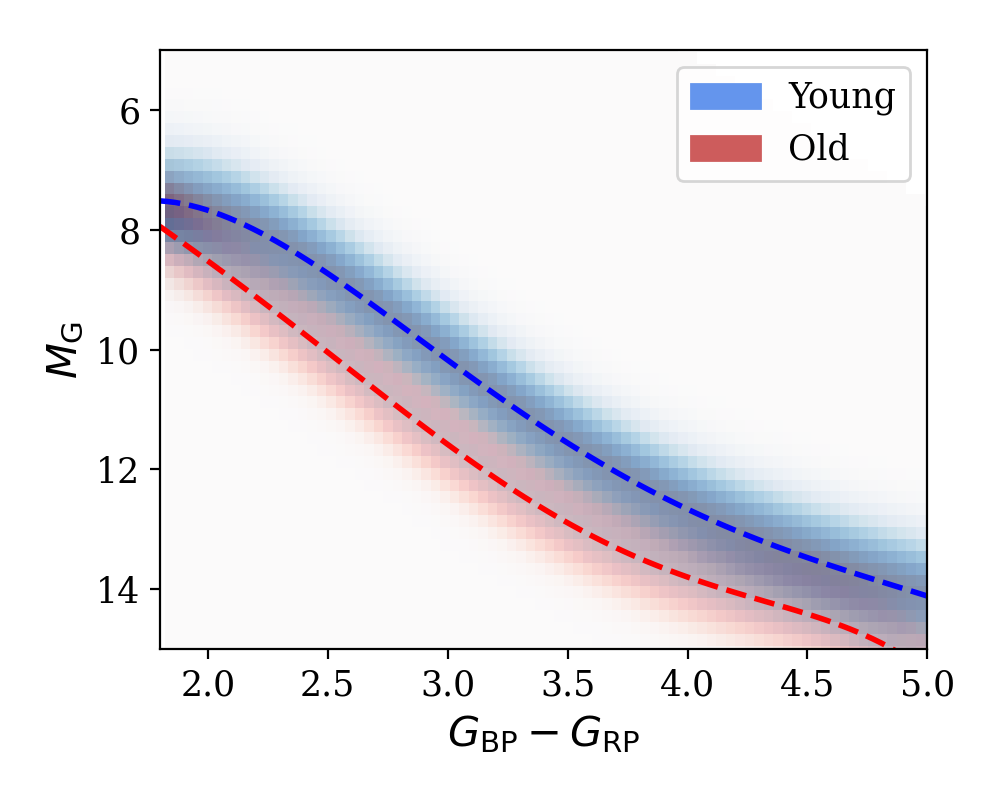
Utilising this characteristic on the CMD, we created a parameter, Youth(CMD) to quantify how close a star’s position on the CMD is to that of young stars. The Youth(CMD) value does not reflect the true likelihood of the young and old star populations. The value is taken from a model map (Fig. 2) representing the ratio of young and field stars assuming an equal population of young and field stars at a given colour on the CMD. The Youth(CMD) value ranges from 0.0 to 1.0, which corresponds to the CMD position of old and young stars, respectively. Young stars have a Youth(CMD) value close to 1.0. Details on the production of the Youth(CMD) map are given in Appendix A.
Unresolved old binaries or multiple systems in EDR3 can be misidentified as potential young stars from the Youth(CMD) analysis. The angular resolution of the Gaia observations implies that binaries with 0.4 arcsec separation would have been resolved as two sources.
Unresolved, close binaries (separation0.4 arcsec) can have excess astrometric noise which represents the disagreement between the observations and the best-fitting standard (e.g., single) astrometric model. Gaia catalogue parameters (astrometric_excess_noise and astrometric_excess_noise_sig), or the ratio of these two parameters (Lindegren et al., 2021), can potentially be used to flag unresolved binaries among EDR3 sources. Assuming Gaia EDR3 sources with measured RVs without noticeable variation in RV are single stars, we compared the ratio of astrometric_excess_noise and astrometric_excess_noise_sig among NYMG candidates with and without measured RVs. We found no meaningful difference in the comparison.
In conjunction with the fact that young and old sequences on the CMD (dashed lines in Fig. 2) are well separated (11.5 magnitudes), this result likely implies that the contamination level in our selected NYMG candidates due to old, unresolved binaries is small.
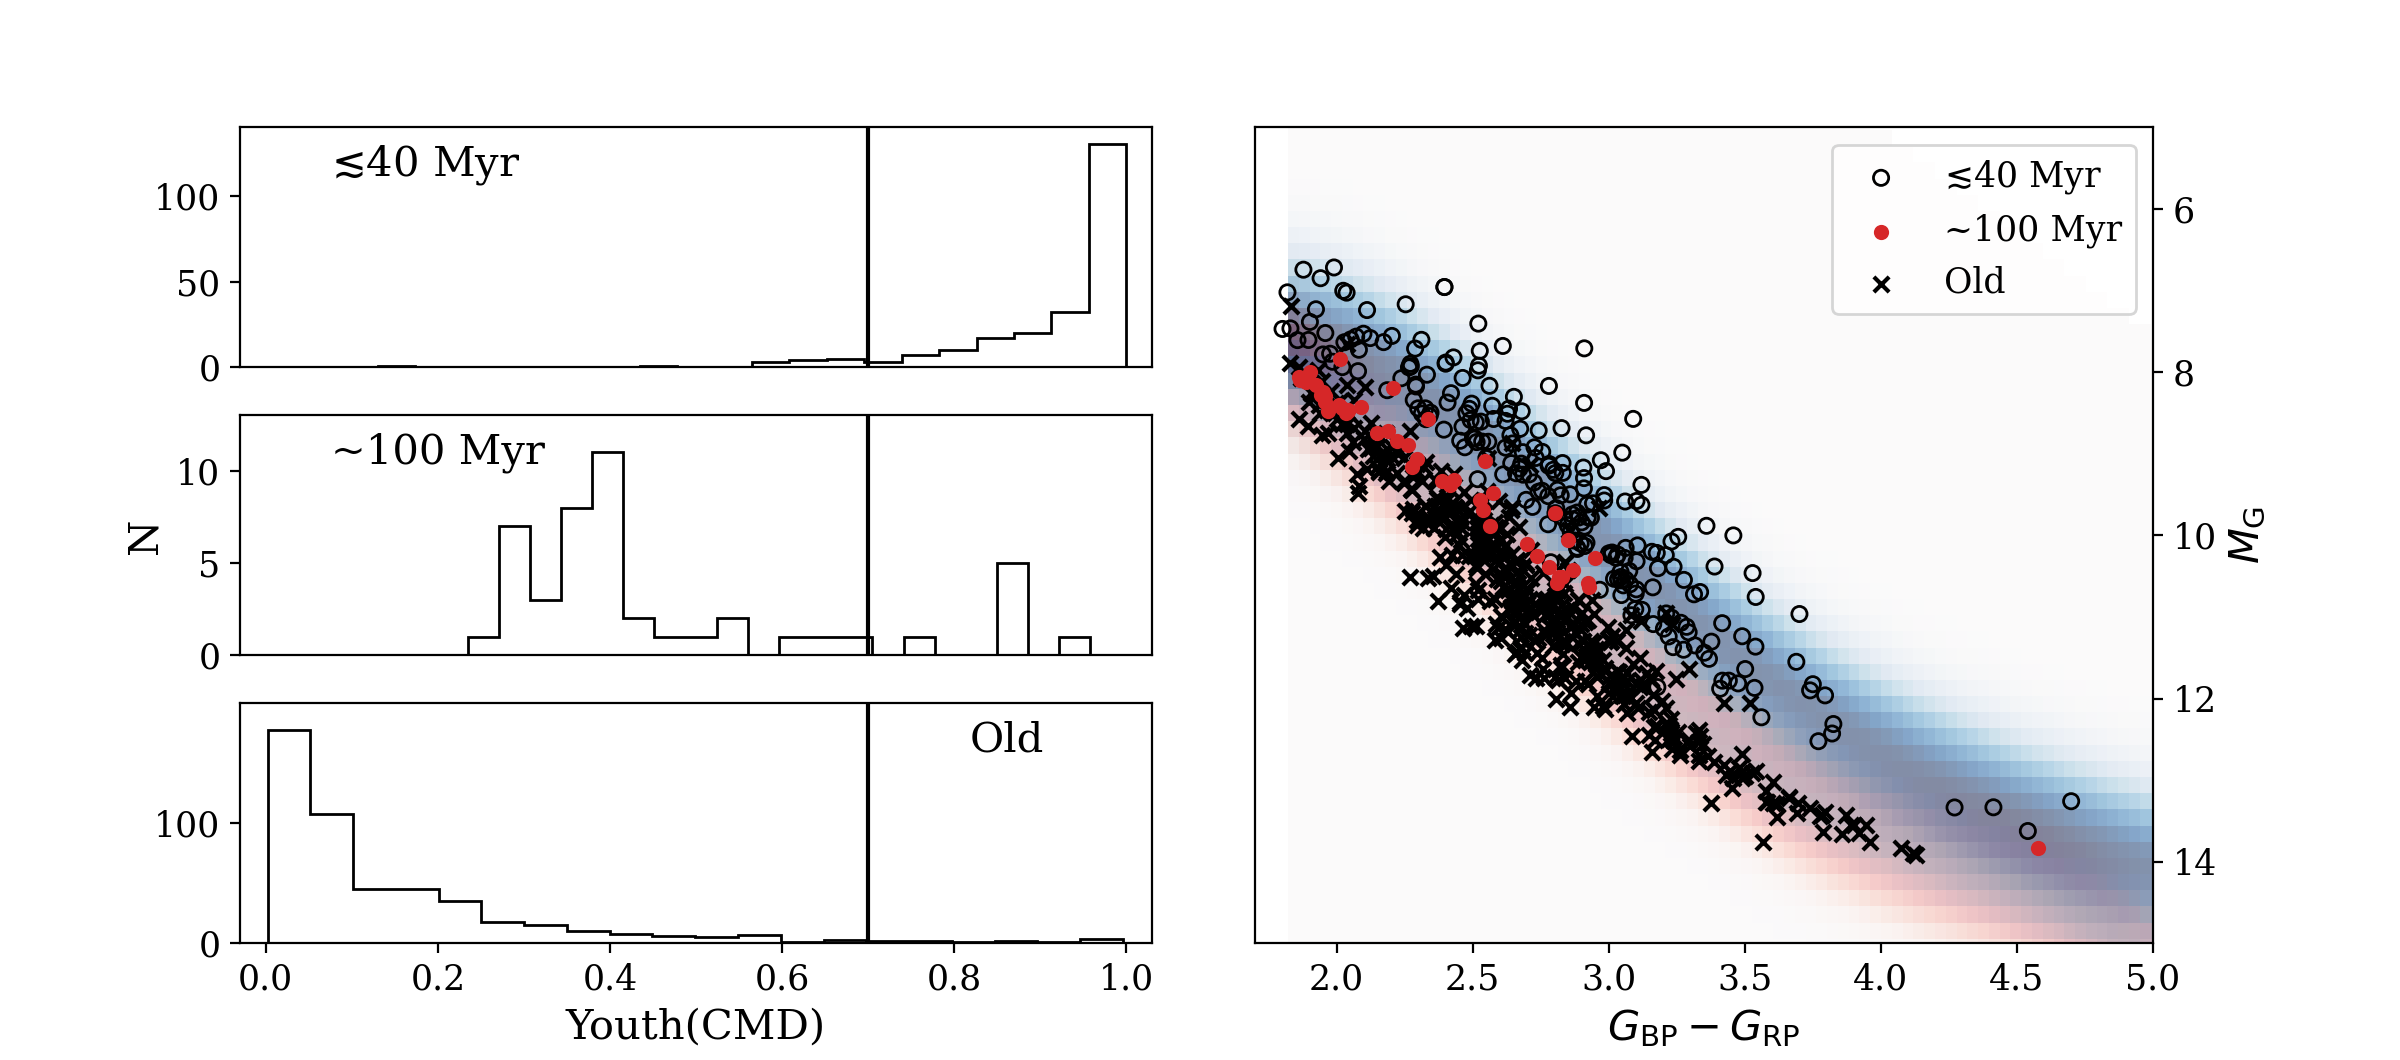
To use the Youth(CMD) parameter in our NYMG candidate member selection procedure, the determination of a proper threshold Youth(CMD) for evaluating youth is required. To do this we took bona fide NYMG members and 500 randomly selected stars from Gaia EDR3 as young and old samples, respectively. We then split the young star sample into two subsets: (1) 40 Myr-old groups (TWA, BPMG, ThOrCol, TucCol, Carina, and Argus) and (2) 100 Myr-old groups (ABDor and VCA). The stars of 100 Myr-old groups are largely mixed with field stars on the CMD (see the right panel of Fig. 3), and we expect a large level of contamination when candidate members are selected solely based on the CMD. Using these samples we explored which threshold Youth(CMD) value should be used for an effective selection of young candidates (i.e., reducing contamination of field stars). Fig. 3 presents Youth(CMD) values for these 3 age groups (40 Myr, 100 Myr, and old). The samples with ages 40 Myr have Youth(CMD) values larger than 0.70 in most cases. The major population of the 100 Myr-old samples have Youth(CMD) values 0.250.45. Most of the old samples have Youth(CMD) smaller than 0.20.
As can be seen in the left panel of Fig. 3, selection with Youth(CMD) 0.70 would allow a low contamination rate while Youth(CMD) 0.25 would contain a significant number of old interlopers. In this study, we adopt a more stringent Youth(CMD) threshold of 0.70 to limit the contamination by old interlopers. However, we note that it would probably miss many candidate members for VCA and ABDor groups, for example.
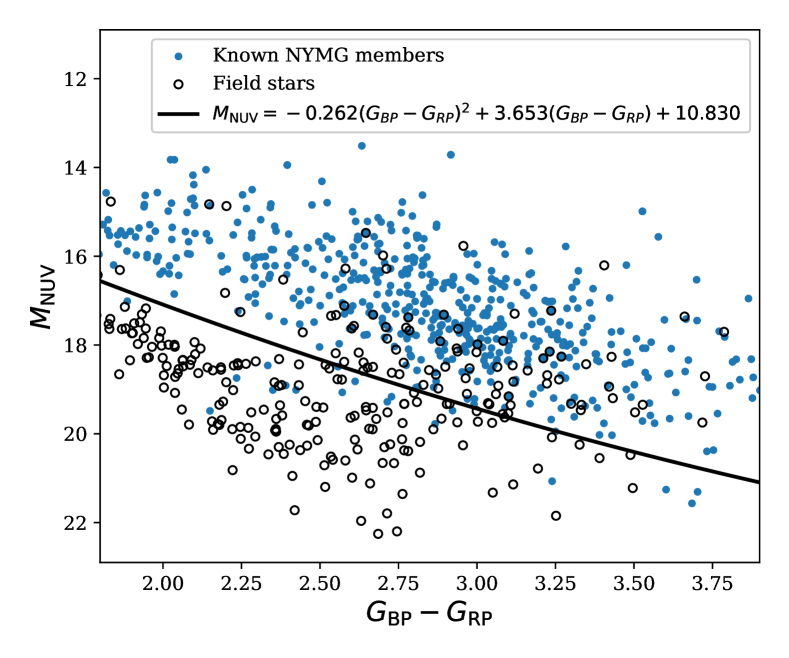
As supplementary evidence for youth evaluation, we considered magnitude and the fraction of X-ray luminosity log. In Fig. 4 (left), young and old stars are distinguished around an empirically determined boundary line. Stars brighter than the boundary are young [Youth(NUV)=1], while those fainter than the line are likely old [Youth(NUV)=0]. Stars that are either faint in or near the Galactic plane ( 15∘) are not in the GALEX DR5 catalog. We considered an upper limit for them taking the sensitivity limit of GALEX (=25.3 mag222http://www.galex.caltech.edu/researcher/faq.html). Stars with an upper limit fainter than the boundary are considered as old [Youth(NUV)=0], otherwise, their youth cannot be evaluated [Youth(NUV)=2]. On the other hand, log appears not to be useful distinguishing young stars from old ones in this low-mass regime. While log or the fraction of the X-ray luminosity log can be an effective age indicator for stars in the spectral type ranges from F to M0 (Schneider, 2013), lower mass stars remain saturated in X-ray emission (log3.0) for very long time and X-ray emissions cannot be used as an effective age indicator as shown in the right panel of Fig. 4.
2.2.2 Ultracool dwarfs (UCDs)
Because of the sparse distribution of known young ultracool dwarfs, we cannot establish the same Youth(CMD) map in the ultracool dwarf regime of the CMD (14 mag). To develop a selection scheme for NYMG ultracool dwarfs, we first eliminated sources that have large astrometric or photometric errors. These high-sigma astrometric-photometric outliers were selected following the procedure in Gaia Collaboration et al. (2021). They present new ultracool dwarf candidates adopting the selection procedure by Reylé (2018). Sources with large flux errors in the and bands and large astrometric errors were classified as outliers.
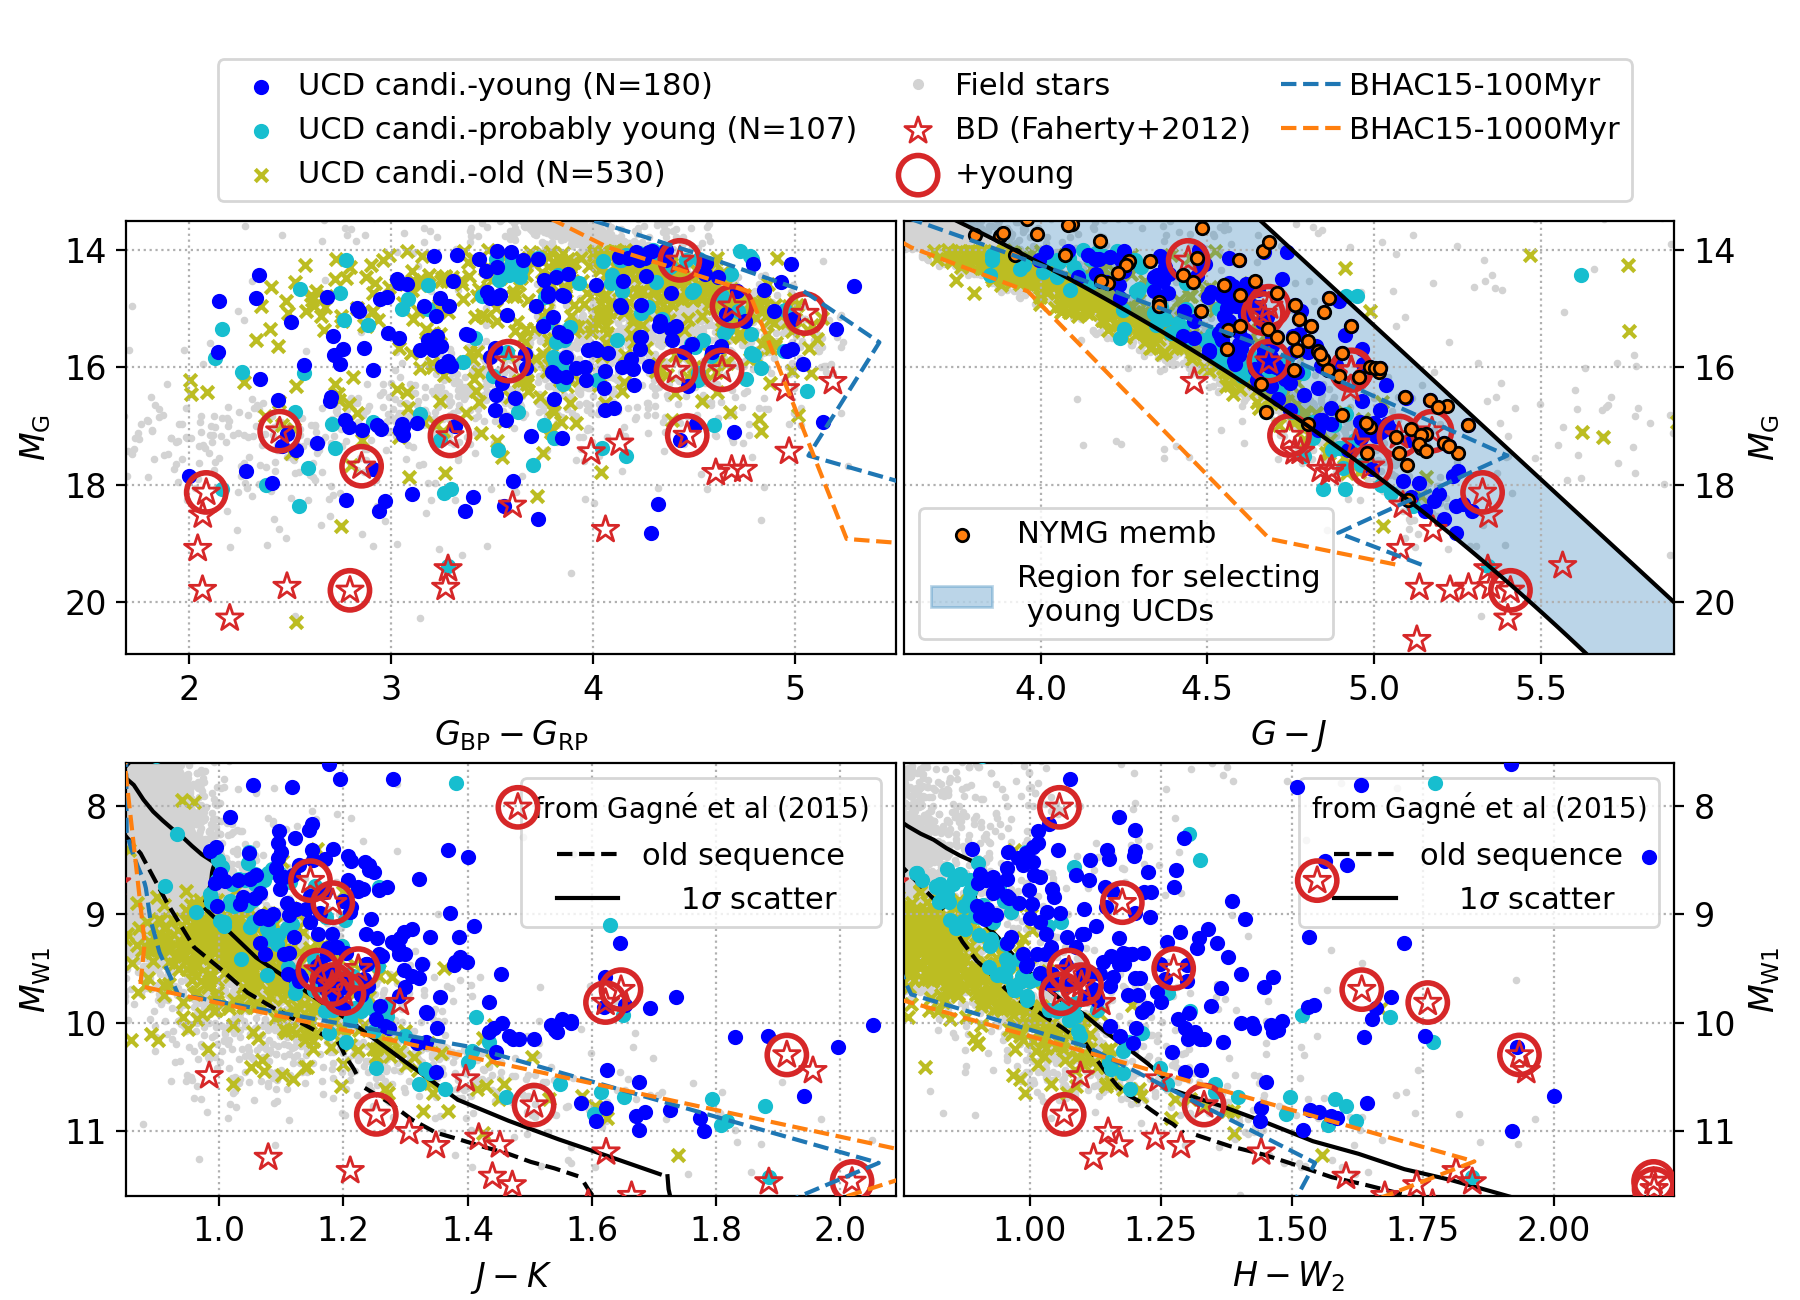
After filtering these outliers, we evaluated the youth of these spatio-kinematic candidate members using three colour-magnitude diagrams. As mentioned in Gaia Collaboration et al. (2021), is unreliable but the colour is useful in the ultracool dwarf regime. Using the known faintest NYMG members and young brown dwarfs from Faherty et al. (2012), we defined empirical sequences separating young objects from old ones (upper right in Fig. 5). The empirical boundaries are presented in the figure and equations 1 and 2.
| (1) |
| (2) |
Objects located between the boundaries (the blue shaded region in Figure 5) are considered as young candidates.
In the ultracool dwarf regime, broadband infrared colours have been useful in the selection of young objects (Faherty et al., 2012, 2016; Gagné et al., 2014, 2015; Schneider et al., 2017). Gagné et al. (2015) provides the old sequence and its 1 scatter on vs and vs diagrams (black dashed and solid lines in lower panels of Fig. 5). Objects brighter than the 1 scatter line are considered as young objects while those fainter than the old sequence line are considered as old ones. The youth assessment criteria incorporating the use of the three CMDs are as follows:
-
•
Young: evaluated as young objects in all three CMDs.
-
•
Probably young: evaluated as young objects in two CMDs, but not evaluated as old in any CMD.
Similar to the cool dwarfs, the absolute magnitude was used as supplementary evidence for evaluating youth. Note that ultracool dwarfs’ intrinsic faintness can limit severely detection in GALEX.
3 Results
Following the procedures described in Section 2, we identified new NYMG candidate members based on the spatio-kinematic candidate selection and youth assessment.
3.1 Identification of new NYMG members
| NYMG members from literature=1,921 | |
|---|---|
| 1.8 distance 150 pc=1,115 | |
| Cool dwarfs = 981 | Ultracool dwarfs = 134 |
| 90 = 836 | 90 = 109 |
| Youth(CMD)0.7 = 651 | young = 69 |
| =570 | =56 |
| Recovery rate=0.58 | Recovery rate=0.42 |
| Criteria | Cool dwarfs = 570 | Ultracool dwarfs = 56 |
|---|---|---|
| Youth(NUV)=1 (young) | 342 | 6 |
| Youth(NUV)=0 (old) | 141 | 39 |
| Youth(NUV)=2 (indecisive) | 87 | 11 |
The number of EDR3 sources in the initial dataset after the two restrictions (distance 150 pc and 1.8) is 1.5 million. These sources were split into two types of objects: cool dwarfs and ultracool dwarfs at =14 mag. The numbers of retained cool dwarfs and ultracool dwarfs are 0.7 million and 0.8 million, respectively.
NYMG candidate members were identified and then cross-matched with previously known NYMG members. We collected previously known NYMG members from 60 source papers, including the group discovery papers (e.g., TWA; Kastner et al. 1997, BPMG; Zuckerman et al. 2001), surveys searching for low-mass members (e.g., Gagné et al. 2015; Elliott et al. 2016; Shkolnik et al. 2017; Gagné et al. 2018b), and recent papers (e.g., Schneider et al. 2019; Riedel et al. 2019). We considered proposed members in the literature if they were suggested not only based on kinematic parameters but also on clear signs of youth. The number of these claimed members is 2,000, and 1,115 pass our distance and color criteria for the initial data set (1.8 and distance 150 pc). Table 2 presents the number of previously claimed NYMG members that pass the selection criteria of this study.
Among cool dwarfs (=981), 85 per cent (=836) were recovered by selection while 66 per cent (=651) passed the Youth(CMD) selection, yielding a final recovery rate of 58 per cent (=570). When the supplementary youth criterion using was applied, 342 stars were evaluated as young (Table 3).
Amongst the set of 134 known ultracool dwarf NYMG members, 81 (=109) and 51 (=69) per cent passed our selection and the primary youth assessment, respectively. Fifty six members (42 per cent) were retained by both criteria. Due to their intrinsic faintness in , only 7 ultracool dwarf candidates were detected in the NUV band of GALEX. Therefore, we did not consider NUV data in the youth evaluation of ultracool dwarf candidates. For those seven candidates with NUV detections, we utilized the NUV data in the same manner as in Section 2.2.1 (Table 3).
Considering claimed NYMG members in the literature, only 56 per cent (626 out of 1,115) were recovered in our analysis (results from and Youth(CMD) analysis, not including the information). Different spatio-kinematic models of NYMGs may be the reason for missing 15 per cent of these literature members, while 35 per cent of them were not selected because of our more systematic, selective youth evaluation method.
3.1.1 Cool dwarf members
Spatio-kinematic assessment
Of the approximately 700,000 cool dwarfs which pass our initial colour and distance cuts, about ten thousand (=10,800) have spatio-kinematic membership probabilities () larger than 90 per cent. A subset of 1,018 stars has RV values.
Youth assessment
About forty thousand (=41,636) cool dwarfs which pass our initial colour and distance cuts have Youth(CMD) larger than 0.7. A subset of 3,217 stars has RV values.
NYMG candidate selection combining and Youth(CMD)
The spatio-kinematic NYMG candidates and young candidates were cross-matched, retaining 2,611 stars, including 203 stars with RV measurements. These 203 stars have full astrometric parameters and confirmed youth based on a CMD, and we call them highly likely members. However, because of potential binary contamination, these stars still need to be considered as candidate members until confirmed by follow-up spectroscopic observations.
Among these 2,611 candidate members, 609 have been claimed in the literature. The remaining 2,002 stars are therefore new NYMG candidate members, and details of the entire sample are provided in online tables. The 139 new highly likely members having RVs are listed in Table 4 while the remaining 1,863 new candidates without RVs are in Table B1.
| Gaia EDR3 source_id | Group | RV | Youth(CMD) | Youth(NUV)a | ||||||||||
|---|---|---|---|---|---|---|---|---|---|---|---|---|---|---|
| hh:mm:ss | dd:mm:ss | mas yr-1 | mas yr-1 | mas | km s-1 | mag | mag | % | % | mag | ||||
| 2364722818954076288 | ABDor | 00:10:43.18 | -20:39:08.1 | 120.47 | -76.52 | 25.41 | 1.3 | 12.20 | 2.53 | 99 | 51b | 0.74 | 19.80 | 1 |
| 4980868526585951232 | ABDor | 00:42:11.04 | -42:52:55.2 | 83.27 | -42.64 | 18.92 | 6.6 | 12.30 | 2.42 | 98 | 98 | 0.89 | 19.85 | 1 |
| 2575842627879030656 | ABDor | 01:51:20.06 | +13:24:49.5 | 73.35 | -173.98 | 26.38 | -6.0 | 11.07 | 2.24 | 99 | 99 | 0.93 | 18.85 | 1 |
| 5179399816430035456 | ABDor | 03:03:21.47 | -08:05:16.0 | 119.76 | -37.69 | 23.95 | 31.7 | 11.83 | 2.50 | 93 | 93 | 0.96 | – | 0 |
| 501985336493825792 | ABDor | 04:32:57.54 | +74:06:58.0 | 78.44 | -124.53 | 29.42 | -7.3 | 11.07 | 2.27 | 99 | 99 | 0.72 | 18.69 | 1 |
| … | ||||||||||||||
| … | ||||||||||||||
| … | ||||||||||||||
-
a
0: old, 1: young, 2: indecisive of youth; the youth was evaluated using (see Section 2.2.1 for details).
-
b
While the star’s of a single group is less than 90 per cent, the combined of groups () is larger than 90 per cent. The star has an ambiguous status being a member of a single group.
| Criteria | Cool dwarfs=2002 | Ultracool dwarfs=231 |
|---|---|---|
| Youth(NUV)=1 (young) | 522 | 33 |
| Youth(NUV)=0 (old) | 408 | 58 |
| Youth(NUV)=2 (indecisive) | 1072 | 140 |

Histograms of and Youth(CMD), and a CMD of these 2,002 new members are presented in Fig. 6. The 139 highly likely members (with RVs) have down to 2.9 while the other candidates (without RVs) reach down to 4.5.
Candidates evaluated as young in the youth criterion [Youth(NUV)=1] are almost certainly young NYMG members. Table 5 shows the number of candidates which satisfy the supplementary youth criterion. About 26 per cent (=522) of the new cool dwarf candidates satisfy the Youth(NUV) criterion. For membership confirmation of these candidates, spectroscopic observations are required, especially for those candidates without known RVs. In addition, spectroscopic signs of youth such as strong Li absorption, H emission, and low surface gravity can confirm their youth.
| Gaia EDR3 source_id | Group | Youth(NUV)c | ||||||||||||||
|---|---|---|---|---|---|---|---|---|---|---|---|---|---|---|---|---|
| hh:mm:ss | dd:mm:ss | mas yr-1 | mas yr-1 | mas | mag | mag | mag | mag | mag | mag | % | % | mag | |||
| 2873443317000040832 | ABDor | 00:02:18.85 | +30:53:47.0 | 70.71 | -77.48 | 21.79 | 20.27 | 15.40 | 14.38 | 13.93 | 13.43 | 13.21 | 93 | 92 | 22.39 | 1 |
| 4995662902213011712 | ABDor | 00:04:50.05 | -42:41:37.6 | 169.76 | -4.29 | 23.10 | 18.35 | 13.98 | 13.30 | 12.83 | 12.60 | 12.34 | 96 | 96 | – | 0 |
| 2365527081644959360 | ABDor | 00:06:34.63 | -20:27:00.4 | 102.71 | -25.95 | 17.82 | 18.45 | 14.16 | 13.47 | 13.12 | 12.86 | 12.60 | 94 | 94 | – | 2 |
| 2876239130257160960 | ABDor | 00:15:44.85 | +35:15:58.5 | 54.51 | -257.26 | 58.75 | 18.67 | 13.88 | 12.89 | 12.26 | 11.79 | 11.54 | 98 | 98 | 22.89 | 1 |
| 4995583325059035008 | ABDor | 00:16:59.84 | -40:56:53.6 | 213.18 | 17.54 | 28.82 | 20.55 | 15.32 | 14.21 | 13.43 | 12.83 | 12.45 | 97 | 97 | – | 2 |
| … | ||||||||||||||||
| … | ||||||||||||||||
| … | ||||||||||||||||
3.1.2 Ultracool dwarf members
About two thousand ultracool dwarf candidates (14; =1,857) have spatio-kinematic membership probabilities larger than 90 per cent. As explained in Section 2.2.2, the high-sigma astrometric-photometric outliers were eliminated, and 817 objects were retained. Then the criteria for youth evaluation using the three CMDs ( vs , vs , and vs ) were applied to these objects. The numbers of objects assessed as young and probably young (See Section 2.2.2) are 180 and 107, respectively. They are marked as blue and cyan dots in Fig. 5.
Among these 287 candidate members, 56 have been claimed in the literature. The 231 new ultracool dwarf candidate members are listed in Table 6. When the supplementary youth assessment is applied, 33 objects are NUV-bright [Youth(NUV)=1] (See Table 5).
Spectroscopic follow-up observations are required to obtain confirmation of youth (e.g., low surface gravity) for the ultracool dwarf candidates and remove any remaining contaminants from the sample.
3.2 Pilot spectroscopic observations
| Gaia EDR source_id | Group | SpT | RV | EW(H)a | EW(Li)b | Y(CMD)c | Y(NUV) d | Obs. date | ||||||||||
|---|---|---|---|---|---|---|---|---|---|---|---|---|---|---|---|---|---|---|
| hh:mm:ss | dd:mm:ss | mas yr-1 | mas yr-1 | mas | km s-1 | mag | mag | mag | mag | Å | mÅ | % | yyyy-mm-dd | |||||
| 4904674604163917696 | ABDor | M5 | 00:15:55.57 | -61:37:51.9 | 68.17 | -41.96 | 18.21 | 22.60 0.46 | 13.43 | 14.94 | 12.23 | 21.88 | 6.051.08 | 91 | 98 | 0.81 | 1 | 2018-10-28 |
| 2788357364871430400 | ABDor | M4 | 01:02:50.98 | +18:56:54.4 | 97.34 | -59.77 | 26.19 | -7.35 2.17 | 12.58 | 14.27 | 11.33 | 20.14 | 7.651.24 | 2814 | 60e | 0.99 | 1 | 2016-11-16 |
| 3274291270411229056 | ABDor | M4 | 03:36:40.84 | +03:29:19.5 | 122.13 | -120.24 | 37.35 | 28.20 7.90 | 12.39 | 14.15 | 11.12 | 19.90 | 5.710.83 | 76 | 100 | 0.96 | 1 | 2016-11-16 |
| 3341248779763320448 | ABDor | M2 | 05:40:16.09 | +12:39:00.8 | -16.57 | -260.86 | 29.07 | 7.10 1.65 | 10.45 | 11.53 | 9.42 | – | 2.660.39 | 64 | 100 | 0.90 | 2 | 2016-11-15 |
| 5343936233991962880 | ABDor | M4 | 11:45:47.73 | -55:20:30.7 | -97.61 | 5.96 | 24.19 | 13.57 2.89 | 12.17 | 13.23 | 10.54 | 18.12 | 7.601.15 | 129 | 69e | 0.99 | 1 | 2016-07-17 |
| 3576519980067360768 | ABDor | M5 | 12:26:44.13 | -12:29:17.5 | -170.94 | -89.12 | 33.05 | 7.770.62 | 12.10 | 13.47 | 10.81 | 19.50 | 3.650.81 | 54 | 100 | 0.71 | 1 | 2017-04-14 |
| 6005261829198023296 | ABDor | M6 | 15:13:55.55 | -39:41:13.7 | -79.18 | -90.87 | 25.37 | 0.882.58 | 14.04 | 16.29 | 12.66 | – | 19.891.91 | 981324 | 98 | 1.00 | 0 | 2018-06-04 |
| 6724937269577837696 | ABDor | M6 | 18:15:30.61 | -41:06:10.2 | 28.46 | -95.86 | 25.38 | -21.870.62 | 13.29 | 14.81 | 11.73 | – | 4.491.02 | 68 | 96 | 0.98 | 2 | 2018-06-04 |
| 6362966355075756928 | ABDor | M4 | 19:52:27.05 | -77:35:28.4 | 66.19 | -107.26 | 25.69 | 37.05 5.82 | 12.49 | 14.00 | 11.29 | 20.26 | 4.060.75 | 79 | 96 | 0.91 | 1 | 2016-07-17 |
| 6878315602572236160 | ABDor | M4 | 20:03:01.59 | -14:22:28.3 | 28.24 | -97.47 | 17.45 | -10.740.47 | 13.56 | 14.67 | 11.97 | 20.77 | 4.761.00 | 61 | 98 | 0.81 | 1 | 2018-10-27 |
| 6465741903107929472 | ABDor | M7/8 | 21:38:35.31 | -50:51:10.8 | 99.56 | -60.37 | 22.09 | -13.82 1.89 | 13.92 | 15.67 | 12.59 | 21.76 | 5.971.08 | 89 | 99 | 0.86 | 1 | 2018-10-29 |
| 2701170632570283904 | ABDor | M7/8 | 21:39:01.79 | +07:00:34.4 | 70.24 | -45.99 | 18.64 | -14.670.63 | 14.36 | 16.11 | 13.10 | 21.45 | 7.821.43 | 93 | 97 | 0.78 | 1 | 2018-10-27 |
| 2680136803331701504 | ABDor | M3 | 21:55:17.39 | -00:46:23.2 | 63.58 | -55.53 | 17.89 | -11.840.43 | 14.10 | 15.87 | 12.83 | 21.19 | 12.361.71 | 76 | 97 | 0.96 | 1 | 2017-09-11 |
| 6820341000133968768 | ABDor | M5 | 22:11:42.09 | -20:44:18.1 | 146.52 | -64.52 | 24.15 | -9.41 1.44 | 12.49 | 13.98 | 11.30 | 19.88 | 4.090.81 | 95 | 100 | 0.85 | 1 | 2018-10-29 |
| 5794808569134876416 | Argus | M4 | 15:36:29.97 | -72:20:20.1 | -55.30 | -71.20 | 16.56 | -5.25 0.31 | 12.63 | 13.96 | 11.48 | – | 3.950.91 | 61 | 81e | 0.93 | 2 | 2017-04-14 |
| 6316591222362496 | BPMG | M5 | 02:48:16.81 | +05:37:06.0 | 74.49 | -53.62 | 21.45 | 8.24 1.09 | 13.14 | 14.91 | 11.87 | 20.20 | 8.311.32 | 34 | 96 | 1.00 | 1 | 2018-10-30 |
| 9124679495764864 | BPMG | M6 | 03:23:39.16 | +05:41:15.3 | 83.32 | -69.50 | 26.64 | 10.120.62 | 13.00 | 14.79 | 11.73 | 21.02 | 6.761.18 | 15692 | 90 | 0.99 | 1 | 2018-10-30 |
| 3290083835095329408 | BPMG | M4 | 05:07:49.14 | +08:29:37.0 | 4.75 | -63.88 | 17.91 | 10.65 1.58 | 13.04 | 14.46 | 11.80 | – | 2.450.63 | 61 | 92 | 0.94 | 0 | 2018-10-30 |
| 6455829427826823168 | BPMG | M7 | 20:44:48.19 | -58:03:28.8 | 39.32 | -56.76 | 16.07 | 1.51 1.16 | 14.47 | 16.47 | 13.14 | 22.00 | 11.801.54 | 846251 | 99 | 1.00 | 1 | 2018-10-29 |
| 2594209965325689600 | BPMG | M6 | 22:29:44.26 | -18:23:13.4 | 110.25 | -59.18 | 27.01 | -3.86 2.04 | 13.84 | 15.66 | 12.57 | 21.72 | 5.301.13 | 102 | 100 | 0.80 | 1 | 2018-10-26 |
| 5093056748849753344 | Carina | M4 | 04:20:36.75 | -18:53:08.3 | 30.88 | -11.80 | 10.18 | 20.16 1.00 | 13.82 | 15.33 | 12.61 | 21.25 | 5.541.09 | 59 | 100 | 0.99 | 1 | 2018-10-29 |
| 2977580846408038016 | Carina | M7/8 | 04:46:52.77 | -19:36:45.4 | 29.28 | -9.13 | 10.69 | 19.11 0.56 | 14.97 | 16.87 | 13.67 | 21.76 | 9.67 1.22 | 71 | 99 | 1.00 | 1 | 2018-10-30 |
| 4880597979576260480 | Carina | M7/8 | 04:53:54.38 | -27:05:46.5 | 28.91 | -2.16 | 10.77 | 27.39 1.54 | 15.89 | 17.82 | 14.58 | 23.09 | 9.291.34 | 355 | 94 | 0.92 | 1 | 2018-10-29 |
| 3199199681413101056 | ThOrCol | M6 | 04:22:12.00 | -06:30:19.5 | 39.23 | -28.55 | 13.61 | 22.89 0.93 | 14.47 | 16.20 | 13.21 | 21.12 | 6.861.11 | 74 | 71e | 0.97 | 1 | 2018-10-29 |
| 3226167471826076672 | ThOrCol | M4 | 04:48:22.55 | -01:53:56.0 | 27.14 | -64.92 | 14.18 | 23.96 0.57 | 13.99 | 15.59 | 12.75 | – | 8.571.30 | 72 | 100 | 0.98 | 0 | 2018-02-03 |
| 2883627990131188352 | ThOrCol | M4 | 05:57:29.90 | -38:43:03.7 | 14.69 | 10.13 | 10.66 | 18.07 0.51 | 13.83 | 15.30 | 12.63 | 19.94 | 8.671.36 | 66 | 92 | 0.99 | 1 | 2017-09-14 |
| 2916409310839890176 | ThOrCol | M4 | 05:59:41.10 | -23:19:09.3 | 6.40 | -5.61 | 13.93 | 27.25 4.10 | 13.42 | 15.01 | 12.19 | 20.38 | 12.071.32 | 83 | 100 | 1.00 | 1 | 2016-11-15 |
| 5213914375483588480 | ThOrCol | M4 | 08:10:36.42 | -74:58:12.3 | -37.34 | 56.34 | 12.79 | 15.42 0.42 | 13.08 | 14.45 | 11.92 | 20.52 | 5.08 0.91 | 59 | 90 | 0.98 | 1 | 2018-02-03 |
| 5806701677174982912 | ThOrCol | M4 | 16:14:40.97 | -72:02:24.3 | -38.92 | -69.57 | 14.72 | 9.37 0.85 | 13.70 | 15.19 | 12.47 | – | 5.291.02 | 52 | 84e | 0.91 | 0 | 2018-05-05 |
| 2466437475703854208 | TucCol | M4 | 02:01:50.73 | -07:26:58.2 | 95.62 | -51.87 | 22.18 | 6.46 2.51 | 14.07 | 15.86 | 12.80 | 22.06 | 9.431.44 | 151 | 99 | 0.86 | 1 | 2016-11-16 |
| 4946915641880235904 | TucCol | M5 | 02:39:48.29 | -42:53:05.0 | 104.39 | -25.33 | 25.31 | 9.95 1.89 | 12.38 | 14.09 | 11.11 | – | 10.361.38 | 33 | 100 | 1.00 | 0 | 2018-10-26 |
| 3176591214084032128 | TucCol | M1/2 | 04:12:55.75 | -14:18:59.0 | 60.75 | -25.35 | 17.38 | 13.78 1.53 | 11.90 | 12.99 | 10.86 | 19.80 | 2.210.54 | 5224 | 100 | 0.76 | 1 | 2017-09-14 |
| 6375044288444444672 | TucCol | M5 | 21:07:22.49 | -70:56:12.6 | 26.72 | -92.28 | 20.70 | 5.70 0.61 | 12.60 | 14.06 | 11.41 | 19.47 | 6.181.16 | 54 | 100 | 0.97 | 1 | 2018-10-27 |
| 2312002988748576640 | TucCol | M2 | 23:43:26.82 | -34:46:57.8 | 91.78 | -76.92 | 26.03 | -2.34 0.81 | 11.01 | 12.12 | 9.92 | 19.17 | 2.490.55 | 40 | 100 | 0.83 | 1 | 2018-10-26 |
| 6534521406305916928 | TucCol | M6 | 23:45:25.66 | -40:20:15.0 | 108.41 | -78.84 | 26.30 | 6.57 2.47 | 13.64 | 15.41 | 12.37 | 21.39 | 6.461.13 | 62 | 56e | 0.78 | 1 | 2018-10-26 |
-
a
Emissions. Uncertainties are calculated using Eqn. 6 of Cayrel (1988).
-
b
In the case of non-detection, upper limits are provided. Uncertainties are calculated using Eqn. 6 of Cayrel (1988).
-
c
Youth(CMD).
-
d
Youth(NUV).
-
e
While the candidate’s of a single group is less than 90 per cent, the combined of groups () is larger than 90 per cent. The candidate has an ambiguous status being a member of a single group.
We obtained optical spectra (7000) for a subset of the candidates with the Wide Field Spectrograph (WiFeS; Dopita et al. 2007) on the ANU 2.3-m telescope at Siding Spring Observatory.
We used the red R7000 grating, which covers 5300 to 7060Å.
We measured the RV of each spectrum with ispec via cross-correlation against the provided HARPS/SOPHIE line mask (Blanco-Cuaresma et al., 2014; Blanco-Cuaresma, 2019).
Equivalent widths of Li 6708Å and H were measured with the splot task in iraf.
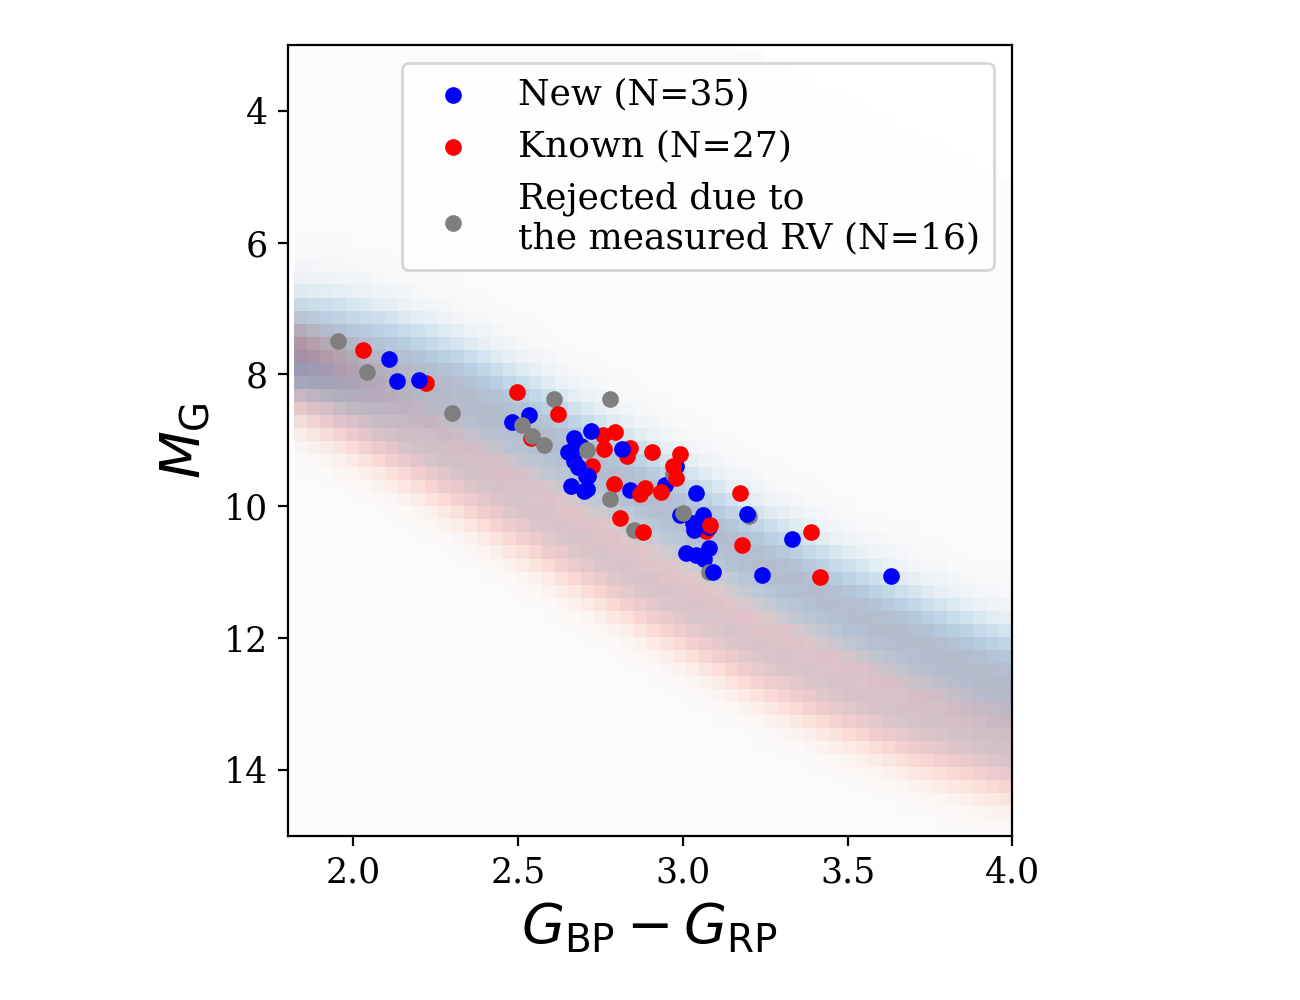
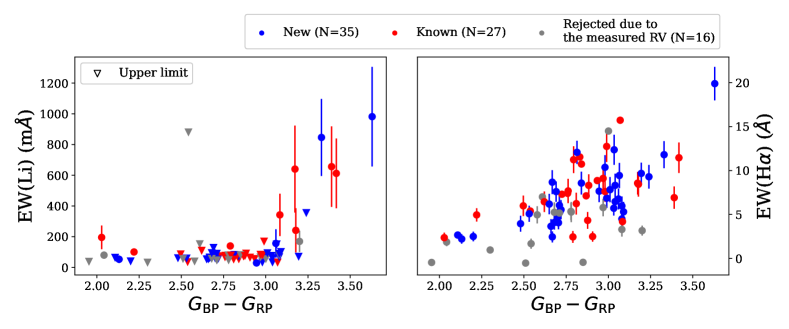
Among 2000 candidate NYMG members, we have observed 100 sources with WiFeS since 2016. Because our BAMG scheme has been actively developed during this time as well, some observed candidate members would not have been retained purely based on the selection criteria described in earlier sections. Seventy eight candidates fulfilling the and Youth(CMD) selection criteria were observed with WiFeS. Their newly obtained RVs were used in re-calculation of their , and 79 per cent (=62) still return above the threshold. Such a large hit rate proves the effectiveness of the BAMG code in the NYMG member identification. Among these 62 members, 27 were claimed previously in the literature. Excluding these 27 members, the newly confirmed NYMG members (=35) are listed in Table 7.
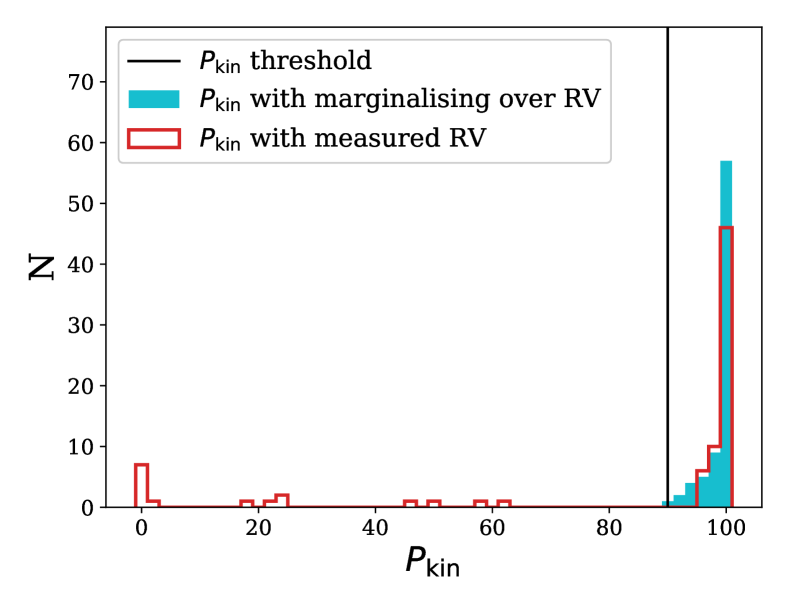
Fig. 7 displays histograms of and a CMD for the 78 sources, including the 16 objects rejected as their velocities are inconsistent with membership in the proposed NYMG. Equivalent widths of their Li and H lines are presented in Fig. 8. Even though these values are inconclusive to evaluate an object’s youth in the low-mass regime, most have strong H emission, corroborating their CMD youth.
4 Discussion
4.1 Population statistics and survey limit
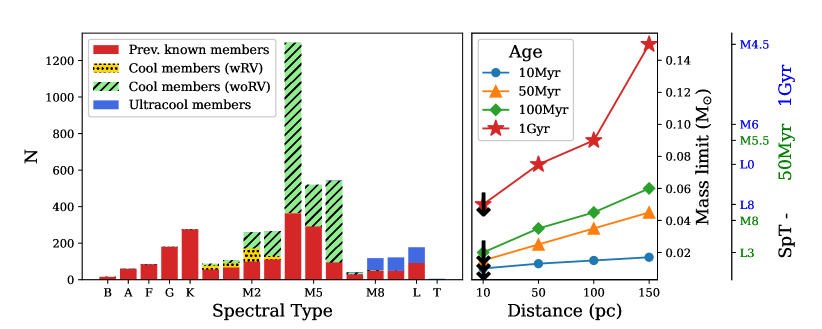
In this study, we have identified 2,002 cool dwarf and 231 ultracool dwarf candidate NYMG members. Their spectral types were estimated using theoretical isochrones (BHAC15; Baraffe et al. 2015) as follows. The NYMG membership provides an age for each source based on that of the designated group (TWA: 10, BPMG: 20, ThOrCol, TucCol, & Carina: 30, Argus: 40, ABDor & VCA:100 Myr). The isochrone model converts a broadband colour to an effective temperature. The colours used in the conversion are and for cool and ultracool dwarfs, respectively. An effective temperature is converted to a spectral type using a sequence by Mamajek333http://www.pas.rochester.edu/emamajek /EEM_dwarf_UBVIJHK_colors_Teff.txt and Pecaut & Mamajek (2013). Fig. 9 (left) illustrates the distribution of spectral types of new candidate members from this study and those of previously known members. For previously known members, spectral types from the literature were adopted. New highly likely members with RVs are mainly early-M types while the majority of those missing RVs are mid-M types. The number of new ultracool dwarf candidates is similar to that of the previously known ultracool dwarf members, which would double the ultracool dwarf NYMG sample if all of their memberships are confirmed.
Our survey for the lowest-mass NYMG members is incomplete due to Gaia EDR3 only being sensitive out to 20-30 pc for mid-L members (Scholz, 2020). The completeness of individual NYMGs must differ as their mean distances and ages vary widely. Fig. 9 (right) illustrates the lowest mass detected by Gaia assuming a limiting magnitude of =20. The calculation is based on theoretical isochrones by Baraffe et al. (2015). Obviously, the younger, hence hotter objects have lower mass detection limits than their older counterparts. In the nearest 10 pc, Gaia EDR3 is complete down to late-L regardless of age. At 50 pc, L3 and L0 are the latest detectable spectral types for 50 Myr and Gyr objects, respectively. When considering mass instead of spectral type at 50 pc, detection limits for young (50 Myr) and old (Gyr) objects are 0.025 and 0.075 , respectively. At 150 pc, late-M types (0.020.06 ) appear to be the faintest available NYMG members, while mid-M stars (0.15 ) are the lowest mass old field objects. Therefore, in this study, most M type NYMG members were likely to be found, and some nearby (50 pc) L type members were also identified. As mentioned in Section 3.1, the recovery rate of our analysis is 56 per cent when compared to the literature. The true completeness must be (much) lower than that value because of (1) the incompleteness of the NYMG census in the literature, (2) the survey limit of Gaia, and (3) hidden/uncovered NYMG groups within 150 pc. In spite of the incompleteness, the newly identified low-mass members from this study significantly contribute to the full census of NYMG members.
4.2 Age of the Pictoris Moving Group (BPMG)
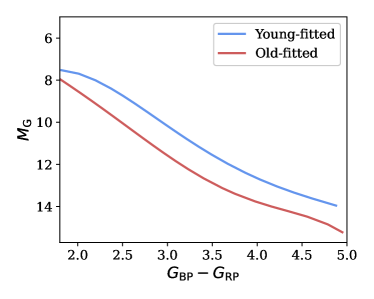
The estimated age of the BPMG has a wide range (1225 Myr; Zuckerman et al. 2001; Song et al. 2003; Binks & Jeffries 2014; Mamajek & Bell 2014; Bell et al. 2015) caused by different selection of input data, and/or method dependency. Later analyses (Binks & Jeffries, 2014; Mamajek & Bell, 2014; Bell et al., 2015) generally find older ages (20 Myr). Mamajek & Bell (2014) find ages (2022 Myr) using multiple isochrone models [Yonsei-Yale; Demarque et al. (2004), Dartmouth; Dotter et al. (2008), Pisa; Tognelli et al. (2011), and PARSEC; Bressan et al. (2012)]. However, the members used in their analyses have spectral types in the range of A0 to G9, whose over-luminosity compared to old MS stars is smaller than those of M-type stars. Therefore, including lower-mass members can yield a more robust estimate of the group age. In this re-analysis, we adopted two isochrones: PARSEC-COLIBRI (Marigo et al., 2017) and BHAC15 (Baraffe et al., 2015).
Following the scheme of Goldman et al. (2018), we used BHAC15 for intermediate-mass stars down to the ultracool dwarfs and PARSEC-COLIBRI for the higher-mass stars. We adopted a boundary of 0.7 between the two models (Goldman et al., 2018). The age of each source is estimated via linear interpolation using the , , and magnitudes. In the case of known and unresolved binaries, the source is split into two by adding 0.7 mag in , , and assuming they are equal luminosity binaries.
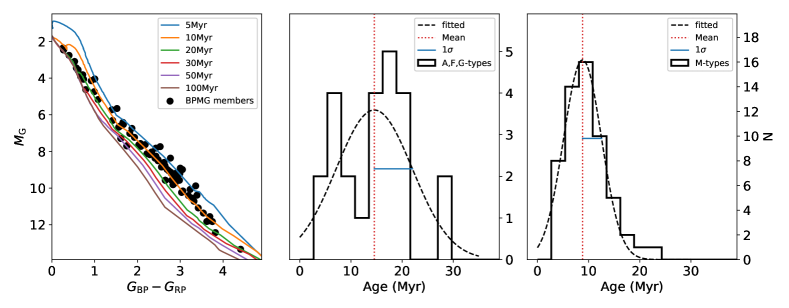
Fig. 10 presents a CMD and distribution of the estimated ages of BPMG members. The distribution of ages is fitted with a Gaussian function to evaluate the age of the BPMG. When the entire BPMG membership is used, the fitting has a mean value of 9.4 Myr with a standard deviation () of 4.9 Myr. This age is significantly younger than the currently accepted age of BPMG (20 Myr). If only lower-mass members (1.8) are used, the estimated age becomes younger 8.8 Myr (=3.7 Myr). When the high mass members ( 1.8) are used, the estimated age is still young (14.6 Myr, =7.5 Myr). This systematic bias of higher mass stars appearing older than low mass stars on theoretical isochrones is a well-known effect (Naylor, 2009; Herczeg & Hillenbrand, 2015). Even though there is a mass-dependency issue in the age evaluation, the BPMG members overall seem to be younger than the commonly adopted age of 20 Myr.
This situation is similar to the case of the Lower Centaurus Crux (LCC) subgroup of the nearby Scorpius-Centaurus OB association. Mamajek et al. (2002) and Pecaut & Mamajek (2016) determined isochronal ages of LCC as 16 Myr based upon main-sequence turn-off, G-type and F-type members. The ages based upon the massive members are significantly older than those from Goldman et al. (2018) and Song et al. (2012). Goldman et al. (2018) estimated the isochronal ages of subgroups of LCC to be 7-10 Myr using high- to low-mass members (B-type stars to ultracool dwarfs). Song et al. (2012) assessed the age of LCC as 10 Myr from a Li 6708 absorption strength analysis (also see Murphy, Lawson & Bento, 2015). Although this well-known discrepancy between the isochronal ages of massive and low-mass stars is yet to be resolved, there are some possible explanations regarding low-mass stars. For instance, standard stellar evolutionary models (e.g., Baraffe et al. 1998; Tognelli et al. 2011) do not include accretion, rotation, or magnetic fields. Rotation and magnetic fields slow the contraction of T-Tauri stars, inducing a larger radius and/or a cooler surface temperature at a given age (Feiden, 2016; Amard et al., 2019). Episodic accretion, although a very rare event and effective only within 10 Myr age (Baraffe et al., 2010), also can cause young stars to be very luminous. In contrast, scattering, disks, or star spots reduce stellar luminosities (Jackson et al., 2009; Dunham et al., 2010). This apparent over-luminosity of young M-type stars compared to theoretical expectations can therefore, be attributed to the combination of these effects. Keeping this in mind, the CMD age of the BPMG, mostly influenced by low mass members, is 10 Myr.
5 Conclusion and Summary
In this study, we have identified new low-mass (M0 to mid-L) NYMG members from Gaia EDR3. Two procedures were used in the identification: (1) spatio-kinematic membership probability calculation via BAMG and (2) photometric assessment of youth.
For cool dwarfs (14 mag), the youth assessment was performed primarily using the location on the vs diagram. After removing known members, 2000 new cool dwarf candidate members were identified, including 139 stars with RVs. This subset of candidate members have full astrometric data which gives a more rigorous spatio-kinematic membership assessment. Although there is a possibility that these stars are multiple systems which elevate them on the CMD and cause them to be falsely assessed as young, we call them highly likely new NYMG members.
For identifying ultracool dwarf members (14 mag), youth was assessed using three CMDs ( vs , vs , and vs ). After cross-matching with previously known ultracool dwarf NYMG members, 231 new candidate members were identified.
Although our survey is incomplete due to the sensitivity of Gaia, the spectral type distribution of NYMG members shows that our survey significantly contributes to the identification of low-mass NYMG members.
The supplementary youth criterion using selects more certain young candidates (500 and 40 for cool and ultracool dwarfs, respectively).
Finally, a new age estimation of the Pictoris Moving Group (BPMG) using the updated list of bona fide members and Gaia EDR3, results in a younger age (10 Myr) compared to the previously derived ages (20 Myr). Although outside the scope of this work, it would be worthwhile to re-calculate the Lithium Depletion Boundary age of the BPMG with the updated membership list.
As the main results of this study, we provide lists of spectroscopically confirmed members, highly likely members, and candidate members of NYMGs.
Acknowledgements
We acknowledge the important and thorough and valuable review by the referee that improved the manuscript significantly.
This research was supported by Basic Science Research Program through the National Research Foundation of Korea (NRF) funded by the Ministry of Education (No. NRF-2021R1I1A1A01047972).
This work has made use of data from the European Space Agency (ESA) mission Gaia (https://www.cosmos.esa.int/gaia), processed by the Gaia Data Processing and Analysis Consortium (DPAC, https://www.cosmos.esa.int/web/gaia/dpac/consortium). Funding for the DPAC has been provided by national institutions, in particular the institutions participating in the Gaia Multilateral Agreement.
Data availability
The data underlying this article are available in the article and in its online supplementary material.
References
- Amard et al. (2019) Amard L., Palacios A., Charbonnel C., Gallet F., Georgy C., Lagarde N., Siess L., 2019, A&A, 631, 77
- Baraffe et al. (2010) Baraffe I., Chabrier G., 2010, A&A, 521, 44
- Baraffe et al. (1998) Baraffe I., Chabrier G., Allard F., Hauschildt P. H., 1998, A&A, 337, 403
- Baraffe et al. (2012) Baraffe I., Vorobyov E., Chabrier G., 2012, ApJ, 756, 118
- Baraffe et al. (2015) Baraffe I., Homeier D., Allard F., Chabrier G., 2015, A&A, 577, 42
- Bastian et al. (2010) Bastian N., Covey K., Meyer M., 2010, ARA&A, 48, 339
- Bell et al. (2017) Bell C P M., Murphy S., Mamajek E., 2017, MNRAS, 468, 1198
- Bell et al. (2015) Bell C P M., Mamajek E E., Naylor T., 2015, MNRAS, 454, 593
- Bianchi et al. (2011) Bianchi L., Efremova B., Herald J., Girardi L., Zabot A., Marigo P., Martin C., 2011, MNRAS, 411, 2770
- Binks & Jeffries (2014) Binks A S., Jeffries R D., 2014, MNRAS, 438, 11
- Blanco-Cuaresma et al. (2014) Blanco-Cuaresma S., Soubiran C., Heiter U., Jofré P., 2014, A&A, 569, 111
- Blanco-Cuaresma (2019) Blanco-Cuaresma S., 2019, MNRAS, 486, 2075
- Boller et al. (2016) Boller Th., Freyberg M. J., Trümper J., Haberl F., Voges W., Nandra K., 2016, A&A, 588, 103
- Bressan et al. (2012) Bressan A., Marigo P., Girardi L., Salasnich B., Dal Cero C., Bubele S., Nanni A., 2012, MNRAS, 427, 127
- Burrows et al. (2001) Burrows A., Hubbard W., Lunine J., Liebert J., 2001, Reviews of Modern Physics, 73, 719
- Cayrel (1988) Cayrel R., 1988, in Cayrel de Strobel G., Spite M., eds, IAU Symposium Vol. 132, The Impact of Very High S/N Spectroscopy on Stellar Physics. p. 345
- Chauvin et al. (2017) Chauvin G., Desidera S., Lagrange A., et al., 2017, A&A, 605, 9
- Crundall et al. (2019) Crundall T., Ireland M., Krumholz M., 2019, MNRAS, 489, 3625
- Cutri et al. (2003) Cutri R. M., et al., 2003, VizieR Online Data Catalog, p. II/246
- Cutri et al. (2014) Cutri R. M., et al., 2003, VizieR Online Data Catalog, p. II/328
- Demarque et al. (2004) Demarque P., Woo J.-H., Kim Y.-C., Yi S. K., 2004, ApJS, 155, 667
- Dotter et al. (2008) Dotter A., Chaboyer B., Jevremović D., Kostov V., Baron E., Ferguson J. W., 2008, ApJS, 178, 89
- Dopita et al. (2007) Dopita M., Hart J., McGregor P., Oates P., Bloxham G., Jones D., 2007, Ap&SS, 310, 255
- Dunham et al. (2010) Dunham M. M., Evans N. J., Terebey S., Dullemond C. P., & Young C., H., ApJ
- Elliott et al. (2016) Elliott P., Bayo A., Melo C.H.F., Torres C.A.O., Sterzik M.R., Quast G.R., Montes D., Brahm R., 2016, A&A, 590, 13
- Faherty et al. (2012) Faherty J., et al. 2012, ApJ, 752, 56
- Faherty et al. (2013a) Faherty J., Cruz K., Rice E., Riedel A., 2013a, MmSAI, 84, 955
- Faherty et al. (2013b) Faherty J., Rice E., Cruz K., Mamajek E., Núñez A., 2013b, AJ, 145, 2
- Faherty et al. (2016) Faherty J., et al. 2016, ApJS, 225, 10
- Feiden (2016) Feiden G. A., 2016, A&A, 593, 99
- Gagné et al. (2014) Gagné J., Lafrenière D., Doyon R., Malo L., Artigau É., 2014, ApJ, 783, 121
- Gagné et al. (2015) Gagné J., Lafrenière D., Doyon R., Malo L., Artigau É., 2015, ApJ, 798, 73
- Gagné et al. (2018a) Gagné J., Mamajek E., Malo L., et al., 2018, ApJ, 856, 1
- Gagné et al. (2018b) Gagné J., Faherty J., 2018, ApJ, 862, 138
- Gaia Collaboration et al. (2016) Gaia Collaboration et al., 2016, A&A, 595, A1
- Gaia Collaboration et al. (2021) Gaia Collaboration et al., 2021, A&A, 649, 1
- Goldman et al. (2018) Goldman B., Röser S., Schilbach E., Moór A., Henning T., 2018, ApJ, 868, 32
- Herczeg & Hillenbrand (2015) Herczeg G., Hillenbrand L., 2015, ApJ, 808, 23
- Jackson et al. (2009) Jackson R. J., Jeffries R. D., Maxted P. F. L., 2009, MNRAS, 399, 89
- Kastner et al. (1997) Kastner J., Zuckerman B., Weintraub D., Forveille, 1997, Science, 277, 4
- Kirkpatrick et al. (1997) Kirkpatrick J., Henry T., Irwin M., 1997, AJ, 113, 1421
- Kraus et al. (2014) Kraus A., Shkolnik E., Allers K., Liu M., 2014, AJ, 147, 146
- Kroupa (2001) Kroupa P., 2001, MNRAS, 322, 231
- Lagrange et al. (2010) Lagrange A., Bonnefoy M., Chauvin G., et al., 2010, Science 329, 57
- Lee & Song (2018) Lee J., Song I., 2018, MNRAS, 475, 2955
- Lee & Song (2019a) Lee J., Song I., 2019a, MNRAS, 486, 3434
- Lee & Song (2019b) Lee J., Song I., 2019b, MNRAS, 489, 2189
- Lindegren et al. (2018) Lindegren L., Hernandez J., Bombrun A., et al., 2018, A&A, 616, 2
- Lindegren et al. (2021) Lindegren L., Klioner S., Hernández J., et al., 2021, A&A, 649, A2
- Liu et al. (2016) Liu M., Dupuy T., Allers K., 2016, ApJ, 833, 96
- López-Santiago et al. (2009) López-Santiago J, Micela G., Montes D., 2009, A&A, 499, 129
- Mamajek et al. (2002) Mamajek E E., Meyer M R., Liebert J., 2002, AJ, 124, 1670
- Mamajek & Bell (2014) Mamamek E E., Bell C P M., 2014, MNRAS, 445, 2169
- Marigo et al. (2017) Marigo P., Girardi L., Bressan L., et al., 2017, ApJ, 835, 77
- Marois et al. (2008) Marois C., Macintosh B., Barman T., et al., 2008, Science, 322, 1348
- Marois et al. (2010) Marois C., Zuckerman B., Konopacky Q., Macintosh B., Barman T., 2010, Nature, 468, 1080
- Marley et al. (2007) Marley M., Fortney J., Hubickyj O., Bodenheimer P., Lissauer J., 2007, ApJ, 655, 541
- Malo et al. (2013) Malo L., Doyon R., Lafrenière D., Artigau É., Gagné J., Baron F., Riedel A., 2013, ApJ, 762, 88
- Murphy et al. (2010) Murphy S., Lawson W., Bessell M., 2010, MNRAS, 406, 50
- Murphy et al. (2013) Murphy S., Lawson W., Bessell M., 2013, MNRAS, 435, 1325
- Murphy et al. (2015) Murphy S., Lawson W., Bento J., 2015, MNRAS, 453, 2220
- Naylor (2009) Naylor T., 2009, MNRAS, 399, 432
- Pecaut & Mamajek (2013) Pecaut M J., Mamajek E E., 2013, ApJS, 208, 9
- Pecaut & Mamajek (2016) Pecaut M J., Mamajek E E., 2016, MNRAS, 461, 794
- Reylé (2018) Reylé C., 2018, A&A, 619, 8
- Riedel et al. (2017) Riedel A., Blunt S., Lambrides E., 2017, AJ, 153, 95
- Riedel et al. (2019) Riedel A., DiTomasso V., Rice E., Alam M., Abrahams E., Crook J., Cruz K., Faherty J., 2019, AJ, 157, 247
- Rodriguez et al. (2013) Rodriguez D., Zuckerman B., Kastner J., Bessell M., Faherty J., Murphy S., 2013, ApJ, 774, 101
- Seabroke et al. (2021) Seabroke G., Fabricius C., Teyssier D., et al. 2021, A&A, submitted (Gaia EDR3 SI)
- Schlieder et al. (2012) Schlieder J., Lépine S., Simon M., 2012, AJ, 144, 109
- Schneider (2013) Schneider A., 2013, PhD thesis, University of Georgia
- Schneider et al. (2017) Schneider A., Windsor J., Cushing M., Kirkpatrick J., Shkolnik E., 2017, AJ, 153, 4
- Schneider et al. (2019) Schneider A., Shkolnik E., Allers K., Kraus A., Liu M., Weinberger A., Flagg L., 2019, AJ, 157, 234
- Scholz (2020) Scholz R., 2020, A&A, 637, 45
- Shkolnik et al. (2012) Shkolnik E., Anglada-Escudé G., Liu M., Bowler B., Weinberger A., Boss A., Reid I., Tamura M., 2012, ApJ, 758, 56
- Shkolnik et al. (2017) Shkolnik E., Allers K., Kraus A., Liu M., Flagg L., 2017, AJ, 154, 69
- Song et al. (2003) Song I., Zuckerman B., Bessell M S., 2003, ApJ, 599, 342
- Song et al. (2012) Song I., Zuckerman B., Bessell M S., 2012, AJ, 144, 8
- Tognelli et al. (2011) Tognelli E., Prada Moroni P. G., Degl’Innocenti S., 2011, A&A, 533, 109
- Zuckerman et al. (2001) Zuckerman B, Song I., Bessell M S., Webb R A., 2001, ApJ, 562, 87
- Zuckerman & Song (2004) Zuckerman B., Song I., 2004, ARA&A, 42, 685
Appendix A Generation of Youth(CMD) map
In the assessment of young cool dwarfs, we generated a model map for a youth parameter [Youth(CMD)] on a colour-magnitude diagram using three Gaia photometric bands (, , and ). The map is empirically derived using bona fide NYMG members and 1,000 randomly selected old stars from Gaia EDR3 (Fig. 1). In creating the Youth(CMD) map, we began with two raw density maps of young and old stars. The model maps for young and old stars were made after taking features of these two raw density maps. First, the raw maps were smoothed by applying a Gaussian filter for eliminating bumpy features on the maps. As a standard deviation () for the Gaussian kernel, 2.0 mag was chosen empirically after testing several values (e.g., 1.0 mag does not sufficiently smooth the maps, and 3.0 mag smoothes the maps too much resulting in substantial overlaps between young and old maps). The left panel in Fig. 11 illustrates the smoothed maps after applying the Gaussian kernel to the raw maps. Then, the sequences of the density peak as a function of were found by slicing the maps. As an example, a slice at =2.5 is illustrated in the right panel of Fig. 11, displaying the populations of young/old stars as a function of . These sequences are well-fitted with 5th-order polynomial functions (See Fig. 12).
| (3) |
| (4) |
Then, the widths of the model sequences were determined to make model maps. As can be seen in Fig. 11 (right), a standard deviation of the smoothed map can be obtained at each color. Standard deviations were obtained for all color range (1.85.0) and a mean value was calculated. Using peak sequences (equations 3 and 4) and mean values of standard deviations for young and old models (0.607787 and 0.534968), we created model maps (Fig. 2). After normalising and combining these two model maps, we created a Youth(CMD) map having a range from 0 (old) to 1 (young), where a star’s Youth(CMD) can be obtained based on a location on the map.
Appendix B New candidate NYMG members
| Gaia source_id | Group | Youth(CMD) | Youth(NUV)a | ||||||||||
|---|---|---|---|---|---|---|---|---|---|---|---|---|---|
| hh:mm:ss | dd:mm:ss | mas yr-1 | mas yr-1 | mas | mag | mag | % | % | mag | ||||
| 4683757944772826624 | ABDor | 00:06:05.23 | -77:56:08.0 | 125.95 | 8.09 | 19.47 | 13.35 | 2.84 | 97 | 97 | 0.96 | 22.08 | 1 |
| 2335390189483121152 | ABDor | 00:13:52.41 | -25:33:30.0 | 140.04 | -4.83 | 23.58 | 13.04 | 2.93 | 98 | 98 | 0.98 | 20.28 | 1 |
| 2431769083806305152 | ABDor | 00:19:32.06 | -05:54:41.7 | 107.68 | -68.02 | 22.34 | 14.65 | 3.53 | 99 | 99 | 0.98 | 22.77 | 1 |
| 2855743172658367360 | ABDor | 00:24:03.96 | +26:26:28.9 | 141.78 | -54.49 | 26.04 | 13.29 | 2.95 | 90 | 90 | 0.88 | 23.54 | 0 |
| 380142611863228928 | ABDor | 00:26:02.88 | +39:47:23.9 | 219.14 | 21.89 | 25.61 | 14.25 | 3.21 | 92 | 92 | 0.75 | 22.14 | 1 |
| … | |||||||||||||
| … | |||||||||||||
| … | |||||||||||||
-
a
0: old, 1: young, 2: indecisive of youth; the youth was evaluated using (see Section 2.2.1 for details).