How a leak can stop itself
Abstract
Small fluid leaks are common and frequently troublesome. We often consider how to stop a leak, but here we ask a different question: how might a leak stop itself? We experimentally study leaking flow transitions from continuous drainage to spontaneous arrest. High-speed imaging reveals that fluid breakup events generate droplets whose Laplace pressures oppose the leak. Early droplets grow unstably, but a final droplet equilibrates to a stable spherical cap via lightly damped harmonic oscillations. A total energetic theory shows that inertia plays a key role in the leak-stop mechanism.
When a tube springs a leak, the behavior of the exiting liquid depends on fluid and vessel material properties, geometry and orientation of the hole, and driving pressure [1, 2]. Flow transitions in the related process of pouring from a container—in particular the “teapot effect”—have inspired decades of physics research [3, 4, 5, 6, 7, 8, 9, 10, 11, 12]. Meanwhile, our understanding of the fundamental physical processes that govern transitions between different regimes of a leaking flow—defined as low-volume fluid flow exiting through a constrained geometry—remains incomplete.
Of particular interest is the possibility that a leak could spontaneously arrest even against a nonzero driving pressure. Substantial work has focused on developing methodologies for detecting and evaluating fluid leaks, especially in large-scale systems [13, 14, 15, 16], and the study of leak-like fluid flows in the contexts of imbibition and drainage in porous media is an area of active research [17, 18, 19, 20, 21, 22, 23]. However, understanding the governing physics that determines the moment and mechanism by which a leak might stop itself spontaneously could lead to novel pipe fitting designs [24, 25], engineering failsafes for fluidic systems, and new fundamental insights into fluid flow from constrained geometries. Recent experiments examined a similar drainage problem and observed spontaneous arrest [2], but the mechanism by which a leak can stop itself has not yet been investigated.
In this Letter, we use high-speed imaging to characterize a small fluid leak as it transitions from continuous drainage to spontaneous arrest. Fluid breakoff events during an intermediate dripping regime generate small droplets of fluid covering the hole whose Laplace pressure opposes further leakage. Despite this, early droplets continue to grow unbounded, allowing the leak to continue. Ultimately, a final droplet equilibrates via lightly damped harmonic volume oscillations to form a stable spherical cap of fluid that stops the leak. We develop stability and energetic analyses that account for leak geometry, material properties, and the initial volume and growth rate of the droplets, and find that the initial kinetic energy of newly-formed droplets plays a key role in determining which droplet will stop the leak.
We investigate leaking flow transitions using a simple experimental setup consisting of a 15-mL polypropylene centrifugation tube (inner radius mm; wall thickness 1.62 mm). We modify the tube exterior surface energy by coating it with solid paraffin (Parafilm-M), chosen for its moderate hydrophobicity (contact angle ) [26]. We drill a small (radius mm) hole in the side of the tube using an end mill and carefully de-burr to minimize roughness. The tube is cleaned with isopropanol and soaked in deionized (DI) water to remove any contamination that could affect fluid surface energies, then mounted vertically with respect to gravity.
We initiate a leak by filling the tube with DI water well above the hole so that the filling conditions do not affect subsequent flow behavior. As the fluid drains, the level above the hole continually decreases, providing a smoothly decreasing driving pressure . In a typical experiment, we first observe a jetting flow regime in which the fluid spouts parabolically away from the tube according to Torricelli’s law [27]. As drops, the leak transitions to a rivulet flow in which a continuous stream of fluid partially wets the tube exterior [28, 29, 12]. The rivulet subsequently breaks up via a Rayleigh-Plateau-like instability [30, 31, 28, 29], after which the leak continues via discrete dripping until it spontaneously stops at a consistently-repeatable final driving pressure .
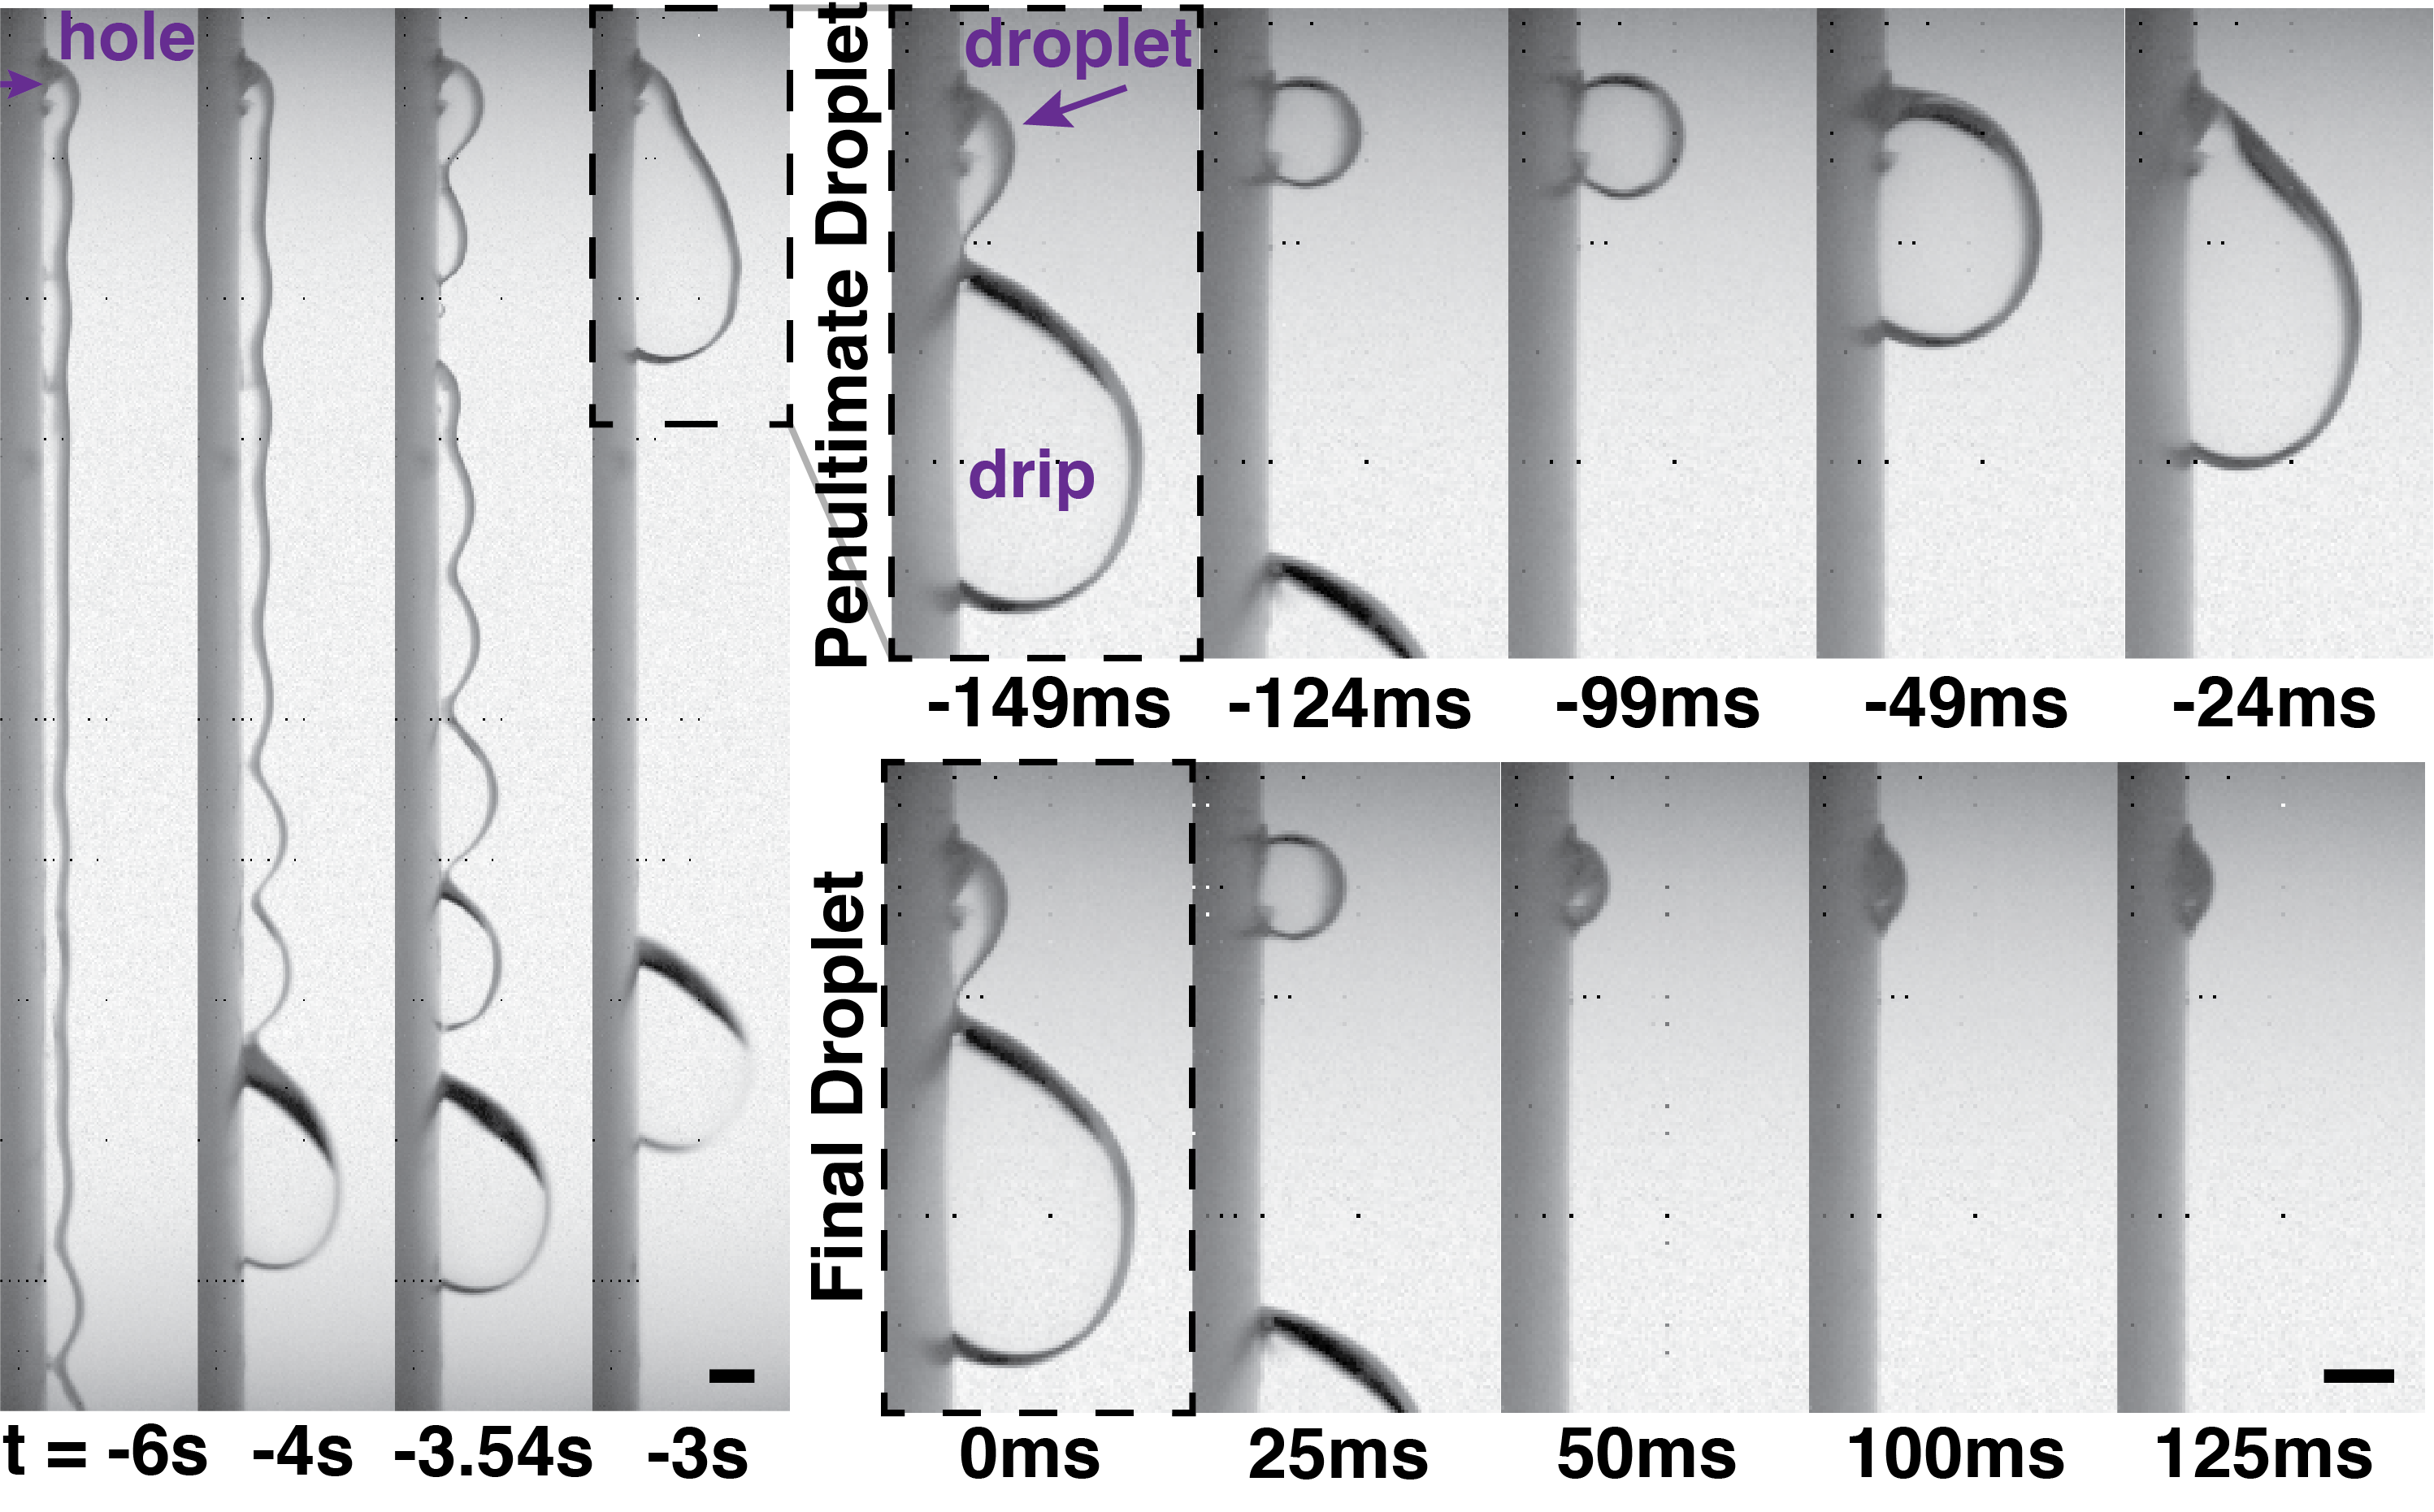
Example images from the final several seconds of a leaking experiment are shown in Fig. 1, including late-stage rivulet flow and breakup (left) through spontaneous arrest (right). High-speed videos were acquired at 1000 frames per second using a Phantom v310 camera equipped with a telecentric lens (Edmund Optics 88-386) and uniformly back-illuminated with a flat LED light source (Edmund Optics 83-873). Raw videos are included in the Supplemental Material [32]. Beginning with the rivulet breakup, each drip breakoff leaves behind a droplet whose surface tension and curvature produce a Laplace pressure that opposes , as seen in Fig. 1(right). We compare the time evolution of the final two droplets on the right side of Fig. 1 as well as in Supplemental Movie 1B, with images aligned according to time since the previous breakoff. The penultimate droplet, like those before it, grows until breaking off as a much larger drip, while the final droplet shrinks after some initial growth and equilibrates to stop the leak. Difference images comparing equivalent times after each breakoff event show that the droplets decrease slightly in size with successive drips, while the drips that break away are indistinguishable from each other for at least the final 20 breakoffs, similar to free dripping [33, 34]. By weighing known numbers of drips, we measure the average drip volume L.
In order to determine what enables one droplet—but not its predecessors—to stop the leak, we measure the geometry of each droplet by mapping its surface over time relative to the flat tube exterior [35, 36]. Newly-formed droplets recoil from breakoff and within several ms assume a spherical cap geometry, which even unstable droplets maintain until growing large enough that gravity begins to break their symmetry. We fit a circle to the central part of all axisymmetric droplet profiles to directly measure the radius of curvature and position of each droplet over time, and determine the droplet contact radius and volume using the measured tube position and spherical cap geometric relations [37]. We find that all droplets have the same initial contact radius mm, about 20% larger than the hole radius, and that the final capping droplet wets out further as it begins to stabilize, ultimately equilibrating with a new constant contact radius .

We plot the measured droplet volume vs. time since the previous breakoff event, , in Fig. 2(a) for the final 16 droplets of this experiment. Data plotted in both Figs. 2 and 3 are colored from blue to red according to droplet number , starting with the final droplet as . Each of the last several droplets experiences an initial slowdown in growth, but for the growth subsequently accelerates again after the droplet exceeds about 1 L. The final droplet, by contrast, reaches a maximum volume of 0.89 L before shrinking at an accelerating rate, undershooting its equilibrium volume and then equilibrating via damped harmonic volume oscillations as shown in Fig. 2(a, Inset).
The Laplace pressures [30] over time provide insight into the force balance driving the evolution of droplet volumes. We calculate using the standard surface tension of pure water, mN/m, and the measured capping droplet radii , and plot vs. in Fig. 2(b). The final droplet equilibrates to a Laplace pressure Pa. This corresponds to balancing a hydrostatic driving pressure from a fluid height above the hole mm, where is the density of water at room temperature and is the gravitational constant. During an individual droplet’s growth as an axisymmetric spherical cap, the change in hydrostatic pressure is negligible ( Pa). Between each successive droplet, on the other hand, each drip that falls away results in an incremental decrease in of Pa. Even accounting for this, it is clear from Fig. 2(b) that several droplets prior to started with but were nonetheless unable to stop the leak.
It is useful to note that two capping droplets can have the same Laplace pressure but different volumes. We plot vs. for the same 16 droplets in Fig. 2(c), and observe distinct upper (larger volume, ) and lower (smaller volume, ) branches that meet at a maximum pressure. The maximum possible Laplace pressure for a capping droplet occurs at the smallest possible radius of curvature, , where the droplet is a hemisphere. All other droplets must have a larger radius of curvature, and hence a smaller Laplace pressure, but can have a larger or smaller volume, as shown schematically in Fig. S1 [32]. We derive analytic expressions for and [32] and plot these curves for (solid) and (dotted) in Fig. 2(c). We see good agreement with our data, with deviations as expected both at large droplet volumes L, where the still-axisymmetric droplet begins to wet out beyond , and during the transition from to for the final droplet.
Droplets on the branch are always unstable. Even when , any perturbation that decreases the droplet pressure also allows the droplet volume to increase, further decreasing the Laplace pressure and leading to runaway growth. The opposite is true for a small perturbation about that increases the droplet pressure; this instead leads to runaway shrinkage of the droplet until it passes through the maximum-pressure hemisphere and crosses over to the lower branch. On the branch, by contrast, the feedback between and is reversed, as can be seen comparing Figs. 2(a) and (b), and becomes a stable, attractive equilibrium. We show snapshots of example droplets at on both branches in Fig. 2(c). In our experiment, all droplets start on the branch with a volume larger than the hemisphere, and only the final droplet crosses over to the stable branch.
The time evolution of all of the droplets suggests a potential energy landscape with an escapable basin of stability that is harmonic for small perturbations about the equilibrium volume. Further, the tendency of droplets to overshoot equilibrium suggests that inertia plays an important role in droplet growth and equilibration. In order to understand our observations quantitatively, we consider the total energy of a control volume defined as all of the fluid above and in the hole, including the droplet. We divide the total energy into an effective potential plus kinetic energy.
We calculate the effective potential energy accounting for both gravitational and surface energy contributions of the fluid in the control volume. We take the zero energy configuration to be at , corresponding to a flat interface covering the hole with surface area and a fluid height . As the droplet increases in volume, the surface area of the capping droplet increases by an amount , where is the height of the spherical cap away from the flat tube surface [32]. Neglecting a very small () term resulting from the loss of hydrostatic pressure from filling the droplet [32], we obtain:
| (1) |
This equivalently represents the work required to push out a droplet of volume under these conditions without changing the velocity field in the fluid.
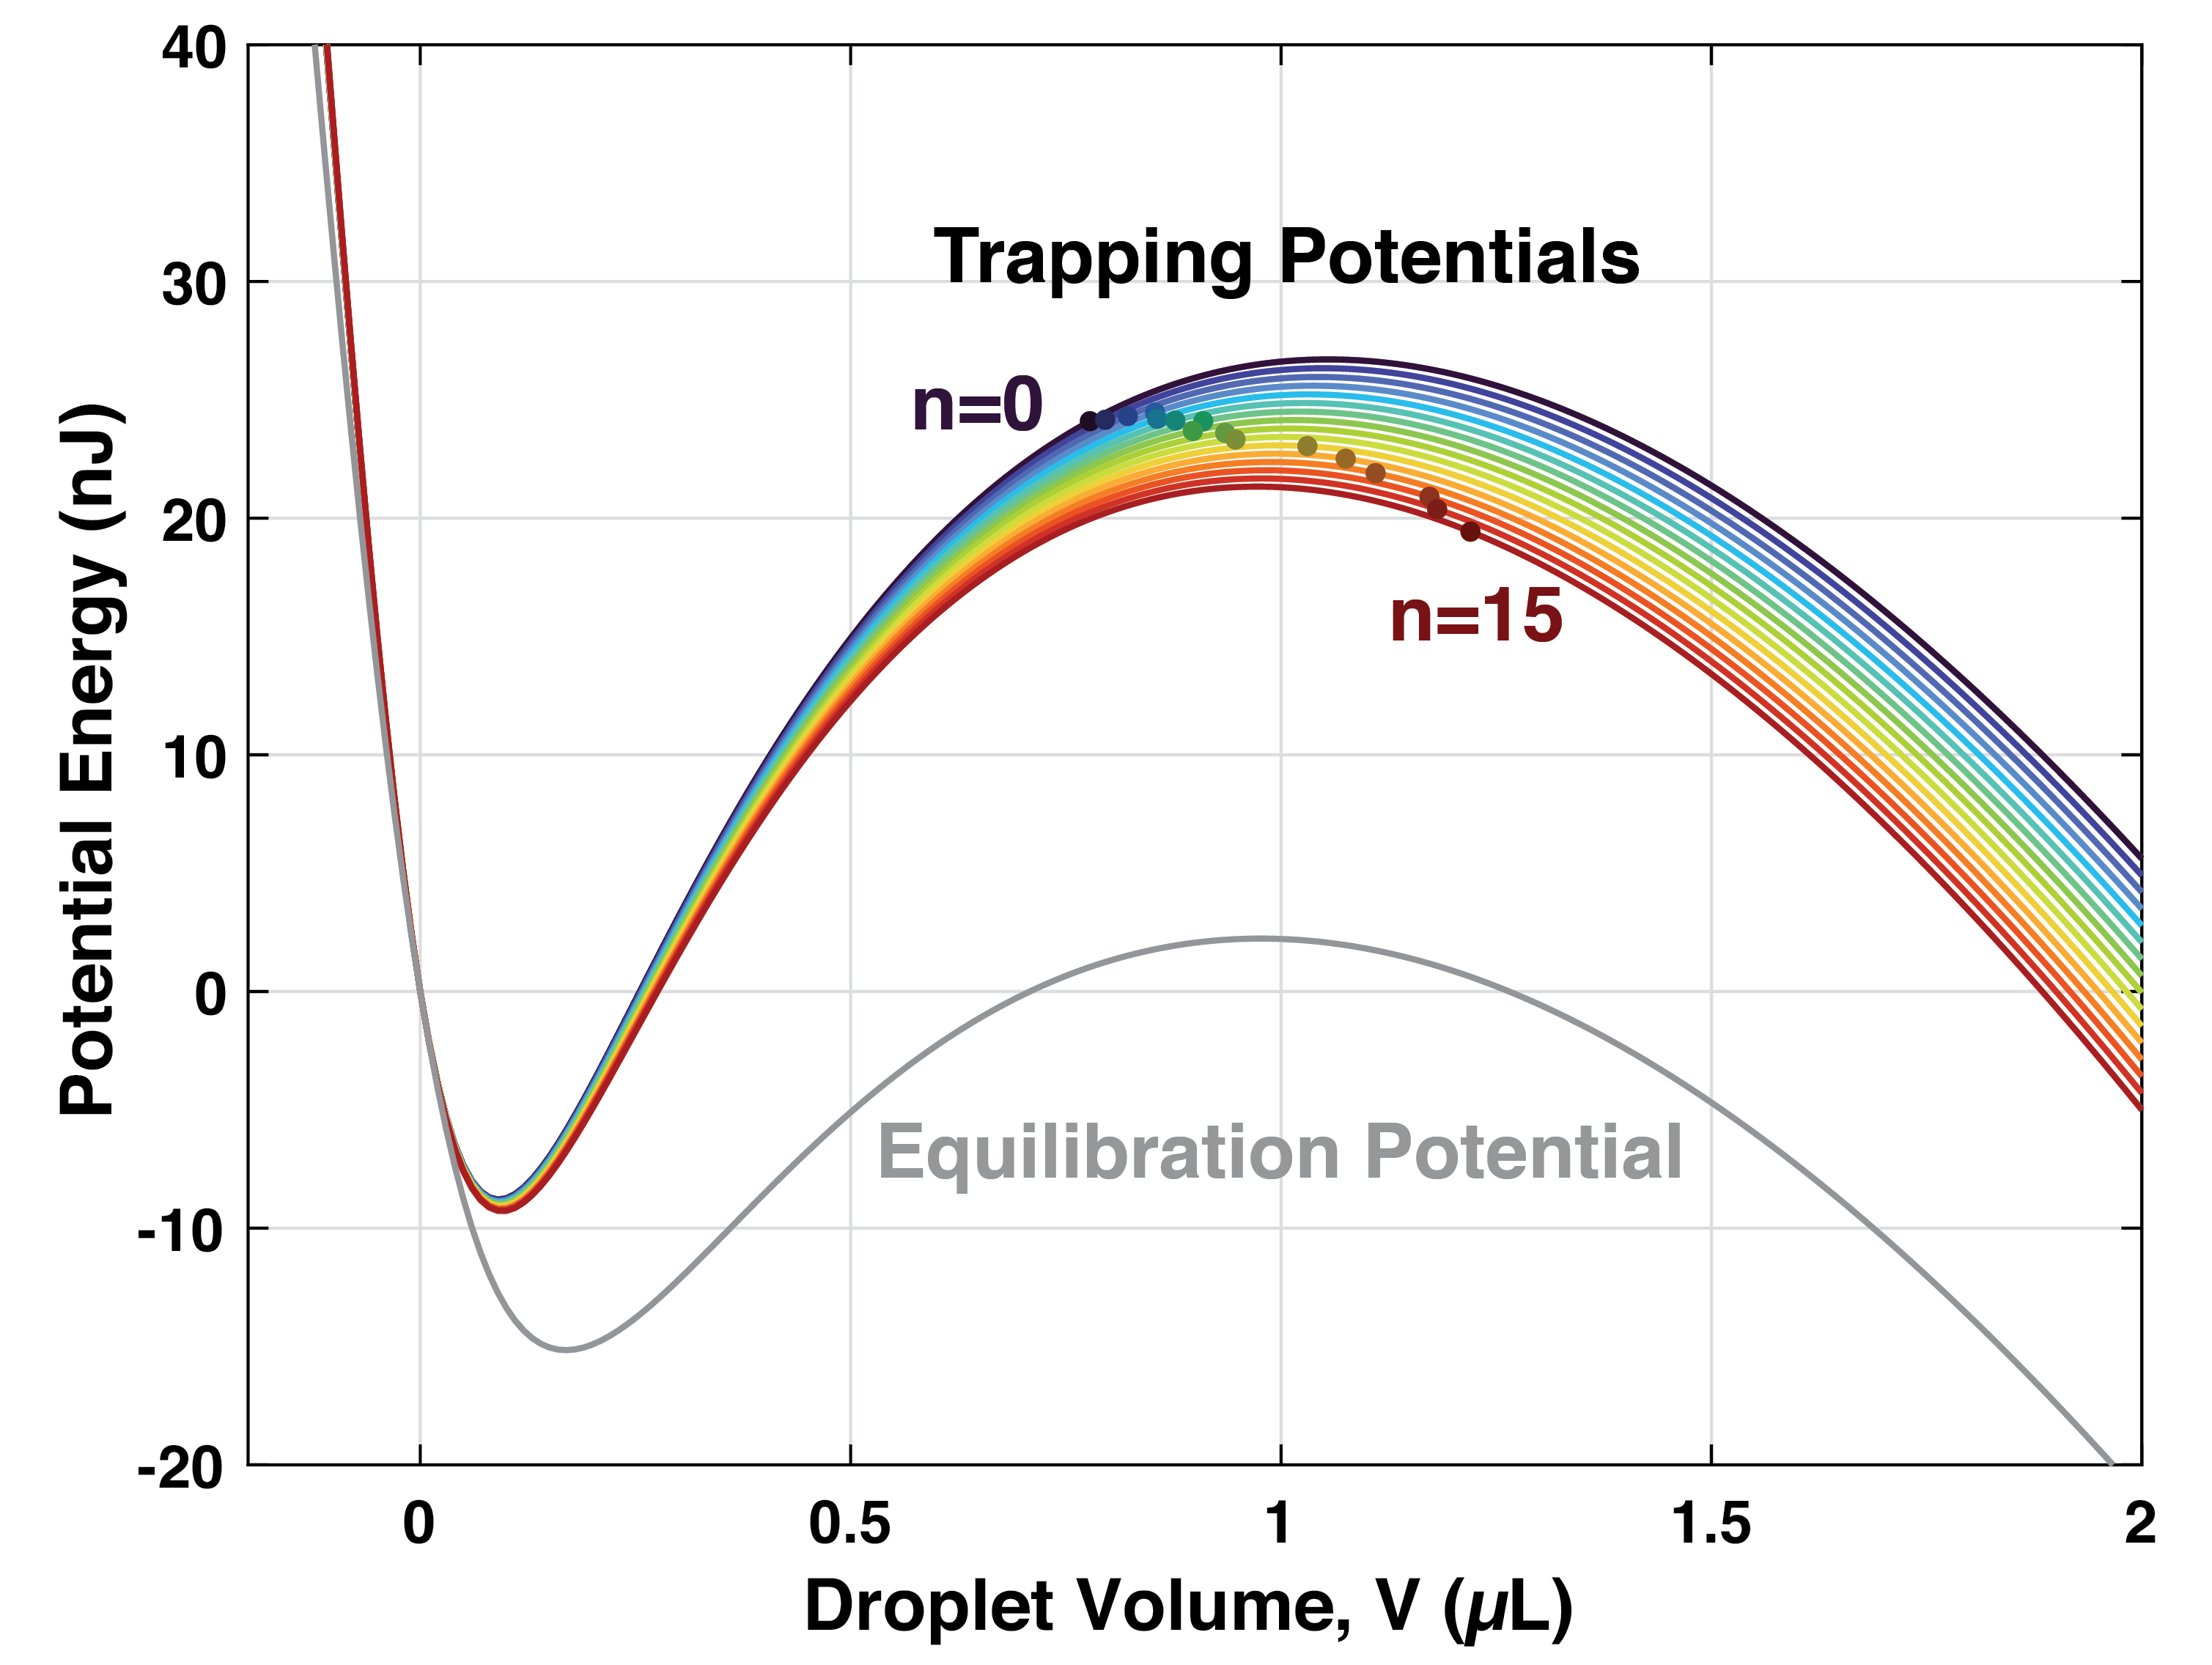
Each droplet initially experiences a trapping potential defined by evaluating Eq. 1 for the initial contact radius and a unique driving pressure which we approximate as to account for the incremental change in with each successive drip. We plot these trapping potentials vs. for the same droplets as above in Fig. 3. We additionally plot the potential in which the final droplet equilibrates (gray line), noting that the larger contact radius results in a shallower potential energy basin compared to the trapping potentials. The local extrema in the potential energy curves correspond to a pair of capping droplets with the same Laplace pressure but different volumes as described above: at the stable minimum and at the unstable local maximum with unique peak energy for each curve. We also plot points corresponding to the potential energy for each droplet evaluated at ms, by which time all droplets were well-fit by a spherical cap. Consistent with our pressure measurements, several of these droplets were small enough to fall within their respective trapping basins, but nonetheless escaped, suggesting that their total energy exceeded .
To evaluate the kinetic energy contribution to rigorously would require a direct measurement of the velocity field throughout the control volume. However, we can take advantage of the observed harmonic volume oscillations of the final droplet to estimate the total kinetic energy by treating the entire system as a classical mass-and-spring harmonic oscillator with effective mass , effective spring constant , and natural frequency . We numerically evaluate for the equilibration potential at its minimum and obtain nJ/L2. We next fit the volume oscillations of the final capping droplet for small displacements () about with the decaying cosine function , as shown in Fig. 2(a, Inset). This yields a measured oscillation frequency ms-1 and damping constant ms-1. From this, we recover the natural frequency of the droplet volume oscillator as because the damping is so light. Combining these results, we find the effective mass of this oscillator to be mgmm4. We note that the dimensions of can be interpreted as [Density/Length]. This suggests that a relevant length scale in determining the effective mass may be mm, interestingly approximately equal to the hole radius.
Putting this all together, we estimate the total energy
| (2) |
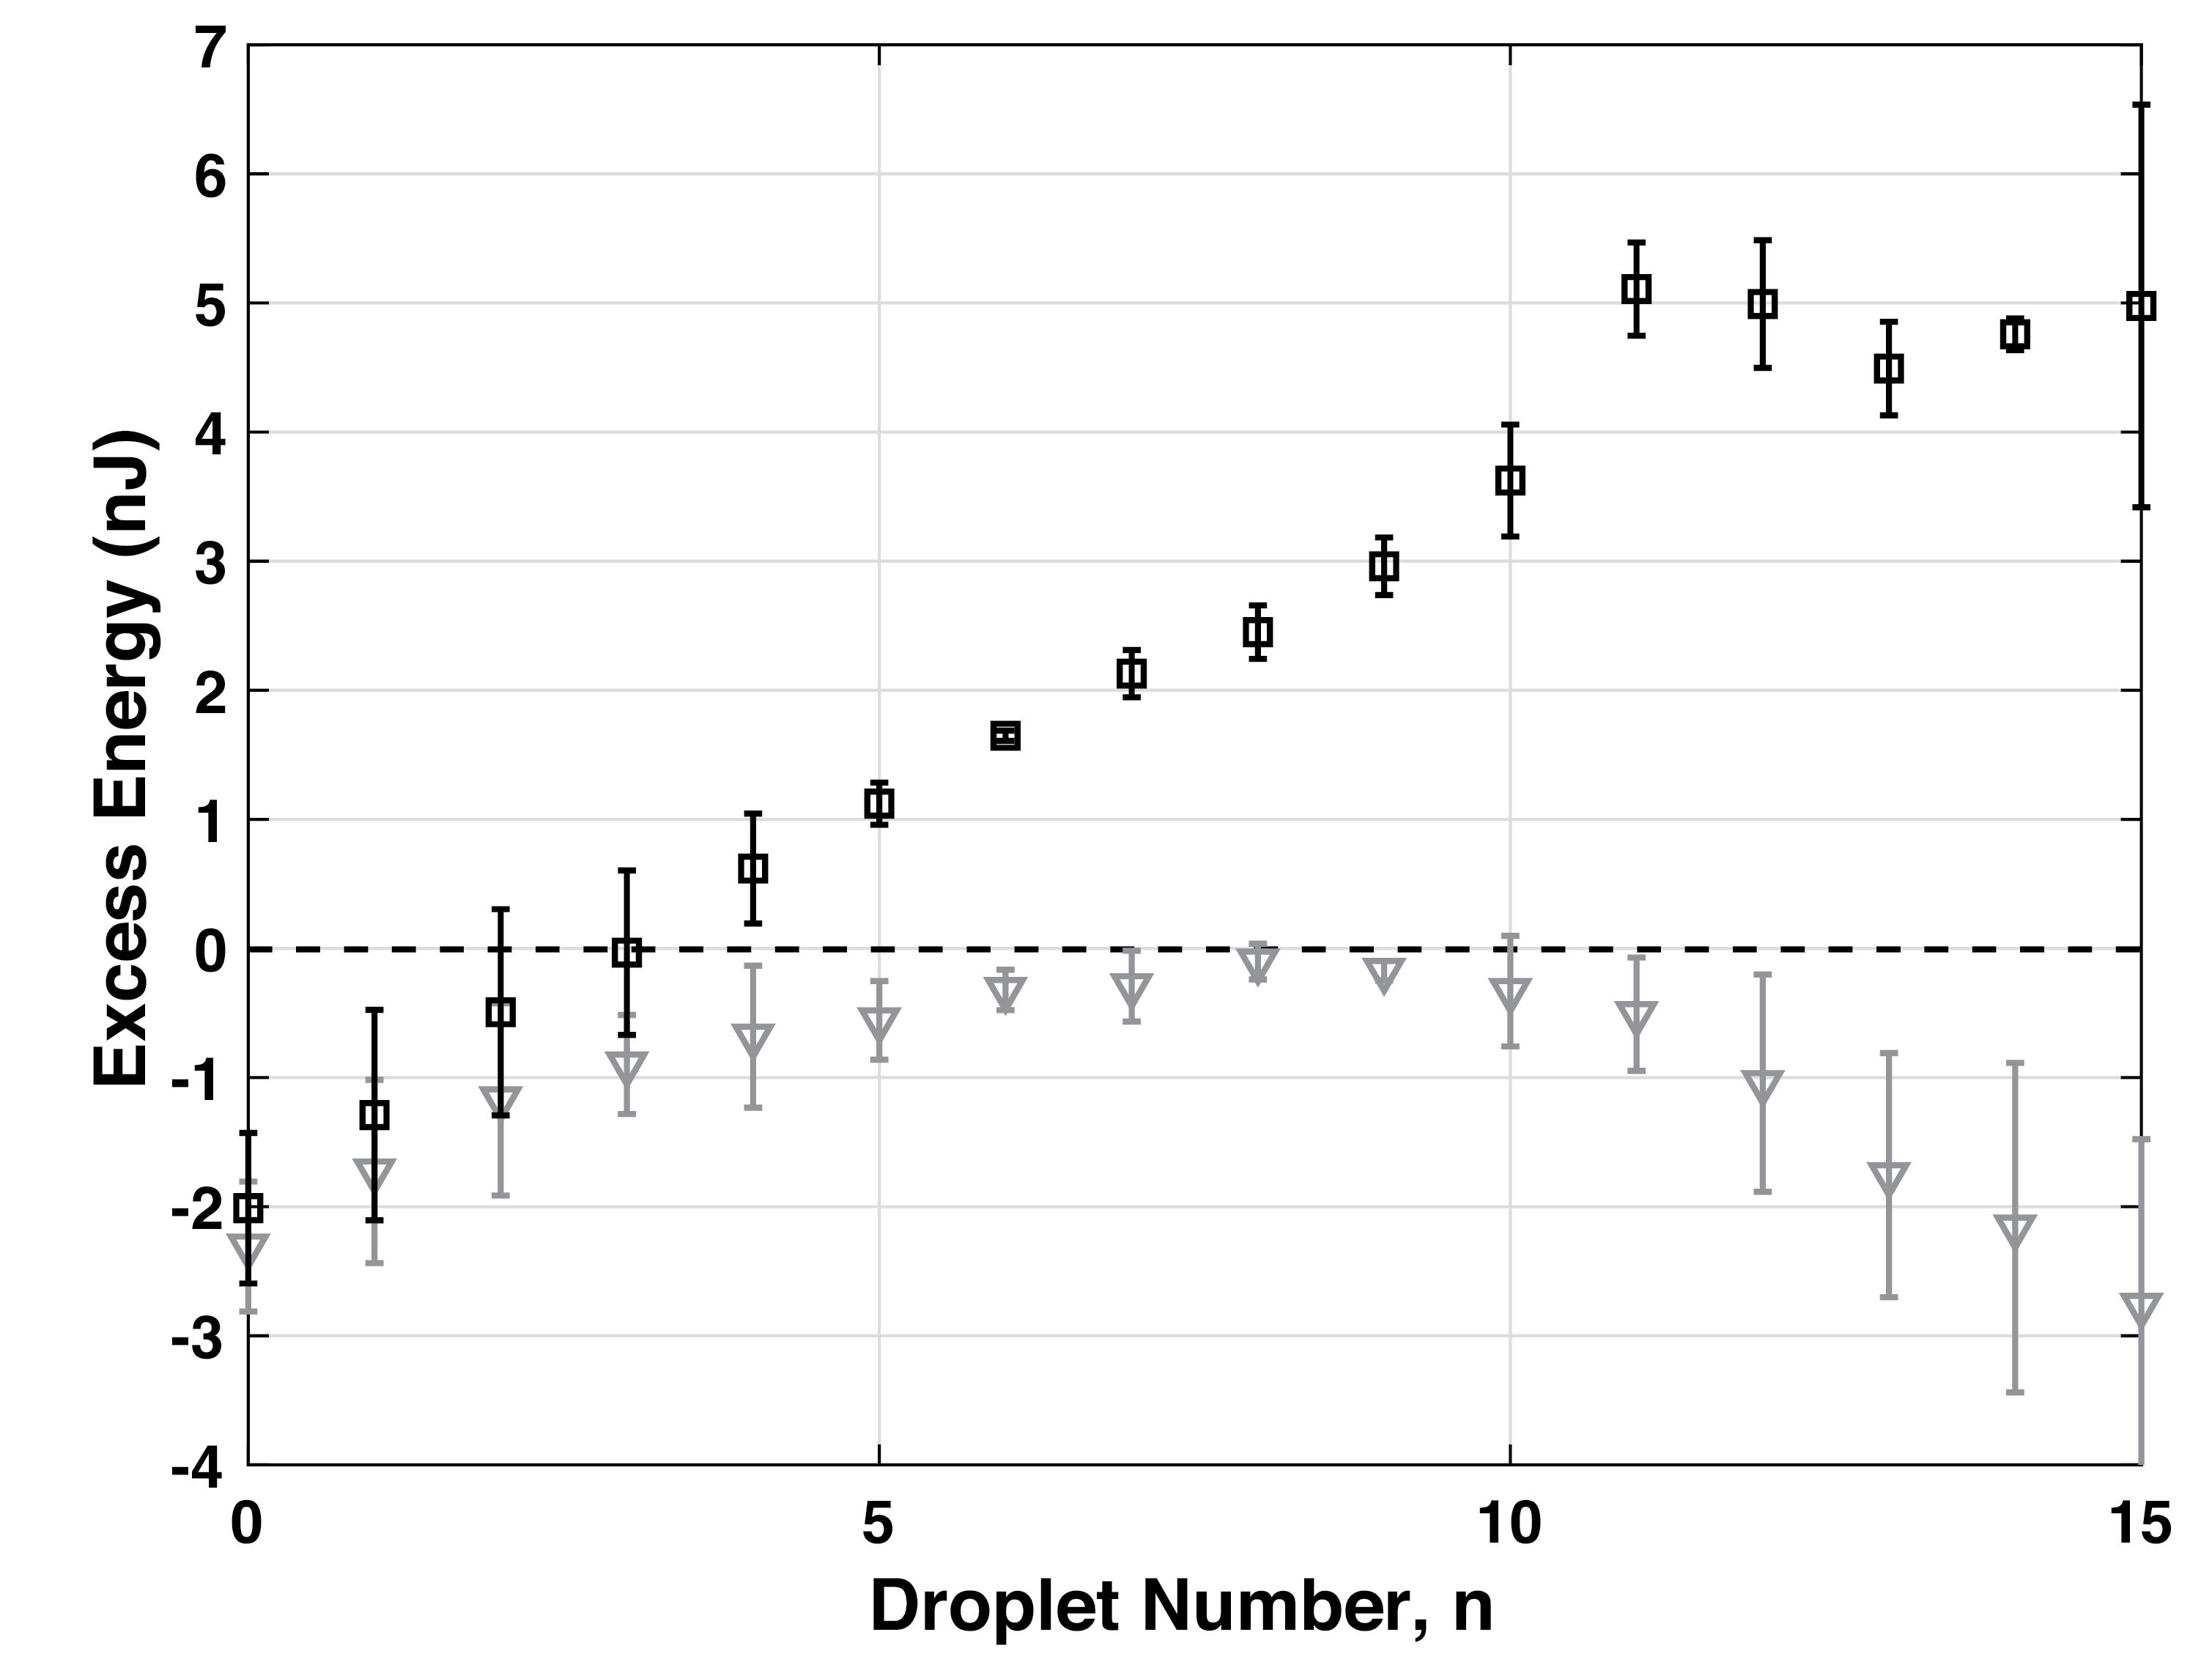
and define the excess energy available for a droplet to escape its trapping potential as . We use the measured droplet volume at ms to compute each droplet’s early-time potential energy, as in Fig. 3, and fit a straight line to vs. at early times up to ms in order to obtain approximate early-time volumetric growth rates . These measured growth rates range from 0.014 L/ms for droplet to 0.083 L/ms for droplet (see Table S1 [32]).
We plot vs. in Fig. 4 (back squares). We quantify experiment-to-experiment variation by plotting the average and standard deviation between two independent repeats with the same setup; results for each experiment are summarized in Tables S1 and S2 [32]. For comparison, we also plot the difference in potential energy from the barrier height, (gray triangles). While an examination of the potential energy alone would suggest that any of the last 8-9 droplets could have stopped the leak, our total energetic theory makes clear that most of these droplets had too much inertia to be caught by their respective trapping potentials. Although our theory predicts that the leaks were likely to stop 1-2 droplets earlier than observed, overall we see good agreement with the experiments, and our analysis clearly captures the progression toward creation of a dynamically stable capping droplet. Importantly, this shows that the kinetic energy has a significant impact on a droplet’s excess energy, contributing over half of the change in total energy per droplet as the system approaches spontaneous arrest.
Our experiments highlight the rich array of physical phenomena present in the flow transitions of leaking fluids. We found that a small fluid leak will stop itself if it can generate a capping droplet that is dynamically stable given the hole geometry, fluid and tube material properties, and initial conditions of the newly-formed droplet. Remarkably, we found that the stabilizing droplets equilibrate as lightly-damped harmonic oscillators, which enabled us to use a classical mechanics approach to estimate the total energy of the system and understand which droplets should be dynamically stable. Interestingly, we note that Eq. 1 for the potential energy of a droplet quantitatively resembles the free energy of a nucleus in classical nucleation theory; it may be interesting in the future to explore leaking flow transitions from the perspective of phase transformations.
Acknowledgements.
C.D.T. and H.E.K. contributed equally to this work. We thank Chuck Extrand, Roderick V. Jensen, and the Soft and Living Materials Group at ETH Zürich for helpful discussions, Hyeongjin Kim for assistance with preliminary imaging experiments, and Luke Moorhead for asking the practical questions that inspired the start of this work. Acknowledgment is made to the Donors of the American Chemical Society Petroleum Research Fund for partial support of this research. C.D.T. was supported by an Edward N. Perry 1968 and Cynthia W. Wood Summer Science Research Fellowship. R.B.T. was supported by an Allison Davis Research Fellowship. K.E.J. received research sabbatical support from both the ETH Zürich Department of Materials and the Williams Class of 1945 World Travel Fellowship. We acknowledge funding from the Williams College Science Center Summer Science Research program and Williams College startup funding.References
- Extrand et al. [2018] C. Extrand, K. Sekeroglu, and K. Vangsgard, Langmuir 34, 12002 (2018).
- Extrand [2018a] C. Extrand, Journal of Adhesion Science and Technology 32, 1142 (2018a).
- Reiner [1956] M. Reiner, Physics Today 9, 16 (1956).
- Keller [1957] J. B. Keller, Journal of Applied Physics 28, 859 (1957).
- Reba [1966] I. Reba, Scientific American 214, 84 (1966).
- Walker [1984] J. Walker, Scientific American 251, 144 (1984).
- Duez et al. [2010] C. Duez, C. Ybert, C. Clanet, and L. Bocquet, Physical Review Letters 104, 084503 (2010).
- Dong et al. [2015a] Z. Dong, L. Wu, N. Li, J. Ma, and L. Jiang, ACS nano 9, 6595 (2015a).
- Dong et al. [2015b] Z. Dong, L. Wu, J. Wang, J. Ma, and L. Jiang, Advanced Materials 27, 1745 (2015b).
- Ferrand et al. [2016] J. Ferrand, L. Favreau, S. Joubaud, and E. Freyssingeas, Physical Review Letters 117, 248002 (2016).
- Shi et al. [2018] L. Shi, Y. Li, Y. Meng, G. Hu, and Y. Tian, The Journal of Physical Chemistry C 122, 21411 (2018).
- Jambon-Puillet et al. [2019] E. Jambon-Puillet, W. Bouwhuis, J. H. Snoeijer, and D. Bonn, Physical Review Letters 122, 184501 (2019).
- Bialous et al. [1969] A. Bialous, P. Peters, and E. Stone, Tech. Rep. (1969).
- Jackson et al. [1998] C. N. Jackson, C. N. Sherlock, and P. O. Moore, Leak Testing (American Society for Nondestructive Testing, 1998).
- Colombo et al. [2009] A. F. Colombo, P. Lee, and B. W. Karney, Journal of hydro-environment research 2, 212 (2009).
- Zhang et al. [2013] J. Zhang, A. Hoffman, K. Murphy, J. Lewis, and M. Twomey, in PSIG Annual Meeting (OnePetro, 2013).
- Washburn [1921] E. W. Washburn, Physical review 17, 273 (1921).
- Perkins and Johnston [1963] T. Perkins and O. Johnston, Society of Petroleum Engineers Journal 3, 70 (1963).
- Datta and Weitz [2013] S. S. Datta and D. A. Weitz, EPL (Europhysics Letters) 101, 14002 (2013).
- Huynh et al. [2017] S. H. Huynh, D. C. K. Chung, M. Muradoglu, O. W. Liew, and T. W. Ng, Langmuir 33, 13892 (2017).
- Extrand [2018b] C. Extrand, Langmuir 34, 2581 (2018b).
- Lu et al. [2021] N. B. Lu, D. B. Amchin, and S. S. Datta, Physical Review Fluids 6, 114007 (2021).
- Esser et al. [2021] S. Esser, E. Löwer, and U. Peuker, Separation and Purification Technology 257, 117854 (2021).
- Extrand [2018c] C. Extrand, Langmuir 34, 4159 (2018c).
- Extrand [2018d] C. Extrand, Langmuir 34, 126 (2018d).
- Yarnold and Mason [1949] G. Yarnold and B. Mason, Proceedings of the Physical Society. Section B 62, 125 (1949).
- White [2021] F. White, Fluid Mechanics (McGraw Hill, 2021).
- Davis [1980] S. H. Davis, Journal of Fluid Mechanics 98, 225 (1980).
- Diez et al. [2009] J. A. Diez, A. G. González, and L. Kondic, Physics of Fluids 21, 082105 (2009).
- De Gennes et al. [2013] P.-G. De Gennes, F. Brochard-Wyart, and D. Quéré, Capillarity and wetting phenomena: drops, bubbles, pearls, waves (Springer Science & Business Media, 2013).
- Rayleigh [1879] L. Rayleigh, Proceedings of the London Mathematical Society 1, 57 (1879).
- [32] See Supplemental Material at [link] for descriptions of included Supplemental Movies, detailed derivation of droplet geometric relations and effective potential energy, a schematic of droplet geometries, and tables of key measured quantities.
- Tate [1864] T. Tate, The London, Edinburgh, and Dublin Philosophical Magazine and Journal of Science 27, 176 (1864).
- Tsai and Wang [2019] P.-H. Tsai and A.-B. Wang, Langmuir 35, 4763 (2019).
- Berman et al. [2019] J. D. Berman, M. Randeria, R. W. Style, Q. Xu, J. R. Nichols, A. J. Duncan, M. Loewenberg, E. R. Dufresne, and K. E. Jensen, Soft matter 15, 1327 (2019).
- Jensen et al. [2015] K. E. Jensen, R. Sarfati, R. W. Style, R. Boltyanskiy, A. Chakrabarti, M. K. Chaudhury, and E. R. Dufresne, Proceedings of the National Academy of Sciences 112, 14490 (2015).
- Weisstein [2008] E. W. Weisstein, Spherical cap (2008), accessed: 14 January 2022, URL https://mathworld.wolfram.com/SphericalCap.html.