Retrieving the C and O Abundances of HR 7672 AB: a Solar-Type Primary Star with a Benchmark Brown Dwarf
Abstract
A benchmark brown dwarf (BD) is a BD whose properties (e.g., mass and chemical composition) are precisely and independently measured. Benchmark BDs are valuable in testing theoretical evolutionary tracks, spectral synthesis, and atmospheric retrievals for sub-stellar objects. Here, we report results of atmospheric retrieval on a synthetic spectrum and a benchmark BD—HR 7672 B—with petitRADTRANS. First, we test the retrieval framework on a synthetic PHOENIX BT-Settl spectrum with a solar composition. We show that the retrieved C and O abundances are consistent with solar values, but the retrieved C/O is overestimated by 0.13-0.18, which is 4 times higher than the formal error bar. Second, we perform retrieval on HR 7672 B using high spectral resolution data (R=35,000) from the Keck Planet Imager and Characterizer (KPIC) and near infrared photometry. We retrieve [C/H], [O/H], and C/O to be , , and . These values are consistent with those of HR 7672 A within 1.5-. As such, HR 7672 B is among only a few benchmark BDs (along with Gl 570 D and HD 3651 B) that have been demonstrated to have consistent elemental abundances with their primary stars. Our work provides a practical procedure of testing and performing atmospheric retrieval, and sheds light on potential systematics of future retrievals using high- and low-resolution data.
1 Introduction
Physical and chemical properties of sub-stellar objects can be inferred by modeling observed spectra. When the spectral modeling contains the key physics and chemistry in a self-consistent way, we call it a forward-modeling approach. When the spectral modeling uses a flexible parameterization without a rigorous and self-consistent treatment of involoved physics and chemistry, we call it a free-retrieval approach. Both approaches are valuable in the study of atmospheres of exoplanets.
The majority of forward modeling and free retrieval analyses have been applied to transiting planets (e.g., Waldmann et al., 2015; Zhang et al., 2020), see also a recent review by Madhusudhan (2019). Fewer such analyses exist for directly-imaged exoplanets (e.g., Konopacky et al., 2013), mainly because of the smaller number of targets. However, direct imaging of exoplanets is considered a top science goal for future extremely large telescopes (ELTs, e.g., Mawet et al., 2019) and NASA missions such as HabEx and LUVOIR (Gaudi et al., 2021). Toward the goals of: (1) better understanding exoplanets’ atmospheres, and (2) ultimately detecting biosignatures via spectroscopic observations, we need to address the following challenges facing direct imaging of exoplanets.
First, while most spectral modeling frameworks (e.g., Mollière et al., 2019; Lavie et al., 2017; Baudino et al., 2017) are bench-marked against each other, they have not been tested against benchmark brown dwarfs (BDs), for which we know the dynamical mass (e.g., from radial velocity and/or astrometric measurements) and the chemical composition (e.g., from their companion primary stars). The chemical homogeneity assumption—that stars and BDs form within the same molecular cloud should have identical chemical compositions—has been tested and applied for solar-type and M-type companions (e.g., Mann et al., 2013; Nelson et al., 2021). Such benchmarking efforts have only been done using low spectral resolution data for very limited number of BDs (GJ 570 D and HD 3651 B, Line et al., 2015).
Second, future data from ELTs are likely to include those with very high spectral resolution (R100,000), e.g., MODHIS at TMT (Mawet et al., 2019) and METIS at E-ELT (Brandl et al., 2021), but few existing spectral modeling frameworks can handle such high-resolution data. This drawback has been realized and recent advances have been made for transiting planets (e.g., Fisher et al., 2020).
Third, combining high- and low-resolution data presents a challenge. While theoretical frameworks have been proposed (e.g., Brogi et al., 2017) and applied to transiting planets (Gandhi et al., 2019), no such spectral modeling framework has been tested using benchmark BDs to better characterize directly-imaged exoplanets.
The above challenges motivate the retrieval framework in this paper, which can be viewed as an extension of petitRADTRANS (Mollière et al., 2019). In this paper, we (1) test the framework against a synthetic PHOENIX spectrum with known solar composition; and (2) apply the framework on a benchmark BD—HR 7672 B—whose stellar abundance is inferred from its G-type primary star HR 7672 A. We first provide an overview of recent progress in the spectral modeling of BDs and the nature of the HR 7672 AB system.
1.1 Recent Progress in Modeling BDs
Line et al. (2015) presented ground-breaking work where they showed that two benchmark T-type BDs (Gl 570 D and HD 3651 B) have similar C, O, and Fe abundances as their primary stars. T-type BDs were chosen because their cloudless atmospheres, which are simpler than cloudy atmospheres and require fewer modeling parameters. However, Maire et al. (2020) found evidence of patchy or thin cloud for a T-type benchmark BD, HD 19467 B. By comparing to a theoretical model grid and a BD spectral library, Rickman et al. (2020) studied another benchmark BD (HD 13724 B) but provided no C or O abundance. Zhang et al. (2020) used a forward modeling approach to study three late-T-type benchmark dwarfs, HD 3651 B, GJ 570 D, and Ross 458 C and found discrepencies in tempeature, radius, and surface gravity, which they attributed to clouds, reduced vertical temperature gradients, or disequilibrium processes. Kitzmann et al. (2020) used Helios-r2 to retrieve the atmospheric properties of GJ 570 D and stressed the impact of chemical equilibrium on inferred C and O abundances.
There are more challenges in the L-type BD regime because of clouds. Burningham et al. (2017) performed retrieval analyses on two BDs: 2MASS J05002100+0330501 and 2MASSW J2224438−015852 and found evidence of cloudy conditions, but failed to address the anomalously high CO abundance, which was attributed to unrecognized shortcomings in their retrieval model. Gonzales et al. (2020) conducted a similar study on the L- and T-type BD binary J14162408+1348263AB and found a consistent C/O ratio between the binary pair. Peretti et al. (2019) studied another L-type benchmark BD, HD 4747B. However, their retrieved C and O abundances were off by 1.0 dex and 0.4 dex ( dex corresponds to a factor of 10x) from the primary star, which is a 2- discrepancy.
1.2 HR 7672 A and B
HR 7672 A is a solar-type G0 star (Brewer et al., 2016). Due to the radial velocity trend of HR 7672 A, Liu et al. (2002) detected HR 7672 B, which is a L-type BD companion at a separation of 0.8′′. The estimated effective temperature was K. Apparent , , and -band magnitudes were reported in Boccaletti et al. (2003) with values of 14.4, 14.040.14, and 13.040.10. Crepp et al. (2012) refined the dynamical mass of HR 7672 B to lie between 65.6 and 71.1 MJupiter using combined radial velocity and astrometric data sets. With improved Gaia astrometry and a longer RV baseline, Brandt et al. (2019) further constrained the mass of HR 7672 B to be 72.70.8 MJupiter. The rich literature on HR 7672 AB and the recently obtained high-resolution spectrum for HR 7672 B make the system an ideal benchmark to test retrieval frameworks.
 |
 |
The paper is organized as follows. §2 summarizes the observational data. We conduct an independent abundance analysis for HR 7672 A and in report the results in §3. §4 describes our framework of ultra-cool atmosphere retrieval. In §5, we test the framework using a PHOENIX BT-Settl spectrum with solar composition. In §6, we apply the framework to HR 7672 B to check if the retrieved abundances are consistent with the measured abundances from HR 7672 A. Finally, we summarize the paper in §7.
2 Data
We used archival high-resolution spectra to determine the primary stellar abundances. For the BD atmospheric abundances, we obtained high-resolution (R=35,000) data using NIRSPEC fed by the Keck Planet Imager and Characterizer (KPIC, Mawet et al., 2018; Jovanovic et al., 2019; Delorme et al., 2020). To supplement the spectroscopic data, we also gathered photometric data for HR 7672 B. The photometric data serve as low-resolution data (R3-5) in our joint high- (R35,000) and low-resolution retrieval, and our retrieval code can handle any spectral resolution R between a few and 1,000,000.
2.1 Spectroscopic Data for HR 7672 A
Keck/HIRES spectroscopic data with wavelength coverage ranging from 4350Å-8690Å was retrieved from the Keck Observatory Archive (KOA). These observations were taken on July 5, 2018 between 13:24:13-13:25:24 UTC (PI: Yong).
Using the associated calibration files, this raw data was then reduced into a 1-dimensional spectrum using the MAKEE pipeline111https://sites.astro.caltech.edu/~tb/makee/. The MAKEE reduction process involves wavelength scaling using calibration images (ThAr arcs), flat-field correction for large-scale continuum fluctuations, and CCD bias subtraction. The resulting signal-to-noise ratio at 7770Å (near the O I triplet) is approximately 300.
2.2 Spectroscopic Data for HR 7672 B
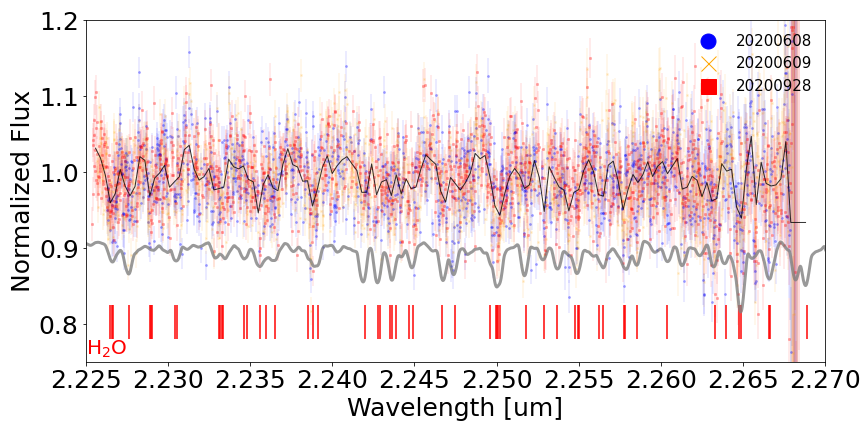
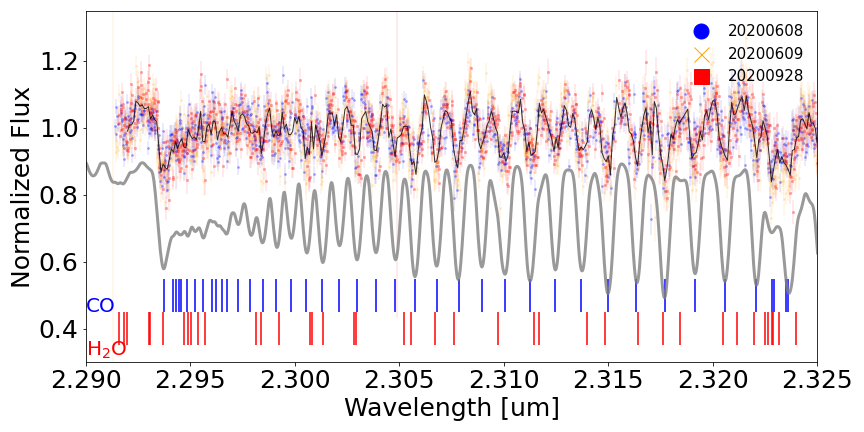
HR 7672 B was observed in K-band () with Keck/NIRSPEC/KPIC on three occasions summarized in Table 1. An A0 standard star, zet Aql, was observed each epoch to calibrate the combined transmission of the atmosphere and the instrument. The data were acquired and reduced following the approach described in Delorme et al. (2021). Images were first background subtracted and bad pixel corrected. The fiber trace locations and widths were calibrated using the standard star. The spectra were then extracted using optimal extraction (Horne, 1986). The wavelength solution was derived from observations of the M-giant HIP 81497 using a forward model of the tellurics generated with the Planetary Spectrum Generator (Villanueva et al., 2018) and a Phoenix model of the star (; Husser et al. (2013)).
To obtain the normalized spectra, we perform the following procedures. First, we subtract background from both the target star and the telluric standard star. Second, we divide the target star spectrum by the telluric standard star spectrum to remove the blaze function and telluric lines. Third, we normalize the target star spectrum by dividing by the median of the spectrum. The median spectrum is obtained by running a median kernel with width of 200 pixels. The kernel width, which is about one tenth of the entire spectral order, is selected in order not to affect the molecular absorption lines/bands. Finally, we shift the normalized spectra by a certain radial velocity. The radial velocity is determined by cross-correlating the spectrum of each date with a PHOENIX synthetic spectrum (Allard et al., 2012, 2013; Baraffe et al., 2015, and references therein) with Teff of 1600 K, (g) of 5.5, and solar abundances.
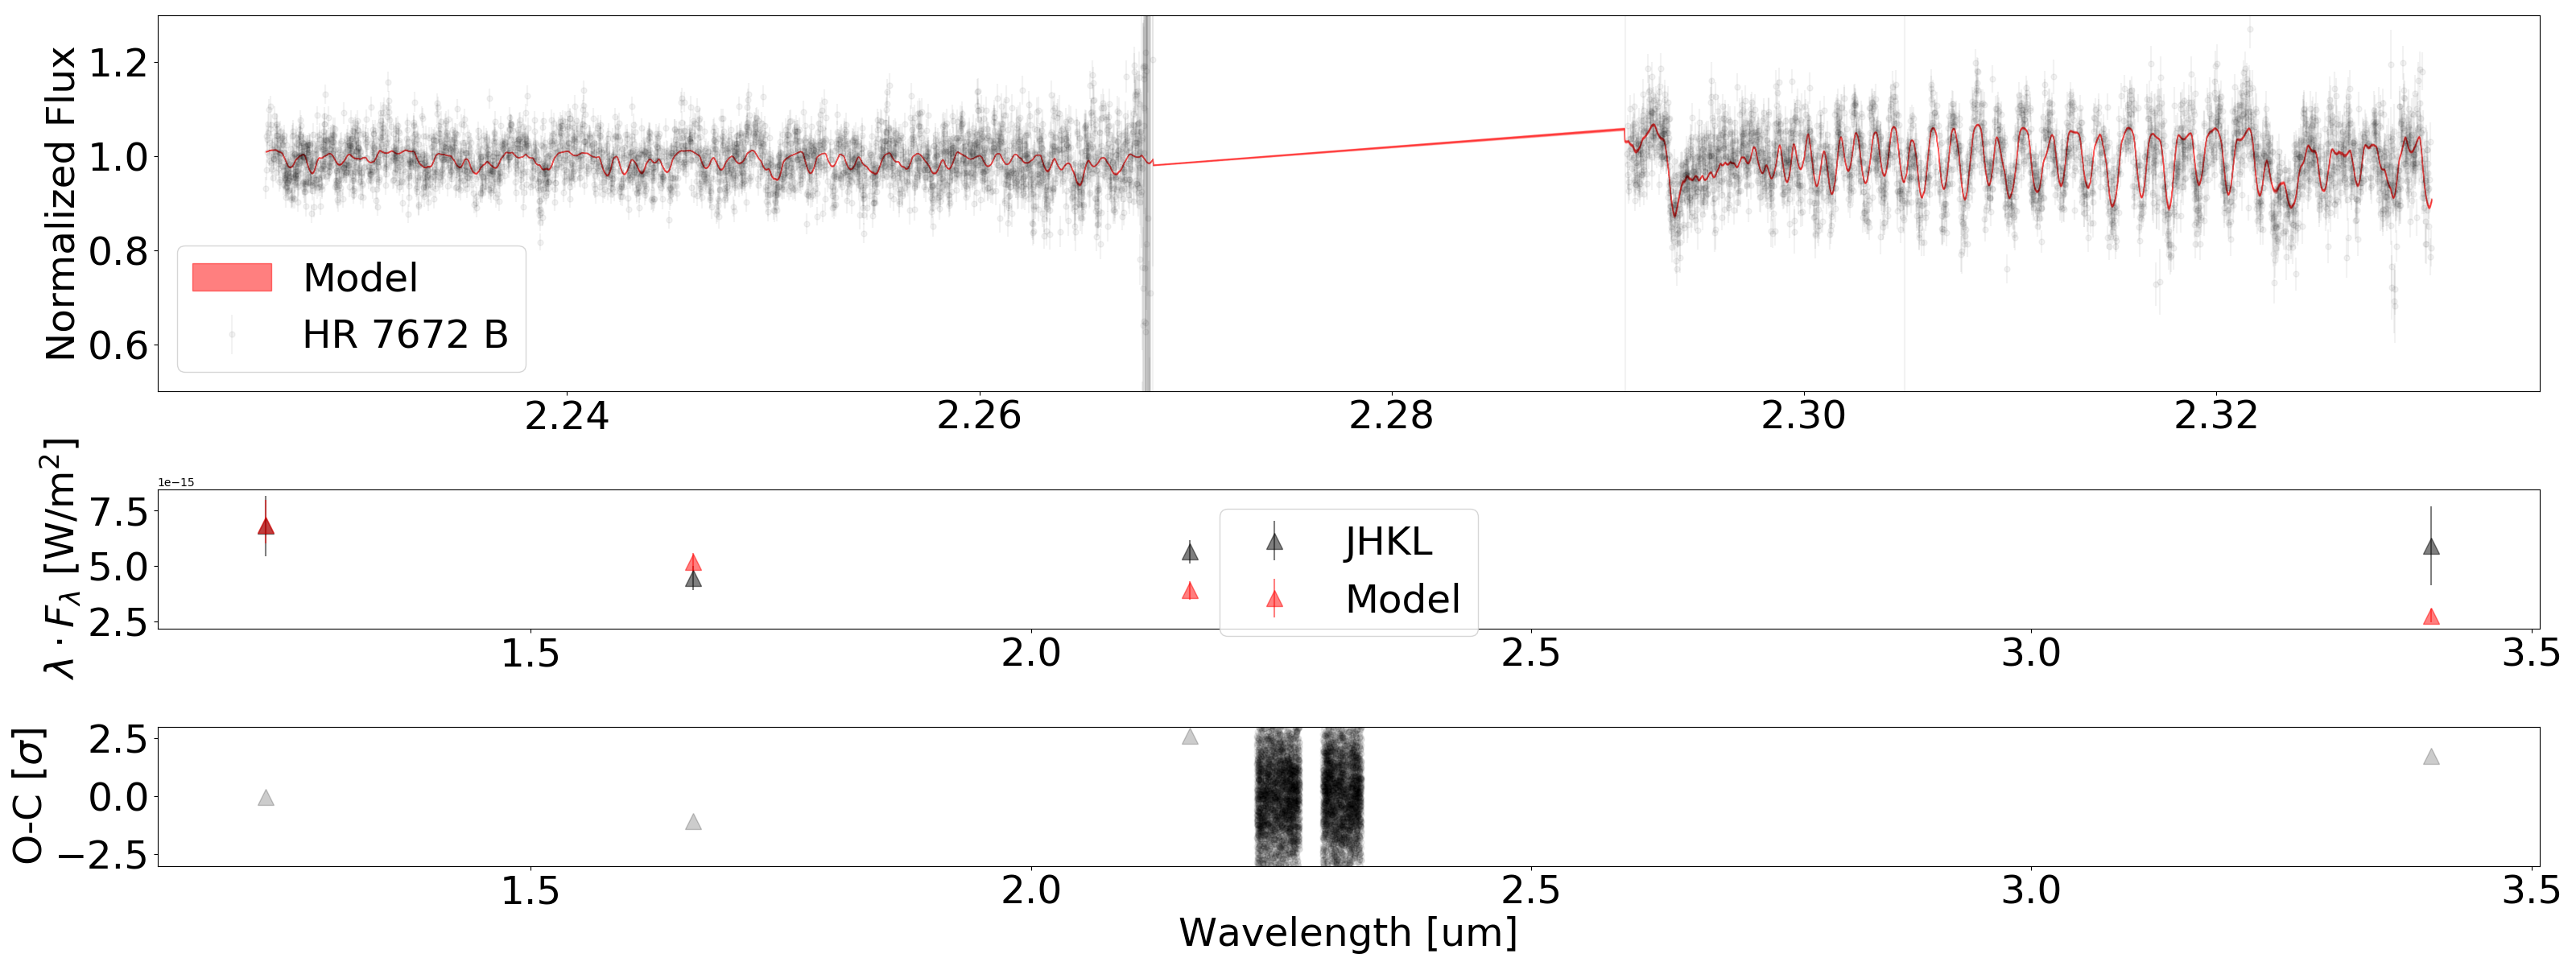
KPIC data sets for HR 7672 B are shown in Fig. 1. We use 2 (out of 9) spectral orders centering around 2.25 and 2.31 m. For other orders, we cannot calibrate the wavelength, the signal-to-noise-ratio is too low, these orders are heavily contaminated by telluric CO2 lines.
| Object | Date | Exposure time | Note |
|---|---|---|---|
| zet Aql | 2020-06-08 | sec | standard |
| HR 7672 B | 2020-06-08 | min | |
| zet Aql | 2020-06-09 | sec | standard |
| HR 7672 B | 2020-06-09 | min | |
| zet Aql | 2020-09-28 | sec | standard |
| HR 7672 B | 2020-09-28 | min |
2.3 Photometric Data for HR 7672 B
We used , , and -band differential magnitudes (Crepp et al., 2012) to convert to apparent magnitudes. In the conversion, magnitudes from HR 7672 A are from SIMBAD. The apparent magnitudes are then converted to physical flux in the unit of Wmm-2, assuming a distance of pc (Gaia DR2, Gaia Collaboration et al., 2016, 2018). As such, we adopt , , and Wmm-2 for , , and -band, respectively. The fractional uncertainties for , , and -band fluxes are measured to be 20%, 12%, and 9% (Crepp et al., 2012). Note that the -band flux and the associated error are likely to be affected by speckle contamination (Boccaletti et al., 2003).
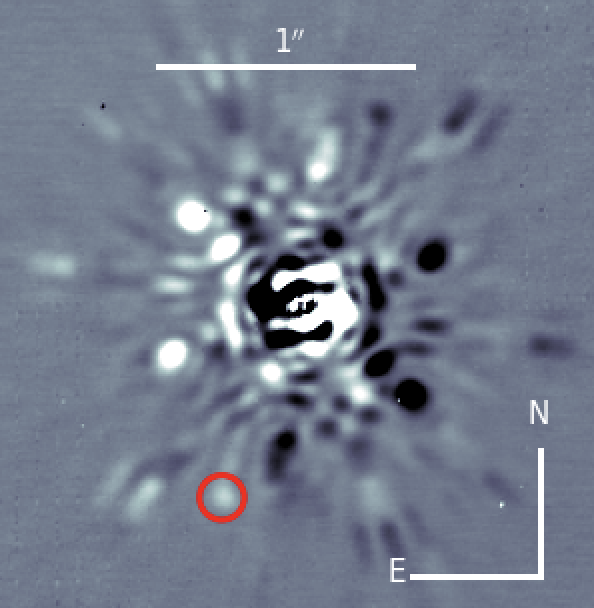
We measured the -band of HR 7672 B using Keck/NIRC2 imaging data from the KOA taken on October 27, 2002 (PI: Graham). We used a total of 40 frames with 0.018 s exposures and 500 coadds. The images were sky-subtracted using sky images taken after the sequence. Because the images were taken in position angle mode, no differential imaging techniques could be used. Instead, we registered all of the frames together by fitting the star in each image with a 2D Gaussian and combined all of the images together. HR 7672 B fortunately lies between the diffraction spikes from the primary star, so is visible after simple mean combination of frames (Fig. 2). To moderately improve the detection, we subtracted a copy of the image that was rotated by 180 degrees to remove symmetric features in the stellar PSF. We then fit a 2D Gaussian to the brown dwarf companion, and measured a flux ratio of in -band. This leads to a -band flux of Wmm-2.
3 Stellar Atmospheric Parameters and Abundances of HR 7672 A
We performed our stellar parameter derivation, abundance measurements, and error analysis using the same code and 1D-LTE analysis process explained in Sections 5.1 through 5.3 of Kolecki et al. (2021). We present a brief overview here. The results are reported in Table 2 and Table 3.
3.1 Stellar Parameters
3.1.1 Efffective Temperature and Surface Gravity
We derived Teff and (g) by comparing magnitudes from Gaia (, , ), 2MASS (, , ), and WISE (, , , ) with theoretical stellar isochrones from the Dartmouth Stellar Evolution Database222http://stellar.dartmouth.edu/models/ (Dotter et al., 2007).
At a fixed metallicity, we calculated the sum of the differences (i.e. residuals) between observed and isochronal values for each pass band magnitude along an age-EEP (equivalent evolutionary phase) isochrone grid. A contiguous area where the residuals are within 10% of their absolute minimum on the grid is chosen as valid points on this isochrone grid to extract Teff and (g) values from. We took the mean of all these resulting values as the final parameters.
3.1.2 Microturbulence ()
To determine a value for the microturbulence velocity (), we first fixed Teff and (g), then minimized the slope of the correlation between abundance and reduced equivalent width (REW) by calculating the slope for a grid of microturbulence velocities and interpolating to find the velocity where the slope was equal to 0.
Uncertainty in the microturbulence parameter was determined by perturbing the value until the slope fell outside the range of uncertainty defined by the linear regression fit.
3.2 Abundances
The use of abfind in MOOG (Sneden, 1973) requires measurement of the equivalent widths of spectral absorption lines. This was done using a semi-automated program. This program displays measurements from fits of both a Gaussian profile and a Voigt profile to each line, along with its direct measurement of the observed data.
From these three options we chose the method which most closely fit trends in the data. This manual screening process allows for the most accurate measurements to be kept for all lines, mitigating the effects of noise, contamination, and improper line fitting. If these effects were too great, we discarded the line from the final line list.
To mitigate the effects of strong line damping on our results, we chose a maximum equivalent width of 100 mÅ, and ignored all lines stronger than this cutoff.
Uncertainties in all abundances were calculated according to the method outlined in Epstein et al. (2010). This method takes the base uncertainty to be the standard deviation of the mean abundance, and modifies it to account for uncertainty and covariances in the atmospheric parameters.
Wavelength, excitation potential and log(gf) data for Fe, C, and O lines was supplied by the NIST Atomic Spectra Database (Kramida et al., 2020). Solar abundances were taken from Palme et al. (2014).
3.2.1 Iron Abundances and [Fe/H]
Once the iteration of stellar parameters was completed, we determined initial [Fe I/H] and [Fe II/H] values of dex and dex respectively, relative to the adopted solar iron abundance of 7.48 (Palme et al., 2014).
From these values, we aimed to use correction tables to account for the limitations of a 1D-LTE (1-dimensional local thermodynamic equilibrium) analysis. Amarsi et al. (2019) have calculated a grid of 3D-LTE/1D-LTE corrections for several Fe II lines which we have used to adjust our Fe II abundance measurement.
Using the point on the grid (Teff= 6000 K, (g) = 4.5, = 1.0 km/s, [Fe/H] = 0.00) that most closely matches the 1D-LTE parameters of HR 7672, we found that the average correction for the Fe II lines we measured results in an increase of this abundance by 0.05 dex. Thus, we report our final [Fe II/H] = .
Taking the overall metallicity ([Fe/H]) to be equal to the average of the Fe I and Fe II abundances and accounting for the effect this has on the uncertainty, [Fe/H] = .
3.2.2 LTE C and O Abundances
We then proceeded to derive the abundances of carbon and oxygen. The oxygen abundance was derived from the O I 777 nm triplet feature, while carbon abundance was derived from lines at 5380.32, 6587.62, 7113.17, 7115.17, and 7116.96Å. From these line features, we found LTE abundances of log() = and log() = , where is the abundance for element and is defined at 1012. The C and O abundances correspond to [C/H] and [O/H] of dex and dex respectively.
3.2.3 Consideration of Non-LTE Effects on C and O Abundances
As the abundance derived from the O I triplet is known to be affected significantly by the LTE assumption, we used the grid of 3D non-LTE (NLTE) corrections calculated by Amarsi et al. (2019) to account for this.
Taking the point on this grid (Teff= 5999 K, (g) = 4.5, = 1.0 km/s, [Fe/H] = 0.00, log() = 8.43, log() = 8.89) that most closely matches the LTE parameters of HR 7672, we find that the NLTE corrections lower [O/H] by 0.22 dex and [C/H] by 0.01 dex. We note that while the carbon NLTE correction is within the uncertainty of [C/H], it does affect the final C/O ratio.
After the NLTE corrections were applied, our final C and O abundances were determined to be log() = and log() = , corresponding to [C/H] and [O/H] of dex and dex.
This leads to an adopted C/O = , where the uncertainty of C/O is given by adding in quadrature the fractional uncertainty of the numerical quantities of C and O and multiplying the result by the C/O value.
3.3 Comparing to Previous Work
HR 7672 A was included in the abundance analysis samples of da Silva et al. (2015), Brewer et al. (2016), and Luck (2017), though the first did not include a [O/H] measurement. Each derived an effective temperature within 30 K of the value adopted in this paper, within the 1 uncertainty range. Each also derived a (g) value within 0.03 dex of our photometric measurement.
Our [Fe/H] measurement is consistently below but in agreement with those of the literature by 1. A similar consistency level is found in the carbon and oxygen abundances. Our log() is within 1 of the values derived by Brewer et al. (2016) and Luck (2017), and within 2 of the value drived by da Silva et al. (2015). Our log() is consistent to within 1 with both mentioned papers which also measured the abundance of oxygen. For more information, values from each paper are compared with our results in Tables 2 and 3.
4 Atmosphere Modeling and Retrieval for HR 7672 B
4.1 Overview of the Modeling and Retrieval Framework
Our framework to model exoplanet atmospheres based on petitRADTRANS is described in Wang et al. (2020) (WW20 hereafter). Since low-resolution broad-band data and high-resolution spectroscopic data are used in the retrievals, we consider both resolution modes in petitRADTRANS (R=1,000 and R=1,000,000). To sample the posterior distribution in a Bayesian framework, we used PyMultiNest (Buchner et al., 2014) which is based on the MultiNest sampling algorithm (Feroz et al., 2009).
Since petitRADTRANS is the core of our retrieval work, the framework described in this paper can be viewed as an extension of petitRADTRANS. Here, we demonstrate that our framework can analyze data sets that include both high- and low-spectral-resolution data and that our framework is benchmarked against synthetic and observed spectra.
4.2 Major Updates Since WW20
We list below the updates of our retrieval code since WW20, which make the framework more versatile, flexible, and physical.
4.2.1 Considering High-Resolution Spectroscopic Data
In WW20, we excluded the high-res mode in petitRADTRANS for practical reasons. First, computational time was greatly reduced. Second, the highest spectral resolution in our data set was at R=5,000 and can be down-sampled to R=1,000, which is the low-res mode in petitRADTRANS, without a significant loss of information content. However, our KPIC data has a spectral resolution of R=35,000 and we need to invoke the high-res mode in petitRADTRANS in modeling BD spectra to maximize the information content. In practice, we compute R=1,000,000 modeled spectra in a very narrow spectral range from 2.18 to 2.36 m, which covers the two spectral orders that we consider. We then downsample the data to match the spectral resolution of KPIC.
4.2.2 Flexible P-T Profile
In WW20, we use an analytical P-T profile (Parmentier & Guillot, 2014; Parmentier et al., 2015) to speed up the posterior sampling. However, we find evidence that the analytical P-T profile may not be sufficiently flexible and can bias the retrieved abundances. We therefore switch to a more flexible P-T profile (Piette & Madhusudhan, 2020). In the newly-adopted P-T profile, there are eight variables including seven temperature differences at eight pre-defined pressure levels: 100.0, 33.3, 10.0, 3.3, 1.0, 0.1, 0.001, 0.00001 bar. The other variable is the temperature at 3.3 bar.
4.2.3 Physical Cloud Treatment
In WW20, we treated clouds as a grey opaque cloud with infinite opacity if pressures were higher than a certain threshold. In reality, however, this assumption of a grey opaque cloud may be inadequate. Using petitRADTRANS, Mollière et al. (2020) adopted a more realistic treatment where silicate and iron clouds were considered. Here, we consider a silicate cloud that only consists of MgSiO3 for the following reasons. First, it is found that an iron cloud is not as prominent as a silicate cloud (Gao et al., 2020) or the iron cloud is at a much deeper level than the MgSiO3 cloud (Burningham et al., 2021). Second, considering only MgSiO3 rather than MgSiO3 and Mg2SiO4 saves computational time, and using both silicate clouds is not expected to provide more meaningful and constraining results compared with a single-cloud model.
In practice, we modify petitRADTRANS so that the cloud opacity is included for both low- and high-res modes. To make sure both modes handle cloud opacity consistently, we consider two scenarios for the low-res mode: one with a MgSiO3 cloud and the other one without a MgSiO3 cloud (i.e., abundance for MgSiO3 is set to be zero). We then interpolate the opacity difference of the two scenarios at the central wavelength of the high-res mode. The interpolated opacity is then added in the high-res mode in calculating modeled spectra.
To find the cloud pressure, we intercept the MgSiO3 condensation curve with the P-T profile. The intercepting pressure marks where the cloud deck is. Then the mass fraction of MgSiO3 decays exponentially from the cloud deck as controlled by the fsed parameter as discussed in §4.3.
 |
 |
4.3 Parameterization
There are 21 parameters in our retrieval code. Three parameters are used to described the BD properties: surface gravity ((g)), planet mass (mp), and the projected rotational velocity (v). Four parameters are for the mass mixing ratio (MMR) of H2O, CO, CO2, and CH4. While there exist other species in the atmosphere, they do not significantly alter the spectroscopic and photometric observables. For example, PH3 has rotation-vibrational features in -band, but they are much weaker than those from CO and H2O, even at a MMR that is a few orders of magnitude higher than expected at chemical equilibrium. Both TiO and VO are unaccounted in our model and may affect -band photometry, but are estimated to be at the 0.1% level, which is much smaller than the photometric uncertainty. Therefore, we focus on four molecular species: H2O, CO, CO2, and CH4.
The MMRs are assumed to be constant at all pressures considered. The constant MMRs are justified by the narrow range of pressures that contribute to the thermal flux as well as the nearly constant MMRs for the two major C and O carriers H2O and CO (see §6.6). Moreover, the constant MMR assumption is found to be favored over varying MMR as a function of altitude (Burningham et al., 2021). Eight parameters are for the flexible P-T profile (§4.2.2). Similar to Mollière et al. (2020), we use four parameters to describe the cloud properties: MMR of MgSiO3, vertical diffusion coefficient (Kzz), the ratio of the cloud particle settling and mixing velocities (fsed), and a log-normal particle size distribution parameter (). The other parameter is for a wavelength shift of the high-resolution spectrum between the data and model.
4.4 Calculating Abundance Ratios
In -band, CO and H2O lines are predominately present in the spectrum (Fig. 1). Therefore, C and O abundances are mainly constrained by detecting and modeling CO and H2O lines. For completeness sake, we also consider CO2 and CH4 in our spectral modeling.
We calculate C/H with the following equation:
| (1) |
where X is volume mixing ratio (VMR). The conversion from MMR to VMR is given in WW20.
The MMRs for all considered species add up to unity. The molecular hydrogen to helium ratio is 3:1 from our primordial composition assumption. Similarly, O/H was calculated using the following equation:
| (2) |
And C/O was calculated as:
| (3) |
5 Testing with a PHOENIX BT-Settl Spectrum
Here we test our retrieval framework using a synthetic spectrum for which we know the C and O abundance. The synthetic spectrum is from the PHOENIX BT-Settl model (Baraffe et al., 2015). We choose a synthetic spectrum with Teff of 1600 K, (g) of 5.5, and solar abundances333The fits file is available at: https://phoenix.ens-lyon.fr/Grids/BT-Settl/CIFIST2011_2015/FITS/. The effective temperature and surface gravity of the synthetic spectrum are similar to those of HR 7672 B.
5.1 Simulating the Data
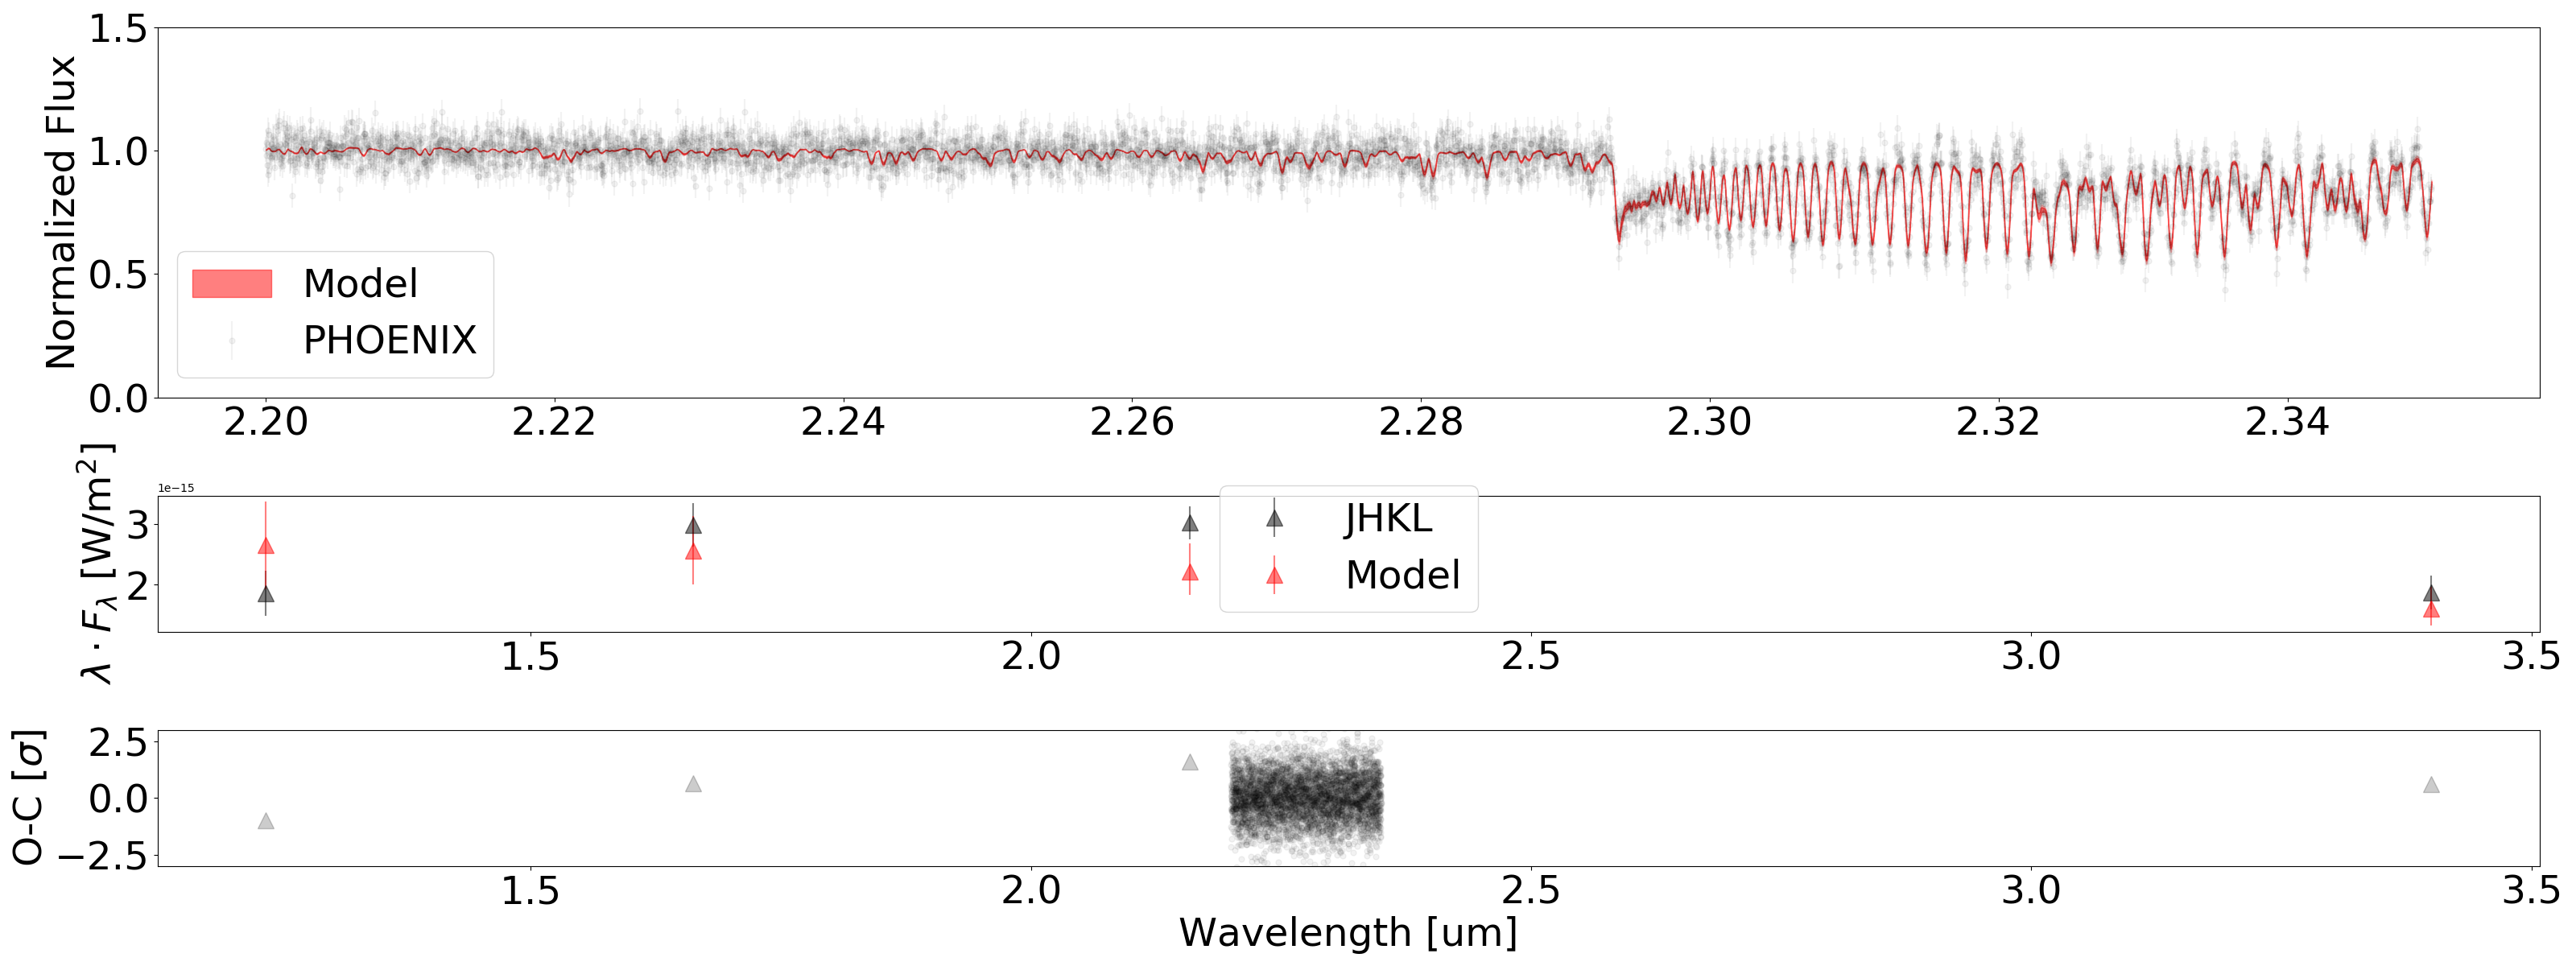
We obtain wavelength and flux from the PHOENIX spectrum and then scale the flux based on distance and radius. We use a distance of 17.72 pc and a radius of 0.75 RJupiter. The radius is consistent with an object with (g) of 5.5 and 72 MJupiter. The fluxes in , , , and -band are estimated and given the following fractional errors: 0.20, 0.12, 0.09, 0.15, which are the fractional errors for the actual photometric measurements for HR 7672 B. For fluxes, we use , , , and Wmm-2 for , , , and -band, respectively.
To simulate high-resolution spectroscopy data, we use a wavelength range from 2.20 to 2.35 m. We apply a rotation broadening of 40 kms-1, convolve the spectrum with a Gaussian kernel that corresponds to spectral resolution of R=35,000, and resample the spectrum with a sampling rate of m, which translates to 2 pixels per resolution element. We add a randomized fractional error of 5% to each data point. The 5% fractional error is comparable to that in the actual HR 7672 B data.
 |
 |
5.2 Retrieval Results
5.2.1 Fixed-Mass Case
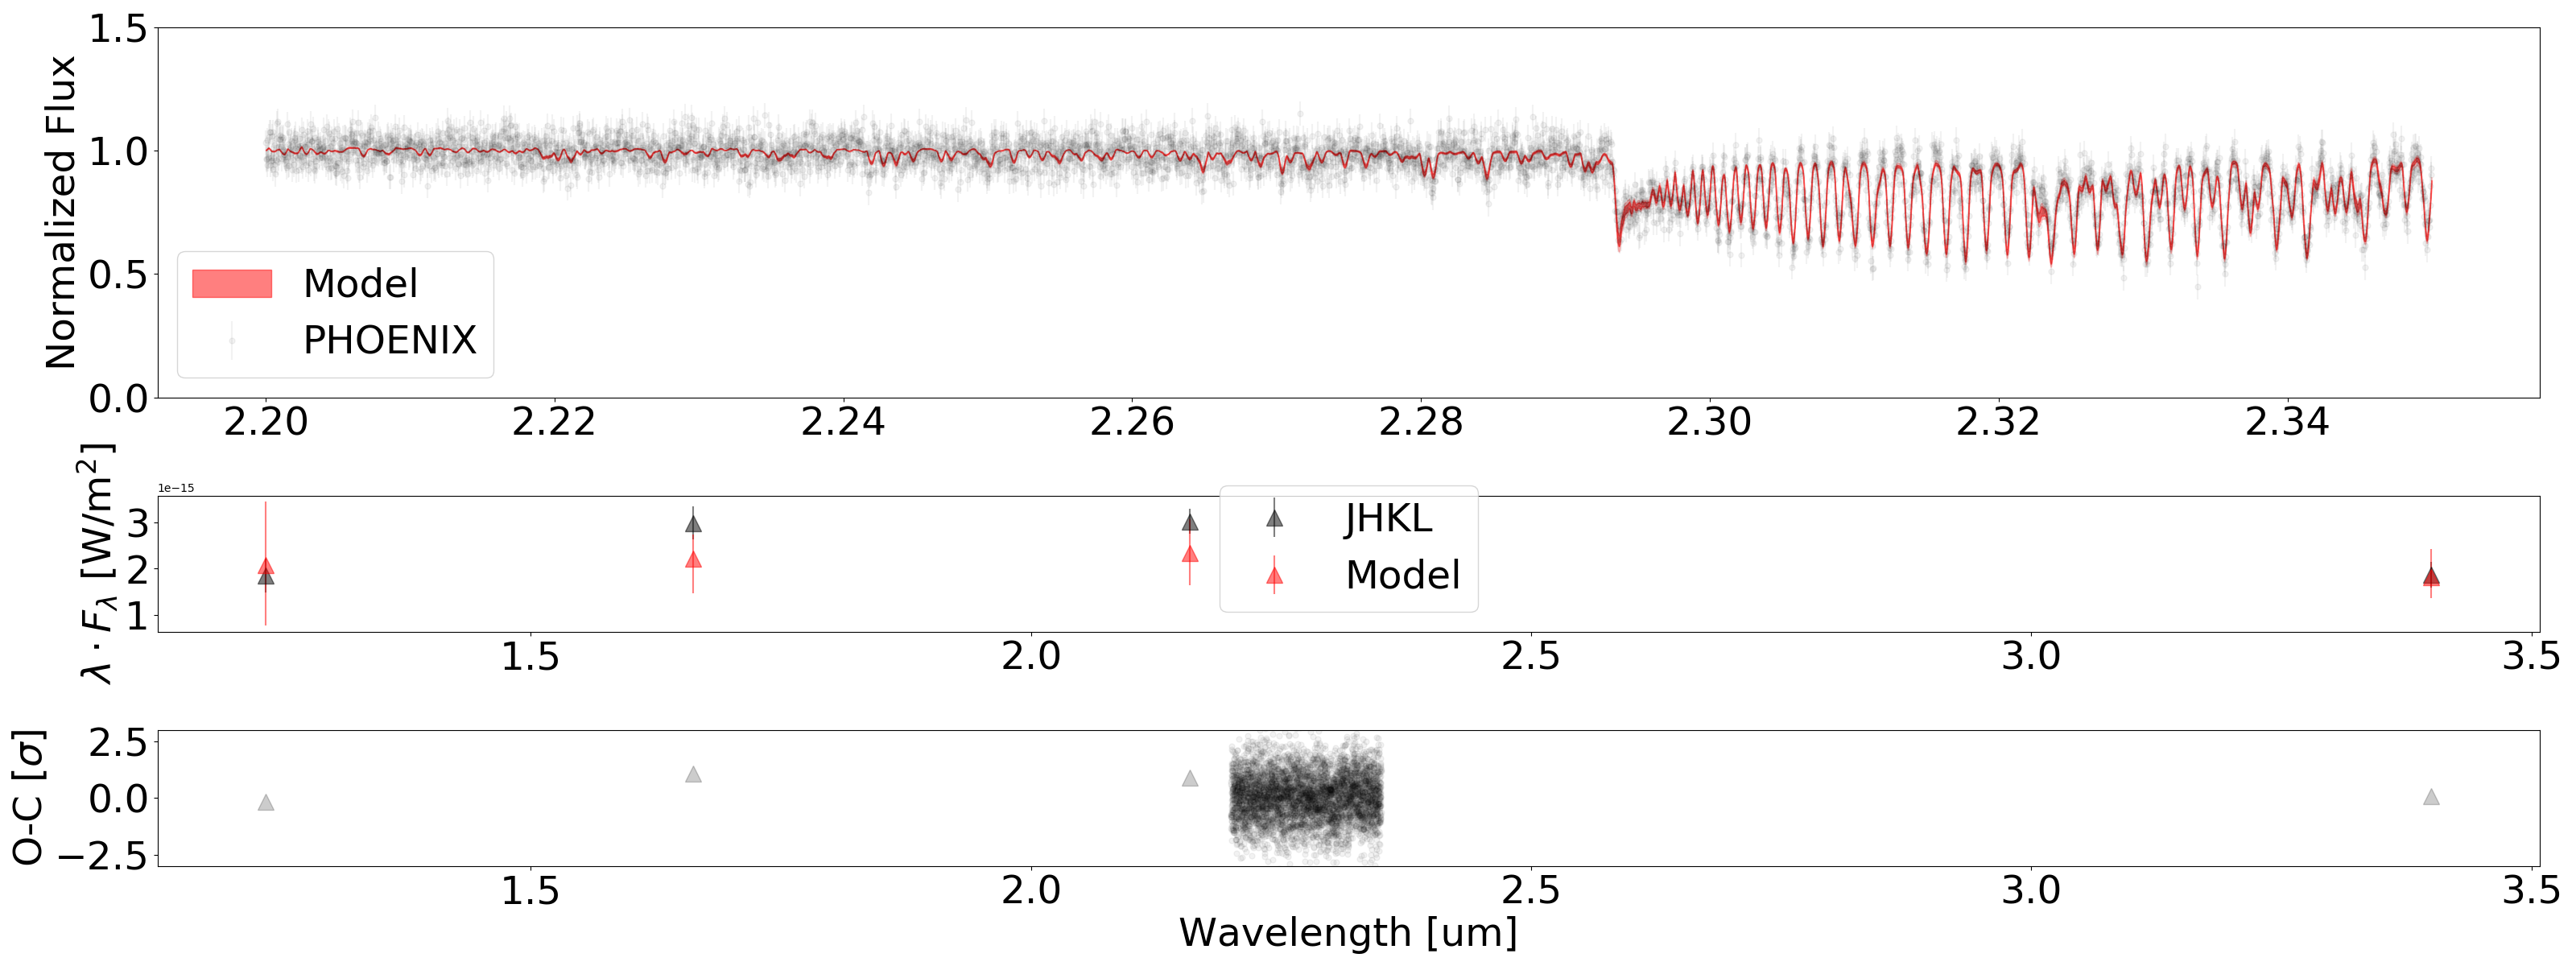
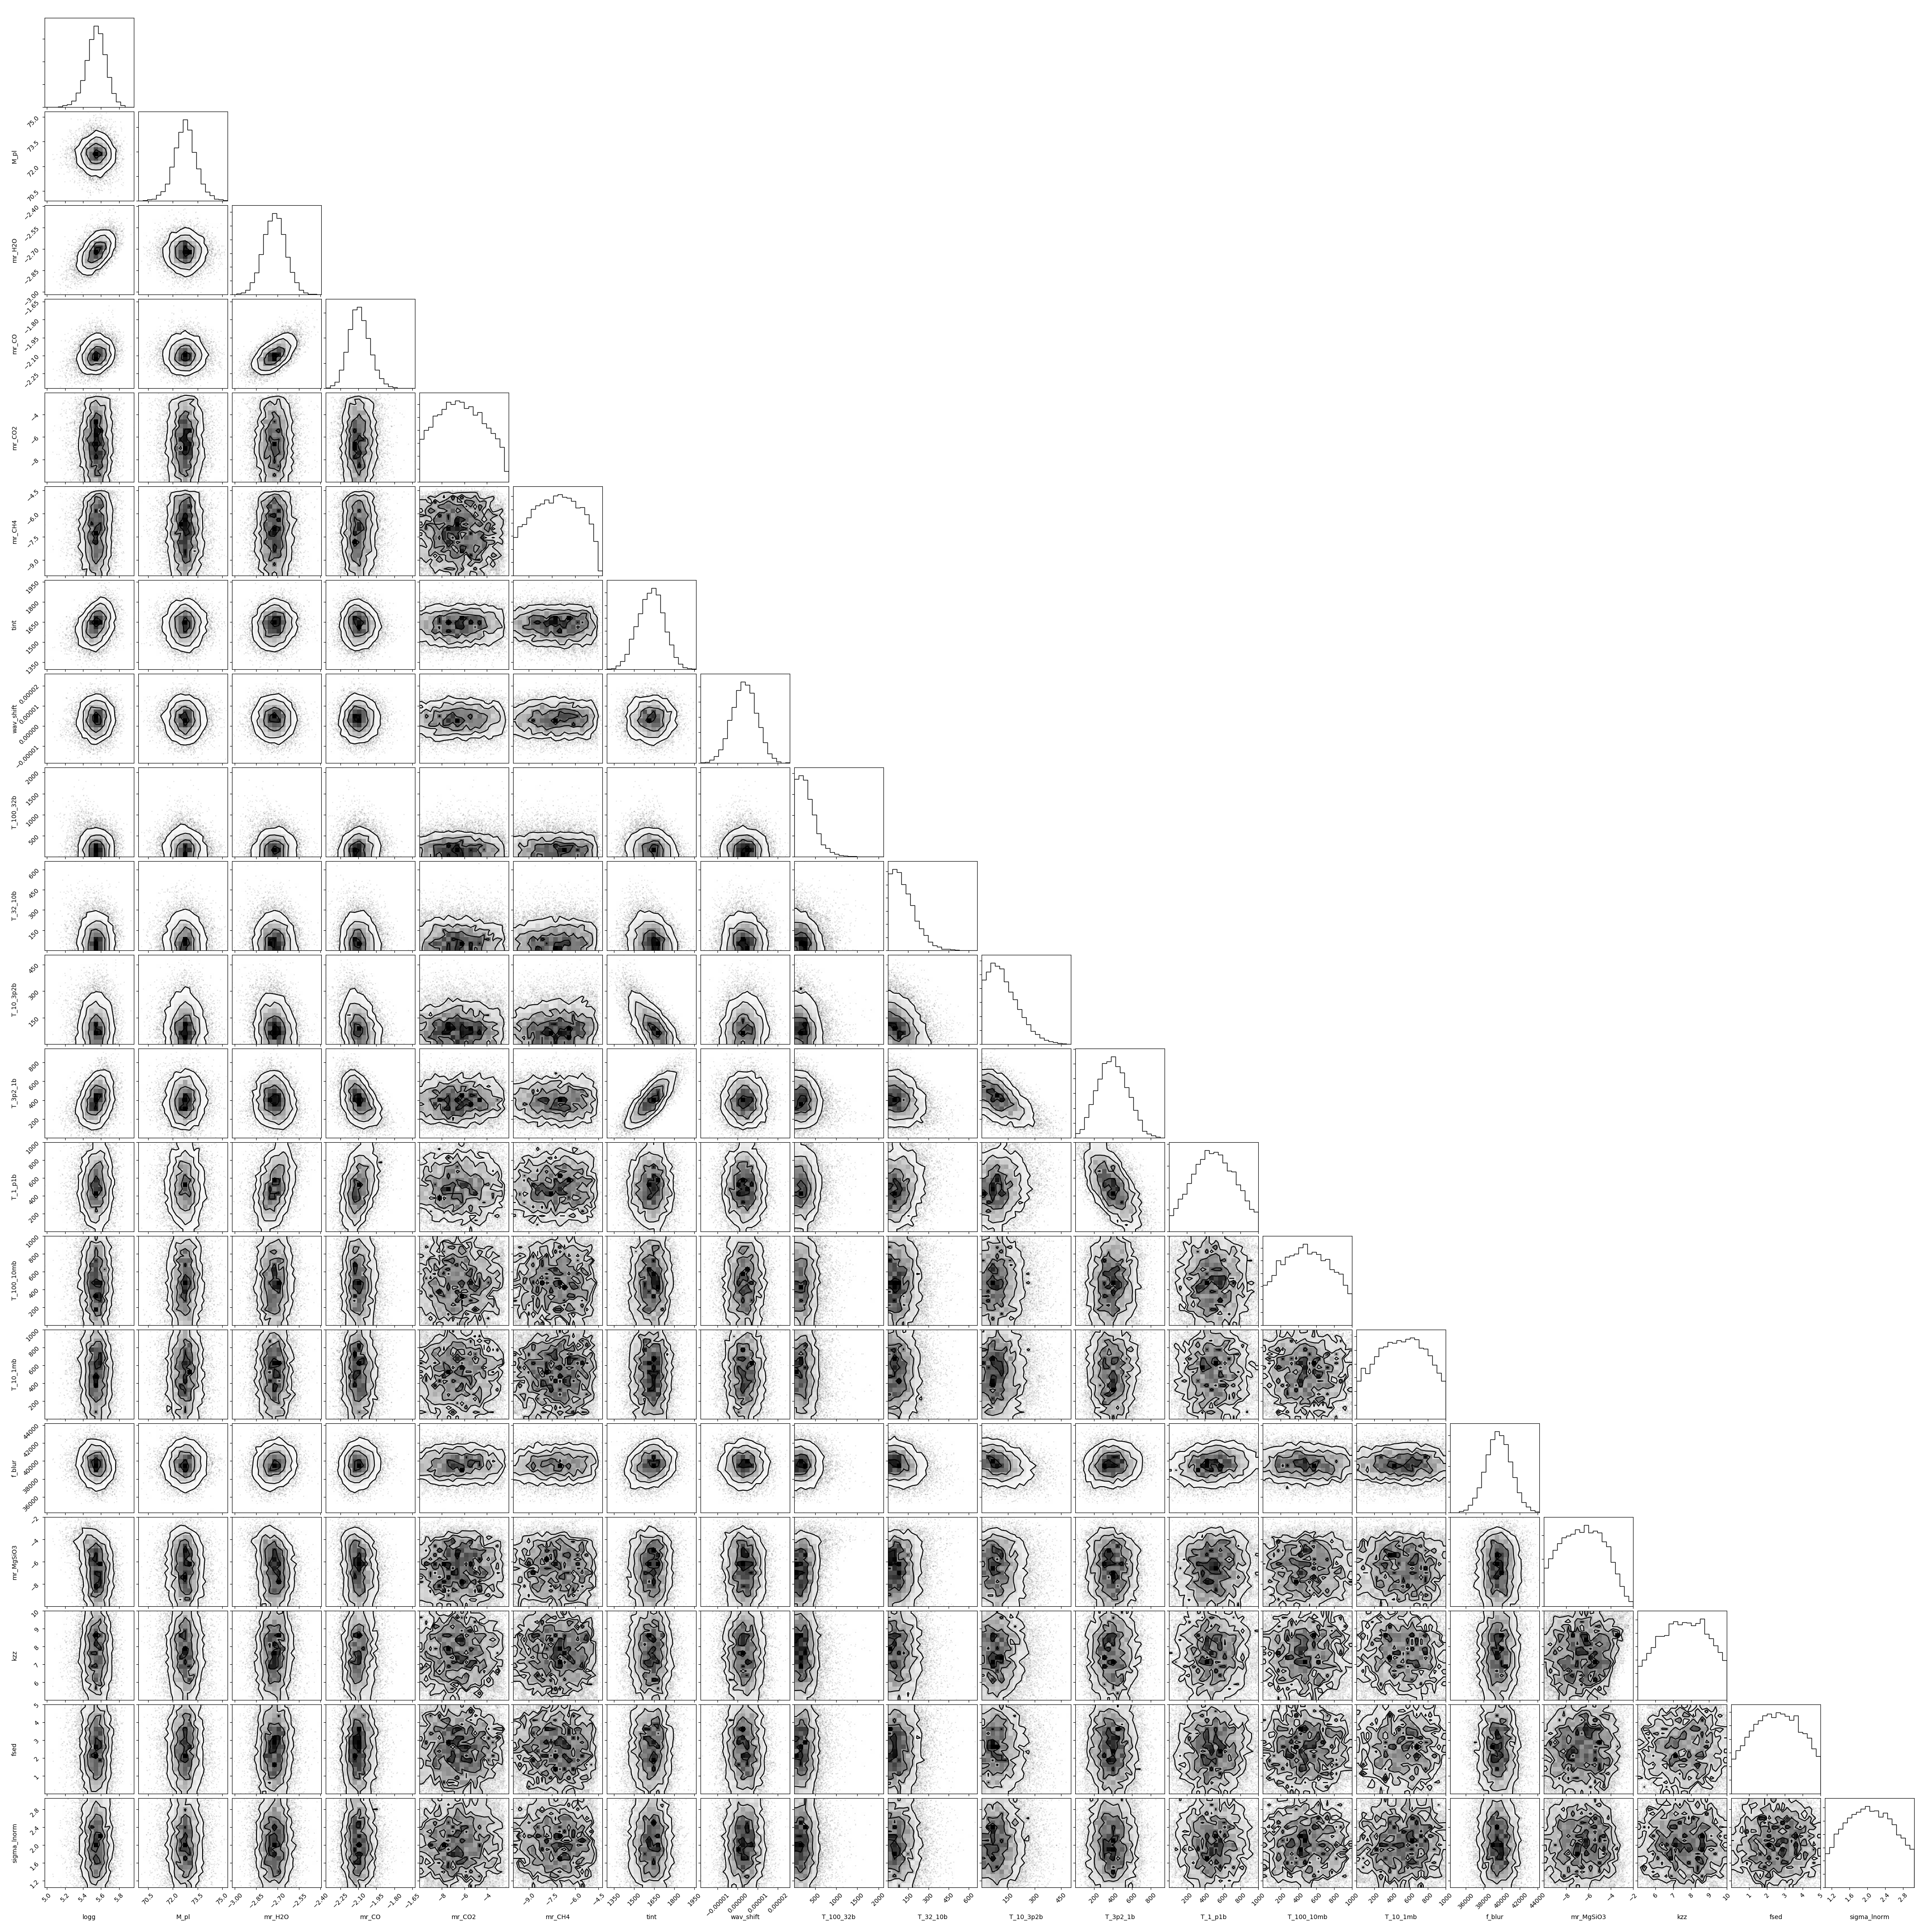
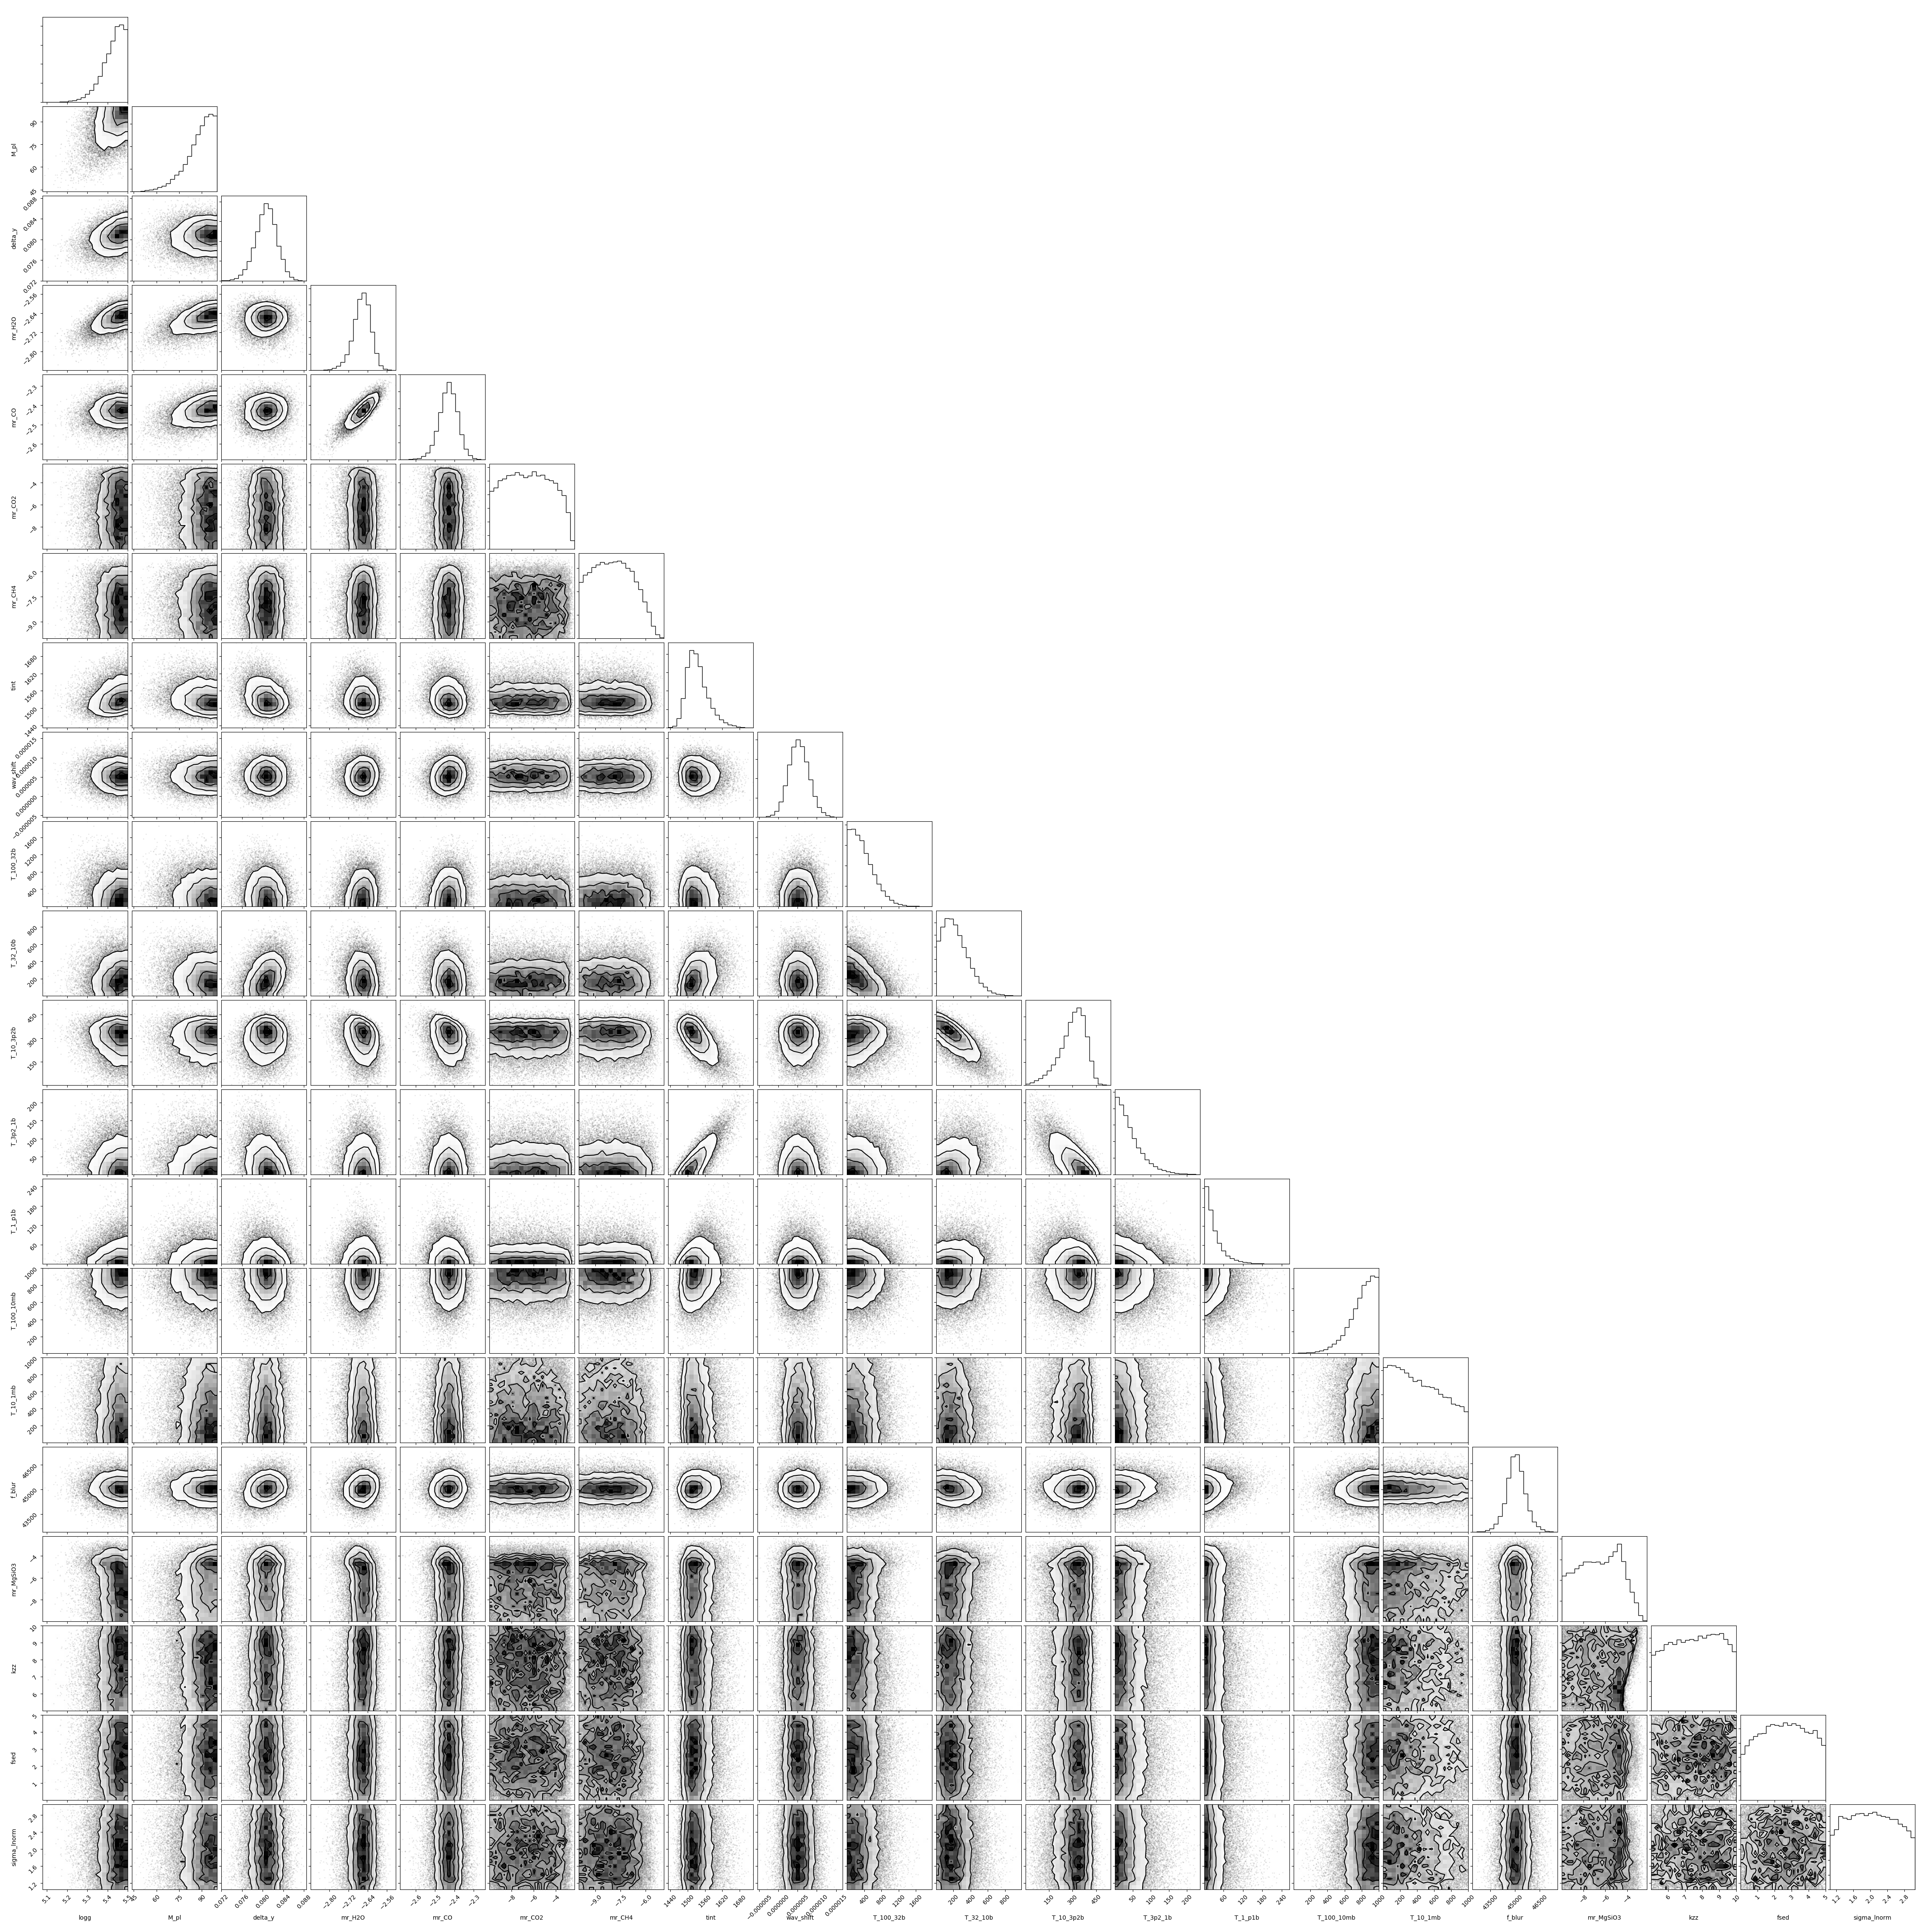
If the mass is tightly constrained, i.e., a benchmark BD as HR 7672 B with mass measured from the radial velocity technique and the astrometric data, we can apply a Gaussian mass prior. In the fixed-mass case for our PHOENIX retrieval, we apply a Gaussian prior of 72.70.8 MJupiter for mass and 5.50.2 for surface gravity. Our retrieval code can successfully reproduce the high-resolution spectral data and the photometric data (Fig. 3). A corner plot of the posterior distribution of all parameters is shown in Fig. 14 and the 16th, 50th, and 84th percentiles of the posterior distributions are given in Table 5.
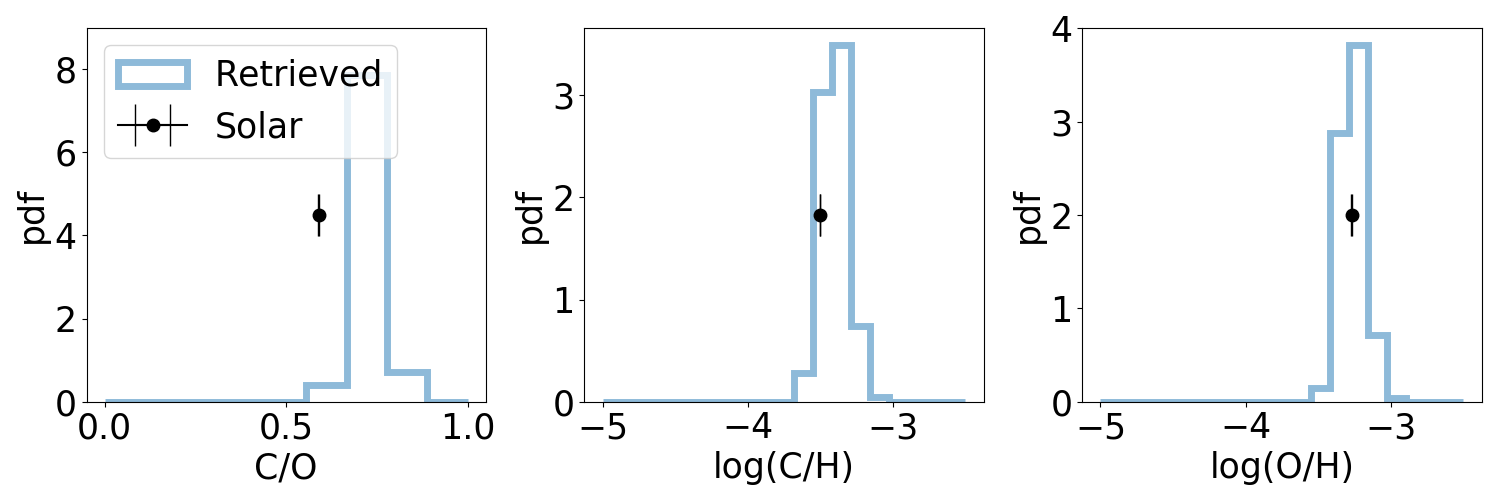
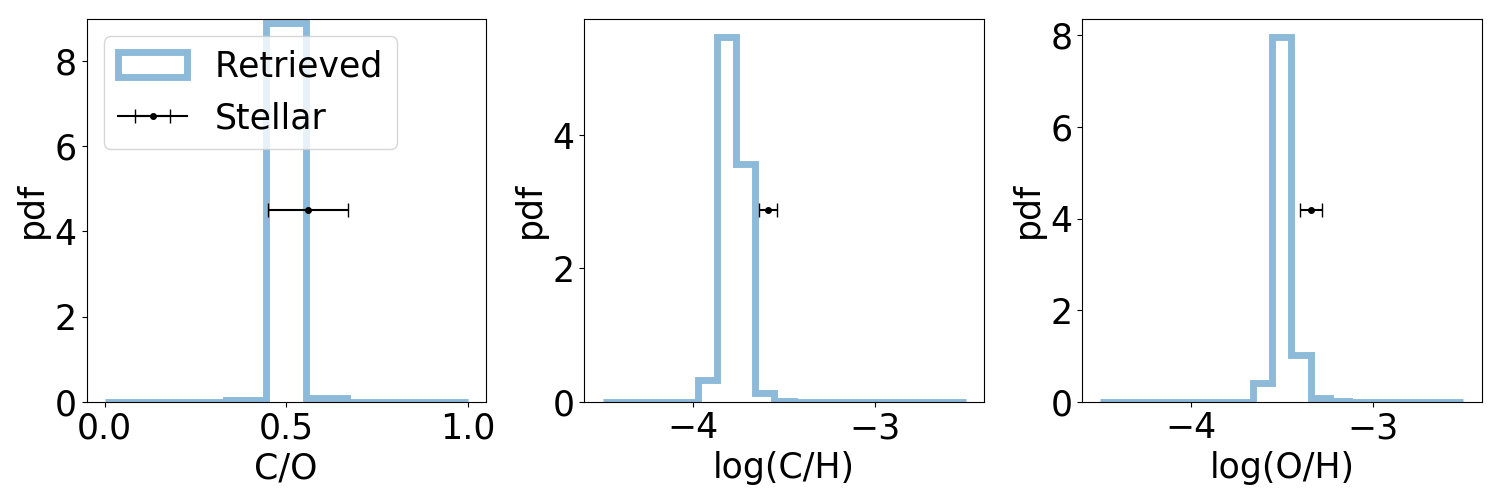
Most importantly, the retrieved C and O abundance distributions encompass the solar values, which are used in the synthetic spectrum (Fig. 5). However, the retrieved C/O is overestimated by 0.13 at 0.720.03 when compared to the solar value of 0.59. The disagreement is at 4-, implying potential systematics at the 0.15 level when retrieving C/O. We therefore adopt an uncertainty of 0.15 when reporting C/O values. The adopted uncertainty is also comparable with the C/O uncertainty of the solar C/O at 0.13 (Table 3).
5.2.2 Free-Mass Case
We now consider a case with looser priors on mass and surface gravity. Instead of Gaussian priors, we apply a flat prior for mass and surface gravity, i.e., mass between 10 and 100 MJupiter and (g) between 3.5 and 5.5. The upper limit of 5.5 corresponds to the maximum surface gravity for a BD with a contraction time of the age of the universe. We recommend this free-mass prior be applied to most directly-imaged planets and BDs for which we do not have a tight mass and surface gravity constraint. In comparison, the informed Gaussian prior in the previous section is recommended for the tests on synthetic spectra and benchmark BDs for which surface gravity is well-constrained.
 |
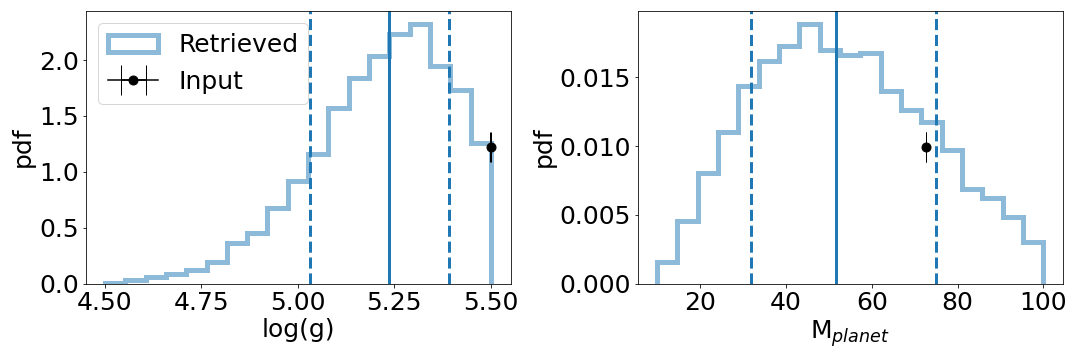 |
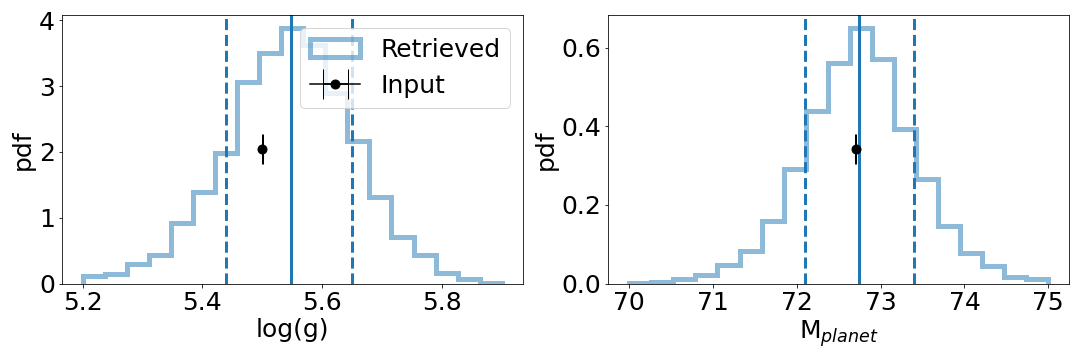
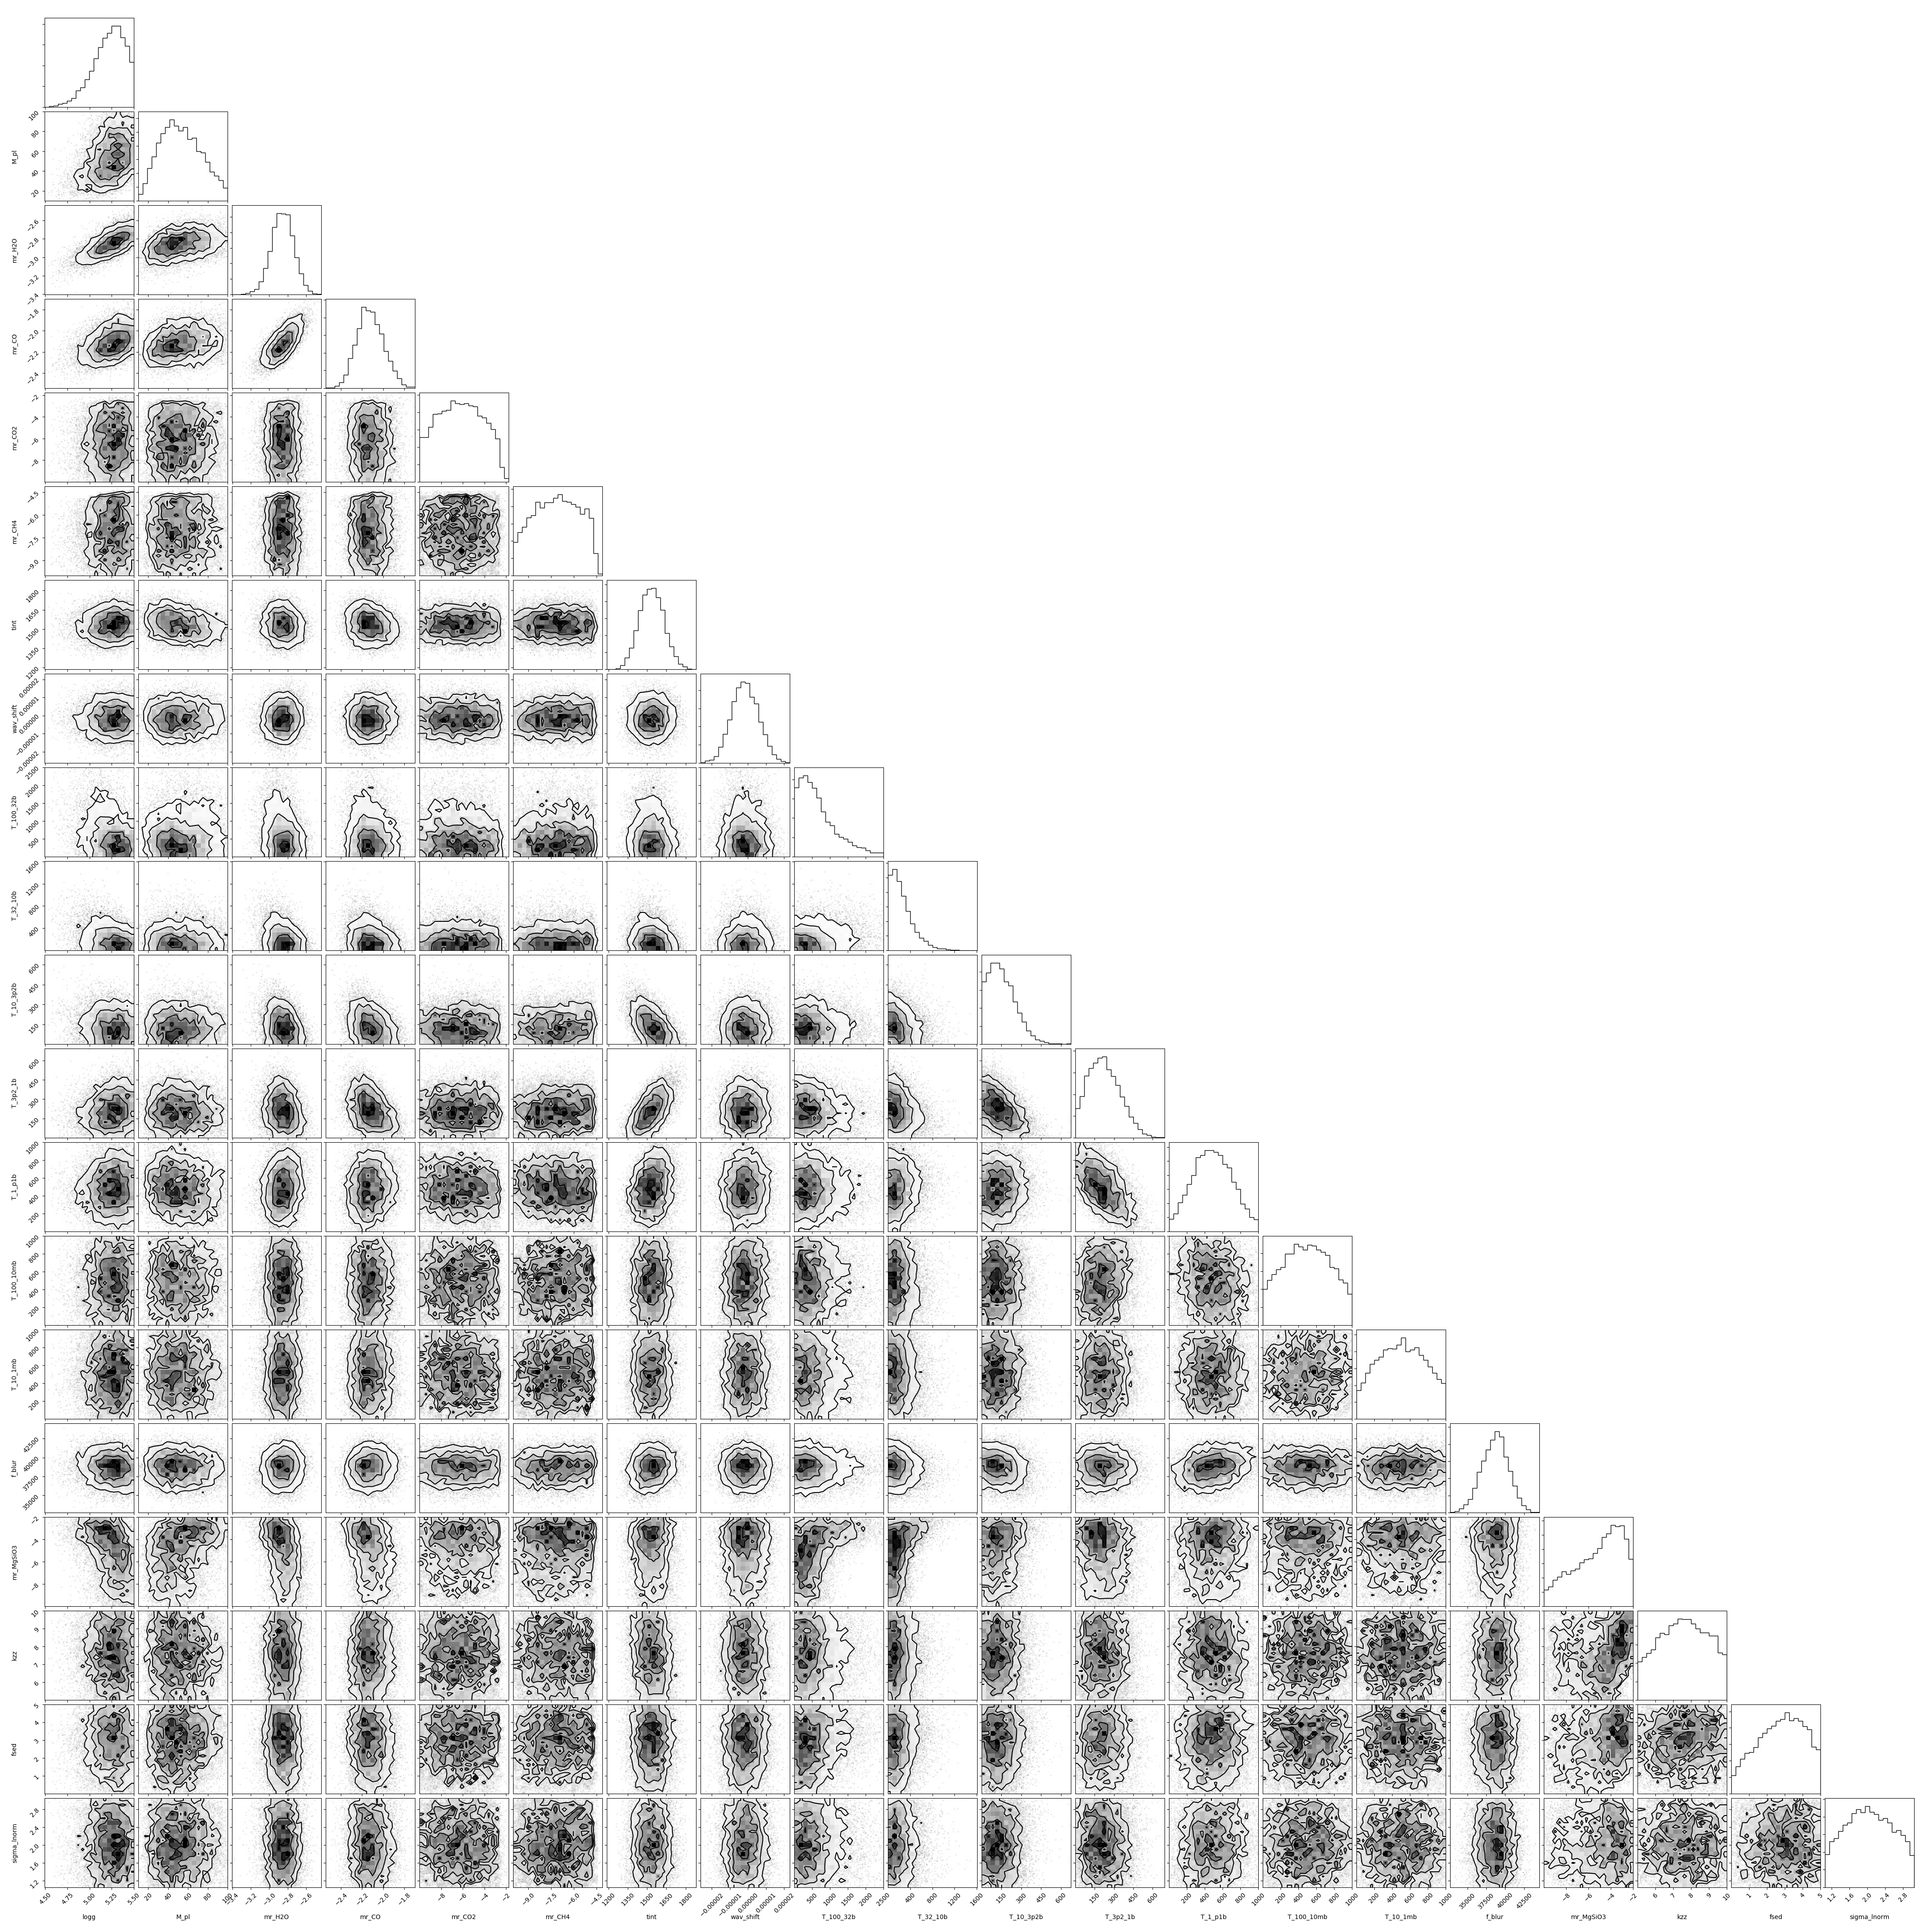
While we can successfully reproduce the high-resolution spectral data and the photometric data (Fig. 4), the retrieved (g) and mass are lower than input values by 1-2 as shown in Table 5 and Fig. 6. A complete corner plot is shown in Fig. 15. This may indicate that the high-resolution spectroscopic data and the photometric data points alone do not put a tight constraint on mass and surface gravity.
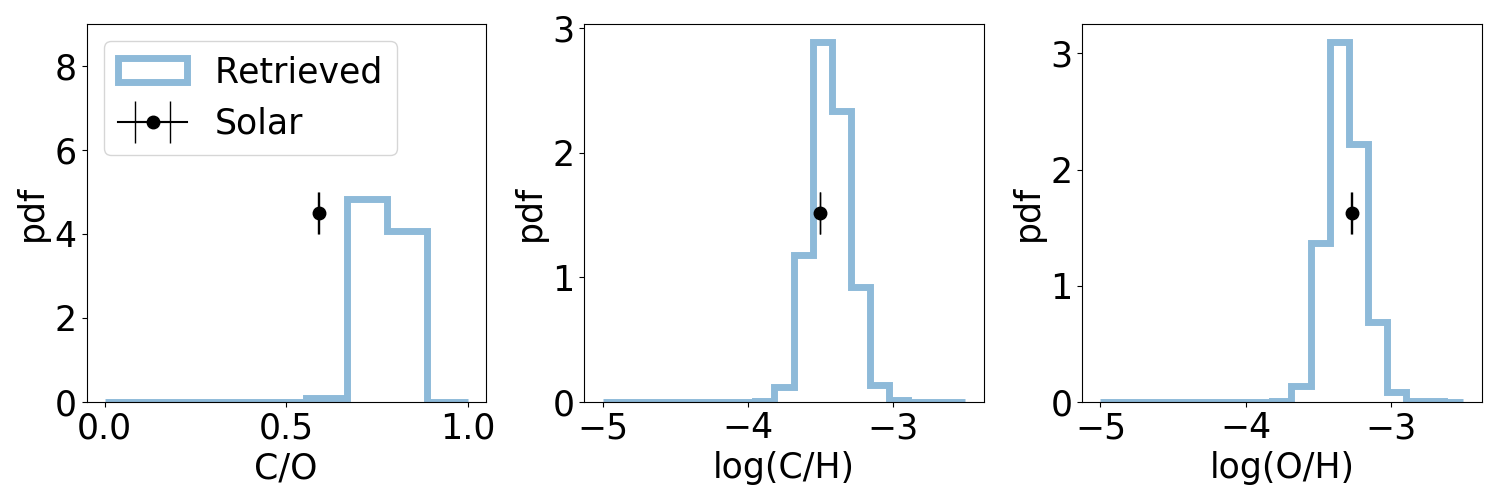
The retrieved C and O abundances agree well with the solar values as shown in Fig. 5. The retrieved C/O is overestimated by 0.18 at 0.770.04 when compared to the solar value of 0.59. This is again a 4- discrepancy given the formal error bar from the retrieval analysis. If using the 0.15 adopted C/O uncertainty as discussed in the previous section, this is a 1.2- discrepancy.
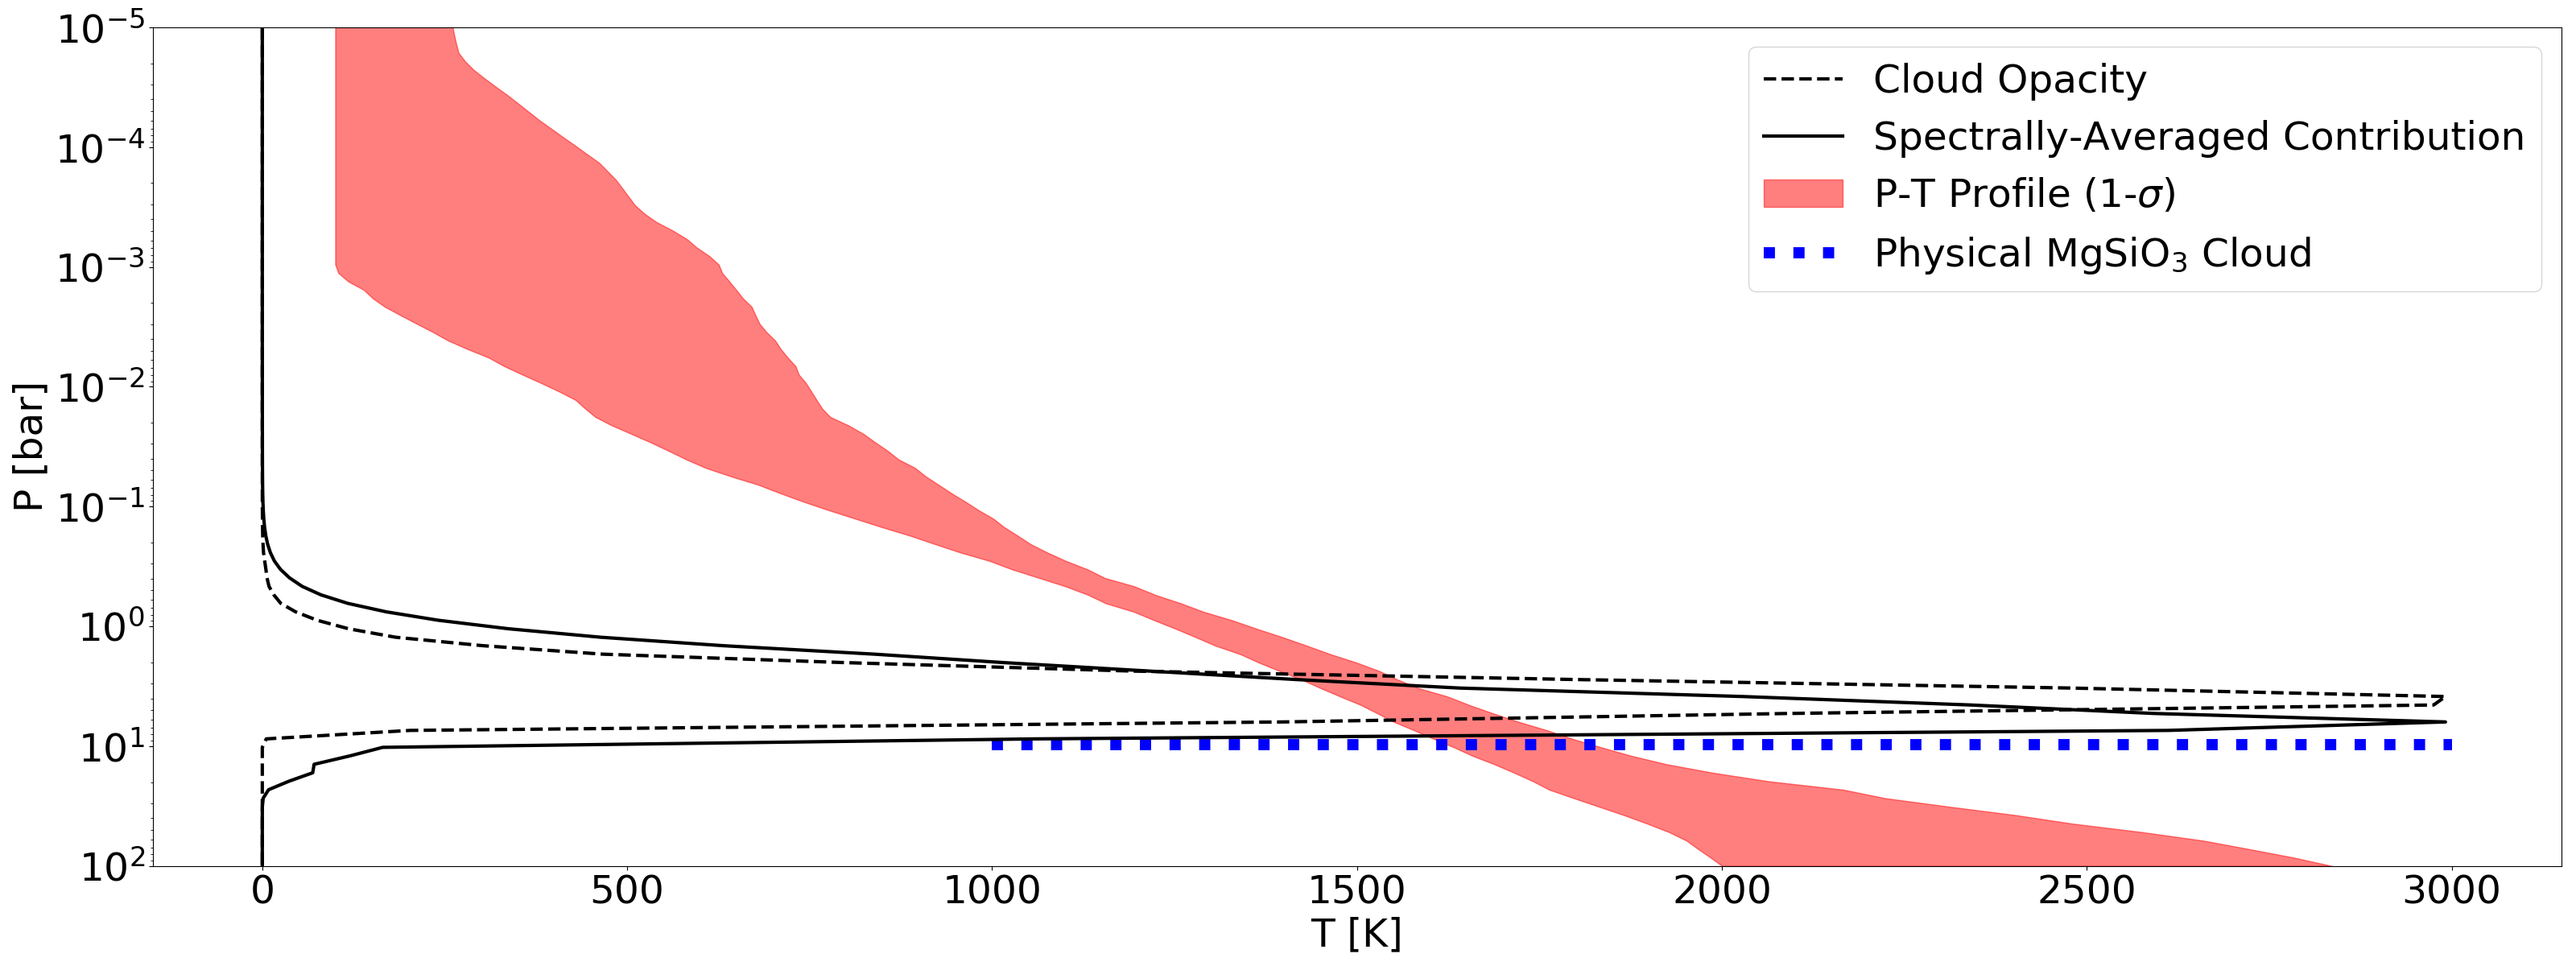
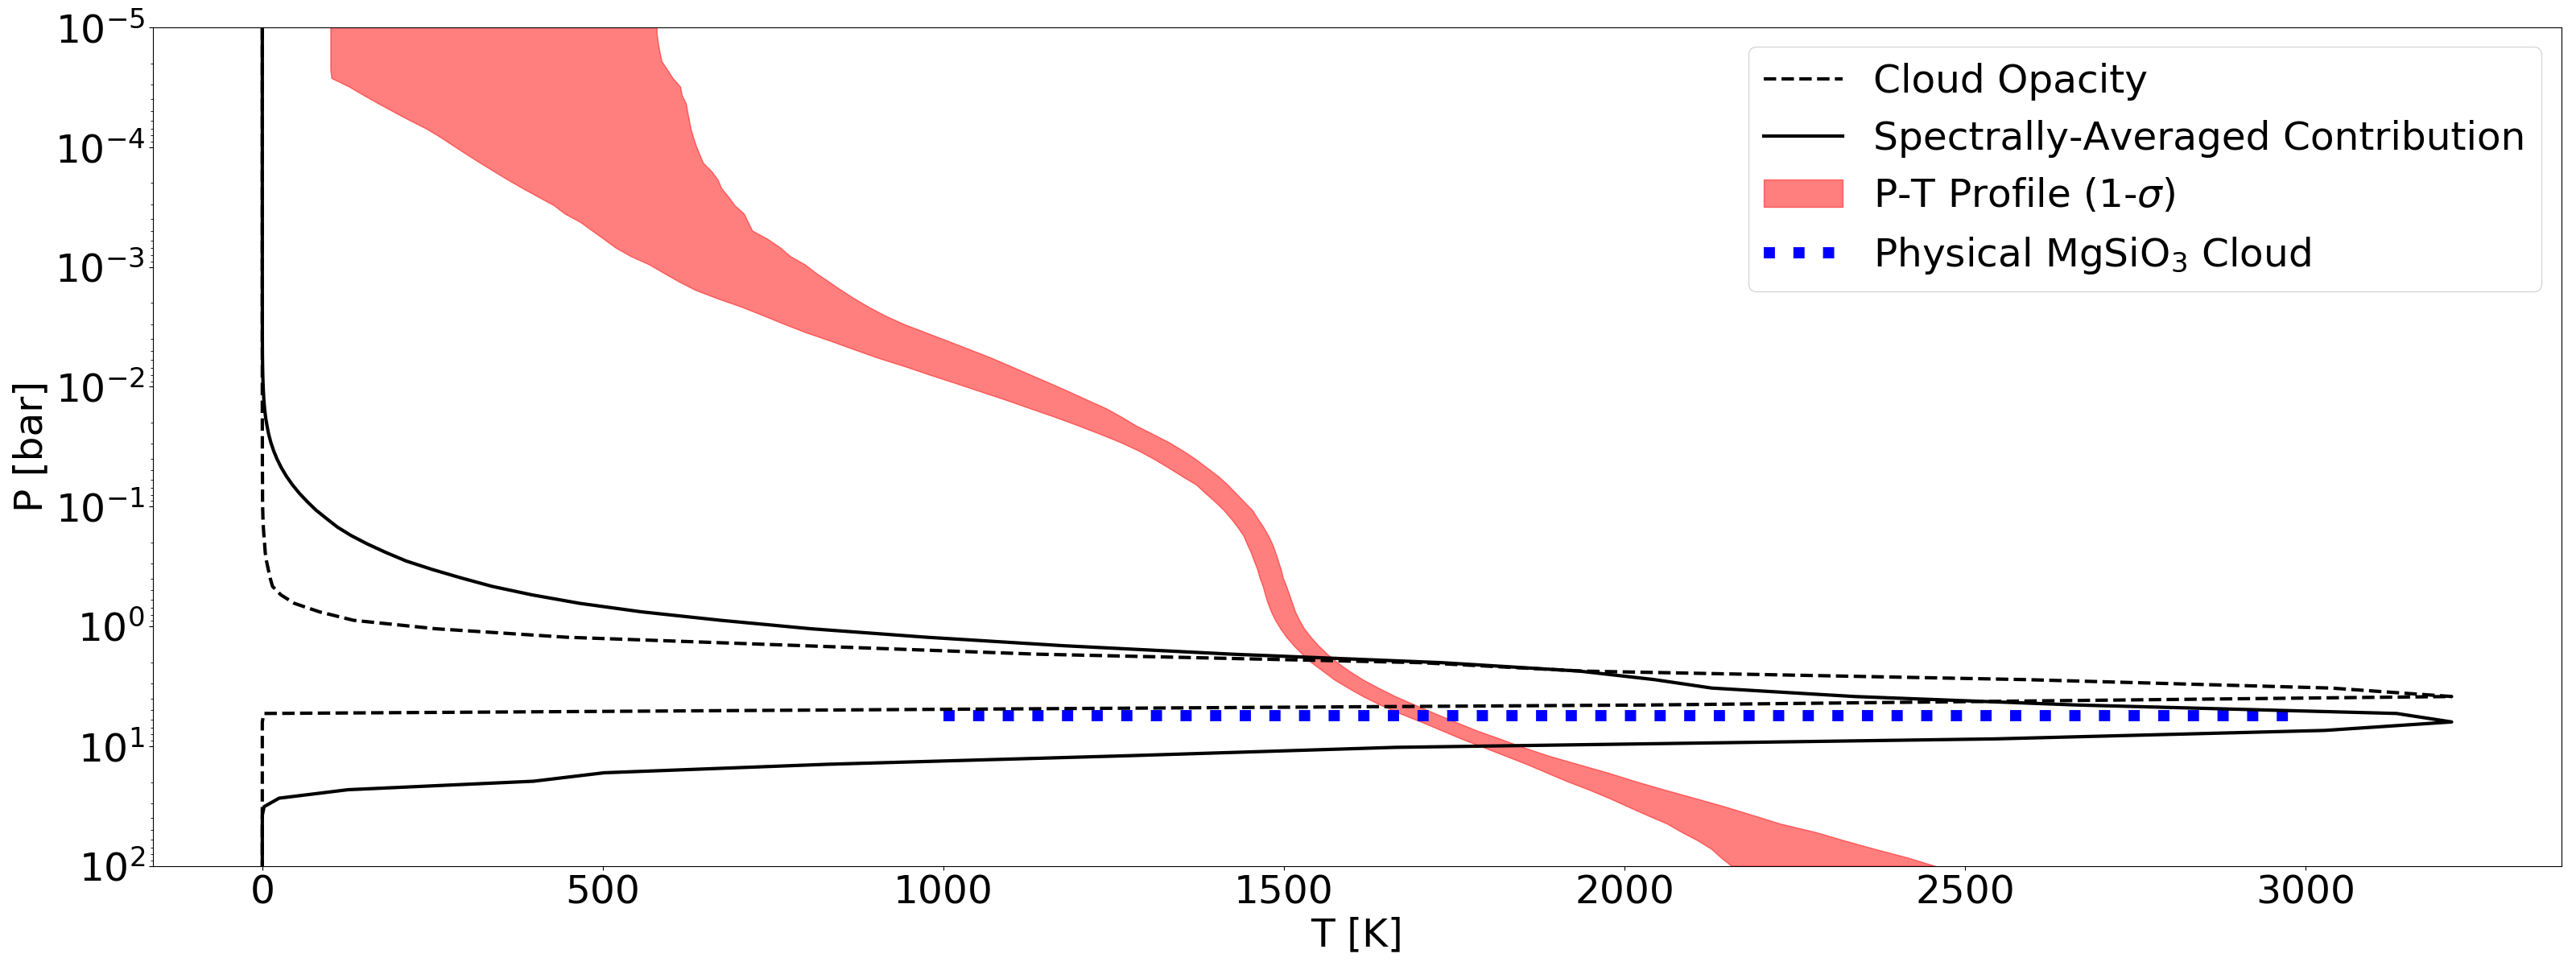
Fig. 7 shows a number of pressure-dependent properties. First, the 1- uncertainty region of the retrieved P-T profile is marked in red. When intercepting the condensation temperature of MgSiO3 (1700 K, Marley et al., 2013), the blue dotted line indicates the pressure level where MgSiO3 clouds form. This is consistent (by design, see §4.2.3) with the retrieved properties of the MgSiO3 cloud whose opacity distribution is shown as the black dashed line.
The contribution function (black solid line in Fig. 7) coincides with the cloud opacity, indicating a cloudy condition. However, a closer look at the cloud opacity reveals that the cloud contributes negligible optical depth. The retrieved cloud opacity is 10-6 g/cm2. At a pressure of 3 bar and a temperature of 1500 K, where the cloud opacity peaks, the density is 5.5 g/cm3 assuming an ideal gas law with a mean molecular weight of 2.3. Based on , where is optical depth, is opacity, and is the atmosphere thickness, the optical depth is 0.005 even if we assume a thickness of 1000 km.
In comparison, the cloudy condition is predicted by the BT-settl model (e.g., Fig. 4 in Allard et al., 2012) at an effective temperature of 1600 K. The discrepancy can be reconciled by the higher surface gravity (by 0.5 dex) that we consider here. At a higher surface gravity, the cloud deck sinks and therefore reveals a cloudless condition.
5.3 Potential Reasons for Overestimating C/O
There may be a few caveats that lead to biases in estimating C/O. First, spectral normalization can affect C and O detection and retrieved abundances (Rasmussen et al., 2021). In particular, in the presence of noise, the CO bandhead strength is likely to be underestimated as a result of spectral normalization. However, a reduced CO bandhead strength will lead to a lower C abundance, and therefore a lower C/O, which is the opposite to our result.
Second, P-T profile can affect C/O measurements. As shown in Wang et al. (2020), a difference in parameterizing P-T profile leads to significantly different C/O measurements. This motivates the more flexible P-T profile used in this work, so we conclude that P-T profile is less likely to cause the C/O overestimation.
Third, line saturation can bias C and O measurements. In -band spectroscopy, CO lines tend to be deeper and H2O tend to be weaker (Fig. 1). Deep vs. saturated CO lines are less distinguishable in high-resolution retrieval after continuum normalization. This can lead to an overestimation of C abundance, which is consistent with our findings of the retrieval on the synthetic spectrum. A similar result is also found in Finnerty et al. (2021) where overestimation of C/O is reported in retrievals for spectra with C/O lower than 0.5, although the bias in measuring C/O is smaller than 0.1.
Lastly, weak H2O lines tend to be interpreted as noise in the spectrum. This leads to an underestimation of O abundance and therefore a bias for a higher C/O, which is another plausible explanation for the higher C/O than solar value that is retrieved for the synthetic spectrum.
In conclusion, the above exercise with a PHOENIX synthetic spectrum (1) tests the limits (e.g., retrieving mass and surface gravity) and estimates a more practical error bar (e.g., measuring C/O) and (2) validates our framework so that we can use it to retrieve C and O abundances based on the actual HR 7672 B data set.
 |
 |
6 Retrieving Properties for HR 7672 B
6.1 Data vs. Modeled Spectra
We use our retrieval framework to infer atmospheric C and O abundance for HR 7672 B using a data set that combines high-resolution data from KPIC and photometric data as detailed in §2. The retrieval setup as the same as our tests using the PHOENIX synthetic spectrum, except for one additional free parameter that accounts for the normalized flux offset between the high-resolution data and the modeled spectrum. This free parameter is introduced because of the uncertainty of normalizing the observed spectrum in the presence of noises.
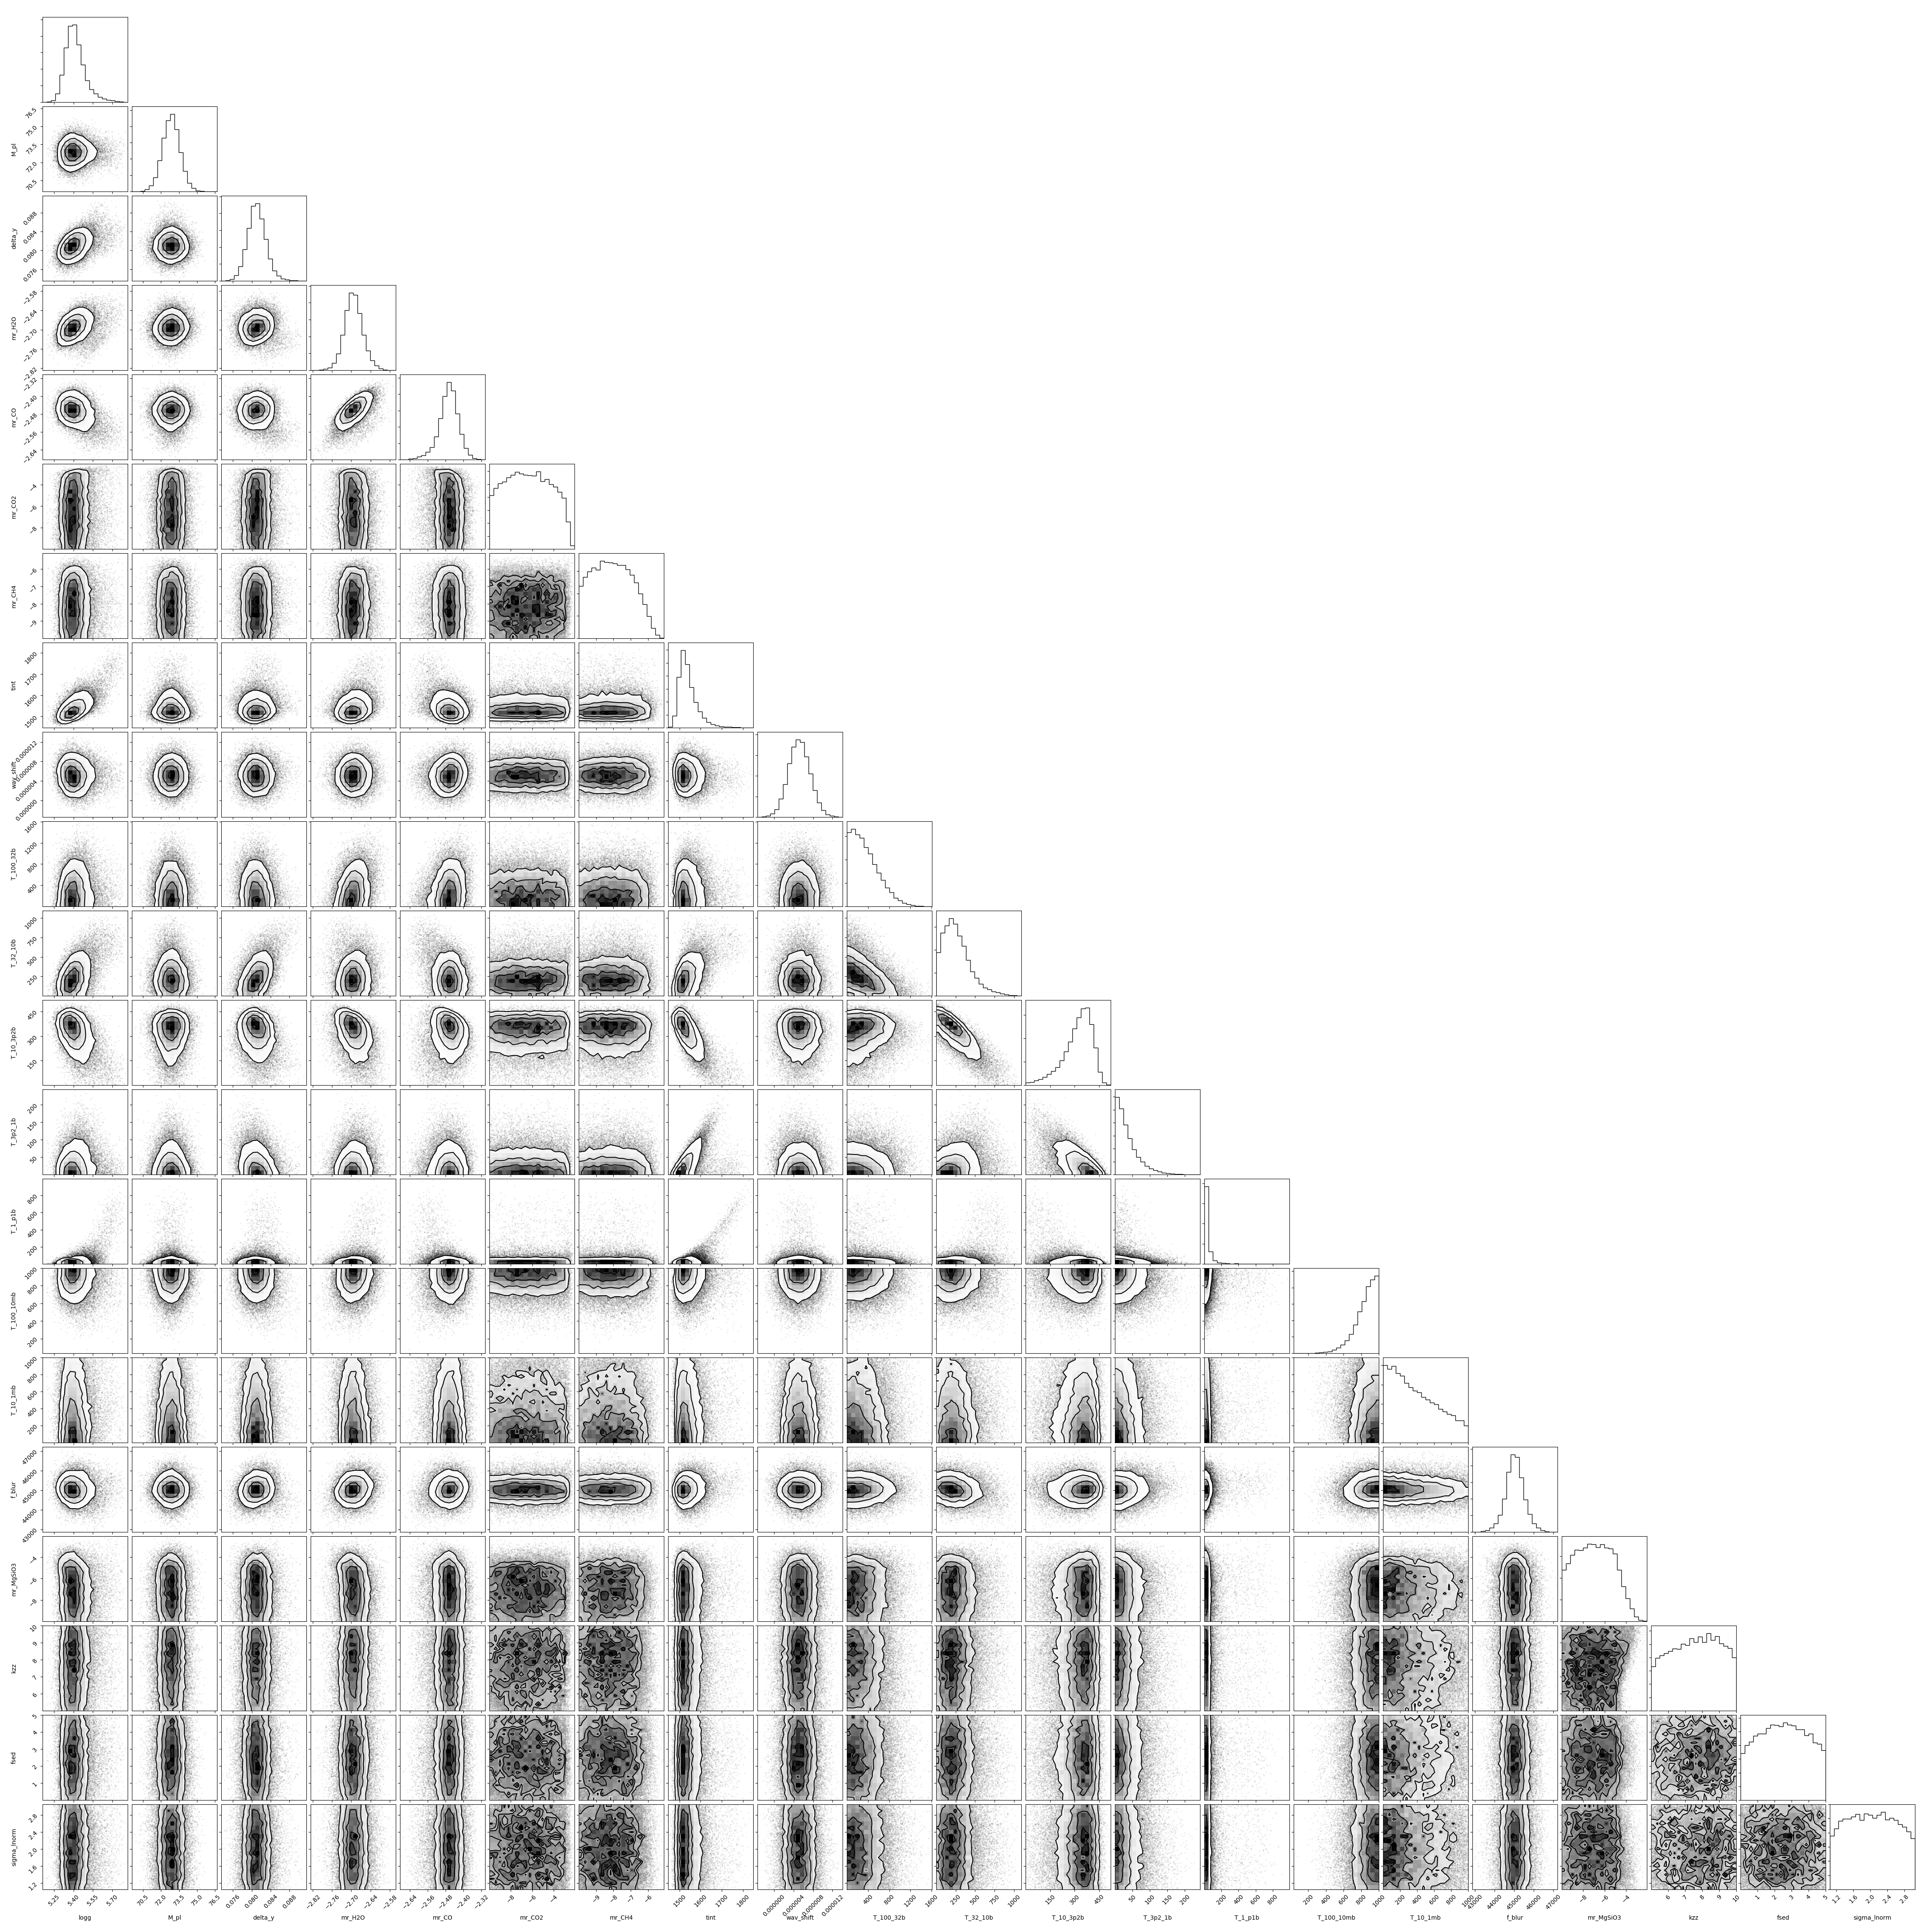
Similar to §5, we consider two cases: the fixed-mass case and the free-mass case. The fixed-mass case is for retrieving objects with tight mass constraints. The free-mass case is for the majority of directly-imaged planets and BDs without tight mass constraints. Fig. 8 and Fig. 9 show the comparison between data and models using posterior samples (Fig. 16 and Fig. 17). In both cases, spectral models from posterior samples agree well with the observed spectrum and photometric data points except for the - and -band photometry, which shows 2-3 discrepancy. The discrepancy can be attributed to a degeneracy in retrieving clouds and is discussed in §6.4 and §6.5.
Despite the 2-3 discrepancy for the - and -band photometry, the retrieved luminosity for HR 7672 B () agrees with literature values within 1-, e.g., (Brandt et al., 2019) and (Liu et al., 2002). The retrieved effective temperature ( K) also falls in the previously estimated range between 1510 and 1850 K (Liu et al., 2002).
We also note that HR 7672 B is a very fast rotator with a v of kms-1, potentially making it an excellent object for Doppler imaging. Our v is 1.8- off the measurement by Delorme et al. (2021) at kms-1.
6.2 Fixed Mass vs. Free Mass
The mass of HR 7672 B is well-constrained because of available radial velocity data and astrometric data (Crepp et al., 2012; Brandt et al., 2019). This corresponds to the fixed-mass case. However, we would like to investigate a case in which tight constraints are not available. This corresponds to the free-mass case, in which we set a flat prior for mass and surface gravity (see Table 4).
 |
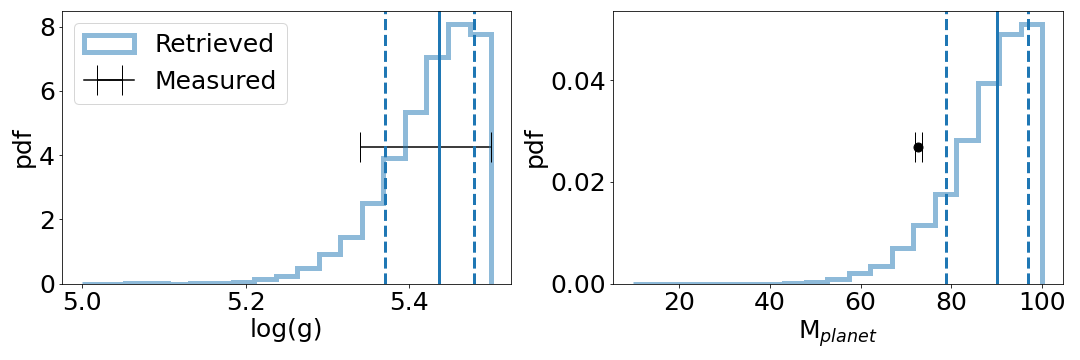 |
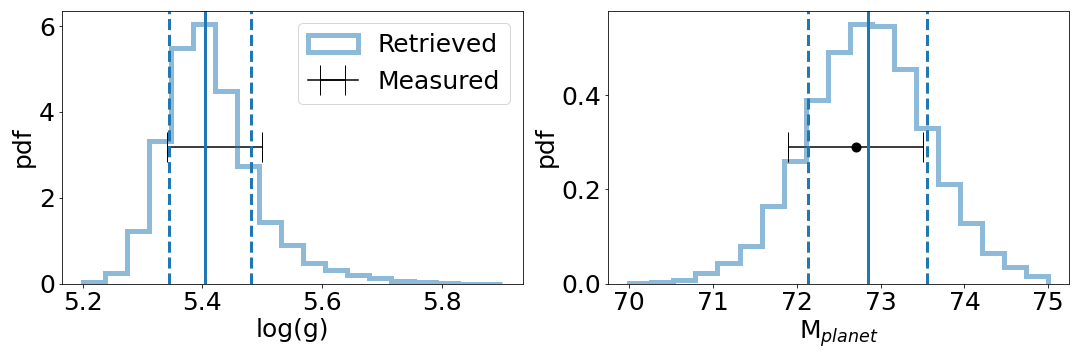
For the fixed-mass case, the retrieved surface gravity and mass posteriors agree well with measured values (Fig. 10 Top and Table 5). The mass constraints are from radial velocity and astrometric data (Brandt et al., 2019). The surface gravity constraints are from the age measurement of 2-4 Gyr (Brandt et al., 2019) and BD evolutionary models (Saumon & Marley, 2008). Assuming the HR 7672 system has an age of between 2 and 4 Gyr (Brandt et al., 2019), the (g) of HR 7672 B should be between 5.33 and 5.35 based on Saumon & Marley (2008) and surely lower than 5.50. For the free-mass case (Fig. 10 Bottom), while the retrieved surface gravity agrees with the (Saumon & Marley, 2008) measured value, the mass posteriors differ by 1-2 . The 1-2 difference is consistent with our findings using the PHOENIX synthetic spectrum.
The comparison between the fixed-mass case and the free-mass case shows that our retrieval framework can retrieve mass and surface gravity within 1-2 for BDs like HR 7672 B. Further tests are needed for directly-imaged exoplanets with lower surface gravity.
6.3 C/O
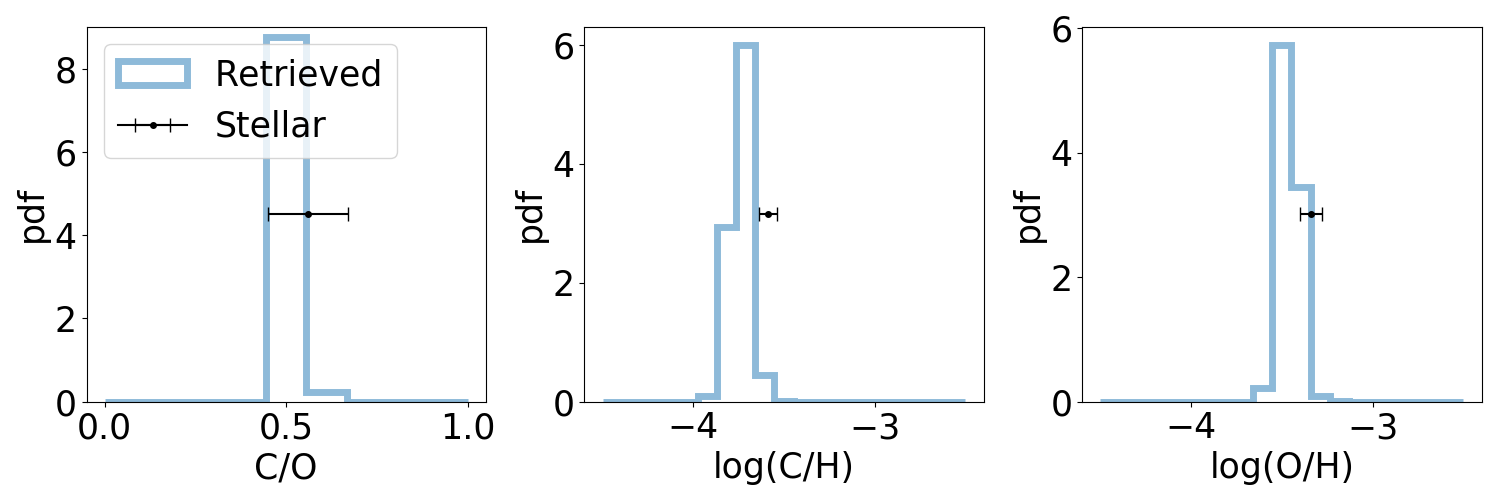
Moreover, the retrieved C and O abundances and C/O for HR 7672 B agree within 1-2 to those of HR 7672 A (Fig. 11). The consistency is seen for both the fixed-mass case and the free-mass case. Using the free-mass case as an example, the retrieved [C/H], [O/H], and C/O are below stellar values by 1.5-, 1.2-, and 0.3-, respectively. From previous work on benchmark BDs, 2- difference is considered in good agreement (Line et al., 2015).
We also note that the retrieved uncertainties for [C/H], [O/H], and C/O are likely underestimated. This is not uncommon in recent papers that perform retrieval analyses on directly-image exoplanets and brown dwarfs. For example, reported C/O uncertainty is 0.06-0.07 in Mollière et al. (2020) and Burningham et al. (2021), much lower than the solar C/O uncertainty at 0.13 (Palme et al., 2014). Additional unaccounted for systematic errors can exceed the formal uncertainties. This is evidenced by the C/O discrepancy as seen in §5.2.2 for the PHOENIX retrieval and possible explanations are discussed in §5.3. Small wavelength coverage in high spectral resolution data may also contribute to the additional unknown systematics, which can be mitigated by increased spectral grasp.
In addition, there is a subtle difference between atmospheric abundance and intrinsic abundance as pointed out by Line et al. (2015). The atmospheric abundance is retrieved based on the BD spectrum and the intrinsic abundance is measured based on the primary star. The latter is intrinsic because of efficient mixing in the photosphere of the primary star. The atmospheric abundance from a BD can be affected by condensation, which will decrease oxygen abundance because a condensed particle is likely to contain oxygen, e.g., MgSiO3. However, our retrieved MgSiO3 abundance is at lower than 10-4 level. Therefore, the oxygen locked in MgSiO3 will not significantly affect the retrieved O/H and C/O when comparing the MgSiO3 abundance to the major O carrier H2O and CO for which the abundance is at 10-3-10-2 level.
 |
 |
6.4 Cloud Property and Degeneracy
Fig. 12 shows the retrieved P-T profile as well as the contribution function. Similarly to the PHOENIX retrieval case, we infer a cloudless condition even though the cloud opacity peaks roughly near the peak of the contribution function. This is because the optical depth due to the cloud is negligible given the low opacity value that is smaller than g/cm2. Moreover, cloud properties are mostly unconstrained as shown in Fig. 16 and Fig. 17.
The inferred cloudless condition may be due to a degeneracy as discussed in Tremblin et al. (2017): the existence of clouds can be masqueraded by a decrease of thermal gradient of the P-T profile. Both clouds and a nearly isothermal P-T profile can lead to shallower absorption lines. The isothermal knee around 1 bar in our retrieved P-T profile is the evidence of this degeneracy. Similar effects are also discussed in Mollière et al. (2020). Therefore, we do not know if the inferred cloudless condition is real or due to an artificially isothermal P-T profile.
One solution to break the degeneracy is to use a self-consistent P-T profile as done in Mollière et al. (2020). However, a self-consistent P-T profile may not necessarily be the actual P-T profile in the BD atmosphere. Therefore, future JWST data will play a key role in resolving this degeneracy (Tremblin et al., 2017).
6.5 The Fainter Retrieved - and -band Photometry Than Observation
The degeneracy under discussion here may also explain the 2-3 discrepancy of - and -band photometry that is seen in the retrieval for HR 7672 B (see Fig. 8 and Fig. 9). While the MultiNest sampling algorithm preferentially finds the cloudless solution for the reason that is detailed in the next paragraph, an alternative cloudy solution can tilt the spectral energy distribution of the , , , and bands, namely, making and -band dimmer while leaving and -band relatively unchanged. This is because clouds affect shorter wavelengths more than longer wavelengths. In this way, all four modeled photmetric data points are consistently below the actual measurement points. Thus, to account for the overall fainter modeled photometry than the observation, the retrieved radius is inflated in the retrieval and therefore results in a lower surface gravity.
The reason why the retrieval favors the cloudless solution is that the weight for photometric data points is small: there are only 4 photometric data points whereas there are over 7000 spectroscopic data points. It is expected that when the weight of photometric data points increases the discrepancy of photometry is reduced. Indeed, this is what happens when increasing the photmetric weight by adding redundant photometric data points that repeat themselves. However, the retrieved surface gravity becomes too low to be realistic. This delicate issue will be discussed in more detail in a forthcoming paper.
6.6 Chemical Equilibrium?
We investigate the agreement between our retrieved abundances and those expected from chemical equilibrium. The comparison helps to check if reasonable abundances are retrieved.
We use poor_mans_nonequ_chem to interpolate a pre-calculated chemical grid from easyCHEM (Mollière et al., 2017). The grid spans multiple dimensions including temperature (60 - 4000 K), pressure (10-8 - 1000 bar), C/O (0.1 - 1.6) and [Fe/H] (-2 - 3). To calculate the equilibrium abundance, we use the median of the retrieved P-T profile and stellar values of C/O = 0.56 and [Fe/H] = -0.04. While the uncertainties of the P-T profile, C/O, and [Fe/H] all contribute to the uncertainty of the equilibrium abundance, we show below that the adopted values for the chemical grid result in reasonable agreement with the retrieved abundance.
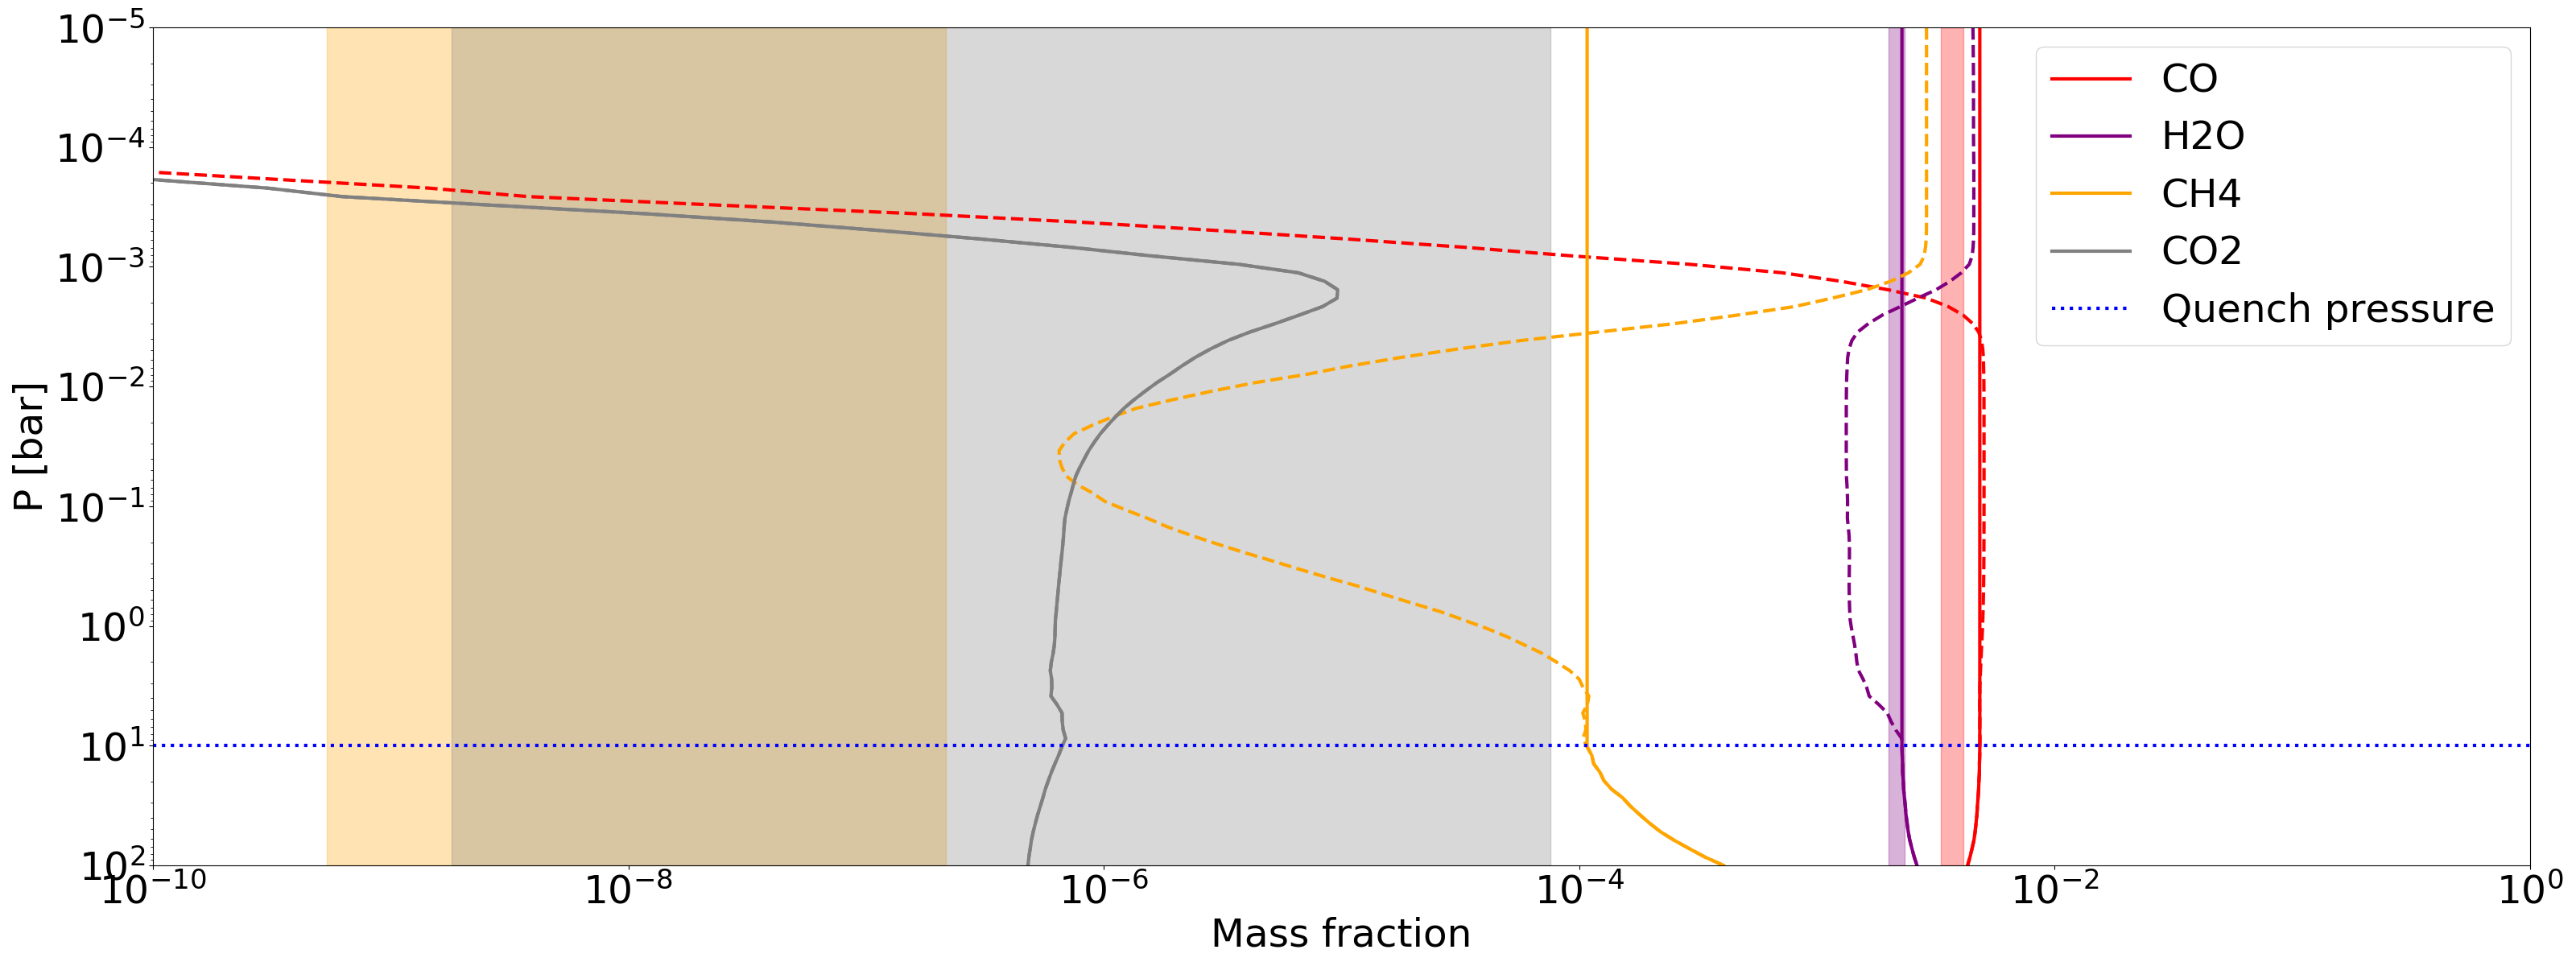
Fig. 13 shows the abundances (in mass mixing ratio) for four species (CO, H2O, CH4, and CO2) assuming two conditions: chemical equilibrium, and a quenched case of chemical disequilibrium, where vertical mixing homogenizes abundances above a quench pressure which we set at 10 bar.
For the two constrained species (CO and H2O), the H2O abundance agrees well with the quenched condition, but the retrieved CO abundance is below the value as interpolated from the chemical grid (by 1-). The difference can be reconciled by varying the quench pressure, the P-T profile, C/O, and [Fe/H] values that are within the posterior range. A more rigorous approach would be to sample the posterior and infer a range of possible values form the chemical grid.
For the two unconstrained species (CH4 and CO2), the 16% - 85% credible range for CO2 agrees well with both the chemical equilibrium and the quenched conditions. However, the retrieved CH4 abundance range is well below the value as expected from the chemical grid.
7 Summary
This paper aims towards the goal of measuring chemical composition to better understand the origin of sub-stellar companions. First, we measure stellar abundance for HR 7672 A using archival data from the Keck Observatory Archive. The resulting stellar parameters and abundance for C and O are reported in Table 2 and Table 3, which are in 2- agreement with previous measurements.
Second, using KPIC, we obtain high-resolution (R=35,000) data for HR 7672 B, a benchmark BD around HR 7672 A. We measure -band photometry for HR 7672 B using Keck NIRC2 archival data. Along with previous , , and -band photometric data points, the spectrum and photometric data points are used to validate a retrieval framework, which is an extension of petitRADTRANS. We show that the framework can retrieve correctly the C and O abundances that are used in a synthetic PHOENIX BT-Settle spectrum (§5). However, the retrieved C/O is overestimated by 0.13-0.18 (4-) using the formal uncertainty from the retrieval. We therefore recommend a 0.15 uncertainty for the retrieved C/O. We also show that our retrieval framework can retrieve C and O abundances and C/O from a benchmark BD HR 7672 B that are within 1.5- consistent with the primary star HR 7672 A (§6).
The work presented here provides a practical procedure of testing and performing atmospheric retrieval on data sets that span a large range of spectral resolution (e.g., from photometric data to R of 35,000) and wavelength coverage ( through -band). Our exercises on a synthetic spectrum and the HR 7672 B data set enable us to understand the limitations and uncertainties in retrieving BD properties and lend confidence in using the framework on future data sets from more BDs and exoplanets.
Acknowledgments We would like to thank Paul Molliere for the help in setting up and running petitRADTRANS. We thank Anjali Piette for helpful discussion on P-T profile. We thank the Heising-Simons Foundation for supporting the workshop on combining high-resolution spectroscopy and high-contrast imaging for exoplanet characterization, where the idea originated on combining photometric data and spectral data of different resolutions. KPIC has been supported by the Heising-Simons Foundation through grants #2015-129, #2017-318 and #2019-1312. This work was also partially supported by the Simons Foundation. The data presented herein were obtained at the W. M. Keck Observatory, which is operated as a scientific partnership among the California Institute of Technology, the University of California and the National Aeronautics and Space Administration. The Observatory was made possible by the generous financial support of the W. M. Keck Foundation. The authors wish to recognize and acknowledge the very significant cultural role and reverence that the summit of Mauna Kea has always had within the indigenous Hawaiian community. We are most fortunate to have the opportunity to conduct observations from this mountain.
Appendix A Corner Plots for Retrievals
References
- Allard et al. (2012) Allard, F., Homeier, D., & Freytag, B. 2012, Philosophical Transactions of the Royal Society of London Series A, 370, 2765, doi: 10.1098/rsta.2011.0269
- Allard et al. (2013) Allard, F., Homeier, D., Freytag, B., et al. 2013, Memorie della Societa Astronomica Italiana Supplementi, 24, 128. https://arxiv.org/abs/1302.6559
- Amarsi et al. (2019) Amarsi, A. M., Nissen, P. E., & Skúladóttir, Á. 2019, A&A, 630, A104, doi: 10.1051/0004-6361/201936265
- Baraffe et al. (2015) Baraffe, I., Homeier, D., Allard, F., & Chabrier, G. 2015, A&A, 577, A42, doi: 10.1051/0004-6361/201425481
- Baudino et al. (2017) Baudino, J.-L., Mollière, P., Venot, O., et al. 2017, ApJ, 850, 150, doi: 10.3847/1538-4357/aa95be
- Boccaletti et al. (2003) Boccaletti, A., Chauvin, G., Lagrange, A. M., & Marchis, F. 2003, A&A, 410, 283, doi: 10.1051/0004-6361:20031216
- Brandl et al. (2021) Brandl, B., Bettonvil, F., van Boekel, R., et al. 2021, The Messenger, 182, 22, doi: 10.18727/0722-6691/5218
- Brandt et al. (2019) Brandt, T. D., Dupuy, T. J., & Bowler, B. P. 2019, AJ, 158, 140, doi: 10.3847/1538-3881/ab04a8
- Brewer et al. (2016) Brewer, J. M., Fischer, D. A., Valenti, J. A., & Piskunov, N. 2016, ApJS, 225, 32, doi: 10.3847/0067-0049/225/2/32
- Brogi et al. (2017) Brogi, M., Line, M., Bean, J., Désert, J. M., & Schwarz, H. 2017, ApJ, 839, L2, doi: 10.3847/2041-8213/aa6933
- Buchner et al. (2014) Buchner, J., Georgakakis, A., Nandra, K., et al. 2014, A&A, 564, A125, doi: 10.1051/0004-6361/201322971
- Burningham et al. (2017) Burningham, B., Marley, M. S., Line, M. R., et al. 2017, MNRAS, 470, 1177, doi: 10.1093/mnras/stx1246
- Burningham et al. (2021) Burningham, B., Faherty, J. K., Gonzales, E. C., et al. 2021, MNRAS, 506, 1944, doi: 10.1093/mnras/stab1361
- Crepp et al. (2012) Crepp, J. R., Johnson, J. A., Fischer, D. A., et al. 2012, ApJ, 751, 97, doi: 10.1088/0004-637X/751/2/97
- da Silva et al. (2015) da Silva, R., Milone, A. d. C., & Rocha-Pinto, H. J. 2015, A&A, 580, A24, doi: 10.1051/0004-6361/201525770
- Delorme et al. (2020) Delorme, J.-R., Jovanovic, N., Echeverri, D., et al. 2020, in Society of Photo-Optical Instrumentation Engineers (SPIE) Conference Series, Vol. 11447, Society of Photo-Optical Instrumentation Engineers (SPIE) Conference Series, 114471P, doi: 10.1117/12.2562836
- Delorme et al. (2021) Delorme, J.-R., Jovanovic, N., Echeverri, D., et al. 2021, Journal of Astronomical Telescopes, Instruments, and Systems, 7, 035006, doi: 10.1117/1.JATIS.7.3.035006
- Dotter et al. (2007) Dotter, A., Chaboyer, B., Jevremović, D., et al. 2007, AJ, 134, 376, doi: 10.1086/517915
- Epstein et al. (2010) Epstein, C. R., Johnson, J. A., Dong, S., et al. 2010, ApJ, 709, 447, doi: 10.1088/0004-637X/709/1/447
- Feroz et al. (2009) Feroz, F., Hobson, M. P., & Bridges, M. 2009, MNRAS, 398, 1601, doi: 10.1111/j.1365-2966.2009.14548.x
- Finnerty et al. (2021) Finnerty, L., Buzard, C., Pelletier, S., et al. 2021, AJ, 161, 104, doi: 10.3847/1538-3881/abd6ec
- Fisher et al. (2020) Fisher, C., Hoeijmakers, H. J., Kitzmann, D., et al. 2020, AJ, 159, 192, doi: 10.3847/1538-3881/ab7a92
- Gaia Collaboration et al. (2016) Gaia Collaboration, Prusti, T., de Bruijne, J. H. J., et al. 2016, A&A, 595, A1, doi: 10.1051/0004-6361/201629272
- Gaia Collaboration et al. (2018) Gaia Collaboration, Brown, A. G. A., Vallenari, A., et al. 2018, A&A, 616, A1, doi: 10.1051/0004-6361/201833051
- Gandhi et al. (2019) Gandhi, S., Madhusudhan, N., Hawker, G., & Piette, A. 2019, AJ, 158, 228, doi: 10.3847/1538-3881/ab4efc
- Gao et al. (2020) Gao, P., Thorngren, D. P., Lee, G. K. H., et al. 2020, Nature Astronomy, 4, 951, doi: 10.1038/s41550-020-1114-3
- Gaudi et al. (2021) Gaudi, B., Roberge, A., Habex Team, & Luvoir Study Team. 2021, in Bulletin of the American Astronomical Society, Vol. 53, 0301
- Gonzales et al. (2020) Gonzales, E. C., Burningham, B., Faherty, J. K., et al. 2020, ApJ, 905, 46, doi: 10.3847/1538-4357/abbee2
- Horne (1986) Horne, K. 1986, PASP, 98, 609, doi: 10.1086/131801
- Husser et al. (2013) Husser, T. O., Wende-von Berg, S., Dreizler, S., et al. 2013, A&A, 553, A6, doi: 10.1051/0004-6361/201219058
- Jovanovic et al. (2019) Jovanovic, N., Delorme, J. R., Bond, C. Z., et al. 2019, arXiv e-prints, arXiv:1909.04541. https://arxiv.org/abs/1909.04541
- Kitzmann et al. (2020) Kitzmann, D., Heng, K., Oreshenko, M., et al. 2020, ApJ, 890, 174, doi: 10.3847/1538-4357/ab6d71
- Kolecki et al. (2021) Kolecki, J. R., Wang, J., Johnson, J. A., et al. 2021, AJ, 162, 125, doi: 10.3847/1538-3881/ac14bc
- Konopacky et al. (2013) Konopacky, Q. M., Barman, T. S., Macintosh, B. A., & Marois, C. 2013, Science, 339, 1398, doi: 10.1126/science.1232003
- Kramida et al. (2020) Kramida, A., Yu. Ralchenko, Reader, J., & and NIST ASD Team. 2020, NIST Atomic Spectra Database (ver. 5.8), [Online]. Available: https://physics.nist.gov/asd [2021, April 19]. National Institute of Standards and Technology, Gaithersburg, MD.
- Lavie et al. (2017) Lavie, B., Mendonça, J. M., Mordasini, C., et al. 2017, AJ, 154, 91, doi: 10.3847/1538-3881/aa7ed8
- Line et al. (2015) Line, M. R., Teske, J., Burningham, B., Fortney, J. J., & Marley, M. S. 2015, ApJ, 807, 183, doi: 10.1088/0004-637X/807/2/183
- Liu et al. (2002) Liu, M. C., Fischer, D. A., Graham, J. R., et al. 2002, ApJ, 571, 519, doi: 10.1086/339845
- Luck (2017) Luck, R. E. 2017, AJ, 153, 21, doi: 10.3847/1538-3881/153/1/21
- Madhusudhan (2019) Madhusudhan, N. 2019, ARA&A, 57, 617, doi: 10.1146/annurev-astro-081817-051846
- Maire et al. (2020) Maire, A. L., Molaverdikhani, K., Desidera, S., et al. 2020, A&A, 639, A47, doi: 10.1051/0004-6361/202037984
- Mann et al. (2013) Mann, A. W., Brewer, J. M., Gaidos, E., Lépine, S., & Hilton, E. J. 2013, AJ, 145, 52, doi: 10.1088/0004-6256/145/2/52
- Marley et al. (2013) Marley, M. S., Ackerman, A. S., Cuzzi, J. N., & Kitzmann, D. 2013, Clouds and Hazes in Exoplanet Atmospheres, ed. S. J. Mackwell, A. A. Simon-Miller, J. W. Harder, & M. A. Bullock, 367, doi: 10.2458/azu_uapress_9780816530595-ch15
- Mawet et al. (2018) Mawet, D., Bond, C. Z., Delorme, J. R., et al. 2018, in Society of Photo-Optical Instrumentation Engineers (SPIE) Conference Series, Vol. 10703, Adaptive Optics Systems VI, ed. L. M. Close, L. Schreiber, & D. Schmidt, 1070306, doi: 10.1117/12.2314037
- Mawet et al. (2019) Mawet, D., Fitzgerald, M., Konopacky, Q., et al. 2019, in Bulletin of the American Astronomical Society, Vol. 51, 134. https://arxiv.org/abs/1908.03623
- Mollière et al. (2017) Mollière, P., van Boekel, R., Bouwman, J., et al. 2017, A&A, 600, A10, doi: 10.1051/0004-6361/201629800
- Mollière et al. (2019) Mollière, P., Wardenier, J. P., van Boekel, R., et al. 2019, arXiv e-prints, arXiv:1904.11504. https://arxiv.org/abs/1904.11504
- Mollière et al. (2020) Mollière, P., Stolker, T., Lacour, S., et al. 2020, arXiv e-prints, arXiv:2006.09394. https://arxiv.org/abs/2006.09394
- Nelson et al. (2021) Nelson, T., Ting, Y.-S., Hawkins, K., et al. 2021, ApJ, 921, 118, doi: 10.3847/1538-4357/ac14be
- Palme et al. (2014) Palme, H., Lodders, K., & Jones, A. 2014, Solar System Abundances of the Elements, ed. A. M. Davis, Vol. 2, 15–36
- Parmentier & Guillot (2014) Parmentier, V., & Guillot, T. 2014, A&A, 562, A133, doi: 10.1051/0004-6361/201322342
- Parmentier et al. (2015) Parmentier, V., Guillot, T., Fortney, J. J., & Marley, M. S. 2015, A&A, 574, A35, doi: 10.1051/0004-6361/201323127
- Peretti et al. (2019) Peretti, S., Ségransan, D., Lavie, B., et al. 2019, A&A, 631, A107, doi: 10.1051/0004-6361/201732454
- Piette & Madhusudhan (2020) Piette, A. A. A., & Madhusudhan, N. 2020, MNRAS, 497, 5136, doi: 10.1093/mnras/staa2289
- Rasmussen et al. (2021) Rasmussen, K. C., Brogi, M., Rahman, F., et al. 2021, arXiv e-prints, arXiv:2108.12057. https://arxiv.org/abs/2108.12057
- Rickman et al. (2020) Rickman, E. L., Ségransan, D., Hagelberg, J., et al. 2020, A&A, 635, A203, doi: 10.1051/0004-6361/202037524
- Saumon & Marley (2008) Saumon, D., & Marley, M. S. 2008, ApJ, 689, 1327, doi: 10.1086/592734
- Sneden (1973) Sneden, C. 1973, ApJ, 184, 839, doi: 10.1086/152374
- Tremblin et al. (2017) Tremblin, P., Chabrier, G., Baraffe, I., et al. 2017, ApJ, 850, 46, doi: 10.3847/1538-4357/aa9214
- Villanueva et al. (2018) Villanueva, G. L., Smith, M. D., Protopapa, S., Faggi, S., & Mandell, A. M. 2018, J. Quant. Spec. Radiat. Transf., 217, 86, doi: 10.1016/j.jqsrt.2018.05.023
- Waldmann et al. (2015) Waldmann, I. P., Tinetti, G., Rocchetto, M., et al. 2015, ApJ, 802, 107, doi: 10.1088/0004-637X/802/2/107
- Wang et al. (2020) Wang, J., Wang, J. J., Ma, B., et al. 2020, AJ, 160, 150, doi: 10.3847/1538-3881/ababa7
- Zhang et al. (2020) Zhang, Z., Liu, M. C., Marley, M. S., Line, M. R., & Best, W. M. J. 2020, arXiv e-prints, arXiv:2011.12294. https://arxiv.org/abs/2011.12294
| Teff | (g) | (km/s) | [Fe/H] | |
|---|---|---|---|---|
| This work | 594640 | 4.430.01 | 0.810.16 | -0.040.07 |
| da Silva et al. (2015) | 597234 | 4.440.14 | 1.030.08 | 0.080.05 |
| Brewer et al. (2016) | 594025 | 4.400.03 | – | 0.070.01 |
| Luck (2017) | 5946 | 4.40 | 1.21 | 0.040.16 |
| [C/H] | [O/H] | C/O | |||
|---|---|---|---|---|---|
| HR 7672 A | |||||
| This work | 8.410.05 | -0.090.05 | 8.660.06 | -0.070.06 | 0.560.11 |
| da Silva et al. (2015) | 8.510.03 | -0.050.03 | – | – | – |
| Brewer et al. (2016) | 8.450.03 | 0.060.03 | 8.720.04 | 0.060.04 | 0.530.06 |
| Luck (2017) | 8.400.15 | -0.030.15 | 8.630.15 | -0.060.15 | 0.590.10 |
| Solar | 8.500.06 | 0.000.06 | 8.730.07 | 0.000.07 | 0.590.13 |
| HR 7672 B | |||||
| Fixed-mass | 8.23 | -0.27 | 8.51 | -0.22 | 0.52 |
| Free-mass | 8.26 | -0.24 | 8.54 | -0.19 | 0.52 |
| Parameter | Unit | Type | Lower | Upper |
|---|---|---|---|---|
| or Mean | or Std | |||
| Fixed Surface Gravity ((g)) | cgs | Gaussian | 5.5 | 0.2 |
| Free Surface Gravity ((g)) | cgs | Uniform | 3.5 | 5.5 |
| Fixed Mass (MP) | MJupiter | Gaussian | 72.7 | 0.8 |
| Free Mass (MP) | MJupiter | Uniform | 10 | 100 |
| H2O Mixing Ratio ((mr)) | Log-uniform | -10 | -1 | |
| CO Mixing Ratio ((mrCO)) | Log-uniform | -10 | -1 | |
| CO2 Mixing Ratio ((mr)) | Log-uniform | -10 | -1 | |
| CH4 Mixing Ratio ((mr)) | Log-uniform | -10 | -1 | |
| Temperature at 3.2 bar (tint) | K | Uniform | 1000 | 2000 |
| between 100 and 32 bar | K | Uniform | 0 | 2500 |
| between 32 and 10 bar | K | Uniform | 0 | 2000 |
| between 10 and 3.2 bar | K | Uniform | 0 | 1500 |
| between 3.2 and 1 bar | K | Uniform | 0 | 1000 |
| between 1 and 0.1 bar | K | Uniform | 0 | 1000 |
| between 0.1 bar and 1 mbar | K | Uniform | 0 | 1000 |
| between 1 mbar and 10 nbar | K | Uniform | 0 | 1000 |
| MgSiO3 Mixing Ratio ((mr)) | Log-uniform | -10 | -2 | |
| Vertical diffusion coefficient ((Kzz)) | cms-1 | Log-uniform | 5 | 10 |
| () | Uniform | 0 | 5 | |
| Width of log-normal particle size distribution ()) | Uniform | 1.05 | 3.05 | |
| Wavelength shift () | m | Uniform | -0.01 | 0.01 |
| y offset () | Uniform | -0.1 | 0.1 | |
| Rotational blurring (fblur) | kms-1 | Uniform | 2 | 100 |
| Parameter | Unit | PHOENIX | HR 7672 B | ||
|---|---|---|---|---|---|
| Mass? | fixed | free | fixed | free | |
| (g) | cgs | ||||
| MP | MJupiter | ||||
| (mr) | |||||
| (mrCO) | |||||
| (mr) | |||||
| (mr) | |||||
| tint | K | ||||
| between 100 and 32 bar | K | ||||
| between 32 and 10 bar | K | ||||
| between 10 and 3.2 bar | K | ||||
| between 3.2 and 1 bar | K | ||||
| between 1 and 0.1 bar | K | ||||
| between 0.1 bar and 1 mbar | K | ||||
| between 1 mbar and 10 nbar | K | ||||
| (mr) | |||||
| (Kzz) | cms-1 | ||||
| m | |||||
| fblur | kms-1 | ||||
| C/H | dex | ||||
| O/H | dex | ||||
| C/O | |||||
Note. — a: We report the median of posterior distribution and error bars correspond to the difference of the median and the 68% credible interval. b: We adopt solar elemental abundances from Palme et al. (2014).