From naked spheroids to disky galaxies: how do massive disk galaxies shape their morphology?
Abstract
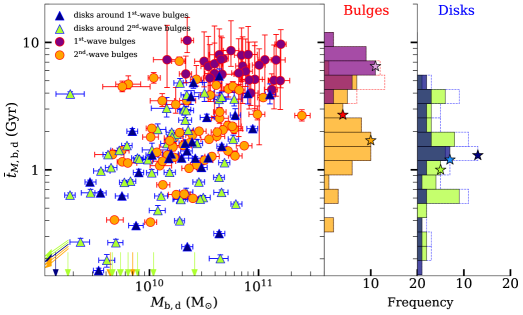
We investigate the assembly history of massive disk galaxies and describe how they shape their morphology through cosmic time. Using SHARDS and HST data, we modeled the surface brightness distribution of 91 massive galaxies at redshift in the wavelength range m, deriving the uncontaminated spectral energy distributions of their bulges and disks separately. This spectrophotometric decomposition allows us to compare the stellar populations properties of each component in individual galaxies. We find that the majority of massive galaxies () builds inside-out, growing their extended stellar disk around the central spheroid. Some bulges and disks could start forming at similar epochs, but these bulges grow more rapidly than their disks, assembling 80% of their mass in Gyr and Gyr, respectively. Moreover, we infer that both older bulges and older disks are more massive and compact than younger stellar structures. In particular, we find that bulges display a bimodal distribution of mass-weighted ages, i.e., they form in two waves. In contrast, our analysis of the disk components indicates that they form at for both first and second-wave bulges. This translates to first-wave bulges taking longer in acquiring a stellar disk ( Gyr) compared to second-wave less-compact spheroids ( Gyr). We do not find distinct properties (e.g., mass, star formation timescale, and mass surface density) for the disks in both types of galaxies. We conclude that the bulge mass and compactness mainly regulate the timing of the stellar disk growth, driving the morphological evolution of massive disk galaxies.
1 Introduction
The morphological classification of galaxies represents the first attempt to understand the origins of the variety of observed galaxies in the universe (Hubble, 1926). However, a crucial but still unresolved controversy is the origin of the Hubble sequence. When galaxies shape their morphology? What drives their evolution? How do the spheroidal and disk components of present-day galaxies form?
Traditionally, the stellar disk is proposed to form through the collapse of the gas in a rotating dark matter halo (Fall & Efstathiou, 1980). Although the nature of the processes involved is dissipative, the gas conserves its mass and high angular momentum in the absence of external influences (Dalcanton et al., 1997; Mo et al., 1998). Consequently, it enhances a differential star formation in the galaxy, since the central region reaches a sufficient gas surface mass density to form stars earlier or in larger amounts and with higher efficiency than the outer part (Brook et al., 2006). The above description is far from simple within the hierarchical assembly of structures in a cold dark matter universe. Galaxy mergers usually destroy (or thicken) the stellar disk (Steinmetz & Navarro, 2002), but the stellar and gas material could survive to re-form a disk in the merger remnant (Hopkins et al., 2009a; Clauwens et al., 2018).
Multiple possibilities are proposed for the formation of the central bulge component. Accordingly, bulges are usually classified as classical or disk-like depending on their main channel of evolution (Athanassoula, 2005). Classical bulges could arise from a violent and dissipative collapse of protogalaxies (Eggen et al., 1962; Larson, 1976), from accumulation and rearrangement of stars in mergers events (Cole et al., 2000; Hopkins et al., 2009b), from massive clumps coalescence (Noguchi, 1999; Bournaud et al., 2007), and/or a gas-compaction phase triggered by violent disk instabilities which lead to efficient spheroidal growth in high-redshift galaxies (Dekel & Burkert, 2014; Ceverino et al., 2015; Zolotov et al., 2015). On the other hand, the slow and prolonged rearrangement of disk material due to secular evolutionary processes (i.e., the evolution of a bar component, instabilities due to spiral patterns, etc.) could build-up central bulges with disk-like properties (Kormendy & Kennicutt, 2004; Kormendy, 2016). From an observational standpoint, the challenge is to reconstruct the formation pathways of galaxies having access to the observed properties of their bulges and disks (Méndez-Abreu et al., 2010, 2014; Morelli et al., 2015, 2016; Costantin et al., 2017, 2018b, 2018a; de Lorenzo-Cáceres et al., 2019a, b; Gadotti et al., 2020; Gao et al., 2020).
In the last years, there has been a large effort to study the stellar population properties of high-redshift galaxies with the aim of unveiling the main processes which drove their evolution (e.g., Belli et al., 2019; Estrada-Carpenter et al., 2019; Tacchella et al., 2021). These studies suggest that at high redhift galaxies form on shorter timescales with respect to those formed at later cosmic times. Moreover, the formation redshift of these galaxies seems to depend on their stellar mass (Heavens et al., 2004; Pérez-González et al., 2008; Morishita et al., 2019; Carnall et al., 2019) and mass surface density (Estrada-Carpenter et al., 2020; Suess et al., 2021).
The main problem of studying the galaxy integrated properties is that the complexity of its formation and evolution is averaged out. But, until recently, few works have focused their attention in studying the separate evolution of the different morphological components beyond the local universe (e.g., Domínguez-Palmero & Balcells, 2008, 2009; Bruce et al., 2014; Margalef-Bentabol et al., 2016, 2018; Dimauro et al., 2018; Mancini et al., 2019). Thus, in this work we show how the accreted mass fraction in bulges and disks can actually unveil fundamental hints about the balance between the different pathways of galaxy formation.
In this paper, we study the interplay of bulge and disk properties across time exploiting the Survey for High-z Absorption Red and Dead Sources (SHARDS; Pérez-González et al., 2013) data set. SHARDS is a state-of-the-art multi-filter imaging survey, which provides ultra-deep ( AB mag) photometry in 25 filters covering the wavelengths range m with subarsec seeing. SHARDS data allow us to smoothly sample the spectral energy distribution (SED) of galaxies with spectral resolution and, given the seeing upper limits imposed in the Gran Telescopio Canarias queue-mode data acquisition, separate the light of their individual bulge and disk components. In Costantin et al. (2021, hereafter Paper I) we presented the spectrophotometric decoupling of a sample of massive galaxies up to redshift and presented their bulge properties. In particular, we found a bimodal distribution of bulge ages, with a fraction of them being formed in the early universe () and having high mass surface densities; a second wave of bulges, dominant in number, evolved more slowly, forming most of their stars Gyr later. In this second paper of a series, we aim at studying the interplay between the bulge and the disk properties through time, in order to describe their relative importance in building up massive disk galaxies. For that purpose, we take the same sample presented in Paper I, concentrating in the galaxies with disks (i.e., leaving aside pure spheroids), and study their stellar population properties.
The paper is organized as follows. We describe the data set and summarize the spectro-photometric decoupling procedure and the stellar population analysis in Sect. 2. We present and discuss our results in Sect. 3 and 4, respectively. We provide our conclusions in Sect. 5. Throughout the paper we assume a flat cosmology with , , a Hubble constant km s-1 Mpc-1, and a Chabrier (2003) initial mass function ().
2 Data
In this Section we present the data set and the properties of the sample of galaxies analyzed in this work (Sect. 2.1). The characterization of the bulge and disk physical properties is fully described in Paper I. For completeness, we briefly summarize the main steps of the spectrophotometric decomposition (Sect. 2.2), as well as the analysis of the stellar population properties (Sect. 2.3).
2.1 Sample of Galaxies
We combine the spectral resolution of the SHARDS observations with the high spatial resolution of the Hubble Space Telescope (HST) Advanced Camera for Surveys (ACS) and Wide Field Camera 3 (WFC3) images. In particular, we use seven filters for HST images from the optical to the near-infrared wavelength range m and the 25 filters of SHARDS in the optical wavelength range m (see Grogin et al., 2011; Koekemoer et al., 2011; Pérez-González et al., 2013; Barro et al., 2019, for all details). To provide a more robust constraint on the stellar mass, we complement this data set with the -band information at m provided by the Canada-France-Hawaii Telescope WIRCam data (Hsu et al., 2019).
In this second paper of a series we characterize the physical properties of the disk component of massive ( M⊙) and luminous ( mag) galaxies at redshift in the North field of the Great Observatory Origins Deep Survey (GOODS-N). Starting from the parent sample of 478 galaxies defined in Paper I, we consider the 91 galaxies with a reliable photometric bulge+disk decomposition (disky galaxies) and lacking of any sign of interactions and/or background/foreground contaminating objects. As discussed in Paper I, the representativeness of the sample in the SHARDS field-of-view is assured both in redshift and stellar mass by means of a Kolmogorov-Smirnov test (-value, -value; see Paper I, for all details about the sample selection).
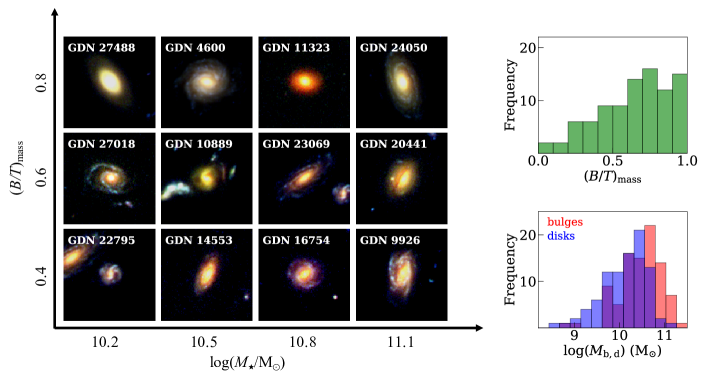
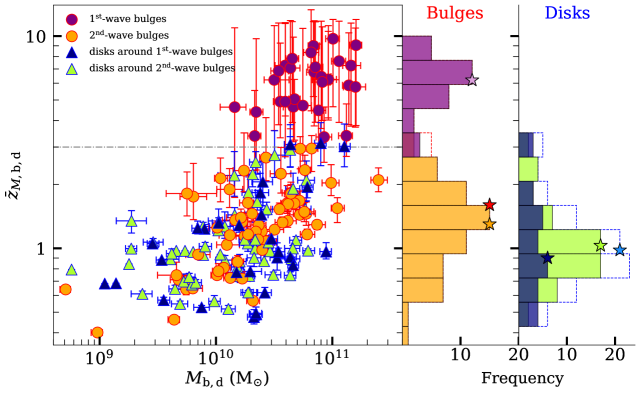
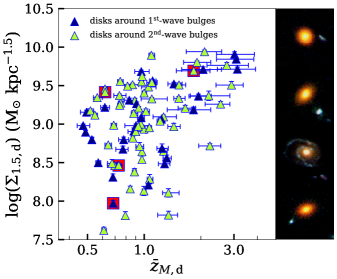
Our galaxies span a variety of bulge-over-total mass ratios (), bulge mass ( M⊙), disk mass ( M⊙), bulge effective radii ( kpc), and disk effective radii ( kpc). We present in Fig. 1 the distribution of and stellar mass of the bulge and disk components. Moreover, in Fig. 1 we visually demonstrate the large diversity of galaxy morphology as a function of their and galaxy stellar mass.
2.2 Spectrophotometric Decomposition
For each galaxy and each filter, the bulge and disk light is parametrized to be the sum of a Sérsic (1968) and a single exponential function (Freeman, 1970), respectively. We use the GASP2D algorithm (Méndez-Abreu et al., 2008, 2014) to obtain a two-dimensional model of the galaxy across wavelength. Indeed, we took advantage of the 25 medium-band SHARDS images to spectrophotometrically decouple the different stellar structures with a spectral resolution in the wavelength range m. We complement this information with the HST WFC3 and -band data, covering the wavelength range between and m. It is worth remembering that the HST photometry is used as a prior for the decoupling of the bulge and disk light in SHARDS images (see Paper I, for all details). This strategy mimics the one used by the C2D code (Méndez-Abreu et al., 2019a, b), which allows us to transfer the high spatial resolution of the HST images to the SHARDS data set, consistently reducing the degeneracies associated to the photometric modeling. The procedure eventually provides us with the individual SEDs of each bulge and disk component.
| ID | ) | log() | ) | log() | |||||||
|---|---|---|---|---|---|---|---|---|---|---|---|
| (kpc) | (M⊙) | (Gyr) | (M⊙ kpc-1.5) | (kpc) | (M⊙) | (Gyr) | (M⊙ kpc-1.5) | ||||
Note. — Table 1 is published in its entirety in the machine-readable format. A portion is shown here for guidance regarding its form and content. Column (1): CANDELS ID of the galaxy (Barro et al., 2019). Column (2): mass-weighted . Column (3): bulge effective radius at 1.6 m (Paper I). Column (4): bulge stellar mass. Column (5): bulge mass-weighted age. Column (6): bulge mass-weighted formation redshift. Column (7): bulge mass surface density. Column (8): disk effective radius at 1.6 m (Paper I). Column (9): disk stellar mass. Column (10): disk mass-weighted age. Column (11): disk mass-weighted formation redshift. Column (12): disk mass surface density.
2.3 Stellar Populations
We fit both the measured bulge and disk SEDs with the Bruzual & Charlot (2003) stellar population library by means of the synthesizer fitting code (see Pérez-González et al., 2003, 2008, for all details). Shortly, we assume a Chabrier (2003) initial mass function integrated in the range . The star formation history (SFH) of each galaxy component is parametrized with a declining delayed exponential law
| (1) |
where runs from 200 Myr to a roughly constant SFH ( Gyr). The metallicity of the models spans discrete values = [0.4, 1, 2.5] (i.e., sub-solar, solar, and super-solar). The extinction law of Calzetti et al. (2000) is used to parametrize the V-band attenuation, with values ranging from 0 to 3 mag.
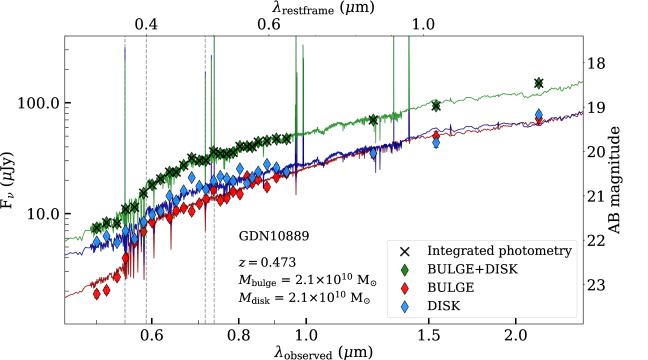
As described in Paper I, the maximum-likelihood estimator is minimized to obtain the best fitting model. Moreover, for each galaxy component we run 500 Monte Carlo simulations to estimate the uncertainties in the stellar population parameters and to account for possible degeneracies in the solutions (see Domínguez Sánchez et al., 2016, for more details). As an example, in Fig. 2 we present the best model for the bulge, disk, and galaxy SED for the galaxy GDN 10889.
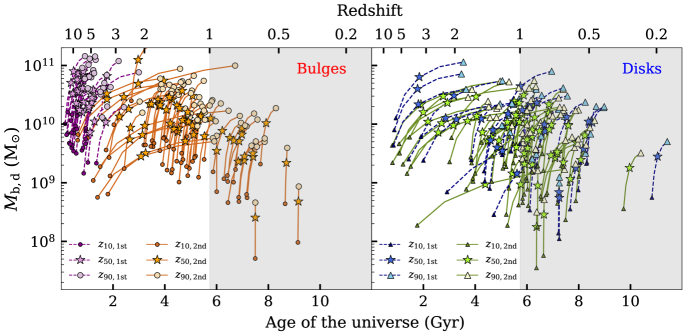
The characterization of each bulge and disk SFH allows us to derive fundamental physical quantities, which constrain their stellar populations and result critical to quantify their evolutionary process. In particular, in this paper we will characterize the bulges and disks of the galaxies in our sample in terms of the following physical properties: the stellar mass (), the star formation timescale (), the metallicity (), and the dust attenuation (). Furthermore, we compute the bulge and disk mass-weighted age () as well as its corresponding redshift (i.e., the mass-weighted formation redshift ). While mass-weighted ages take into account the extent of the star formation and mitigate the age- degeneracy, the mass-weighted formation redshift allows us to properly compare galaxies observed at different redshift. In order to characterize the beginning and the end of the mass assembly of our bulges and disks, we calculate the cosmic times corresponding to the instants when they acquire a fraction of their current mass, starting from the onset of the first episode of star formation. In particular, considering their observed redshift, we convert each instant to the corresponding redshift , , and , i.e., the redshift when each component grows 10, 50, and 90 per cent of its current mass (see Fig. 3). With this definition is a proxy for the mass-weighted formation redshift and they can be compared at first approximation (see Sect. 3.3). Finally, we also derive the bulge and disk compactness, computing their mass surface density (Barro et al., 2013). We report in Table 1 the properties derived from the main cluster of solutions for the sample galaxies, bulges, and disks, respectively.
3 Results
In this paper we focus on the characterization of the stellar disks in a representative sample of massive galaxies at redshift , comparing their properties with those of bulges presented in Paper I. In particular, we present the bulge and disk mass assembly and star formation histories in Sect. 3.1 and 3.2, their individual mass-weighted formation redshifts in Sect. 3.3, and the interplay between their ages and fundamental physical properties (i.e., mass, size, star formation timescale, mass surface density, and Sérsic index) in Sect. 3.4.
3.1 Bulges and Disks Mass Assembly History
In this Section we describe how bulges and disks build their mass, focusing on the timescales of their SFHs. This will allow us to understand which component starts to build earlier and at which rate they form.
In Fig. 3 we show the stellar masses of our bulges and disks as a function of the age of the universe, i.e., the evolutionary tracks in their stellar mass assembly. We identify (left panel) two behaviors when considering first-wave bulges (those with mass-weighted formation redshift beyond ) and second-wave bulges (those formed from ), as identified in Paper I. Indeed, first-wave bulges grow their mass on short timescales Gyr; almost identical values are found for those second-wave bulges which start to assemble at redshift ( Gyr). On the other hand, there is a fraction of second-wave bulges (14%) that start to assemble at , build half of their mass at redshift , and evolve more slowly Gyr. This subpopulation corresponds to more horizontal evolutionary tracks in the panel.
In Fig. 3 (right panel) we see that some disks start to form as early as first-wave bulges (). However, they assemble more slowly than bulges ( Gyr), accreting half of their current mass by redshift . This can be understood if a fraction of the primordial gaseous disk forms clumps that migrate to the bulge. In this scenario, only a fraction of the new stars formed in the disk remains in the disk. On the other hand, the evolution of disks which start to form at redshift is faster ( Gyr). However, it is worth noticing that 21 out of 66 (32%) of those disks present significant ongoing star formation and/or assembly activity ( Myr) at the redshift of observation (see Fig. 11). Thus, given that these disks are young, the star formation timescale is not very informative; in principle, they could eventually present similar timescales to those of the disks formed at higher redshift (which we catch in a more evolved evolutionary stage).
We find that the bulk of our disks (76%) grows half of their mass later than bulges despite some disks having started to form as early as some bulges (). Therefore, even if bulges and disks could start forming at the same time, bulges assemble rapidly (short ) and then evolve passively, but disks continue forming stars, so they continue growing more slowly. We note that the first-wave bulges present very different timescales compared to the disks around them. The formation of these structures are far enough from the time corresponding to the observed redshift that we can analyze the long-term evolution of bulges and disks. Interestingly, bulges quench quite rapidly, while disks present more extended star formation (see Sect. 3.2). This indicates that a large amount of gas still exists and falls into the galaxy, but it is not transferred to the central region and/or cannot be transformed efficiently into stars.
3.2 Bulges and Disks Star Formation History
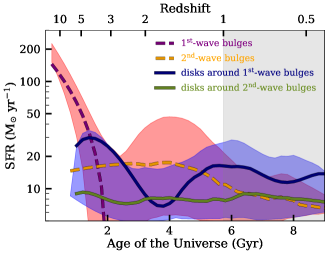
As discussed in Paper I, a considerable fraction of our massive galaxies experienced a peak of star formation at (see Fig. 4), linked to a violent episode of compaction (revealed by the high stellar mass densities). The large SFR values which led to the formation of first-wave bulges are consistent with the high gas accretion rates and the successive compaction events (Zolotov et al., 2015; Ceverino et al., 2018). In particular, Ceverino et al. (2018) reported typical star formation bursts at with maximum specific SFR of Gyr-1, which translates to M⊙ yr-1 for M⊙. This episode causes the rapid grow of a small but massive system, which evolves as a compact spheroid (bulge) and develops an extended (and dynamically stable) stellar disk at later times, as we show in this paper. Thus, we identify these bulges as relics of the blue and red-nugget population usually observed at (Damjanov et al., 2009; Barro et al., 2013).
We showed in Fig. 3 that the first disks started to form at redshift . But, they build up on longer timescales with respect to bulges, assembling half of their current mass by redshift . They are characterized by long timescales of evolution ( Gyr), small sizes ( kpc), and high mass surface densities (log M⊙ kpc-1.5). The compactness of these disks and of first-wave bulges suggests that in the universe the conditions were favorable for shaping small and massive systems, but with different morphologies.
As shown in Fig. 4, the episode of star formation for disks which develop around first-wave bulges is on average more intense than the one of disks around second-wave bulges ( of and M⊙ yr-1, respectively). As the cosmic time passes ( and lower), a second wave of spheroids starts to assemble. These second-wave bulges present a variety of timescales, but the majority of them still form on short timescales ( Myr) with peaks of star formation as intense as M⊙ yr-1 (and higher than coeval disks). Nevertheless, on average bulges and disks form stars at similar rates from redshift to redshift . At redshift our bulges display a drop of star formation, while disks show a slight increase of star formation activity (until the time of observation).
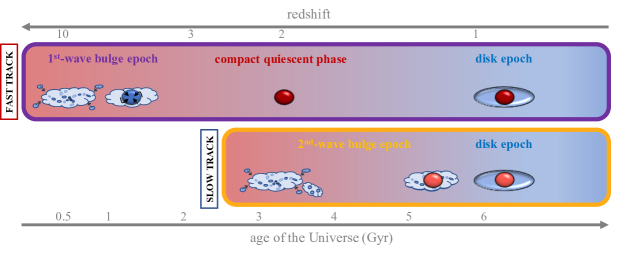
Summarizing our results in this subsection, we identify four morphological epochs in the evolution of massive disk galaxies: a first wave of bulges started to assemble as early as redshift ( Gyr ago); after some time ( Gyr ago; ) the first population (15%) of extended stellar disks start to assemble, but on longer timescales than the first wave of bulges. Then, a second wave of bulges, predominant in number (), starts to grow from redshift down to redshift . On the top of this second wave, starting from redshift ( Gyr ago), the disk era starts. Even though bulges are on average older than disks (see Sect. 3.3.2), we find a close interplay between the two components, which suggest a level of co-evolution between them. This will be further discussed in Sect. 4.
3.3 Mass-weighted Formation Redshifts
We derive the mass-weighted ages of each bulge and disk, providing fundamental constraints on their formation and co-evolution (see Table 1 and Appendix A). Our galaxies are observed in a wide redshift range (spanning Gyr of cosmic time), making the interpretation of their mass-weighted ages more difficult. Thus, we compute the redshift corresponding to their mass-weighted ages (; see Table 1) to follow the evolution of each system at different epochs. In Fig. 5 we show the mass-weighted formation redshift of bulges and disks as a function of their stellar mass. As already discussed in Sect. 3.1, we find that the disk population forms on average at later cosmic times than the bulge population. Bulges have median mass-weighted formation redshift , while disks have . In Paper I we found that 33% of bulges have . Here we show that only ten out of 91 disks have and none of them presents . These findings are consistent with the predictions from multiple cosmological simulations, where the spheroidal component tends to form at early cosmic epochs and late star formation contributes to the growth of disk stars. In particular, Park et al. (2019) quantified that massive galaxies ( log(/M) in the New Horizon simulations (Dubois et al., 2021) start to form disks from , once their mass become M⊙. Tacchella et al. (2019) showed that the efficiency of disk formation in Illustris TNG simulations (Pillepich et al., 2018; Nelson et al., 2018) strongly depends on both on stellar mass and cosmic time. In both simulations, at early times the formation efficiency of disks is low, increasing towards .
Bulges formed at higher redshift are more massive (Paper I), as proved by a Spearman correlation coefficient of 0.71 (-value ). Similarly, older disks are more massive (Spearman correlation coefficient of 0.40; -value ). On the other hand, the bulge formation time has a stronger correlation with the total mass of the galaxy than disks, having a Spearman correlation coefficient of 0.63 and 0.36, respectively. These trends are in agreement with the fact that there is a strong correlation between mass and cosmic time, as shown both in the FIRE (Hopkins et al., 2014) and the New Horizon cosmological simulations. In particular, massive galaxies start to form disk stars at earlier epochs (), while low-mass galaxies develop their disks after (El-Badry et al., 2018; Park et al., 2019).
3.3.1 First and Second-wave Systems
As discussed in Paper I, bulges form in two waves. The distribution of their mass-weighted formation redshift is bimodal: first-wave bulges have median mass-weighted formation redshift , while second-wave bulges have median mass-weighted formation redshift . Our analysis allows us to directly compare the disks which build around first-wave bulges with the ones growing around second-wave bulges. The first ones have median mass-weighted formation redshift , while the latter ones have . A Kolmogorov-Smirnov test (, -value ) suggests that we cannot reject the null hypothesis that the two distributions are identical. Thus, at the peak of the cosmic SFR density (Lilly et al., 1996; Madau et al., 1996; Madau & Dickinson, 2014) disks could form around all types of spheroids.
We find that most of our disks formed at similar cosmic times than second-wave bulges (). Nonetheless, the disks (and ) distribution is different from the one of second-wave bulges at confidence level, as proved by a Kolmogorov-Smirnov test with statistic ().
3.3.2 Age Difference between Bulges and Disks
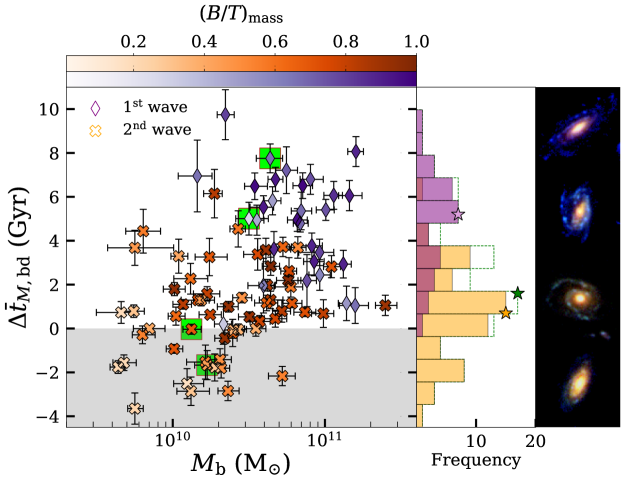
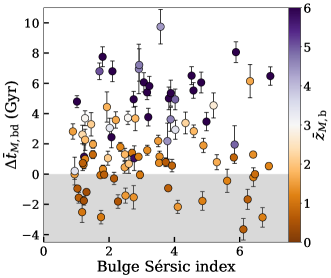
In order to characterize the galaxy evolution in terms of its structural components, we show in Fig. 6 the differences in mass-weighted ages between each bulge and disk. The median age difference is Gyr.
We define bulges as older, coeval, and younger than their disks by looking at the compatibility between each and . At () level we find that 74% (59%) of our bulges formed before their disks, 9% (29%) of systems are compatible to be coeval, while in 17% (12%) of galaxies the bulge formed after the disk component. In particular, all first-wave bulges are older than their disk component. We find that first-wave bulges and their disks present Gyr, while the age difference for second-wave systems is Gyr. In the following, we analyze the properties of bulges and disks considering the age difference between the two components at level.
As discussed in Sect. 4, our results actually suggest that (second-wave) bulges and disks display a degree of co-evolution: both structures form at similar times (), but the disk builds up on longer timescales, keeping on forming stars while the bulge stops its star formation earlier (see Figs. 3 and 4).
3.4 Morphological Properties
In this Section we analyze which are the physical properties regulating the bulge and disk evolution. In particular, we focus on their stellar mass, size, timescale, mass surface density, and Sérsic index.
3.4.1 Stellar Mass
Our bulges have median , while our disks have median .
We find that first and second-wave bulges have median and , respectively. On the other hand, disks around first and second-wave bulges have similar masses of and , respectively. A Kolmogorov-Smirnov test suggests that we cannot reject the null hypothesis that both the two distributions (, -value ) and the distributions of and for second-wave bulges (, -value ) are similar.
In terms of their mass, bulges older, coeval, and younger than their disks have median mass , , and , respectively. There is a (mild) correlation (Spearman coefficient of 0.48; -value ) between and . In particular, in the high mass regime ( M⊙) there is only one bulge (out of 54) younger than its disk (see Fig. 6). Disks younger, coeval, and older than their bulges have median mass , , and , respectively. There is no correlation between and .
We investigate now the relative contribution of bulges and disks to the total stellar mass of our galaxies. The median bulge-over-total mass ratio of the sample is . Galaxies which build from first-wave systems are more bulge-dominated than those which build later on, having and , respectively. There is a mild correlation between the bulge prominence and its formation redshift (Spearman coefficient of 0.45; -value ), while we find no correlation between the disk and .
We find a trend between and the prominence of the two components defined by , as shown in Fig. 6. The Spearman correlation coefficient of (, ) is 0.49 (-value ). We find that 48% of bulges in galaxies with are younger than their disks (12 out of 25), while this fraction diminishes to 6% for bulges in galaxies with . In particular, bulges older than their disks reside in galaxies with median , bulges with ages similar of those of their disks reside in galaxies with median , and bulges younger than their disks are found in galaxies with median .
3.4.2 Size
We define the size by means of the effective radius , i.e., the radius at which bulges and disks contain half of their light in the WFC3 F160W band. In particular, being the surface brightness of the disk modeled with an exponential profile with scale radius (Paper I), the effective radius corresponds to (Graham & Driver, 2005).
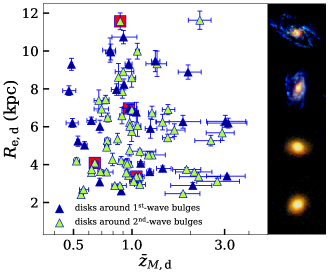
Bulges and disks have median sizes kpc and kpc, respectively. We find that first and second-wave bulges have similar median sizes, i.e., kpc and kpc, respectively. On the other hand, we show in Fig. 7 that disks around first and second-wave bulges have kpc and kpc, respectively. Disks around first-wave bulges are larger than those around second-wave bulges at confidence level (). In Paper I we found a weak correlation (Spearman coefficient of 0.21) between the mass-weighted formation redshift of bulges and their size. However, there is no correlation between the disk size and the time of their formation (Fig. 7). This remains valid if we separate disks in those around first and second-wave bulges.
In terms of their size bulges older, coeval, and younger than their disks have median sizes kpc, kpc, and kpc, respectively. Disks younger, coeval, and older than their bulges have median sizes kpc, kpc, and kpc, respectively. There is no correlation between neither and nor and .
3.4.3 Star Formation Timescale
Disks of our massive galaxies present median Myr. As highlighted in Paper I, bulges mostly formed on short timescales ( Myr) and a slower mode of formation starts to be in place only for some second-wave bulges. On the other hand, we find that 52% of disks have Myr and 38% of disks have Myr. The first disks in place () formed on longer timescales compared to the ones formed at lower redshift. Indeed, all disks formed at redshift have Myr.
Disks around first and second-wave bulges have median Myr and Myr, respectively. A Kolmogorov-Smirnov test (, -value ) suggests that we cannot reject the null hypothesis that these two distributions are similar.
We find that disks older than their bulges form on longer timescales compared with the younger ones. Indeed, disks younger and older than bulges have Myr and Myr, respectively.
3.4.4 Mass Surface Density
We parameterize the bulge and disk compactness looking at their mass surface density (see Sect. 2.3). As expected, we find that bulges and disks have very different mass surface densities: bulges present median M⊙ kpc-1.5, while disks have median M⊙ kpc-1.5.
We show in Fig. 8 the trend between and . There is a mild trend between the disk mass-weighted formation redshift and their mass surface density (Spearman coefficient of ; -value ), i.e., older disks are more compact.
We already discussed in Paper I that first-wave bulges display higher values of mass surface density than second-wave bulges, i.e., they are more compact ( M⊙ kpc-1.5 and M⊙ kpc-1.5, respectively). This is a hint for characterizing their different formation mechanism. But, we find no differences of between disks around first and second-wave bulges ( M⊙ kpc-1.5 and M⊙ kpc-1.5, respectively). Nonetheless, we find that the first structures to form are the more compact. This is not only valid for galaxies, but also for each of their morphological components.
| Type | ) | |||||||
|---|---|---|---|---|---|---|---|---|
| (M⊙) | (Gyr) | (Myr) | (kpc) | (M⊙ kpc-1.5) | ||||
| bulges | ||||||||
| first-wave bulges | ||||||||
| second-wave bulges | ||||||||
| bulges older than disks | ||||||||
| bulges coeval of disks | ||||||||
| bulges younger than disks | ||||||||
| disks | ||||||||
| disks around first-wave bulges | ||||||||
| disks around second-wave bulges | ||||||||
| disks younger than bulges | ||||||||
| disks coeval of bulges | ||||||||
| disks older than bulges |
Note. — Column (1): morphological component. Column (2): stellar mass. Column (3): mass-weighted age. Column (4): mass-weighted formation redshift. Column (5): redshift when a component grows 10% of its current mass. Column (6): redshift when a component grows 90% of its current mass. Column (7): timescale of exponentially declined SFH. Column (8): effective radius. Column (9): mass surface density.
3.4.5 Sérsic Index
We find that neither the mass-weighted formation redshift of bulges nor those of disks correlates with the bulge Sérsic index, having Spearman coefficient of and , respectively (-value and , respectively). Moreover, bulge and disk mass-weighted formation redshift do not correlate with the Sérsic index of the galaxy either, having Spearman coefficient of and , respectively (-value and , respectively). As shown in Fig. 9, no correlation is found between the and the bulge Sérsic index, being the Spearman coefficient (-value ).
4 Discussion
In this Section we discuss the main results of our analysis, summarizing our findings about bulge and disk formation (presented in Paper I and this paper). To facilitate the comparison, we briefly outline all the physical properties measured for our bulges and disks (in Table 2), dividing systems between first and second wave as well as separating galaxies in those with bulges older, coeval, or younger than their disks. Moreover, we qualitatively illustrate in Fig. 10 the proposed scenario for the formation and morphological evolution of massive disk galaxies at redshift , complementing the picture provided in Paper I (Fig. 13), adding the information about the disk epoch.
Galaxies are complex systems, and their integrated properties are hiding the complexity of their evolution. Indeed, we infer from our results that we are looking at an evolutionary sequence in which massive disk galaxies shape their morphology, growing their extended stellar disks around a centrally concentrated spheroid. The residual and continuous gas accretion enables the central spheroid to slowly develop a stellar envelope, allowing the incoming gas to retain angular momentum and resulting in a more extended and disky system by (see also Pérez-González et al., 2008; Buitrago et al., 2013). In particular, we find that disks form efficiently when bulges grow inefficiently and viceversa (Figs. 4 and 5). Indeed, we report a delay in the time of formation of the two components. This is consistent with recent cosmological simulations (e.g., IllustrisTNG), showing that bulges form efficiently at early cosmic times and assembled most of their mass by the time galaxies stop forming stars (Tacchella et al., 2019).
Our main result is that disks consistently form at around first and second-wave bulges. This evidence may suggest that disks at these redshifts are not destroyed, while they might be at higher redshift (). The reasons for this might be the enhanced merger activities and the (larger) more turbulent gas fractions. Thus, primordial (dynamically unstable) gas-riched disks have a different fate than extended thin (dynamically stable) disks which grow at . Furthermore, also first and second-wave bulges show very different paths of evolution, being the first one the end products of compaction events at very high redshift (Paper I).
In the two-phase scenario proposed for early-type galaxies (Oser et al., 2010), a compact progenitor rapidly built at high redshift (Dekel et al., 2009; Zolotov et al., 2015) and slowly grew in size through non-dissipational processes (e.g., dry minor mergers) until resulting in an elliptical galaxy in the local universe (Naab et al., 2009; Huang et al., 2013a, b). In this picture, we argue that also massive disk galaxies could play a crucial role, hosting a compact core (first-wave bulge) which went through a blue and red-nugget phase and grew an extended stellar disk at later times. Moreover, some of second-wave bulges are as compact as first-wave bulges and formed before their disks. They could be interpreted as a later wave of systems going through a red-nugget phase at , but keeping in mind that these galaxies experienced a higher degree of co-evolution between the spheroidal and disk component (see Sect. 3.3.2). This could allow to extend the two-phase paradigm to late-type galaxies, as already proposed by recent studies (Graham, 2013; de la Rosa et al., 2016; Costantin et al., 2020).
We remark that only a proper decoupling of the two components allows us to characterize the instants where these galaxies form and the physical processes responsible for their evolution. In this picture, the results of our work point toward a scenario where the majority of massive disk galaxies assemble inside-out. In of our galaxies the central bulge forms half of its mass earlier than the disk component, which takes on average Gyr to develop around the bulge. In particular, for of the systems the bulge takes more than 3 Gyr to develop an extended disk. This result is consistent with predictions from EAGLE cosmological simulations (Schaye et al., 2015; Crain et al., 2015) showing that on average disk-dominated galaxies more massive than M⊙ have inner regions older than the outer part ( Gyr at ), compatible with an inside-out formation (Pfeffer et al., 2022).
The few disks (17%) older than their bulges are characterized by longer timescales with respect to disks younger than their bulges. Considering that some disks start to form as early as some bulges, but they assemble their mass slower, this suggests a high degree of co-evolution between the two components. Disk material is probably accreted into the central region of the galaxy, funneling gas and highly increasing the star formation efficiency of the spheroidal component. However, since bulges build up fast, as time passes we see residual star formation in the disk component simultaneously with a reduction of the star formation activity in the central region of the galaxy.
Focusing on the first-assembled systems (), we find that they grow an extended stellar disk from a spheroidal-like system (first-wave bulge). In this scenario, cosmological simulations show that it is possible to form extended star-forming disks around red nuggets after compaction (Zolotov et al., 2015; Dekel et al., 2020). Given that first-wave bulges are very massive and compact, and considering the mass-weighted age differences between the bulge and the disk in these galaxies, our results point to a morphological quenching and a stabilization of the galaxies which prevents further star formation in the primordial disk for several Gyrs. In these galaxies, it is possible that the compaction phase of first-wave bulges consumes the cold gas in the outskirts (or quickly destroy the primordial disk) and inhibits the star formation for as long as Gyrs (see Fig. 6). Even if some disks start to build at redshift , they grow slowly ( Gyr) due to violent disk instabilities and clump migration, which result in a low cold gas fraction available in the outskirts of these systems or with a lower efficiency of star formation. Similarly, the star formation in disks around second-wave bulges may be lower because the recent growth of the bulge has depleted the cold gas in the outskirts of the galaxy. In the New Horizon cosmological simulations, the driver of the bulge growth in disk-dominated galaxies is the increase of perturbed disk stars at early cosmic time until (Park et al., 2019), which results into a lower efficiency for the formation of stars in the disk. Again, this migration of stars from an unstable primordial disk into a compact spheroid agrees with the compaction events which are responsible to form red-nugget systems (Ceverino et al., 2015; Zolotov et al., 2015).
Several studies described the inside-out growth of massive galaxies by studying the radial gradient of their stellar mass surface density (e.g., van Dokkum et al., 2010; Patel et al., 2013). By linking progenitors and descendants of these galaxies, these works show that massive galaxies have assembled their extended stellar halos around compact and dense cores. Similarly, the observed size evolution of star-forming galaxies was interpreted as a different distribution of their stellar populations, where the youngest stars have a more extended distribution than the older stars (e.g., Williams et al., 2010). Our analysis adds a fundamental piece of information to these studies: we morphologically separate the bulge and disk components and derive their stellar population properties, providing clues about the assembly time for each component separately.
Interestingly, we find that not only galaxies form in a downsizing fashion, but also each of their morphological components does. As shown in Figs. 5 and 6, galaxies, bulges, and disks form their stars later as they are less massive. Interestingly, more massive system are not only older, but also more compact.
We find that the inside-out growth of massive disk galaxies strongly depends on the bulge mass (see Fig. 6), which actually drives the morphological evolution of our galaxies. Our results complement and extend (up to redshift ) the results obtained by Méndez-Abreu et al. (2021) studying the evolution of bulges and disks in local galaxies within the CALIFA survey (Sánchez et al., 2012). The properties of bulges drive the future evolution of the galaxy as a whole, while disks have properties being set up by those of the galaxy, but not affecting them.
5 Conclusions
In this work we have investigated how massive disk galaxies shape their morphology across cosmic time. We studied a sample of galaxies from the SHARDS spectro-photometric survey in GOODS-N, which we photometrically modeled as a central bulge and an extended stellar disk. Thanks to the SHARDS data and also counting with the exquisite morphological information provided by HST/CANDELS data, we retrieved the SEDs of each bulge and disk in those galaxies with a spectral resolution . The spectral resolution and depth of the SHARDS data allowed us to characterize their individual SFHs fitting the SEDs to stellar population synthesis models.
We find that the majority () of massive disk galaxies grows inside-out. The peak in the formation of bulges in massive galaxies at occurred at , with a first-wave population building half of their mass as early as 0.9 Gyr after the Big Bang () and a second wave peaking 3.8 Gyr later (). In contrast, the disks in these galaxies typically formed at . The bulges formed in a first wave at earlier cosmic times took longer (5.2 Gyr) to grow a disk than the bulges in the second wave (which took 0.7 Gyr), many of the latter still showing significant star formation activity in their disks.
There are a few disks () that started to assemble as early as first-wave bulges (), but they grow on longer timescale ( Gyr) compared to bulges ( Myr). Similarly, second-wave disks also assemble on longer timescales, suggesting a higher degree of co-evolution between the bulge and disk components in galaxies at redshift compared to higher-redshift ones. The average rate of star formation for disks which develop around first-wave bulges could be times more intense than the one of disks around second-wave bulges.
Importantly, we find that not only galaxies grow in a downsizing fashion, but also each of their morphological components does: both older disks and older bulges are more massive than younger stellar structures. In addition, the oldest and most massive bulges and disks are also the most compact ones.
Accordingly with the latest results on the formation of nearby disk galaxies from Méndez-Abreu et al. (2021), we find that the mass of the bulge regulates the timing of the growth of the extended stellar disk. In particular, galaxies hosting the more compact (first-wave) bulges took longer to acquire their disks than galaxies containing second-wave bulges. But, we do not find distinct physical properties (e.g., mass, star formation timescale, mass surface density, and Sérsic index) for the disks in both types of galaxies. Thus, since disks consistently form at around first and second-wave bulges, we conclude the only way to distinguish the formation mechanisms of these galaxies is to disentangle the SFHs of their disks from the ones of bulges. Indeed, the mechanisms which drive the formation of massive disk galaxies left imprints on the observed properties of their first and second-wave bulges.
References
- Athanassoula (2005) Athanassoula, E. 2005, MNRAS, 358, 1477, doi: 10.1111/j.1365-2966.2005.08872.x
- Barro et al. (2013) Barro, G., Faber, S. M., Pérez-González, P. G., et al. 2013, ApJ, 765, 104, doi: 10.1088/0004-637X/765/2/104
- Barro et al. (2019) Barro, G., Pérez-González, P. G., Cava, A., et al. 2019, ApJS, 243, 22, doi: 10.3847/1538-4365/ab23f2
- Belli et al. (2019) Belli, S., Newman, A. B., & Ellis, R. S. 2019, ApJ, 874, 17, doi: 10.3847/1538-4357/ab07af
- Bournaud et al. (2007) Bournaud, F., Elmegreen, B. G., & Elmegreen, D. M. 2007, ApJ, 670, 237, doi: 10.1086/522077
- Brook et al. (2006) Brook, C. B., Kawata, D., Martel, H., Gibson, B. K., & Bailin, J. 2006, ApJ, 639, 126, doi: 10.1086/499154
- Bruce et al. (2014) Bruce, V. A., Dunlop, J. S., McLure, R. J., et al. 2014, MNRAS, 444, 1660, doi: 10.1093/mnras/stu1537
- Bruzual & Charlot (2003) Bruzual, G., & Charlot, S. 2003, MNRAS, 344, 1000, doi: 10.1046/j.1365-8711.2003.06897.x
- Buitrago et al. (2013) Buitrago, F., Trujillo, I., Conselice, C. J., & Häußler, B. 2013, MNRAS, 428, 1460, doi: 10.1093/mnras/sts124
- Calzetti et al. (2000) Calzetti, D., Armus, L., Bohlin, R. C., et al. 2000, ApJ, 533, 682, doi: 10.1086/308692
- Carnall et al. (2019) Carnall, A. C., McLure, R. J., Dunlop, J. S., et al. 2019, MNRAS, 490, 417, doi: 10.1093/mnras/stz2544
- Ceverino et al. (2015) Ceverino, D., Dekel, A., Tweed, D., & Primack, J. 2015, MNRAS, 447, 3291, doi: 10.1093/mnras/stu2694
- Ceverino et al. (2018) Ceverino, D., Klessen, R. S., & Glover, S. C. O. 2018, MNRAS, 480, 4842, doi: 10.1093/mnras/sty2124
- Chabrier (2003) Chabrier, G. 2003, PASP, 115, 763, doi: 10.1086/376392
- Clauwens et al. (2018) Clauwens, B., Schaye, J., Franx, M., & Bower, R. G. 2018, MNRAS, 478, 3994, doi: 10.1093/mnras/sty1229
- Cole et al. (2000) Cole, S., Lacey, C. G., Baugh, C. M., & Frenk, C. S. 2000, MNRAS, 319, 168, doi: 10.1046/j.1365-8711.2000.03879.x
- Costantin et al. (2018a) Costantin, L., Corsini, E. M., Méndez-Abreu, J., et al. 2018a, MNRAS, 481, 3623, doi: 10.1093/mnras/sty1754
- Costantin et al. (2018b) Costantin, L., Méndez-Abreu, J., Corsini, E. M., et al. 2018b, A&A, 609, A132, doi: 10.1051/0004-6361/201731823
- Costantin et al. (2017) —. 2017, A&A, 601, A84, doi: 10.1051/0004-6361/201630302
- Costantin et al. (2020) —. 2020, ApJ, 889, L3, doi: 10.3847/2041-8213/ab6459
- Costantin et al. (2021) Costantin, L., Pérez-González, P. G., Méndez-Abreu, J., et al. 2021, ApJ, 913, 125, doi: 10.3847/1538-4357/abef72
- Crain et al. (2015) Crain, R. A., Schaye, J., Bower, R. G., et al. 2015, MNRAS, 450, 1937, doi: 10.1093/mnras/stv725
- Dalcanton et al. (1997) Dalcanton, J. J., Spergel, D. N., & Summers, F. J. 1997, ApJ, 482, 659, doi: 10.1086/304182
- Damjanov et al. (2009) Damjanov, I., McCarthy, P. J., Abraham, R. G., et al. 2009, ApJ, 695, 101, doi: 10.1088/0004-637X/695/1/101
- de la Rosa et al. (2016) de la Rosa, I. G., La Barbera, F., Ferreras, I., et al. 2016, MNRAS, 457, 1916, doi: 10.1093/mnras/stw130
- de Lorenzo-Cáceres et al. (2019a) de Lorenzo-Cáceres, A., Méndez-Abreu, J., Thorne, B., & Costantin, L. 2019a, MNRAS, 484, 665, doi: 10.1093/mnras/sty3520
- de Lorenzo-Cáceres et al. (2019b) de Lorenzo-Cáceres, A., Sánchez-Blázquez, P., Méndez-Abreu, J., et al. 2019b, MNRAS, 484, 5296, doi: 10.1093/mnras/stz221
- Dekel & Burkert (2014) Dekel, A., & Burkert, A. 2014, MNRAS, 438, 1870, doi: 10.1093/mnras/stt2331
- Dekel et al. (2009) Dekel, A., Sari, R., & Ceverino, D. 2009, ApJ, 703, 785, doi: 10.1088/0004-637X/703/1/785
- Dekel et al. (2020) Dekel, A., Lapiner, S., Ginzburg, O., et al. 2020, MNRAS, 496, 5372, doi: 10.1093/mnras/staa1713
- Dimauro et al. (2018) Dimauro, P., Huertas-Company, M., Daddi, E., et al. 2018, MNRAS, 478, 5410, doi: 10.1093/mnras/sty1379
- Domínguez-Palmero & Balcells (2008) Domínguez-Palmero, L., & Balcells, M. 2008, A&A, 489, 1003, doi: 10.1051/0004-6361:200809407
- Domínguez-Palmero & Balcells (2009) —. 2009, ApJ, 694, L69, doi: 10.1088/0004-637X/694/1/L69
- Domínguez Sánchez et al. (2016) Domínguez Sánchez, H., Pérez-González, P. G., Esquej, P., et al. 2016, MNRAS, 457, 3743, doi: 10.1093/mnras/stw201
- Dubois et al. (2021) Dubois, Y., Beckmann, R., Bournaud, F., et al. 2021, A&A, 651, A109, doi: 10.1051/0004-6361/202039429
- Eggen et al. (1962) Eggen, O. J., Lynden-Bell, D., & Sandage, A. R. 1962, ApJ, 136, 748, doi: 10.1086/147433
- El-Badry et al. (2018) El-Badry, K., Quataert, E., Wetzel, A., et al. 2018, MNRAS, 473, 1930, doi: 10.1093/mnras/stx2482
- Estrada-Carpenter et al. (2019) Estrada-Carpenter, V., Papovich, C., Momcheva, I., et al. 2019, ApJ, 870, 133, doi: 10.3847/1538-4357/aaf22e
- Estrada-Carpenter et al. (2020) —. 2020, ApJ, 898, 171, doi: 10.3847/1538-4357/aba004
- Fall & Efstathiou (1980) Fall, S. M., & Efstathiou, G. 1980, MNRAS, 193, 189, doi: 10.1093/mnras/193.2.189
- Freeman (1970) Freeman, K. C. 1970, ApJ, 160, 811
- Gadotti et al. (2020) Gadotti, D. A., Bittner, A., Falcón-Barroso, J., et al. 2020, A&A, 643, A14, doi: 10.1051/0004-6361/202038448
- Gao et al. (2020) Gao, H., Ho, L. C., Barth, A. J., & Li, Z.-Y. 2020, ApJS, 247, 20, doi: 10.3847/1538-4365/ab67b2
- Graham (2013) Graham, A. W. 2013, Planets, Stars and Stellar Systems, 91–139, doi: 10.1007/978-94-007-5609-0_2
- Graham & Driver (2005) Graham, A. W., & Driver, S. P. 2005, PASA, 22, 118, doi: 10.1071/AS05001
- Grogin et al. (2011) Grogin, N. A., Kocevski, D. D., Faber, S. M., et al. 2011, ApJS, 197, 35, doi: 10.1088/0067-0049/197/2/35
- Heavens et al. (2004) Heavens, A., Panter, B., Jimenez, R., & Dunlop, J. 2004, Nature, 428, 625, doi: 10.1038/nature02474
- Hopkins et al. (2009a) Hopkins, P. F., Cox, T. J., Younger, J. D., & Hernquist, L. 2009a, ApJ, 691, 1168, doi: 10.1088/0004-637X/691/2/1168
- Hopkins et al. (2014) Hopkins, P. F., Kereš, D., Oñorbe, J., et al. 2014, MNRAS, 445, 581, doi: 10.1093/mnras/stu1738
- Hopkins et al. (2009b) Hopkins, P. F., Somerville, R. S., Cox, T. J., et al. 2009b, MNRAS, 397, 802, doi: 10.1111/j.1365-2966.2009.14983.x
- Hsu et al. (2019) Hsu, L.-T., Lin, L., Dickinson, M., et al. 2019, ApJ, 871, 233, doi: 10.3847/1538-4357/aaf9a7
- Huang et al. (2013a) Huang, S., Ho, L. C., Peng, C. Y., Li, Z.-Y., & Barth, A. J. 2013a, ApJ, 766, 47, doi: 10.1088/0004-637X/766/1/47
- Huang et al. (2013b) —. 2013b, ApJ, 768, L28, doi: 10.1088/2041-8205/768/2/L28
- Hubble (1926) Hubble, E. P. 1926, ApJ, 64, doi: 10.1086/143018
- Koekemoer et al. (2011) Koekemoer, A. M., Faber, S. M., Ferguson, H. C., et al. 2011, ApJS, 197, 36, doi: 10.1088/0067-0049/197/2/36
- Kormendy (2016) Kormendy, J. 2016, Astrophysics and Space Science Library, Vol. 418, Elliptical Galaxies and Bulges of Disc Galaxies: Summary of Progress and Outstanding Issues, ed. E. Laurikainen, R. Peletier, & D. Gadotti, 431, doi: 10.1007/978-3-319-19378-6_16
- Kormendy & Kennicutt (2004) Kormendy, J., & Kennicutt, Robert C., J. 2004, ARA&A, 42, 603, doi: 10.1146/annurev.astro.42.053102.134024
- Larson (1976) Larson, R. B. 1976, MNRAS, 176, 31, doi: 10.1093/mnras/176.1.31
- Lilly et al. (1996) Lilly, S. J., Le Fevre, O., Hammer, F., & Crampton, D. 1996, ApJ, 460, L1, doi: 10.1086/309975
- Madau & Dickinson (2014) Madau, P., & Dickinson, M. 2014, ARA&A, 52, 415, doi: 10.1146/annurev-astro-081811-125615
- Madau et al. (1996) Madau, P., Ferguson, H. C., Dickinson, M. E., et al. 1996, MNRAS, 283, 1388, doi: 10.1093/mnras/283.4.1388
- Mancini et al. (2019) Mancini, C., Daddi, E., Juneau, S., et al. 2019, MNRAS, 489, 1265, doi: 10.1093/mnras/stz2130
- Margalef-Bentabol et al. (2016) Margalef-Bentabol, B., Conselice, C. J., Mortlock, A., et al. 2016, MNRAS, 461, 2728, doi: 10.1093/mnras/stw1451
- Margalef-Bentabol et al. (2018) —. 2018, MNRAS, 473, 5370, doi: 10.1093/mnras/stx2633
- Méndez-Abreu et al. (2008) Méndez-Abreu, J., Aguerri, J. A. L., Corsini, E. M., & Simonneau, E. 2008, A&A, 478, 353, doi: 10.1051/0004-6361:20078089
- Méndez-Abreu et al. (2021) Méndez-Abreu, J., de Lorenzo-Cáceres, A., & Sánchez, S. F. 2021, MNRAS, 504, 3058, doi: 10.1093/mnras/stab1064
- Méndez-Abreu et al. (2014) Méndez-Abreu, J., Debattista, V. P., Corsini, E. M., & Aguerri, J. A. L. 2014, A&A, 572, A25, doi: 10.1051/0004-6361/201423955
- Méndez-Abreu et al. (2019a) Méndez-Abreu, J., Sánchez, S. F., & de Lorenzo-Cáceres, A. 2019a, MNRAS, 484, 4298, doi: 10.1093/mnras/stz276
- Méndez-Abreu et al. (2019b) —. 2019b, MNRAS, 488, L80, doi: 10.1093/mnrasl/slz103
- Méndez-Abreu et al. (2010) Méndez-Abreu, J., Simonneau, E., Aguerri, J. A. L., & Corsini, E. M. 2010, A&A, 521, A71, doi: 10.1051/0004-6361/201014130
- Mo et al. (1998) Mo, H. J., Mao, S., & White, S. D. M. 1998, MNRAS, 295, 319, doi: 10.1046/j.1365-8711.1998.01227.x
- Morelli et al. (2015) Morelli, L., Corsini, E. M., Pizzella, A., et al. 2015, MNRAS, 452, 1128, doi: 10.1093/mnras/stv1357
- Morelli et al. (2016) Morelli, L., Parmiggiani, M., Corsini, E. M., et al. 2016, MNRAS, 463, 4396, doi: 10.1093/mnras/stw2285
- Morishita et al. (2019) Morishita, T., Abramson, L. E., Treu, T., et al. 2019, ApJ, 877, 141, doi: 10.3847/1538-4357/ab1d53
- Naab et al. (2009) Naab, T., Johansson, P. H., & Ostriker, J. P. 2009, ApJ, 699, L178, doi: 10.1088/0004-637X/699/2/L178
- Nelson et al. (2018) Nelson, D., Pillepich, A., Springel, V., et al. 2018, MNRAS, 475, 624, doi: 10.1093/mnras/stx3040
- Noguchi (1999) Noguchi, M. 1999, ApJ, 514, 77, doi: 10.1086/306932
- Oser et al. (2010) Oser, L., Ostriker, J. P., Naab, T., Johansson, P. H., & Burkert, A. 2010, ApJ, 725, 2312, doi: 10.1088/0004-637X/725/2/2312
- Park et al. (2019) Park, M.-J., Yi, S. K., Dubois, Y., et al. 2019, ApJ, 883, 25, doi: 10.3847/1538-4357/ab3afe
- Patel et al. (2013) Patel, S. G., van Dokkum, P. G., Franx, M., et al. 2013, ApJ, 766, 15, doi: 10.1088/0004-637X/766/1/15
- Pérez-González et al. (2003) Pérez-González, P. G., Gil de Paz, A., Zamorano, J., et al. 2003, MNRAS, 338, 525, doi: 10.1046/j.1365-8711.2003.06078.x
- Pérez-González et al. (2008) Pérez-González, P. G., Rieke, G. H., Villar, V., et al. 2008, ApJ, 675, 234, doi: 10.1086/523690
- Pérez-González et al. (2013) Pérez-González, P. G., Cava, A., Barro, G., et al. 2013, ApJ, 762, 46, doi: 10.1088/0004-637X/762/1/46
- Pfeffer et al. (2022) Pfeffer, J., Bekki, K., Couch, W. J., Koribalski, B. S., & Forbes, D. A. 2022, arXiv e-prints, arXiv:2201.03137
- Pillepich et al. (2018) Pillepich, A., Nelson, D., Hernquist, L., et al. 2018, MNRAS, 475, 648, doi: 10.1093/mnras/stx3112
- Sánchez et al. (2012) Sánchez, S. F., Kennicutt, R. C., Gil de Paz, A., et al. 2012, A&A, 538, A8, doi: 10.1051/0004-6361/201117353
- Schaye et al. (2015) Schaye, J., Crain, R. A., Bower, R. G., et al. 2015, MNRAS, 446, 521, doi: 10.1093/mnras/stu2058
- Sérsic (1968) Sérsic, J. L. 1968, Atlas de Galaxias Australes (Observatorio Astronomico de Cordoba, Cordoba)
- Steinmetz & Navarro (2002) Steinmetz, M., & Navarro, J. F. 2002, New A, 7, 155, doi: 10.1016/S1384-1076(02)00102-1
- Suess et al. (2021) Suess, K. A., Kriek, M., Price, S. H., & Barro, G. 2021, ApJ, 915, 87, doi: 10.3847/1538-4357/abf1e4
- Tacchella et al. (2019) Tacchella, S., Diemer, B., Hernquist, L., et al. 2019, MNRAS, 487, 5416, doi: 10.1093/mnras/stz1657
- Tacchella et al. (2021) Tacchella, S., Conroy, C., Faber, S. M., et al. 2021, arXiv e-prints, arXiv:2102.12494
- van Dokkum et al. (2010) van Dokkum, P. G., Whitaker, K. E., Brammer, G., et al. 2010, ApJ, 709, 1018, doi: 10.1088/0004-637X/709/2/1018
- Williams et al. (2010) Williams, R. J., Quadri, R. F., Franx, M., et al. 2010, ApJ, 713, 738, doi: 10.1088/0004-637X/713/2/738
- Zolotov et al. (2015) Zolotov, A., Dekel, A., Mandelker, N., et al. 2015, MNRAS, 450, 2327, doi: 10.1093/mnras/stv740
Appendix A Mass-weighted Ages
In this Section we directly compare the age distributions of each bulge and disk, explicitly showing what we claimed in Sects. 3.1 and 3.2: on average bulges are older than disks (Fig. 11). Bulges have median mass-weighted ages Gyr, while disks present Gyr. This means that, on average, spheroidal galaxies take Gyr in acquiring a stellar disk (see Sect. 3.3.2). In Paper I we found that 48% of our bulges have Gyr. In contrast, only 14% of disks have Gyr. 7% of bulges and 23% of disks present significant ongoing star formation and/or assembly activity ( Myr) at the redshift of observation.
We find that first-wave bulges have Gyr while the disks around them present median Gyr. On the other hand, second-wave bulges have median Gyr while the disks around them are Gyr old.