Evolution of lattice, spin, and charge properties across the phase diagram of
Abstract
A Raman scattering study covering the entire substitution range of the solid solution is presented. Data were taken as a function of sulfur concentration for , of temperature and of scattering symmetry. All type of excitations including phonons, spins and charges are analyzed in detail. It is observed that the energy and width of iron-related phonon mode vary continuously across the entire range of sulfur substitution. The chalcogenide mode disappears above and reappears at a much higher energy for . In a similar way the spectral features appearing at finite doping in symmetry vary discontinuously. The magnetic excitation centered at approximately 500 disappears above where the lattice excitations exhibit a discontinuous change in energy. The low-energy mode associated with fluctuations displays maximal intensity at the nemato-structural transition and thus tracks the phase boundary.
pacs:
74.70.Xa, 74.25.nd 75.25.DkI Introduction
Iron-based compounds are widely believed to host unconventional superconductivity, thus being similar to cuprates or heavy Fermion systems. All are characterized by competing phases including magnetism, crystal symmetry breaking or nematicity and fluctuations of charge and spin prior to superconductivity [1, 2, 3]. While long range magnetic ordering was found in the majority of the compounds, it is absent in the binary compound FeSe. Yet a nematic and structural phase transition occurs simultaneously at 90 K [4, 5, 6]. Below K superconductivity is observed [7]. Upon applied pressure increases to approximately 37 K [8]. By substituting sulfur for selenium, the transition temperature to the nematic phase is suppressed to zero for [9], suggesting the existence of a quantum critical point (QCP), and a depression of to approximately 2 K. For , increases again and reaches 5 K at [10]. Surprisingly enough, FeS displays a metallic variation of the resisitivity and a high residual resistivity ratio RRR of approximately 30, and neither structural nor nematic phase transitions occur [11]. Thus, uniquely offers access to instabilities and critical points and the disappearance thereof while superconductivity survives.
FeSe and FeS are iso-structural, thus providing us with the opportunity to probe the evolution of competing order by iso-electronic substitution. We wish to address the question as to which extent the properties and specifically superconductivity are interrelated with the other instabilities and how the electronic properties affect the phonons. We employ inelastic light scattering to probe evolution with composition of lattice spin and charge excitations in [12]. We identify the and modes, a two-phonon scattering process as well as additional modes that can be traced to either defect-induced or second-order scattering. The obtained experimental results are in good agreement with numerical calculations. Phonons self-energy temperature dependence supports the results reported in Refs. 13, 14 where emerging short range magnetic order at approximately K was reported.
II Experiment
Single crystals of were synthesized as described elsewhere.[15] Up to the samples were prepared by vapor transport. For only the hydrothermal method yields homogeneous single crystals. Before the experiment the samples were cleaved in air.
Inelastic light scattering on phonons was performed using a Tri Vista 557 Raman spectrometer with the first two monochromators coupled subtractively and the grating combination 1800/1800/2400 grooves/mm. For excitation a Coherent Verdi G solid state laser was used emitting at 532 nm. The samples were mounted in a KONTI CryoVac continuous helium flow cryostat having a 0.5 mm thick window. The vacuum was pumped to the range of mbar using a turbo molecular pump. The laser was focused to a spot size of approximately using a microscope objective lens with 50 magnification. In this back-scattering configuration the plane of incidence coincides with crystallographic -axis. All Raman spectra were corrected for the Bose factor.
Fluctuations and two magnon excitations were probed with a calibrated scanning spectrometer. The samples were attached to the cold finger of a He-flow cryostat having a vacuum of better than mbar. A diode-pumped solid state laser emitting at 575 nm (Coherent GENESIS) was used as an excitation source. The laser beam was focused on the sample at an angle of incidence of 66∘. Polarization and power of the incoming light were adjusted in a way that the light inside the sample had the proper polarization state and a power of mW independent of polarization. All four symmetries of the D4h group, , , , and , can be accessed using appropriate in-plane polarizations of the incident and scattered light.
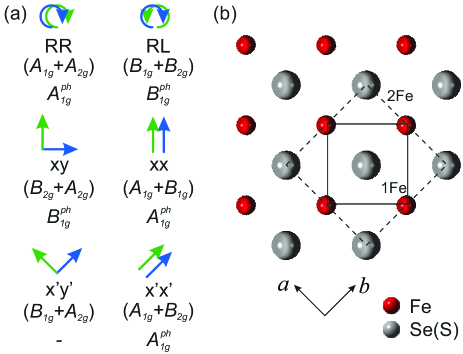
The selection rules are dictated by the crystal structure. Here, only polarizations in the plain are relevant, as shown in in Fig. 1, with solid and dashed lines representing 1 Fe and 2 Fe unit cells, respectively. For the tetragonal system there are six principal scattering geometries, each of which probing two symmetry channels. We align our laboratory system with the 1 Fe unit cell. As a consequence, the phonon () is observable in configuration which corresponds to the symmetry channel in the 2 Fe cell [Fig. 1]. We decided to use this orientation since our main focus here are electronic and spin excitations for which the 1 Fe unit cell is more appropriate. is the fully symmetric in-phase Se(S) mode with elongations along the -axis, corresponds to the out-of-phase vibration of the Fe atoms parallel to the -axis.
III Results and Discussion
III.1 Lattice excitations
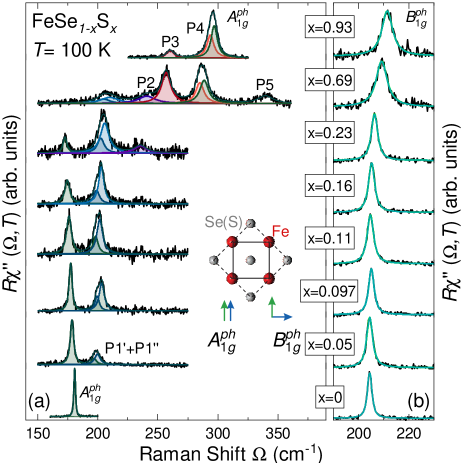
First, the focus is placed on lattice excitations observable in the and scattering configuration projecting and in the spectral range characteristic for phonons. Fig. 2 shows the evolution of the spectra with doping , where indicates the sulfur concentration. Additional spectra for and, for convenience, are shown in Fig. A2. In order to minimize the thermal broadening of the modes while staying above the nematic phase transition, the spectra were recorded at 100 K. In pure stoichiometric compounds only one and one phonon mode is expected (see Fig. 1). This is indeed the case for FeSe [Fig. 2(a) bottom] as described by Gnezdilov et al. [16] and corroborated here. In contrast, in pure FeS () additional modes exist in the spectrum which were assigned to two-phonon scattering (265 ) and a projection of the phonon density of states (PDOS) (300 ) [17] as reproduced in Fig. A2 (b). The spectra show only the mode for all doping levels displayed here (see also Fig. A2(a)). It hardens monotonously and exhibits a weak maximum of the linewidth at and highlighting the effect of disorder as summarized in Fig. 3 (a) and (b).
The spectra display a much more complex doping dependence. Upon substituting only a small amount of sulfur () for selenium an additional structure appears at about 200 [Fig. 2 (a)]. Closer inspection of the FeSe0.95S0.05 spectra reveals that this feature consists of two peaks denoted as P and P. With increasing , these structures gain intensity and harden slightly, whereas the phonon softens, gradually loses intensity, and becomes undetectable at concentrations above . It reappears as a clear peak only for at a much higher energy characteristic for FeS [17] and possibly as a remnant structure in the spectrum for [Fig. A2 (a)]. As in FeS the peak overlaps with a weaker structure which is compatible with the PDOS (P4). At P4 is approximately as strong as the phonon. Here (and at , Fig. A2(a)) there is also a broad feature at 340 (P5). For similar to there is another structure at 250 (P3) which gains intensity toward where it has a weak companion at 235 (P2) being present down to . As expected, the increase of crystalline disorder due to substitution leads to a broadening of all observed modes to some maximum value before the trend reverses for compositions close to pure FeS. The widths and energies of the stronger modes are summarized in Fig. 3. As opposed to the phonon in configuration all modes in polarization including the Raman-active phonon depend quasi-discontinuously on substitution.
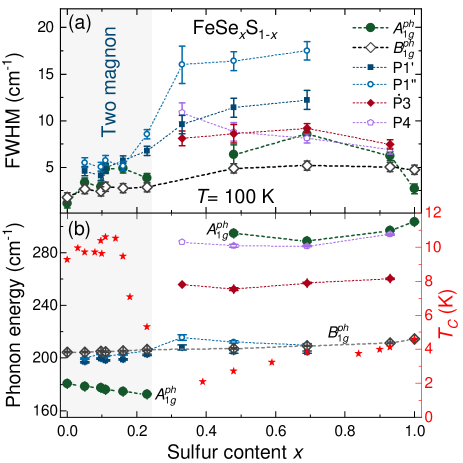
This dichotomy of the substitution dependence of the phonon part in and configuration is the most remarkable effect of this study. Whereas the continuous evolution of the Fe line by and large tracks the degree of disorder and lattice contraction the Se/S mode varies counter-intuitively. Naively one would expect a continuous (not necessarily trivial) increase of the phonon frequency and maximal broadening for doping levels around similar to what is observed in isotopically substituted semiconductors [19]. However, the line disappears after a continuous loss of intensity at approximately and 172 and reappears (presumably) at slightly below 300 . At low doping the energy decreases by 4% although S is lighter than Se by a factor of 2.13 and the lattice contracts. Above the energy of the phonon varies as expected [see Fig. 3(b)].
The structures appearing in addition to the allowed phonons are rather difficult to interpret in detail. There are essentially two possibilities for intensity to appear in addition to the phonons: defect-induced scattering projecting the PDOS on the site of the defect or overtone (combination) scattering [20]. In FeS one of the peaks (P3) lies in the gap between the acoustic and the optical branches and was therefore assigned to an overtone whereas P4 may originate from the PDOS [17]. The two features depend in the same fashion on doping as the phonon, and the assignment may be maintained. This is plausible on the basis of the PDOS [Fig. A1] although the PDOS of a solid solution cannot be calculated straightforwardly. If we argue that the extra lines vary as discontinuously as the phonon, P1′ and P1′′ would have both an overtone and a PDOS component. Interestingly, P1′ and P1′′ have the expected doping dependence [see Fig. 3(b)]
The anomalous doping dependence of the phonon may indicate an enhanced electron-phonon coupling which manifests itself also in the linewidth (on top of the inhomogeneous broadening) [Fig. 3(a)]. The slightly enhanced electron-phonon coupling may boost a little bit until the structure becomes unstable and decreases rapidly for . There is in fact a kink in the ratio at which may be related to the structural instability [18]. In a recent preprint the collapse of is almost precipitous and coincides with the end of the nematic phase [21] and one may speculate about the position of the quantum critical point and its impact. Yet, further work is necessary to finally clarify the issue.
III.2 Spin excitations and fluctuations
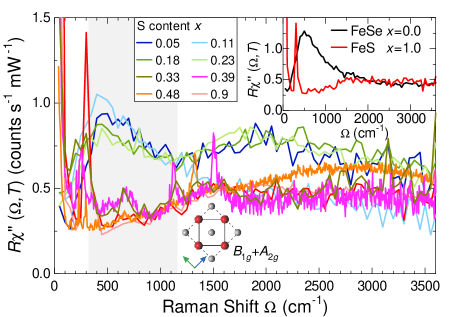
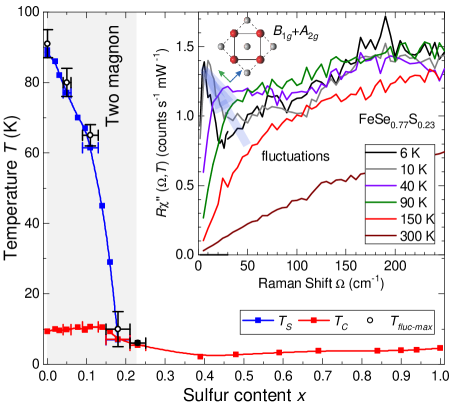
Second, we focus on the electronic symmetry channel projected in (1 Fe) configuration. Fig. 4 shows the doping dependence of the high energy Raman spectra at approximately 4 K. The contribution can be neglected in these materials [22]. A broad excitation centered at about 500 dominates the spectrum at which was interpreted in terms of two magnon scattering [22]. Since the ratio of the nearest to the next-nearest-neighbor exchange coupling and is close to 0.5 [24] the system is a nearly frustrated antiferromagnet. Consequently the two-magnon Raman peak is pushed to energies well below [23]. No comparable feature is observed in FeS (see inset Fig. 4).
Upon doping, the two-magnon peak remains relatively robust up to and is absent for higher doping levels. This goes in line with the fact that for , the Fermi velocity in the band, , is significantly smaller than or and increases by only 10% for . For increases significantly towards FeS [25]. Generally, in FeSe is smaller than in for instance [26] in agreement with theoretical predictions [27, 28, 29]. Thus FeSe is close to the localization limit, and the two-magnon-like response may result from the rather slow carriers on the band. In contrast, the more itinerant carriers in the pnictides condense into a stripe-like spin density wave (SDW) which becomes manifest in a gap and a coherence peak [30, 22].
In the energy region extra intensity is observed for low temperatures. In FeSe it becomes clearly visible below 200 K and fills the spectral gap below the magnon at 500 . Below approximately 100 K an isolated peak may be observed for which continuously softens above the structural transformation at K, fades away below , and almost vanishes at 21 K [22, 31]. The line shape and the temperature dependence above can be described quantitatively in terms of critical fluctuations in a similar fashion as in [30, 32, 22]. For increasing doping, this extra intensity starts to develop at lower temperatures. However, remarkably enough the temperature where this peak’s intensity is maximal, , always coincides with the respective transition temperature . At the fluctuation response gains intensity down to the lowest accessible temperatures as presented in the inset of Fig. 5. Thus, the phase transition line of the nematic phase can also be tracked by the Raman response. For (the next available doping level) the fluctuation response cannot be observed any further. Concomitantly, the two-magnon excitation at 500 becomes unobservable. The most likely explanation of this coincidence is that the two phenomena have the same origin and result from spin excitations. However, there is no consensus on that view in the literature, and Zhang et al. [33] and Chibani et al. [34] interpret the same experimental observation in terms of quadrupolar charge fluctuations. Yet, one certainly has to answer the question as to why the fluctuations are not found in the simulations [23].
Most probably, the length scale the simulations can deal with limits the applicability of the Exact Diagonalization method. Since it was intended to study the temperature dependence the cluster had to be sufficiently small () to keep the time for the simulations finite [23]. For the two-magnon excitations, the cluster is sufficient because only nearest neighbor spins are important. However, close to the transition the correlation length of fluctuations diverges making them inaccessible for the small clusters tractable numerically. Actually, well above the transition there is a shoulder on the low-energy side of the two-magnon peak which may be associated with the fluctuations but the shoulder is lost close to . Thus, although there are experimental arguments in favor of spin fluctuations at low energy there is no theoretical support for this conjecture.
The last question we wish to address concerns the origin of possible local or quasi-local spin order in for . It was observed a while ago that the width of the various bands derived from the orbitals close to the Fermi surface varies by approximately a factor of three or more. There are itinerant and bands crossing the Fermi surface at and a weakly dispersing band just below [26] on which the nearly localized spins may reside [27, 29]. It is an important question to which extent the fluctuations at low energy are related to these spins. As a matter of fact, Ba122 displays itinerant SDW magnetism as manifested by a gap and a coherence peak along with fluctuations [30, 22] whereas FeSe exhibits signatures of local spins and also fluctuations at low energies as shown here. In both phenomena disappear together above .
IV Conclusion
Raman results covering the entire substitution range in were presented. The main goal was the study of the physics around the QCP where the nematic instability approached zero transition temperature in the range . We find a striking signature of this transition in both the phonon and the electronic spectra. Whereas the phonon varies continuously with S substitution the phonon and all structures in the spectra show a discontinuity above . Similarly, the electronic spectra dominated by spin excitations change abruptly here. Both the two-magnon excitations and the low-energy fluctuations disappear. We argue that they are interrelated. Since we could not observe gap excitation for , statements about the evolution of the superconducting pairing are currently not possible. Another issue is the exact position of the quantum critical transition and its sharpness.
Acknowledgement
We acknowledge valuable discussions with T. Böhm and D. Jost. The authors acknowledge funding provided by the Institute of Physics Belgrade through the grant by the Ministry of Education, Science and Technological Development of the Republic of Serbia and and SASA project No. F-134. The work was supported by the Science Fund of the Republic of Serbia, PROMIS, No. 6062656, StrainedFeSC, and by Research Foundation-Flanders (FWO). Further support came from the German research foundation (DFG) via projects Ha2071/8-1, Ha2071/12-1 and 107745057 – TRR 80 and from the DAAD via the project-related personal exchange program PPP with Serbia grant-no. 57449106. J.B. acknowledges support of a postdoctoral fellowship of the FWO, and of the Erasmus+ program for staff mobility and training (KA107, 2018) for a research stay at the Institute of Physics Belgrade, during which part of the work was carried out. The computational resources and services used for the first-principles calculations in this work were provided by the VSC (Flemish Supercomputer Center), funded by the FWO and the Flemish Government – department EWI. Work at Brookhaven is supported by the U.S. DOE under Contract No. DESC0012704.
References
- Scalapino [2012] D. J. Scalapino, A common thread: The pairing interaction for unconventional superconductors, Rev. Mod. Phys. 84, 1383 (2012).
- Fradkin et al. [2015] E. Fradkin, S. A. Kivelson, and J. M. Tranquada, Colloquium: Theory of intertwined orders in high temperature superconductors, Rev. Mod. Phys. 87, 457 (2015).
- Lederer et al. [2015] S. Lederer, Y. Schattner, E. Berg, and S. A. Kivelson, Enhancement of superconductivity near a nematic quantum critical point, Phys. Rev. Lett. 114, 097001 (2015).
- Böhmer et al. [2015] A. E. Böhmer, T. Arai, F. Hardy, T. Hattori, T. Iye, T. Wolf, H. v. Löhneysen, K. Ishida, and C. Meingast, Origin of the Tetragonal-to-Orthorhombic Phase Transition in FeSe: A Combined Thermodynamic and NMR Study of Nematicity, Phys. Rev. Lett. 114, 027001 (2015).
- McQueen et al. [2009] T. M. McQueen, A. J. Williams, P. W. Stephens, J. Tao, Y. Zhu, V. Ksenofontov, F. Casper, C. Felser, and R. J. Cava, Tetragonal-to-Orthorhombic Structural Phase Transition at 90 K in the Superconductor Fe1.01Se, Phys. Rev. Lett. 103, 057002 (2009).
- Watson et al. [2015] M. D. Watson, T. K. Kim, A. A. Haghighirad, N. R. Davies, A. McCollam, A. Narayanan, S. F. Blake, Y. L. Chen, S. Ghannadzadeh, A. J. Schofield, M. Hoesch, C. Meingast, T. Wolf, and A. I. Coldea, Emergence of the nematic electronic state in FeSe, Phys. Rev. B 91, 155106 (2015).
- Hsu et al. [2008] F.-C. Hsu, J.-Y. Luo, K.-W. Yeh, T.-K. Chen, T.-W. Huang, P. M. Wu, Y.-C. Lee, Y.-L. Huang, Y.-Y. Chu, D.-C. Yan, and M.-K. Wu, Superconductivity in the PbO-type structure -FeSe, Proc. Natl. Acad. Sci. 105, 14262 (2008).
- Medvedev et al. [2009] S. Medvedev, T. M. McQueen, I. A. Troyan, T. Palasyuk, M. I. Eremets, R. J. Cava, S. Naghavi, F. Casper, V. Ksenofontov, G. Wortmann, and C. Felser, Electronic and magnetic phase diagram of -Fe1.01Se with superconductivity at 36.7K under pressure, Nat. Mater. 8, 630 (2009).
- Sato et al. [2018] Y. Sato, S. Kasahara, T. Taniguchi, X. Xing, Y. Kasahara, Y. Tokiwa, Y. Yamakawa, H. Kontani, T. Shibauchi, and Y. Matsuda, Abrupt change of the superconducting gap structure at the nematic critical point in FeSe1-xSx, Proceedings of the National Academy of Sciences 115, 1227 (2018).
- Lai et al. [2015] X. Lai, H. Zhang, Y. Wang, X. Wang, X. Zhang, J. Lin, and F. Huang, Observation of Superconductivity in Tetragonal FeS, J. Am. Chem. Soc. 137, 10148 (2015).
- Pachmayr et al. [2016] U. Pachmayr, N. Fehn, and D. Johrendt, Structural transition and superconductivity in hydrothermally synthesized Fe ( = S, Se), Chem. Commun. 52, 194 (2016).
- Lazarević and Hackl [2020] N. Lazarević and R. Hackl, Fluctuations and pairing in Fe-based superconductors: light scattering experiments, Journal of Physics: Condensed Matter 32, 413001 (2020).
- Holenstein et al. [2016] S. Holenstein, U. Pachmayr, Z. Guguchia, S. Kamusella, R. Khasanov, A. Amato, C. Baines, H.-H. Klauss, E. Morenzoni, D. Johrendt, and H. Luetkens, Coexistence of low-moment magnetism and superconductivity in tetragonal FeS and suppression of Tc under pressure, Phys. Rev. B 93, 140506 (2016).
- Kirschner et al. [2016] F. K. K. Kirschner, F. Lang, C. V. Topping, P. J. Baker, F. L. Pratt, S. E. Wright, D. N. Woodruff, S. J. Clarke, and S. J. Blundell, Robustness of superconductivity to competing magnetic phases in tetragonal FeS, Phys. Rev. B 94, 134509 (2016).
- Wang et al. [2016] A. Wang, L. Wu, V. N. Ivanovski, J. B. Warren, J. Tian, Y. Zhu, and C. Petrovic, Critical current density and vortex pinning in tetragonal FeS1-xSex (), Phys. Rev. B 94, 094506 (2016).
- Gnezdilov et al. [2013] V. Gnezdilov, Y. G. Pashkevich, P. Lemmens, D. Wulferding, T. Shevtsova, A. Gusev, D. Chareev, and A. Vasiliev, Interplay between lattice and spin states degree of freedom in the FeSe superconductor: Dynamic spin state instabilities, Phys. Rev. B 87, 144508 (2013).
- Baum et al. [2018] A. Baum, A. Milosavljević, N. Lazarević, M. M. Radonjić, B. Nikolić, M. Mitschek, Z. I. Maranloo, M. Šćepanović, M. Grujić-Brojčin, N. Stojilović, M. Opel, A. Wang, C. Petrovic, Z. V. Popović, and R. Hackl, Phonon anomalies in FeS, Phys. Rev. B 97, 054306 (2018).
- Wang et al. [2020] A. Wang, E. Stavitski, M. Naamneh, V. N. Ivanovski, M. Abeykoon, A. Milosavljevic, W. H. Brito, A. Baum, J. Jandke, Q. Du, N. Lazarevic, Y. Liu, N. C. Plumb, G. Kotliar, R. Hackl, Z. V. Popovic, M. Radovic, K. Attenkofer, and C. Petrovic, Superconducting Order from Local Disorder, arXiv e-prints , arXiv:2009.06623 (2020), arXiv:2009.06623 [cond-mat.supr-con] .
- Cardona and Thewalt [2005] M. Cardona and M. L. W. Thewalt, Isotope effects on the optical spectra of semiconductors, Rev. Mod. Phys. 77, 1173 (2005).
- Turrell [1972] G. Turrell, Infrared and Raman spectra of Crystals (Academic Press inc., London and New York, 1972).
- Mizukami et al. [2021] Y. Mizukami, M. Haze, O. Tanaka, K. Matsuura, D. Sano, J. Böker, I. Eremin, S. Kasahara, Y. Matsuda, and T. Shibauchi, Thermodynamics of transition to BCS-BEC crossover superconductivity in FeSe1-xSx, arXiv e-prints , arXiv:2009.06623 (2021), arXiv:2105.00739 [cond-mat.supr-con] .
- Baum et al. [2019] A. Baum, H. N. Ruiz, N. Lazarević, Y. Wang, T. Böhm, R. Hosseinian Ahangharnejhad, P. Adelmann, T. Wolf, Z. V. Popović, B. Moritz, T. P. Devereaux, and R. Hackl, Frustrated spin order and stripe fluctuations in FeSe, Commun. Phys. 2, 14 (2019).
- Ruiz et al. [2019] H. Ruiz, Y. Wang, B. Moritz, A. Baum, R. Hackl, and T. P. Devereaux, Frustrated magnetism from local moments in FeSe, Phys. Rev. B 99, 125130 (2019).
- Glasbrenner et al. [2015] J. K. Glasbrenner, I. I. Mazin, H. O. Jeschke, P. J. Hirschfeld, R. M. Fernandes, and R. Valentí, Effect of magnetic frustration on nematicity and superconductivity in iron chalcogenides, Nature Phys. 11, 953 (2015).
- Coldea [2021] A. I. Coldea, Electronic Nematic States Tuned by Isoelectronic Substitution in Bulk FeSe1-xSx, Frontiers in Physics 8, 528 (2021).
- Yi et al. [2015] M. Yi, Z.-K. Liu, Y. Zhang, R. Yu, J.-X. Zhu, J. Lee, R. Moore, F. Schmitt, W. Li, S. Riggs, J.-H. Chu, B. Lv, J. Hu, M. Hashimoto, S.-K. Mo, Z. Hussain, Z. Mao, C. Chu, I. Fisher, Q. Si, Z.-X. Shen, and D. Lu, Observation of universal strong orbital-dependent correlation effects in iron chalcogenides, Nature Commun. 6, 7777 (2015).
- Yin et al. [2011] Z. P. Yin, K. Haule, and G. Kotliar, Kinetic frustration and the nature of the magnetic and paramagnetic states in iron pnictides and iron chalcogenides, Nature Mater. 10, 932 (2011).
- Stadler et al. [2015] K. M. Stadler, Z. P. Yin, J. von Delft, G. Kotliar, and A. Weichselbaum, Dynamical mean-field theory plus numerical renormalization-group study of spin-orbital separation in a three-band hund metal, Phys. Rev. Lett. 115, 136401 (2015).
- Skornyakov et al. [2017] S. L. Skornyakov, V. I. Anisimov, D. Vollhardt, and I. Leonov, Effect of electron correlations on the electronic structure and phase stability of fese upon lattice expansion, Phys. Rev. B 96, 035137 (2017).
- Kretzschmar et al. [2016] F. Kretzschmar, T. Böhm, U. Karahasanović, B. Muschler, A. Baum, D. Jost, J. Schmalian, S. Caprara, M. Grilli, C. Di Castro, J. H. Analytis, J.-H. Chu, I. R. Fisher, and R. Hackl, Critical spin fluctuations and the origin of nematic order in , Nat. Physics 12, 560 (2016).
- Chibani et al. [2021a] S. Chibani, D. Farina, P. Massat, M. Cazayous, A. Sacuto, T. Urata, Y. Tanabe, K. Tanigaki, A. E. Böhmer, P. C. Canfield, et al., Lattice-shifted nematic quantum critical point in fese 1- x s x, npj Quantum Materials 6, 1 (2021a).
- Karahasanovic et al. [2015] U. Karahasanovic, F. Kretzschmar, T. Böhm, R. Hackl, I. Paul, Y. Gallais, and J. Schmalian, Manifestation of nematic degrees of freedom in the Raman response function of iron pnictides, Phys. Rev. B 92, 075134 (2015).
- Zhang et al. [2021] W. Zhang, S. Wu, S. Kasahara, T. Shibauchi, Y. Matsuda, and G. Blumberg, Quadrupolar charge dynamics in the nonmagnetic FeSe1-xSx superconductors, Proc. Nat. Acad. Sci. 118, 10.1073/pnas.2020585118 (2021).
- Chibani et al. [2021b] S. Chibani, D. Farina, P. Massat, M. Cazayous, A. Sacuto, T. Urata, Y. Tanabe, K. Tanigaki, A. E. Böhmer, P. C. Canfield, M. Merz, S. Karlsson, P. Strobel, P. Toulemonde, I. Paul, and Y. Gallais, Lattice-shifted nematic quantum critical point in FeSe1-xSx, npj Quantum Materials 6, 37 (2021b).
- Gonze et al. [2020] X. Gonze, B. Amadon, G. Antonius, F. Arnardi, L. Baguet, J.-M. Beuken, J. Bieder, F. Bottin, J. Bouchet, E. Bousquet, et al., The abinit project: Impact, environment and recent developments, Computer Physics Communications 248, 107042 (2020).
- Perdew et al. [2008] J. P. Perdew, A. Ruzsinszky, G. I. Csonka, O. A. Vydrov, G. E. Scuseria, L. A. Constantin, X. Zhou, and K. Burke, Restoring the density-gradient expansion for exchange in solids and surfaces, Phys. Rev. Lett. 100, 136406 (2008).
- Hamann [2013] D. R. Hamann, Optimized norm-conserving vanderbilt pseudopotentials, Phys. Rev. B 88, 085117 (2013).
- van Setten et al. [2018] M. van Setten, M. Giantomassi, E. Bousquet, M. Verstraete, D. Hamann, X. Gonze, and G.-M. Rignanese, The pseudodojo: Training and grading a 85 element optimized norm-conserving pseudopotential table, Computer Physics Communications 226, 39 (2018).
- Setyawan and Curtarolo [2010] W. Setyawan and S. Curtarolo, High-throughput electronic band structure calculations: Challenges and tools, Computational Materials Science 49, 299 (2010).
Appendix A Phonon dispersion and density of states
We have performed density functional theory (DFT) calculations as implemented in the ABINIT package [35]. We have used the Perdew-Burke-Ernzerhof functional tailored for solids (PBEsol) [36] and optimized norm-conserving pseudopotentials (ONCVPSP) [37, 38], where Fe-3s23p63d64s2, S-3s23p4 and Se-3d104s24p4 are treated as valence electrons. The energy cutoff for the planewave basis was set to 50 Ha. The lattice parameters and atomic positions used in the calculations were directly obtained from our X-ray diffraction measurements (performed at 300 K). Following previous first-principles studies on phonons in e.g. FeS [17], the crystal structures were not further relaxed, to achieve optimal characterization of the phonon frequencies. Here, both FeS and FeSe adopt the simple tetragonal space group P4/nmm (No. 129), where Fe occupies 2a and S/Se position 2c Wyckoff position. The latter comprises an additional degree of freedom, namely the height of the chalcogen atoms S and Se with respect to the Fe plane, denoted as . An overview of the lattice parameters that were used in the calculations is provided in Table AI.
| Compound | (Å) | (Å) | (units of ) |
|---|---|---|---|
| FeS | 3.6795 | 5.0321 | 0.2578 |
| FeSe | 3.7707 | 5.5202 | 0.2671 |
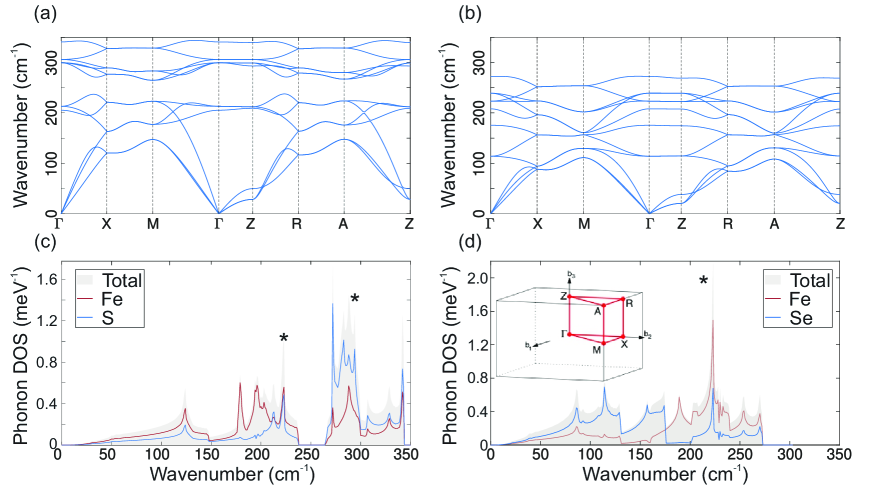
Subsequently, the phonon dispersions were obtained from density functional perturbation theory (DFPT) calculations, also within ABINIT. Here, we have used a k-point grid for the electron wave vectors and a q-point grid for the phonon wave vectors. For the electronic occupation we employed Fermi-Dirac smearing with broadening factor Ha.
The results of these calculations are shown in Fig A1. FeS is found to have phonon frequencies stretching up to 344 [FigA1 (a)], which is significantly higher than the maximum phonon value of 273 obtained for FeSe [Fig A1(b)], owing to the higher atomic mass of Se compared to S. The atom-resolved phonon densities of states (DOS) of both compounds reveal a mixture of iron and chalcogen contribution throughout the entire phonon spectrum [Fig. A1(c) and (d)]. Interestingly, there is a change of dominant phonon character, with the lower modes dominated by Fe in FeS, while the lower modes have predominant Se character in FeSe. This reversal can be understood from the fact that the atomic number of Fe () lies in between those of S () and Se (). These differences in atomic masses lead moreover to a small energy gap between Fe- and S-dominated modes in FeS (between 238 and 265 ), which is entirely absent in FeSe.
Appendix B FeSe0.52S0.48 and FeS
For convenience we show here additional doping levels in Fig A2. The spectrum for in panel (b) was already published elsewhere [17]. Note that for both and are projected and that the labels for the symmetry-forbidden peaks P3 and P4 are different from those in the earlier paper. [Fig A2 (a)] is in the middle between FeSe and FeS, and one can therefore expect the strongest contribution from defect-induced scattering. This interpretation is supported by the presence of structures in both configurations. All peaks resolved at in configuration are also observed here. In addition there are two lines marked by asterisks which appear only at . Since they appear also for we interpret them in terms of contributions from the PDOS as shown in Fig. A1 where the respective energies correspond to a high DOS of either FeSe or FeS. Structure P5 may be related to the high-energy part of FeS.
