Intrinsic structure perspective for MIPS interfaces in two dimensional systems of Active Brownian Particles
Abstract
Suspensions of Active Brownian Particles (ABP) undergo motility induced phase separation (MIPS) over a wide range of mean density and activity strength Stenhammar et al. (2014), which implies the spontaneous aggregation of particles due to the persistence of their direction of motion, even in the absence of an explicit attraction. Both similarities and qualitative differences have been obtained when the MIPS is analysed in the same terms as a liquid-gas phase coexistence in an equilibrium attractive system. Negative values of the mechanical surface tension have been reported, from the total forces across the interface, while the stable fluctuations of the interfacial line would be interpreted as a positive capillary surface tension Julian Bialke et al. (2015), while in equilibrium liquid surfaces these two magnitudes are equal. We present here the analysis of 2D-ABP interfaces in terms of the intrinsic density and force profiles, calculated with the particle distance to the instantaneous interfacial line. Our results provide a new insight in the origin of the MIPS from the local rectification of the random active force on the particles near the interface. As it had been pointed, that effect acts as an external potential Omar et al. (2020) that produces a pressure gradient across the interface, so that the mechanical surface tension of the MIPS cannot be described as that of equilibrium coexisting phases; but our analysis shows that most of that effect comes from the tightly caged particles at the dense (inner) side of the MIPS interface, rather than from the free moving particles at the outer side that collide with the dense cluster. Moreover, a clear correlation appears between the decay of the hexatic order parameter at the dense slab and the end of the MIPS as the strength of the active force is lowered. We test that with the strong active forces required for MIPS, the interfacial structure and properties are very similar for ABP with purely repulsive (WCA-LJ model truncated at its minimum) and when the interaction includes a range of the LJ attractive force.
I Introduction
Active matter focuses on systems composed of particles capable of consuming energy in order to move, constantly driving themselves away from equilibriumBechinger et al. (2016). Characteristic features of a bulk suspension of active particles are collective behaviours such as large scale directed motion, dynamic clusters formation or non-equilibrium phase separation. A numerical model that has been thoroughly exploited to understand such properties consists of a suspension of Active Brownian Particles (ABP). ABP are self-propelled Brownian particles whose inter-particle interactions can be either purely repulsiveStenhammar et al. (2014); Redner et al. (2013a) or contain also some range of attractive forceRedner et al. (2013b); Mognetti et al. (2013); Alarcon et al. (2017).
Depending on the nature of inter-particle interactions and of the particles’ activity, the system forms different steady state structures. On the one side, a dilute suspension of attractive ABP is characterised by a distribution of dynamic clusters whenever the inter-particle attraction strength is enough to compete with the particles’ activity Redner et al. (2013b); Mognetti et al. (2013); Sarkar et al. (2021); Alarcon et al. (2017), without any phase separation taking place. Clustering is due to a balance between new particles joining already formed clusters and large clusters breaking into smaller ones Palacci et al. (2013); Buttinoni et al. (2013); Theurkauff et al. (2012). On the other side, a suspension of repulsive ABP undergoes motility induced phase separation (MIPS) for relatively high densities and activity strength Stenhammar et al. (2014); S. Hermann et al. (2021). MIPS implies a spontaneous aggregation of particles due to the persistence of their direction of motion, even in the absence of an explicit attraction. MIPS has been detected in experimental set-ups of active colloids Buttinoni et al. (2013); Thutupalli et al. (2011); D. Nishiguchi and Sano (2015); Briand and Dauchot (2016) and thoroughly characterised in numerical simulations of Active Brownian particles (ABP)Stenhammar et al. (2014); Redner et al. (2013a); Digregorio et al. (2018); Martin-Roca et al. (2021); Solon et al. (2018); Caprini et al. (2019); Levis et al. (2017); Shi et al. (2019); Wysocki et al. (2014). Moreover, MIPS cannot be avoided in the presence of inertial effects Lowen (2020); Su et al. (2021), when considering a suspension of active particles moving on a lattice Dittrich et al. (2021); Barriuso et al. (2021), or when an amount of passive particles is added to the active suspension Rogel Rodriguez et al. (2020a); Stenhammar et al. (2015); Wysocki et al. (2016).
Trying to understand this non-equilibrium phase separation via a mechanical equation of state, one could draw similarities with the interfacial properties of equilibrium phases. However, a clear agreement has not been reached on the physical properties such as the surface tension Siebert et al. (2018); Patch et al. (2018); Omar et al. (2020); Paliwal et al. (2017); Fausti et al. (2021); F et al. (2015). The main reason behind the disagreement can be summarised in the difference between considering activity giving rise to a spatially uniform stress (the swim pressure Fily et al. (2014); Takatori et al. (2014); Mallory et al. (2020)) or activity giving rise to a spatially varying body forceEpstein et al. (2019); Omar et al. (2020).
Even though the swim pressure has been successfully used to determine the onset of MIPS Levis et al. (2017); Winkler et al. (2015); Patch et al. (2017); Solon et al. (2015); Speck and Jack (2016); Fily et al. (2018); Das et al. (2019), when dealing with localised phenomena, adding the swim pressure to the total pressure results in a negative surface tension, that in equilibrium phase coexistence would imply an unstable interface. Considering a ”stable” (even though largely fluctuating) dense-dilute MIPS slab configurations in a non-square boxSiebert et al. (2018); Julian Bialke et al. (2015), it has been shown that Julian Bialke et al. (2015) the pressure formulation, combining the swim pressure with the Kirkwood and Buff formulation for the surface tension, leads to a negative mechanical interfacial tension compatible with a positive surface stiffness, or capillary surface tension. This is a strongly non-equilibrium effect, since from coexisting phases in a passive attractive system the mechanical and capillary surface tensions are equal Trokhymchuk and Alejandre (2013).
To reconcile a stable interface with negative values of surface tension, the authors of Ref.Patch et al. (2018) discovered a strong correlation between the local curvature of the fluctuating interface and the magnitude of the surface tension. The local curvature is responsible for a local tangential motion of particles within a surface layer both in the dense and dilute phase: the combined particles’ motion in the dense and dilute phase leads to a stiffening interface that reduces the amount of local fluctuations.
Another way to reconcile a stable interface with a negative values of the surface tension consists in not including the swim pressure in the stress calculations, as in Ref.Julian Bialke et al. (2015). Instead, one can consider the effect of particle’s activity via a body force, generated by the net alignment of ABP at the interface Omar et al. (2020). As a result, this approach leads to a negligible surface tension in the dense–dilute interface of phase separated ABP Lauersdorf et al. (2021). The crucial difference with the other perspective is that, since the activity of the particles creates a net mean force at the interfaces, the two MIPS phases are like equilibrium regions with different potential energies, and therefore different bulk pressures, rather than being similar to coexisting phases at equilibrium. The mechanical surface tension across a (smooth) external potential step, that separates regions with different pressure, may be negative in equilibrium systems, and it certainly differs from the (always positive) capillary surface tension extracted from the fluctuations of that (externally induced) interface.
Therefore, a key point to understand the physics of MIPS is the origin and structure of that self-sustained effective external potential formed at the interfaces. A major issue present when extracting information on that effect from ABP simulations is that, at any fixed point located on the interfacial region, the strong interfacial fluctuations average both density and force contributions of instantaneous configurations: this affects the point’s local environments, mixing low density and high density contributions, from both sides of the instantaneous boundary of the dense cluster. The same problem appears in molecular dynamics simulations of equilibrium liquid surfaces, giving rise to density profiles that become smoother for larger sizes, without a thermodynamic limit.
The Capillary Wave Theory (CWT)Rowlinson and Widom (1982); Buff et al. (1965) formalizes the account of these interfacial fluctuations and, although some of its hypothesis (like the equivalence between the macroscopic and the capillary surface tensions) become problematic for active systems away from equilibrium Paliwal et al. (2017); Omar et al. (2020), it has already been used as a generic mesoscopic framework to describe the fluctuating MIPS interfaces Patch et al. (2018). In particular, we take advantage of the methods developed to establish a quantitative link between the CWT description of the interfaces as smooth fluctuations shapes, and the particle positions in computer simulations Chacón and Tarazona (2003); Delgado-Buscalioni et al. (2008); bolas, both for equilibrium and dynamical properties.
In the present work, we extend that analysis, with emphasis on obtaining intrinsic profiles for the density and for the active force acting on the particles. These intrinsic profiles give a sharper view for the formation of MIPS, with the focus on the inner side of the interface, where the particles are already quite tightly caged by their neighbours in local hexatic order structures. The decay of the capillary tension towards the end of the MIPS, as the active force is lowered, is correlated with the gradual lost of the global hexatic order at the inner part of the dense slab. The authors of Ref.Fausti et al. (2021) have recently demonstrated, for a minimum continuum active model, how a negative capillary tension may result into a microphase-separated state or into an active foam state, rather than the MIPS of a large dense cluster.
We propose to make use of the approach presented in Ref.Tarazona et al. (2007), based on a density functional description for capillary wave fluctuations on free liquid surfaces. The reason behind this choice is that this approach can be safely applied to non-equilibrium systems. CWT can be applied to a liquid or a solid surface, as long as the system is kept above the roughening temperature. Our system satisfies this condition, being two dimensional and active. Moreover, choosing to study the surface fluctuations at small wavevectors guarantees to safely apply CWT, given the low upper-cutoff wavevector typical of a solid surface.
Thus, we estimate the surface tension in a phase separated system of Active Brownian Particles. We unravel the relevance of inter-particle interactions (whether repulsive or attractive) in both stability and structural features of the dense MIPS phase. We compare the results for ABP with WCA-LJ repulsive interactions with those including an attractive range () from the tail of the LJ potential. Over the range of high activity strength that produces MIPS we find no qualitative difference and very little quantitative effects of that attractive interaction, that becomes crucial for much lower strength of the active force when a equilibrium-like condensation phase transition may appear.
II Numerical and theoretical details
II.1 Model and Numerical details
A suspension of active Brownian particles (ABP) consists of particles undergoing a Brownian motion with an additional constant self-propelling force acting along their orientation vector , that fluctuates independently for each particle. The equations of motion are
| (1) |
| (2) |
being and the components of a white stochastic noise with zero mean and correlations . is the inter-particle pair potential: to study a suspension of repulsive ABP, we consider a WCA, i.e. a LJ truncated and shifted at its minimum ; whereas for a suspension of attractive ABP, we consider a LJ truncated and shifted at , that includes attractive interactions. and are units of length and energy. The temperature , in units of the Boltzmann constant and , is set at . We use the translational diffusion constant to set the time scale, . The rotational diffusion is set to obey the Stokes-Einstein equations: .
We carry out simulations of a two dimensional suspension of ABP with an in house modified version of the LAMMPS Plimpton (1995); Rogel Rodriguez et al. (2020b) open source package. The system consists of particles in a two-dimensional box with periodic boundary conditions, that may be kept with fixed or fluctuating to stabilize and analyse a MIPS slab (see Supplementary Info for more details). The time step has been set to .
As a measure of the degree of activity, we define the dimensionless , i.e. the constant active force modulus in units of the LJ parameters 111Note that this ratio is related to the reported in RefAlarcon et al. (2017). Having to compare repulsive versus attractive particles, for large values of , and for the structural properties explored here, the value of the LJ-scaled is more relevant that the thermal Péclet number , where is the self-propelling velocityStenhammar et al. (2014). Using the above mentioned parameters, we can relate the Péclet number to the Peclet obtained by means of our parameter choice: .
II.2 Theoretical details
The Capillary Wave Theory Tarazona et al. (2007) (CWT) describes the fluctuations of an interface with surface tension through an intrinsic density profile (IDP) that follows the instantaneous shape of an intrinsic surface (IS). In our 2D system the interface is really a line (considering the axis along the dense slab), but we keep the trend of previous authors and use ”intrinsic surface” and ”surface tension”, instead of ”intrinsic line” and ”line tension”. Nevertheless, the 1D dimensional character of the interface is reflected in an enhanced dependence of the mean density profile with the size of the system.
The CWT describes that effect from the average over the fluctuations of the IS Fourier components : , which in a thermal equilibrium system could be predicted from Bolztmann distribution. In our ABP system we cannot use such thermal equibrium hypothesis, but still we may cast in the CWT terms of the IS and the IDP the results of our simulations.
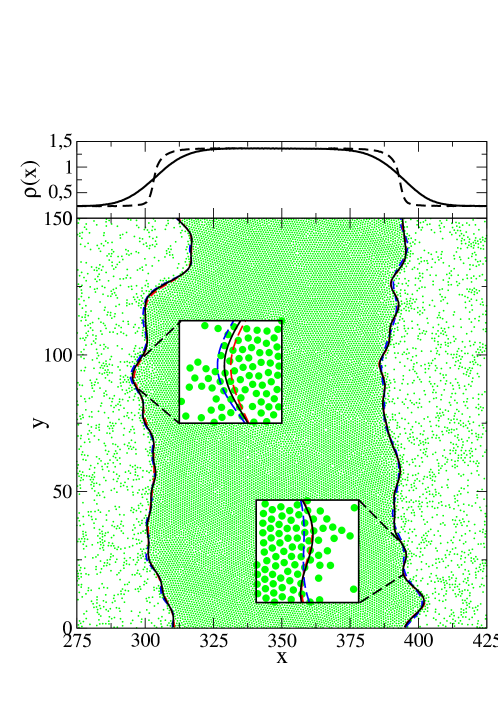
Considering an ABP suspension undergoing MIPS (Fig. 1), a density gap appears between the low and high density phases. Thus, we use a Gaussian smoothed density distribution , being particle positions, to define the IS from the equation , for each , and to get the Fourier components for the wavevectors allowed by the cell size , up to an upper cutoff . Fig. 1 represents a typical MIPS configuration (bottom panel, for an attractive ABP system) together with a density profile (top panel). The snapshot in the bottom panel illustrates ABP (in green) and the lines on both sides of the dense phase boundaries (in black), calculated with our choice and . To estimate the resolution of our mesoscopic description, we report in the two insets the lines for a different choice of and . The top panel in Fig. 1 shows the mean density profile that averages the position of the particles over 2000 configurations separated by 100000 steps.
As suggested by Ref. Omar et al. (2020), in an ABP-MIPS system, despite the random direction of the active force on each particle, the mean active force profile does not vanish at the interface. Therefore, as for the IDP, we may get the intrinsic active force profiles , for a sharper view of the force distribution at the interface. In steady state, the mean active force has to be compensated by the mean repulsion between particles (which may be used as a test for statistics in the ABP simulations, see Supplementary Info). Since interfaces are along the direction, only the component of the mean active force is not null: we refer to it in all the following as .
The intrinsic profiles may be computed according to particles with a given coordination , i.e. the number of neighbors within repulsion distance (). Most of the particles in the dense slab have , with triangular lattice coordination, measured by the local hexatic order parameter, , where is the orientation of the relative position for the ( to ) neighbors of particle . For each particle in the dense phase, this parameter has a modulus , but its complex phase reflects the local orientation of the neighbour. The global , averaged over particles, may have a modulus well below , because of the different phase of each . The hexatic 2D phase appears when is well above the noise (). In our ABP simulations we have calculated over the central half of the dense slab and, as it had been described before Digregorio et al. (2018); Caporusso et al. (2020); Digregorio et al. (2021); Paliwal and Dijkstra (2020), near the borders there are large grains, with different phases of their averages. The global hexatic order is gradually lost by accumulation of and defects in a mesh of disclination lines denser at the edges.
Besides the intrinsic profiles, the CWT analysis gives information on the IS fluctuations. As for equilibrium fluid interfaces Tarazona et al. (2007), we get independent Gaussian distributions for the Fourier components (S.I.) and the mean square amplitudes, written as , define a wavevector dependent surface (or line) tension . In equilibrium systems these mean square fluctuations are proportional to , and gives the macroscopic surface tension as the limit . In ABP interfaces we have to interpret together, as an (inverse) measure of the IS fluctuations.
III Results and Discussion
Besides having prepared the initial configuration for a suspension of repulsive (WCA) ABPs, we study the effect of activity on a phase separated system of attractive (LJ) active particles. We prepare a phase separated system of attractive particles at thermodynamic conditions at which its passive counterpart would phase separate. In Figure 2 panel a) we observe that adding a small activity to the attractive particles is not enough to break the dense-dilute phase separation (also detected for the equilibrium passive system): for small values of activity () the dense phase is stable as a band.
a) b)
b) c)
c)
Similarly to previous studies Redner et al. (2013b), we observe a reentrant phase behavior of the phase separated structure. When increasing the propulsion strength, , (Figure 2 panel a to b), activity overtakes attraction and the band melts, leading to a gas phase. Strikingly, if we increase propulsion strength even further (), phase coexistence emerges again (Figure 2 panel c). The system forms a more compact band, even though the mean density in the box is quite low . In what follows, we will consider either repulsively or attractively interacting particles at relatively high activity, where attraction is less relevant than propulsion.
Having prepared the initial configuration, we estimate the mean density profiles and the IDP for a dense-dilute MIPS formed by both repulsive and attractive ABP. Figure3 presents the IDPs for three values of activity. To eliminate the dependence of the bulk densities, we scale it and shift it .
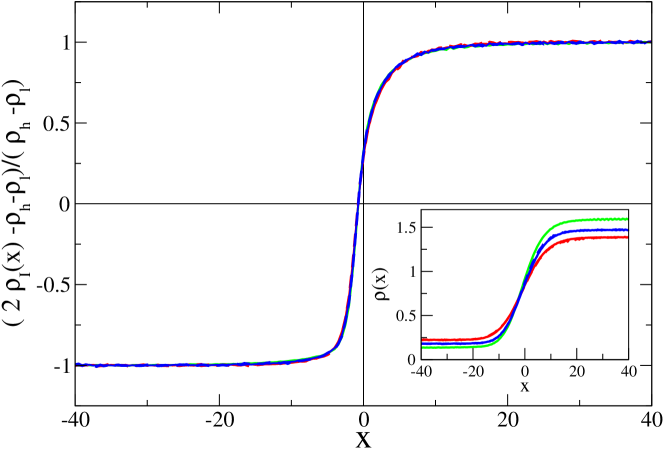
All scaled IPDs become nearly identical and are asymmetric, with a smoother decay towards the dense side. The inset in Fig.3 shows the mean density profiles that become broader as we reduce . The mean density profiles become smoother for decreasing activity because of the larger IS fluctuations, rather than from any local change in the interfacial region, other than the scaling of the bulk densities. Interestingly, the results obtained for repulsive particles coincide with the ones for attractive ones. For the chosen activity range, the inter-particle interaction plays no role in the mean density profile.
To better characterise the interface, we study the density and the active force profiles for different coordination numbers, when the dense-dilute MIPS is made of either repulsive or attractive particles. Fig.4a represents mean density profiles (continuous lines) and intrinsic density profiles (dashed lines) for coordination numbers (green lines), (blue lines), or (red lines) and (magenta lines).
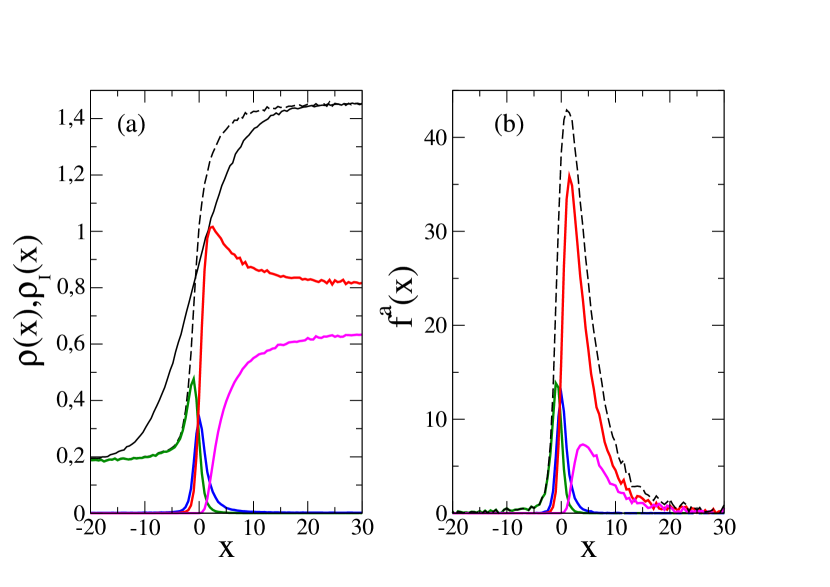
In the low density region, comparing the coloured lines, we conclude that the low density phase is mostly made of particles with (green line). Moreover, the rapid increase of (dashed line) from the bulk, comes from the accumulation of particles at the edge of the dense slab. Particles with (blue line) are distributed as a very narrow peak at , which provides an independent test for our IS definition. In the high density phase we get (red and magenta lines) and the very slow raise of is produced mainly by the gradual decay of five-fold correlated particles, as we move into the bulk.
Fig.4b) represents the active force profiles for the mean density (continuous lines) and for the intrinsic density (dashed lines), and for coordination numbers (green lines), (blue lines), or (red lines) and (magenta lines). When , the profile is peaked at the low density region, whereas when the peak becomes much higher and moves towards the high density region. The high density slab is compressed to a higher pressure than the lower density phase, which make the MIPS interface to be mechanically very different from an equilibrium liquid-vapor surface. Notice this interpretation in terms of different pressure between coexisting phases is that of Ref. Omar et al. (2020),, while other authors used to include the effect of the active force as part of the stress tensor, rather than as an effective external force, and get equal pressure between coexisting phases. Both approaches are equally valid, if treated consistently.
The active force profiles demonstrate how the correlation with the particle position rectifies the random orientation of the active force and creates the effect of a mean external potential at the interface Omar et al. (2020). The rectification of the active force was interpreted as the result of the swimming pressure of the low density phase on the edge of the dense slab. When the active force on these highly mobile particles points inward () it is arrested by the repulsion of the particles in the slab, but when the particles are free to move out of the interface, they dissipate the active force as friction, and become scarcer at the interface.
Our intrinsic view for the active force profiles allows a much sharper characterization and gives a different perspective. The rectification of the active force comes mainly from the denser side of the interface, rather than from the external layer of freely moving particles. Given that mobility in the dense phase is small, the local active force’s rectification happens on time scales longer than the typical characteristic times of the angular diffusion. The component of the active force has an asymmetric peak extended over distances from the IS, similar to the asymmetry of the intrinsic density . The splitting of in terms of shows that the rectification of the random active force comes mainly from particles with crystalline correlation () or at lattice point defects (, ). Apparently, these particles should be too tightly caged by their neighbors to get the asymmetric mobility that rectifies their active force as a swimming pressure.
The explanation for this feature comes from the slow raise of towards the dense phase, which signals the accumulation of point defects (mostly particles with coordination) over that thick region at the edge of the slab. Such accumulation of lattice defects implies the presence of disclination lines, or hexatic grain boundaries, that gradually break the nearly perfect 2D crystal correlation in the interior of the dense slab when we approach the interface Redner_PRL_2013; Klamser et al. (2018); Digregorio et al. (2018, 2021); Paliwal and Dijkstra (2020); Caporusso et al. (2020). The mobility of particles along these grain boundaries should be asymmetric, more easily (collectively) shifted by the active force when points towards the interface than when it pushes towards the interior of the slab.
The gradual increase of the compression, as we move towards the center of the slab, reduces the defects, slowly increasing the density , and that reduces the rectification of the active force . At the inner part of the slab the distribution of lattice defects and dislocation lines becomes statistically homogeneous, the rectification of the active force disappears, and (consistently) the central part of the dense slab becomes a homogeneous hexatic phase characterised by bulk density.
Finally, within the CWT analysis we compute the mean square amplitude of the IS fluctuations, through the function , as shown in Fig. 5 (top panel).
To study the limit of at low , we use the following fit , that is quite accurate and gives robust results (Fig. 5 inset). Figure 5 - top panel presents as a function of . The error bars have been computed to give the difference between the results obtained on the two edges of the slab.
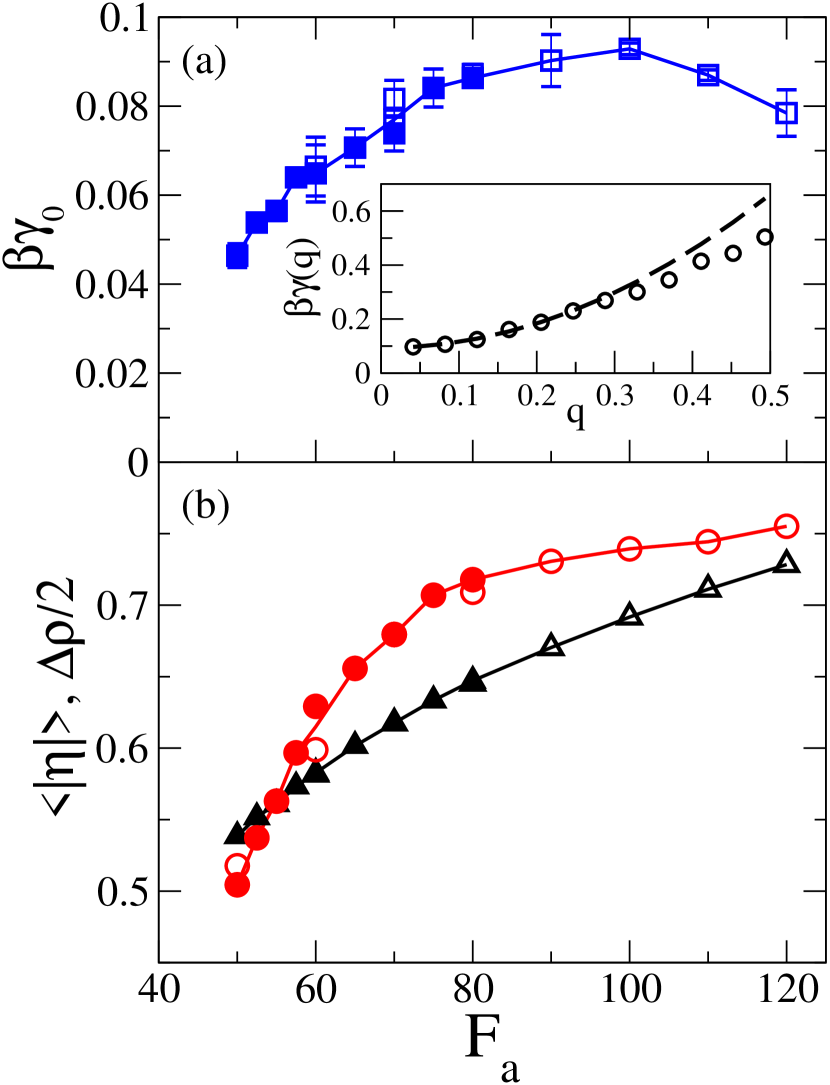
In a thermal equilibrium liquid-vapor interface, the factor may be removed to get (from the analysis of the surface fluctuations) the same that gives the mechanical work (the free energy change) for increasing the area. In an ABP MIPS, the mechanical evaluation of has led to surprisingly negative valuesJulian Bialke et al. (2015). The interpretation of the MIPS as coexistence of two phases with a bulk pressure difference, self-maintained by the rectification of the active force at the interfaces Omar et al. (2020), voids that controversy. Even if we could get rid of the factor, our could not be used to get the mechanical work of a global deformation of the system without including the pressure difference between the two phases. Our capillary surface tension, , is always positive, and it would vanish only if the interfacial fluctuations become unbounded and destroy the MIPS.
To conclude, we study how MIPS disappears for . The usual description is presented in terms of the density gap in the phase diagrams Digregorio et al. (2018), as for equilibrium phase transitions. Our analysis adds two clearer clues with the rapid decay of the hexatic order parameter over the bulk of the dense phase, and of at the interfaces. Figure 5- bottom panel reports half the density gap, and the mean modulus of the hexatic order parameter calculated over the central part of the dense slab, as functions of the active force (). The dependence of over that range is very smooth, without any signal that MIPS may be close to its end for . However, both and show a clear slope change at and decay rapidly for lower activity.
The connection between these two magnitudes may be rationalized when we interpret the MIPS of the ABP in the terms suggested by the intrinsic density and force profiles. A weaker active force reduces the pressure on the dense slab, and its density decreases mainly by changing the mean nearest neighbor distance. When that effect is scaled out, as in Fig. 3 we get very similar IDP for all the . However, the hexatic order at the inner part of the slab is rapidly weakened as the density decreases. Large local fluctuations in the hexatic order at the center of the slab would go against the rectification of the random active force, since the disclination lines could reach the inner part of the slab, instead of being mainly restricted to the grain boundaries over the width at the edges of the slab where has its main contribution. The intuitive image that appears from our analysis is that when the active force, rectified through the asymmetric mobility of the particles along the grain boundaries, becomes too weak to keep the inner hexatic order of the dense slab, the grain boundaries may percolate from side to side of the slab and act as wedges that break the dense phase in pieces, to end with the MIPS.
IV Conclusions
Most of the theoretical concepts and tools we have implemented in our work have been recently used by different authors. Patch et al.Patch et al. (2018) presented an intrinsic surface analysis of the ABP interface similar to ours; the full phase diagram, including the analysis of the hexatic order, had been studied by several groups Redner_PRL_2013; Klamser et al. (2018); Digregorio et al. (2018, 2021); Paliwal and Dijkstra (2020); Caporusso et al. (2020), and the interpretation of MIPS as an effect of an effective external potential, created by the active force across density gradient, was proposed by Omar et al.Omar et al. (2020). Our contribution relies on unifying all these concepts, together with adding a novel view of the mechanism for MIPS coming from our CWT analysis.
The force generated at the interface, as a rectification of the random direction of active force, comes mainly from the dense side of the interface, through a rather thick layer (of about particle diameters). This is shown in the intrinsic force and density profiles. The latter with an amazing similarity in their scaled shapes over the whole range of MIPS. The image of the swimming pressure, created by nearly free particles in the low density phase under the effects of the random active force, breaks down for the tightly caged particles that contribute most to the compression of the dense phase slab. The rectification of the random active force, to generate an effective external potential, has to come from collective rearrangements of the caged particles, at the hexatic phase grains which had been recently observed and characterized Digregorio et al. (2018, 2021); Paliwal and Dijkstra (2020); Caporusso et al. (2020) as an important feature of the MIPS in 2D-ABP. There is clear correlation between the rapid loss of the hexatic order at the inner part of that slab; the decrease of (i.e. the growth of the interfacial fluctuations), and the end of the MIPS at .
As far as we may ascertain, the end of the MIPS comes for just below , when the compression by the active force cannot keep the hexatic order at the inner of the slab. That is correlated with the decay of , i.e. the growth of the geometrical fluctuations of the interface. In their dependence with active force, both the hexatic order parameter and show a change at , that is associated to the pinning of the hexatic phase by the direction of the boundaries. Although with different interactions and parameters, this agrees qualitatively with the distinction between ”hexatic” and ”solid” for the structure of the dense coexisting phase in the full phase diagram Digregorio et al. (2018). Nevertheless, the accurate characterization of that region of the ABP phase diagram faces great difficulties, because large spatial and temporal scales are needed to simulate the 2D hexatic crystal slab, with a thick premelted film at each border, and approaching its bulk melting conditions. In this respect, the recent work by Caporusso et al. Caporusso et al. (2020) for the nucleation and growth of the hexatic grains in large ABP simulations indicates that the macroscopic separation of an inner homogeneous dense phase may be strongly propitiated, and perhaps created, by its percolation as a slab, through the periodic boundary conditions.
Finally, at the high values explored here, our use of the attractive interaction between particles coincide with results obtained for repulsive particles. However, at much lower , the system of attractive particles shows a liquid-vapor coexistence, that smoothly goes to the thermal equilibrium transition at . The application of CWT-based analysis methods to those weakly-active LJ systems may be as useful as it has been in the strongly-active case studied here.
Conflicts of interest
There are no conflicts to declare.
Acknowledgements
We acknowledge the support of the Spanish Secretariat for Research, Development and Innovation (Grants No. FIS2017-86007-C3, PID2020-117080RB-C52, FPU2015/0248, and PID2019-105343GB-I00) and from the Maria de Maeztu Programme for Units of Excellence in R&D (CEX2018-000805-M).
References
- Stenhammar et al. (2014) J. Stenhammar, D. Marenduzzo, R. Allen, and C. M.E., Soft Matter 10, 1489 (2014).
- Julian Bialke et al. (2015) J. Julian Bialke, J. T. Siebert, H. Lowen, and T. Speck, Phys. Rev. lett. 115, 098301 (2015).
- Omar et al. (2020) A. K. Omar, Z.-G. Wang, and J. F. Brady, Phys. Rev. E 101, 012604 (2020).
- Bechinger et al. (2016) C. Bechinger, R. Di Leonardo, H. Lowen, C. Reichhardt, G. Volpe, and G. Volpe, Reviews of Modern Physics. 88, 045006 (2016).
- Redner et al. (2013a) G. S. Redner, M. F. Hagan, , and A. Baskaran, Physical Review Letters 110, 055701 (2013a).
- Redner et al. (2013b) G. S. Redner, A. Baskaran, and M. F. Hagan, Phys. Rev. E 88, 012305 (2013b).
- Mognetti et al. (2013) B. M. Mognetti, A. Saric, S. Angioletti-Uberti, A. Cacciuto, C. Valeriani, and D. Frenkel, Physical Review Letters 111, 245702 (2013).
- Alarcon et al. (2017) F. Alarcon, C. Valeriani, and I. Pagonabarraga, Soft matter 13, 814 (2017).
- Sarkar et al. (2021) D. Sarkar, G. Gompper, and J. Elgeti, Commun. Phys. 4, 36 (2021).
- Palacci et al. (2013) J. Palacci, S. Sacanna, A. P. Steinberg, D. J. Pine, and P. M. Chaikin, Science 339, 936 (2013).
- Buttinoni et al. (2013) I. Buttinoni, J. Bialke, F. Kummel, H. Lowen, C. Bechinger, and T. Speck, Physical review letters 110, 238301 (2013).
- Theurkauff et al. (2012) I. Theurkauff, C. Cottin-Bizonne, J. Palacci, C. Ybert, and L. Bocquet, Physical Review Letters 108, 268303 (2012).
- S. Hermann et al. (2021) S. S. Hermann, D. de las Heras, and M. Schmidt, Mol. Phys. 119, e1902585 (2021).
- Thutupalli et al. (2011) S. Thutupalli, R. Seemann, and S. Herminghaus, New Journal of Physics 13, 073021 (2011).
- D. Nishiguchi and Sano (2015) D. D. Nishiguchi and M. Sano, Physical Review E 92, 052309 (2015).
- Briand and Dauchot (2016) G. Briand and O. Dauchot, Phys. Rev. Lett. 117, 098004 (2016).
- Digregorio et al. (2018) P. Digregorio, D. Levis, A. Suma, L. F. Cugliandolo, G. Gonnella, and I. Pagonabarraga, Phys. Rev. Lett. 121, 098003 (2018).
- Martin-Roca et al. (2021) J. Martin-Roca, R. Martinez, L. C. Alexander, A. L. Diez, D. G. A. L. Aarts, F. Alarcon, J. Ramírez, and C. Valeriani, The Journal of Chemical Physics 154, 164901 (2021).
- Solon et al. (2018) A. P. Solon, J. Stenhammar, M. E. Cates, Y. Kafri, , and J. Tailleur, New J. Phys. . 20, 075001 (2018).
- Caprini et al. (2019) L. Caprini, E. Hernandez-Garcia, C. Lopez, and U. Marini Bettolo Marconi, Scientific Reports 9, 16687 (2019).
- Levis et al. (2017) D. Levis, J. Codina, and I. Pagonabarraga, Soft Matter 13, 8113 (2017).
- Shi et al. (2019) X.-q. Shi, G. Fausti, H. Chate, C. Nardini, and A. Solon, Physical Review Letters 125, 168001 (2019).
- Wysocki et al. (2014) A. Wysocki, R. Winkler, and G. Gompper, EPL 105, 48004 (2014).
- Lowen (2020) H. Lowen, J. Chem. Phys. 152, 040901 (2020).
- Su et al. (2021) J. Su, H. Jiang, and Z. Hou, New J. Phys. 23, 013005 (2021).
- Dittrich et al. (2021) F. Dittrich, T. Speck, and P. Virnau, Eur. Phys. J. E 44, 53 (2021).
- Barriuso et al. (2021) C. M. Barriuso, C. Vanille, F. Alarcon, I. Pagonabarraga, R. Brito, and C. Valeriani, “Collective motion of run-and-tumble repulsive and attractive particles in one dimensional systems,” (2021), arXiv:1912.01282 [cond-mat.soft] .
- Rogel Rodriguez et al. (2020a) D. Rogel Rodriguez, F. Alarcon, R. Martinez, J. Ramírez, and C. Valeriani, Soft Matter 16, 1162 (2020a).
- Stenhammar et al. (2015) J. Stenhammar, R. Wittkowski, D. Marenduzzo, , and M. Cates, Phys.Rev.Lett. 114, 018301 (2015).
- Wysocki et al. (2016) A. Wysocki, R. Winkler, and G. Gompper, New J. Phys. 18, 123030 (2016).
- Siebert et al. (2018) J. T. Siebert, F. Dittrich, F. Schmid, K. Binder, T. Speck, and P. Virnau, Phys. Rev. E 98, 030601 (2018).
- Patch et al. (2018) A. Patch, D. M. Sussman, D. Yllanes, and M. C. Marchetti, Soft Matter 14, 7435 (2018).
- Paliwal et al. (2017) S. Paliwal, V. Prymidis, L. Filion, and M. Dijkstra, J. Chem. Phys. 147, 084902 (2017).
- Fausti et al. (2021) G. Fausti, E. Tjhung, M. E. Cates, and C. Nardini, Phys. Rev. Lett. 127, 068001 (2021).
- F et al. (2015) G. F, I. Theurkauff, D. Levis, C. Ybert, L. Bocquet, L. Berthier, and C. Cottin-Bizonne, Phys. Rev. X 5, 011004 (2015).
- Fily et al. (2014) Y. Fily, A. Baskaran, and M. F. Hagan, Soft matter 10, 5609 (2014).
- Takatori et al. (2014) S. C. Takatori, W. Yan, and J. F. Brady, Phys. Rev. Lett. 113, 1 (2014).
- Mallory et al. (2020) S. A. Mallory, A. K. Omar, and J. F. Brady, “Dynamic overlap concentration scale of active colloids,” (2020), arXiv:2009.06092 [cond-mat.soft] .
- Epstein et al. (2019) J. M. Epstein, K. Klymko, and K. K. Mandadapu, J. Chem. Phys. 150, 1 (2019).
- Winkler et al. (2015) R. G. Winkler, A. Wysocki, and G. Gompper, Soft Matter 11, 6680 (2015).
- Patch et al. (2017) A. Patch, D. Yllanes, and M. C. Marchetti, Phys. Rev. E 95, 012601 (2017).
- Solon et al. (2015) A. Solon, Y. Fily, A. Baskaran, M. Cates, Y. Kafri, M. Kardar, and J. Tailleur, Nat. Phys. 11, 673 (2015).
- Speck and Jack (2016) T. Speck and R. Jack, Phys. Rev. E 93, 062605 (2016).
- Fily et al. (2018) Y. Fily, Y. Kafri, A. Solon, J. Tailleur, and A. Turner, J. Phys. A 51, 044003 (2018).
- Das et al. (2019) S. Das, G. Gompper, and R. Winkler, Sci. Rep. 9, 6608 (2019).
- Trokhymchuk and Alejandre (2013) A. Trokhymchuk and J. Alejandre, J. Chem. Lett. 111, 8510 (2013).
- Lauersdorf et al. (2021) N. Lauersdorf, T. Kolb, M. Moradi, E. N. E, and D. Klotsa, Soft Matter 17, 6337 (2021).
- Rowlinson and Widom (1982) J. S. Rowlinson and B. Widom, Molecular Theory of Capillarity (Claredon Press, 1982).
- Buff et al. (1965) F. P. Buff, R. A. Lovett, and F. H. Stillinger, Phys. Rev. Lett. 15, 621 (1965).
- Chacón and Tarazona (2003) E. Chacón and P. Tarazona, Phys. Rev. Lett. 91, 166103 (2003).
- Delgado-Buscalioni et al. (2008) R. Delgado-Buscalioni, E. Chacón, and P. Tarazona, Phys. Rev. Lett. 101, 106102 (2008).
- Tarazona et al. (2007) P. Tarazona, R. Checa, and E. Chacón, Phys. Rev. Lett. 99, 196101 (2007).
- Plimpton (1995) S. Plimpton, J. Comp. Phys. 117, 1 (1995).
- Rogel Rodriguez et al. (2020b) D. Rogel Rodriguez, F. Alarcon, R. Martinez, J. Ramírez, and C. Valeriani, Soft Matter 16, 1162 (2020b).
- Note (1) Note that this ratio is related to the reported in RefAlarcon et al. (2017).
- Caporusso et al. (2020) C. B. Caporusso, P. Digregorio, D. Levis, L. F. Cugliandolo, and G. Gonnella, Phys. Rev. Lett. 125, 178004 (2020).
- Digregorio et al. (2021) P. Digregorio, D. Levis, L. F. Cugliandolo, G. Gonnella, and I. Pagonabarraga, “Clustering of topological defects in two-dimensional melting of active and passive disks,” (2021), arXiv:1911.06366 [cond-mat.soft] .
- Paliwal and Dijkstra (2020) S. Paliwal and M. Dijkstra, Phys. Rev. Research 2, 012013 (2020).
- Klamser et al. (2018) J. Klamser, S. K. S.C., and W. Krauth, Phys. Rev. Lett. 9, 5045 (2018).