Ultrasensitive electrode-free and co-catalyst-free detection of nanomoles per hour hydrogen evolution for the discovery of new photocatalysts
Huaiyu(Hugo) Wang
Rebecca Katz
Julian Fanghanel
Raymond E. Schaak
Venkatraman Gopalan
Supplementary Materials
S1. leakage rate of the apparatus
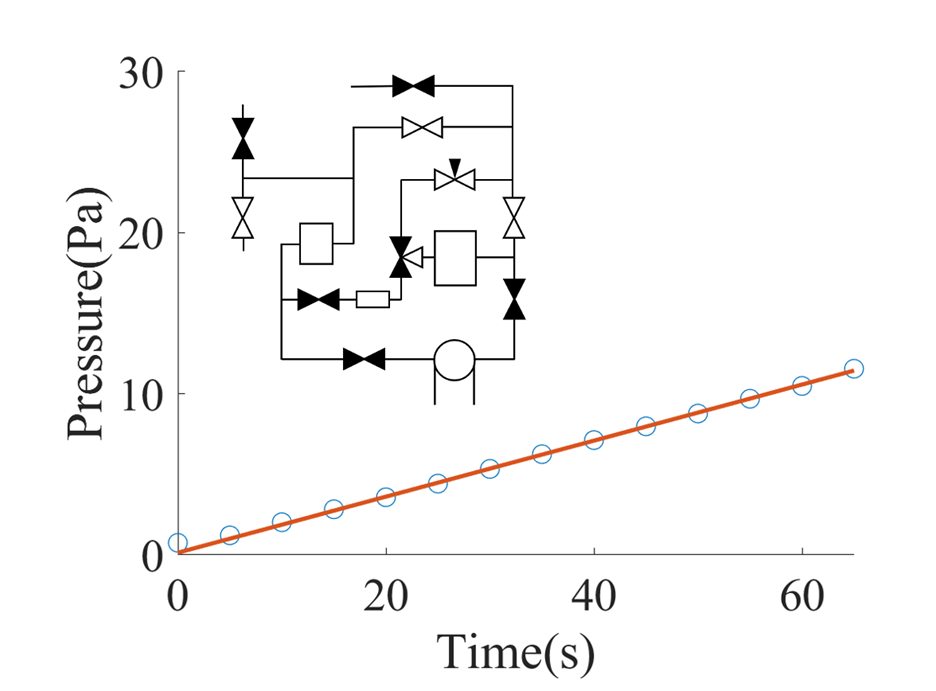
The leakage test is performed using the pressure rise method [RN1101] under argon environment. The chamber is initially purged with Argon gas(UHP,99.998%) and then pumped to lowest pressure. Then the pump is isolated from the setup and the pressure is measured as a function of time as shown in Figure S1.
Figure S1: Leakage test result of the photochemical cell setup. Blue dots are recorded pressure data and red line is the linear fitting result. The inset is an illustration of the valve positions during leakage test. The filled valves indicate that they are closed while unfilled valves indicate that the they are open. The leakage rate is calculated to be Pam3/s.
S2. A comparison of full water splitting VH2/VO2 between Vacuum vent and atmospheric air vent, with and without tubing installation
Figure S2: A summary of the generated hydrogen and oxygen volumetric ratio of a water electrolysis (full water-splitting process) under different conditions: a) The table summarizes the results of the trail 1): atmospheric air vent without tubing; 2) vacuum vent without tubing; 3) atmospheric air vent with tubing. The highlighted cells in green indicate the correct hydrogen vs. oxygen ratio. b) A photo of the installed tubing, which will be placed right above the liquid surface during the photocatalytic process.
S3. Sealing of circulation pump for closed cycle circulation
Due to the design of the commercial circulation pump, air can easily leak into the system via leaks in the pump. To fix these leak spots, Thor seal high vacuum epoxy was applied. The vacuum can reach the highest value (3 mTorr) after the epoxy dries. However, the leakage rate at the circulation pump is still much larger than that at the reaction chamber. As a result, when performing the Gas-Accumulation mode, the circulation pump needs to be isolated from the chamber.
S4. Plane indexing of XRD data
Figure S3: Experimental and reference data of XRD results of Ca2PbO4, ZnFe2O4 and MgSb2O6. The * marks the peaks that do not agree with the reference simulation.
S5. Degradation test of the measured samples from XRD
Figure S4: XRD characterization and phase analysis results of a) ZnFe2O4 as synthesized, after 24 hours and after 72 hours; b) Ca2PbO4 as synthesized, after 24 hours and after 84 hours.
S6. High throughput screening processes
Figure S5: Data-driven computational protocols for testing high through-put screening of candidates for solar production of hydrogen.
![[Uncaptioned image]](/html/2202.01995/assets/FigureS2.png)
![[Uncaptioned image]](/html/2202.01995/assets/FigureS3.png)
![[Uncaptioned image]](/html/2202.01995/assets/FigureS4-a_v2.png)
![[Uncaptioned image]](/html/2202.01995/assets/FigureS4-b_v2.png)
![[Uncaptioned image]](/html/2202.01995/assets/FigureS5.png)