Multi-Output Gaussian Process-Based Data Augmentation for Multi-Building and Multi-Floor Indoor Localization
Abstract
Location fingerprinting based on Received Signal Strength Indicator (RSSI) becomes a mainstream indoor localization technique due to its advantage of not requiring the installation of new infrastructure and the modification of existing devices, especially given the prevalence of Wi-Fi-enabled devices and the ubiquitous Wi-Fi access in modern buildings. The use of Artificial Intelligence (AI)/Machine Learning (ML) technologies like Deep Neural Networks (DNNs) makes location fingerprinting more accurate and reliable, especially for large-scale multi-building and multi-floor indoor localization. The application of DNNs for indoor localization, however, depends on a large amount of preprocessed and deliberately-labeled data for their training. Considering the difficulty of the data collection in an indoor environment, especially under the current epidemic situation of COVID-19, we investigate three different methods of RSSI data augmentation based on Multi-Output Gaussian Process (MOGP), i.e., by a single floor, by neighboring floors, and by a single building; unlike Single-Output Gaussian Process (SOGP), MOGP can take into account the correlation among RSSI observations from multiple Access Points (APs) deployed closely to each other (e.g., APs on the same floor of a building) by collectively handling them. The feasibility of the MOGP-based RSSI data augmentation is demonstrated through experiments based on the state-of-the-art Recursive Neural Network (RNN) indoor localization model and the UJIIndoorLoc, i.e., the most popular publicly-available multi-building and multi-floor indoor localization database, where the RNN model trained with the UJIIndoorLoc database augmented by using the whole RSSI data of a building in fitting an MOGP model (i.e., by a single building) outperforms the other two augmentation methods as well as the RNN model trained with the original UJIIndoorLoc database, resulting in the mean three-dimensional positioning error of .
Index Terms:
Indoor localization, data augmentation, multi-output Gaussian process (MOGP), recurrent neural network (RNN).I Introduction
Triangulation-based indoor localization methods like Time of Arrival (ToA), Time Difference of Arrival (TDoA), and Angle of Arrival (AoA) have been extensively studied for decades and well known for their sub-meter-level localization accuracy [1]. However, the stricter requirements of the clock synchronization among all transmitters and/or receivers in a system for ToA/TDoA and the use of antenna arrays for AoA not suitable for small devices, in addition to their dependence on anchor nodes whose exact locations are to be known, make it impractical to deploy them in large-scale multi-building and multi-floor indoor environments. Location fingerprinting based on Received Signal Strength Indicator (RSSI) or geomagnetic field intensity, on the other hand, becomes a mainstream indoor localization technique due to its advantage of not requiring the installation of new infrastructure and the modification of existing devices [2].
As Artificial Intelligence (AI)/Machine Learning (ML) technologies become mature and wide-spread, the use of AI/ML for location fingerprinting is now one of the hottest research topics, which is demonstrated, for instance, through the use of deep neural networks (DNNs) for large-scale multi-building and multi-floor indoor localization based on not only feedforward neural networks (FNNs) [3] but also advanced DNNs like convolutional neural networks (CNNs) [4, 5] and recursive neural networks (RNNs) [6]. Note that the application of DNNs for indoor localization depends on a large amount of preprocessed and deliberately-labeled data for their training. Because the data collection in an indoor environment, especially under the current epidemic situation of COVID-19, is costly in terms of time and man-power, the importance of publicly-available datasets cannot be stressed enough for the research and development of indoor localization schemes.
The UJIIndoorLoc database from the Jaume I University in Spain is one of the most popular publicly-available datasets and provides multi-building and multi-floor Wi-Fi RSSI data, which were collected over three buildings with four to five floors [7]. Although the UJIIndoorLoc is among the largest Wi-Fi RSSI dataset with various features, the coverage of measurement places—called reference points—is limited to part of the areas: For example, the number of reference points for the third floor of building 2 is 2709, while this number is significantly reduced to 948 for the third floor of building 1, which might have been related with the measurement strategy. Our investigation shows that the uneven coverage of reference points in the UJIIndoorLoc dataset affects the performance of the location estimation by DNNs due to the lack of training for less-covered areas.
Data augmentation based on the interpolation/extrapolation of existing RSSI data could be used to mitigate the impact of the lack of coverage in location estimation. One possible approach is Gaussian Process (GP) regression, also called Kriging in geostatistics [8]; using the existing data, GP regression can give an optimal linear unbiased prediction at unsampled locations. In the existing work for RSSI data augmentation (e.g., [9]), GP regression is used to exploit the spatial correlation among RSSI observations, which, however, is limited to those from one Access Point (AP) only, i.e., the regression based on Single-Output GP (SOGP). Note that there could be a significant correlation among RSSI observations from multiple APs which are deployed closely to each other (e.g., APs on the same floor of a building). To exploit the correlation among observations from multiple APs, therefore, we extend GP regression to the case of Multi-Output GP (MOGP) and investigate an optimal way of RSSI data augmentation based on MOGP in this paper.
Another data augmentation algorithm for indoor localization has been recently proposed in [10], which is based on a selective Generative Adversarial Network (GAN) for the generation of fake unlabeled RSSI data and a semi-supervised DNN for pseudo-labeling of the generated fake RSSI data. Unlike our MOGP-based approach exploiting the correlation among observations from APs over multiple floors, the use of selective GAN in [10] is limited to the RSSI data of a single floor of a building. Also, their algorithm requires two separate neural networks for the generation of fake RSSI vectors and their pseudo-labels, respectively, and depends on rather complicated selection criteria to address the issue of the limited coverage of the generated fake RSSI data because the selective GAN cannot directly model the mapping between location coordinates and RSSI data. Our approach based on MOGP regression, on the other hand, fits a model based on the existing RSSI data, which can be sampled at any point in a given area; hence, it could solve the uneven spatial distribution and lack of RSSI data relatively easily and flexibly.
II Multi-Output Gaussian Process (MOGP)
II-A Regression
Let and be a training set of -dimensional input points (e.g., location coordinates) and a set of the corresponding -dimensional output observations (e.g., RSSIs for multiple APs), which are defined as follows:
| (1) | ||||
where
| (2) | ||||
for . Given and , MOGP collectively approximates outputs based on the assumption that their joint distribution is given by a multivariate Gaussian distribution, i.e.,
| (3) |
where is a mean vector, i.e., , which are typically set to , and is a covariance matrix defined as follows:
| (4) |
where is a covariance function also called kernel [11]; unlike the mean, the kernel heavily impacts the fitting performance of MOGP [12].
Note that the observations with independent and identically distributed Gaussian measurement noise are modeled as follows:
| (5) |
where . In this case, the likelihood function is given by
| (6) |
where is a diagonal matrix with . Also, the posterior distribution of at a test point given and is
| (7) |
where and are the mean and the variance of the prediction, respectively.111The readers are referred to [13] for the details of their derivations. Fitting an MOGP with a covariance matrix having a general structure, by the way, is quite difficult; the computational complexity for inputs and outputs is [14]. Given the symmetric nature of RSSI data for indoor localization, therefore, we consider symmetric MOGPs in this paper per the suggestion from [13], of which we focus on separable models treating the inputs and outputs separately.
Using the generative approach called Linear Model of Coregionalization (LMC), we can model MOGP outputs as a linear combination of latent functions as follows:
| (8) |
where and is its coefficient. A special case of is called Intrinsic Coregionalization Model (ICM), and its covariance matrix is given by
| (9) |
where
| (10) |
The covariance matrix can be greatly simplified by LMC and ICM, but we still need to specify the kernel—i.e., in (9)—for a given application. A new kernel can be obtained by linear operations of the known kernel functions [15], and one of the most wildly used kernels is the Square-Exponential kernel, also called Gaussian Radial Basis Function (RBF) [16]:
| (11) |
Since it is infinitely differentiable, the function becomes smoother as increase; some argues in this regard that the Gaussian RBF is too smooth to model applications in the physical world [16]. In this paper, therefore, we use the Matérn kernel with coefficients , which is not overly smooth [17]:
| (12) |
II-B Advantages over SOGP in RSSI Data Augmentation
The reason for using MOGP for RSSI data augmentation instead of SOGP is two-fold.
First, MOGP is known to outperform SOGP in predicting multivariate outputs because MOGP can exploit the correlation among the related outputs; for instance, it was demonstrated through the experimental assessment of the prediction performance of GP with eight examples that eight of the ten MOGP models with different characteristics show superiority over SOGP [13].
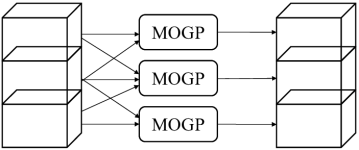
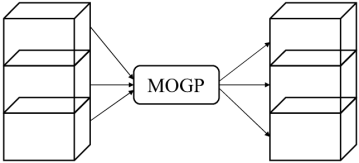
Second, the very problem of RSSI data augmentation for multi-building and multi-floor indoor localization suits well MOGP regression as shown in Fig. 1:
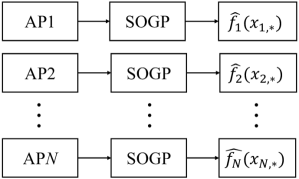
(a)
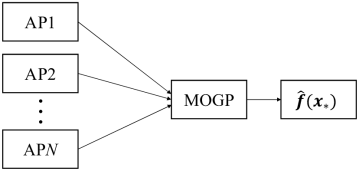
(b)
During the construction of RSSI dataset, RSSIs from multiple APs (i.e., multiple outputs) are measured simultaneously at a given reference point (i.e., an input). As shown in Fig. 1 (a), we can fit multiple SOGP models, i.e., one for each AP by separately and independently processing the RSSI data from that AP. In this case, we can exploit only the spatial correlation among them. To exploit the correlation among RSSIs from multiple APs, especially the APs deployed closely to each other, we process them in an integrated way using a single MOGP as shown in Fig. 1 (b).
III RSSI Data Augmentation Based on MOGP
Figure 2 shows the RSSI samples for WAP13 at building 0 and floor 0 of the UJIIndoorLoc database.
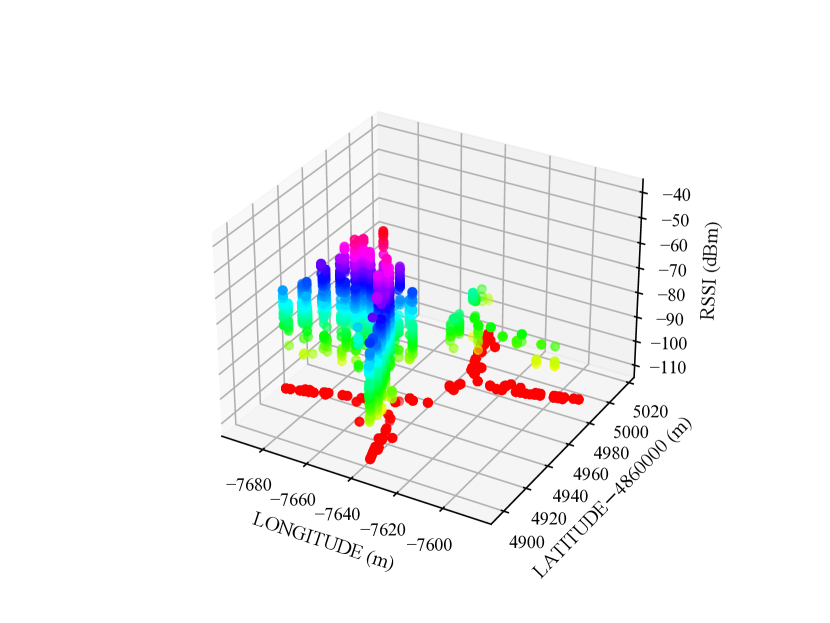
The red points on the bottom of Fig. 2 are the reference points where RSSIs were measured, whose cross shape is consistent with the actual shape of the building (i.e., Fig. 4 of [7]). The colors of the points off the bottom represent their signal strengths. When the details of the floor plan are not available, we have to rely on the extreme coordinates of the reference points (i.e., upper left and lower right points based on the assumption of a rectangular floor) during the sampling, which, however, could affect the localization accuracy as discussed in Section IV. Based on the investigation of the RSSI statistics of the UJIIndoorLoc database, we consider three different methods of data augmentation by MOGP, which are discussed in Sections III-A to III-C.
III-A By A Single Floor
This augmentation method is the simplest of all because it fits an MOGP based only on the RSSIs from APs on a single floor; sampling for the fake RSSI generation is also limited to the same floor as shown in Fig. 3.
This method is suitable for a floor with lower signal attenuation in the horizontal direction but higher signal attenuation in the vertical direction, the latter of which reduces the effect of APs located on different floors on the RSSIs on the floor under consideration. Unlike SOGP limited to one AP in fitting, this method still can take into account the effect of all the APs on the same floor.
III-B By Neighboring Floors
When there exist impacts on RSSIs from APs on different floors, which is the case for the UJIIndoorLoc database with the floor height of , we can extend the two-dimensional correlation of the augmentation method by a single floor to the three-dimensional one as shown in Fig. 4 by including RSSIs of the neighboring floors when aggregating the data for the current floor.
For example, when a target is the second floor, we fit an MOGP model to the data from the first and the third floors as well as those of the second floor. Compared with the data augmentation method by a single floor, one significant difference is that there is one additional dimension in the kernel to contain height or floor information.
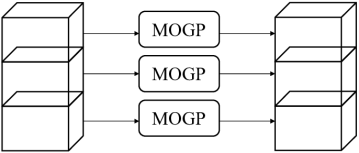
III-C By A Single Building
In this method, the data of a building is taken as a whole in fitting one common MOGP model as shown in Fig. 5.
When a building contains staircases, patios, lofts, and so on, this method can consider the correlation of signals in those special structures depending on the coverage of the original data.
IV Experiment Results
We select the state-of-the-art RNN model with Long Short-Term Memory (LSTM) cells [6] as our reference localization scheme and carry out experiments with the original and the augmented UJIIndoorLoc datasets in order to investigate the effects of the MOGP-based augmentation on the localization performance. The MOGP regression is implemented based on GPy—i.e., a GP framework in Python developed at the Sheffield machine learning group [18]—following the steps outlined in Section II-A. The Stacked AutoEncoder (SAE) of the RNN model consists of three hidden layers of 256, 128, and 64 nodes, which is followed by two common hidden layers with 128 and 128 nodes. For building and floor classifiers, we have two stacked LSTM cells followed by two Fully-Connected (FC) layers of 32 nodes and 1 output node. Position estimator consists of three FC layers of 512 and 512 nodes and 2 output nodes for two-dimensional location coordinates. We apply early stopping with patience of 10 for coordinate estimation model and 30 with save best only functions activated for building/floor classification model. Table I summarizes the key RNN parameter values for the experiments.
| Parameter | Value |
|---|---|
| SAE Hidden Layers | 256-128-64 |
| SAE Activation | ReLu |
| SAE Optimizer | Adam |
| SAE Loss | MSE |
| Common Hidden Layers | 128-128 |
| Common Activation | ReLu |
| Common Dropout | 0.2 |
| Common Loss | MSE |
| LSTM Cells | 256-256 |
| LSTM Activation | ReLu |
| LSTM Optimizer | Adam |
| LSTM Loss | MSE |
| BF Classifier Hidden Layers | 32-1 |
| BF Classifier Activation | MSE |
| BF Classifier Optimizer | Adam |
| BF Classifier Dropout | 0.2 |
| BF Classifier Loss | ReLu |
| Position Hidden Layers | 512-512-2 |
| Position Activation | MSE |
| Position Optimizer | Adam |
| Position Dropout | 0.1 |
| Position Loss | tanh |
The localization performance of the RNN model with the original and augmented UJIIndoorLoc datasets is summarized in Table II, where the floor hit rate is for the correct identification of both building and floor Identifiers (IDs) and the 3D error is the mean of three-dimensional Euclidean distances [19].
| Performance metric | Original dataset | Augmented dataset | ||
|---|---|---|---|---|
| By a single floor | By neighboring floors | By a single building | ||
| Building hit rate [%] | 99.99 | 99.99 | 99.80 | 99.99 |
| Floor hit rate [%] | 92.92 | 93.12 | 92.70 | 93.84 |
| 3D error [] | 8.61 | 8.87 | 8.85 | 8.59 |
It is clear from the results that the data augmentation by a single building outperforms the other two augmentation methods as well as the original data; for all three performance metrics, the data augmentation by a single building provides the best results, though the differences are minor. As discussed in Section III, the data augmentation by a single building can take into account the correlation among all RSSI data of a building and thereby provide better predictions at sampling points. These results show that the effects of APs located on different floors—including those on non-neighboring floors—on RSSIs cannot be ignored for the UJIIndoorLoc dataset.
We also compare the localization performance of the RNN with the UJIIndoorLoc dataset augmented by a single building with the three best results from the EvAAL competition [19] as well as the results of [6] in Table III.
| Performance metric | RNN with augmented dataset | RNN [6] | MOSAIC | HFTS | ICSL |
|---|---|---|---|---|---|
| Building hit rate [%] | 100 | 100 | 98.65 | 100 | 100 |
| Floor hit rate [%] | 94.20 | 95.23 | 93.86 | 96.25 | 86.93 |
| 3D error [] | 8.42 | 8.62 | 11.64 | 8.49 | 7.67 |
Note that the comparison in Table III is not done on a fair and strict basis: The original UJIIndoorLoc testing set is not publicly available but was given to those participating in the EvAAL competition; the results from the experiments in this paper and those in [6] are based only on the training and the validation sets of the UJIIndoorLoc database, where the validation set was splitted into new validation and testing sets. Also, note that the results in Table III is the best ones unlike the average ones in II. Still, the results in Table III are enough to demonstrate the feasibility of the proposed RSSI augmentation by a single building, where the 3D positioning error is reduced by compared to that of [6].
V Concluding Remarks
In this paper, we have proposed MOGP-based RSSI data augmentation for multi-building and multi-floor indoor localization and evaluated its localization performance using the RNN model [6] and the UJIIndoorLoc dataset [7]. We first compared three different methods of augmentation—i.e., by a single floor, by neighboring floors, and by a single building—and found that the augmentation by a single building outperforms the other two. Then, we also compared the localization performance of the RNN model with the UJIIndoorLoc data augmented by a single floor with the three best results from the EvAAL competition [19] as well as the results of [6]. These results demonstrate the feasibility of using MOGP to augment the existing localization databases, which is important given the difficulty of data collection in an indoor environment, especially under the current epidemic situation of COVID-19.
Note that the localization error can be further reduced if the database can provide more detailed information on floor plans: When generating fake RSSI data with MOGP, sampling locations based on the simple assumption of rectangular floors could be located outside actual buildings like the cross-shaped building in the UJIIndoorLoc database discussed in Section III. In such a case, we can adjust sampling points based on the detailed floor plans from the database, e.g., imposing more limiting parameters on MOGP or filtering sampling points based on the floor plans, which is to be investigated in future work.
Acknowledgment
This work was supported in part by Postgraduate Research Scholarship (under Grant PGRS1912001) and Key Program Special Fund (under Grant KSF-E-25) of Xi’an Jiaotong-Liverpool University.
References
- [1] F. Zafari, A. Gkelias, and K. K. Leung, “A survey of indoor localization systems and technologies,” IEEE Commun. Surveys Tuts., vol. 21, no. 3, pp. 2568–2599, 2019.
- [2] Z. Zhong, Z. Tang, X. Li, T. Yuan, Y. Yang, W. Meng, Y. Zhang, R. Sheng, N. Grant, C. Ling, X. Huan, K. S. Kim, and S. Lee, “XJTLUIndoorLoc: A new fingerprinting database for indoor localization and trajectory estimation based on Wi-Fi RSS and geomagnetic field,” in Proc. CANDAR’18, Hida Takayama, Japan, Nov. 2018.
- [3] K. S. Kim, S. Lee, and K. Huang, “A scalable deep neural network architecture for multi-building and multi-floor indoor localization based on Wi-Fi fingerprinting,” Big Data Analytics, vol. 3, no. 1, Apr 2018. [Online]. Available: http://dx.doi.org/10.1186/s41044-018-0031-2
- [4] X. Song, X. Fan, X. He, C. Xiang, Q. Ye, X. Huang, G. Fang, L. L. Chen, J. Qin, and Z. Wang, “CNNLoc: Deep-learning based indoor localization with WiFi fingerprinting,” in Proc. 2019 IEEE SmartWorld, Ubiquitous Intelligence Computing, Advanced Trusted Computing, Scalable Computing Communications, Cloud Big Data Computing, Internet of People and Smart City Innovation (SmartWorld/SCALCOM/UIC/ATC/CBDCom/IOP/SCI), 2019, pp. 589–595.
- [5] M. Ibrahim, M. Torki, and M. ElNainay, “CNN based indoor localization using RSS time-series,” in Proc. 2018 IEEE Symposium on Computers and Communications (ISCC), 2018, pp. 01 044–01 049.
- [6] A. E. A. Elesawi and K. S. Kim, “Hierarchical multi-building and multi-floor indoor localization based on recurrent neural networks,” 2021.
- [7] J. Torres-Sospedra, R. Montoliu, A. Martínez-Usó, J. P. Avariento, T. J. Arnau, M. Benedito-Bordonau, and J. Huerta, “Ujiindoorloc: A new multi-building and multi-floor database for WLAN fingerprint-based indoor localization problems,” in Proc. 2014 International Conference on Indoor Positioning and Indoor Navigation (IPIN), 2014, pp. 261–270.
- [8] C. E. Rasmussen and C. K. I. Williams, Gaussian processes for machine learning, ser. Adaptive Computation and Machine Learning. Cambridge, MA: MIT Press, 2006.
- [9] S.-S. Jan, S.-J. Yeh, and Y.-W. Liu, “Received signal strength database interpolation by Kriging for a Wi-Fi indoor positioning system,” Sensors, vol. 15, no. 9, pp. 21 377–21 393, 2015. [Online]. Available: https://www.mdpi.com/1424-8220/15/9/21377
- [10] W. Njima, M. Chafii, A. Chorti, R. M. Shubair, and H. V. Poor, “Indoor localization using data augmentation via selective generative adversarial networks,” IEEE Access, vol. 9, pp. 98 337–98 347, 2021.
- [11] F. Jäkel, B. Schölkopf, and F. A. Wichmann, “A tutorial on kernel methods for categorization,” Journal of Mathematical Psychology, vol. 51, no. 6, pp. 343–358, 2007. [Online]. Available: https://www.sciencedirect.com/science/article/pii/S0022249607000375
- [12] E. Schulz, M. Speekenbrink, and A. Krause, “A tutorial on gaussian process regression: Modelling, exploring, and exploiting functions,” Journal of Mathematical Psychology, vol. 85, pp. 1–16, 2018. [Online]. Available: https://www.sciencedirect.com/science/article/pii/S0022249617302158
- [13] H. Liu, J. Cai, and Y.-S. Ong, “Remarks on multi-output gaussian process regression,” Knowledge-Based Systems, vol. 144, pp. 102–121, 2018. [Online]. Available: https://www.sciencedirect.com/science/article/pii/S0950705117306123
- [14] W. P. Bruinsma, E. Perim, W. Tebbutt, J. S. Hosking, A. Solin, and R. E. Turner, “Scalable exact inference in multi-output Gaussian processes,” in Proc. the 37th International Conference on Machine Learning, ser. Proceedings of Machine Learning Research, vol. 119. PMLR, July 2020, pp. 1190–1201.
- [15] D. Duvenaud, J. Lloyd, R. Grosse, J. Tenenbaum, and G. Zoubin, “Structure discovery in nonparametric regression through compositional kernel search,” vol. 28, no. 3, pp. 1166–1174, 17–19 Jun 2013. [Online]. Available: https://proceedings.mlr.press/v28/duvenaud13.html
- [16] M. Kanagawa, P. Hennig, D. Sejdinovic, and B. K. Sriperumbudur, “Gaussian processes and kernel methods: A review on connections and equivalences,” 2018.
- [17] M. L. Stein, Interpolation of spatial data: some theory for kriging. Springer Science & Business Media, 1999.
- [18] GPy - a Gaussian process (gp) framework in Python. [Online]. Available: https://gpy.readthedocs.io/en/deploy/
- [19] A. Moreira, M. J. Nicolau, F. Meneses, and A. Costa, “Wi-Fi fingerprinting in the real world - RTLS@UM at the EvAAL competition,” in Proc. 2015 International Conference on Indoor Positioning and Indoor Navigation (IPIN), 2015, pp. 1–10.