Isotope Ratio Dual-Comb Spectrometer
Abstract
We demonstrate the use of dual-comb spectroscopy for isotope ratio measurements. We show that the analysis spectral range of a free-running near-infrared dual-comb spectrometer can be extended to the mid-infrared by difference frequency generation to target specific spectral regions suitable for such measurements, and especially the relative isotopic ratio C. The measurements performed present a very good repeatability over several days with a standard deviation below 2‰ for a recording time of a few tens of seconds, and the results are compatible with measurements obtained using an isotope ratio mass spectrometer. Our setup also shows the possibility to target several chemical species without any major modification, which can be used to measure other isotopic ratios. Further improvements could decrease the uncertainties of the measurements, and the spectrometer could thus compete with isotope ratio spectrometers currently available on the market.
1 Introduction
Isotope ratio measurements (IRMs) is a technique widely used for a large range of applications and hence showing a lot of interest. For instance, strontium ratio 87Sr/86Sr analyses were successfully used to reconstruct the Egtved Girl’s life that occurred 3500 years ago [1]. Still related to chronological dating, measurements of the oxygen ratio 18O/16O, carbon ratio 13C/12C and thorium ratio 230Th/232Th ratio have been used for the dating of prehistoric human constructions such as the Bruniquel cave [2]. In astronomy, IRMs allow to study the atmosphere and sedimentary rocks of other planets such as Mars [3, 4, 5], or to investigate the composition of meteorites by analyzing magnesium or oxygen isotopes [6, 7]. In more daily life related applications, food and beverages can be subjected to IRMs [8], such as for testing ingredients in beers [9], or for detecting the geographical origin of wines [10, 11], mushrooms [12], and even cheeses [13]. Another example of application where IRMs are performed is the medical domain such as for the detection of Helicobacter Pylori infection, which can be done by measuring the carbon ratio 13C/12C out of the exhaled air of a patient [14].
All the examples presented above mostly use a mass spectrometer for IRMs, which is a specific high-performance instrument, but costly and with measurements times that can be of several minutes. Moreover, the samples under study might need to be pre-treated before being analyzed which increases the complexity and can induce more uncertainties [15]. Hence, other techniques for IRMs have been developed, and absorption spectroscopy is one of them when studying gases. This non-destructive technique presents the advantage of being based on optics and lasers which gives an instrument smaller in size and capable to be used for on field measurements [16]. Direct absorption [17], frequency modulation [18] or cavity ring-down spectroscopy [19] are generally used for these measurements. However, in the field of absorption spectroscopy, new techniques have also been developed in the recent years such as dual-comb spectroscopy (DCS) [20, 21, 22]. DCS shows several characteristics such as a high spectral resolution, no mobile parts in the setup, and the potential to perform real-time analyses. These features are very interesting for IRMs in gases, and to the best of our knowledge, only a few works have considered the use of DCS for this application [23, 24], but no quantitative measurements were performed.
In this paper, we present the use of DCS for IRMs and we demonstrate the feasibility of the technique by measuring the relative carbon isotopic ratio C of gas samples. First we describe the DCS method and the experimental setup considered here. Then we will see some examples of absorption spectra that can be recorded with our setup to illustrate its features. After that we will present and show how IRMs can be performed with our DCS setup by taking the example of carbon dioxide for C measurements. In addition, we will show that the frequency tunability of our setup can be used to target other chemical species for IRMs, and especially nitrous oxide for nitrogen isotopes studies. Finally, we will discuss our results and potential enhancements that could be done in future works to improve the use of the DCS technique for IRMs with a higher accuracy and a lower uncertainty.
2 Mid-infrared electro-optic dual-comb setup
Spectroscopic applications can be performed using several techniques, but DCS has been shown to be highly suitable for high resolution spectral measurements and short time acquisitions. This technique, which is based on the study of the interference between two mutually coherent frequency combs with slightly different repetition frequencies, has been intensively studied and refined in the last years [20, 21, 22]. The Fourier transform of the interference time signal, which is called the interferogram, is also a comb but with a linespacing that is the difference of the repetition frequencies of the combs and with a central frequency that lies in the radio-frequency (RF) domain. When at least one of the optical comb passes through a gas sample, the absorption feature of the gas will be seen in the optical domain but also in the RF domain, which makes it much more easier and straightforward to detect by using only a low bandwidth photodetector and an oscilloscope. Since the comb linespacing can easily be of the order of the hundred of MHz, using the technique for gas analysis enables high resolution spectroscopic applications.
Lots of experimental setups have been designed for DCS but here, we use a setup based on electro-optic modulators [25]. This setup, whose architecture is presented in detail in Ref. [26], shows particular advantages for DCS since there is no need of locking between the combs which simplifies drastically the technique [26, 25]. However, in its basic design [26], the setup operates around 1.55µm, which is not really suitable for spectroscopic applications. Indeed, most molecules do not show strong absorptions features in this spectral region, thus long absorption cells are required to perform DCS, which can be cumbersome. To bypass this problem, the working spectral region of the setup can be extended to the mid-infrared (MIR) region where molecular absorptions are much stronger than at 1.55µm [27]. In our case, we use difference frequency generation (DFG) in a periodic poled lithium niobate (PPLN) crystal to reach the spectral region between 4.2µm and 4.85µm. The experimental setup and its spectral extension part to reach the MIR is presented in Figure 1.
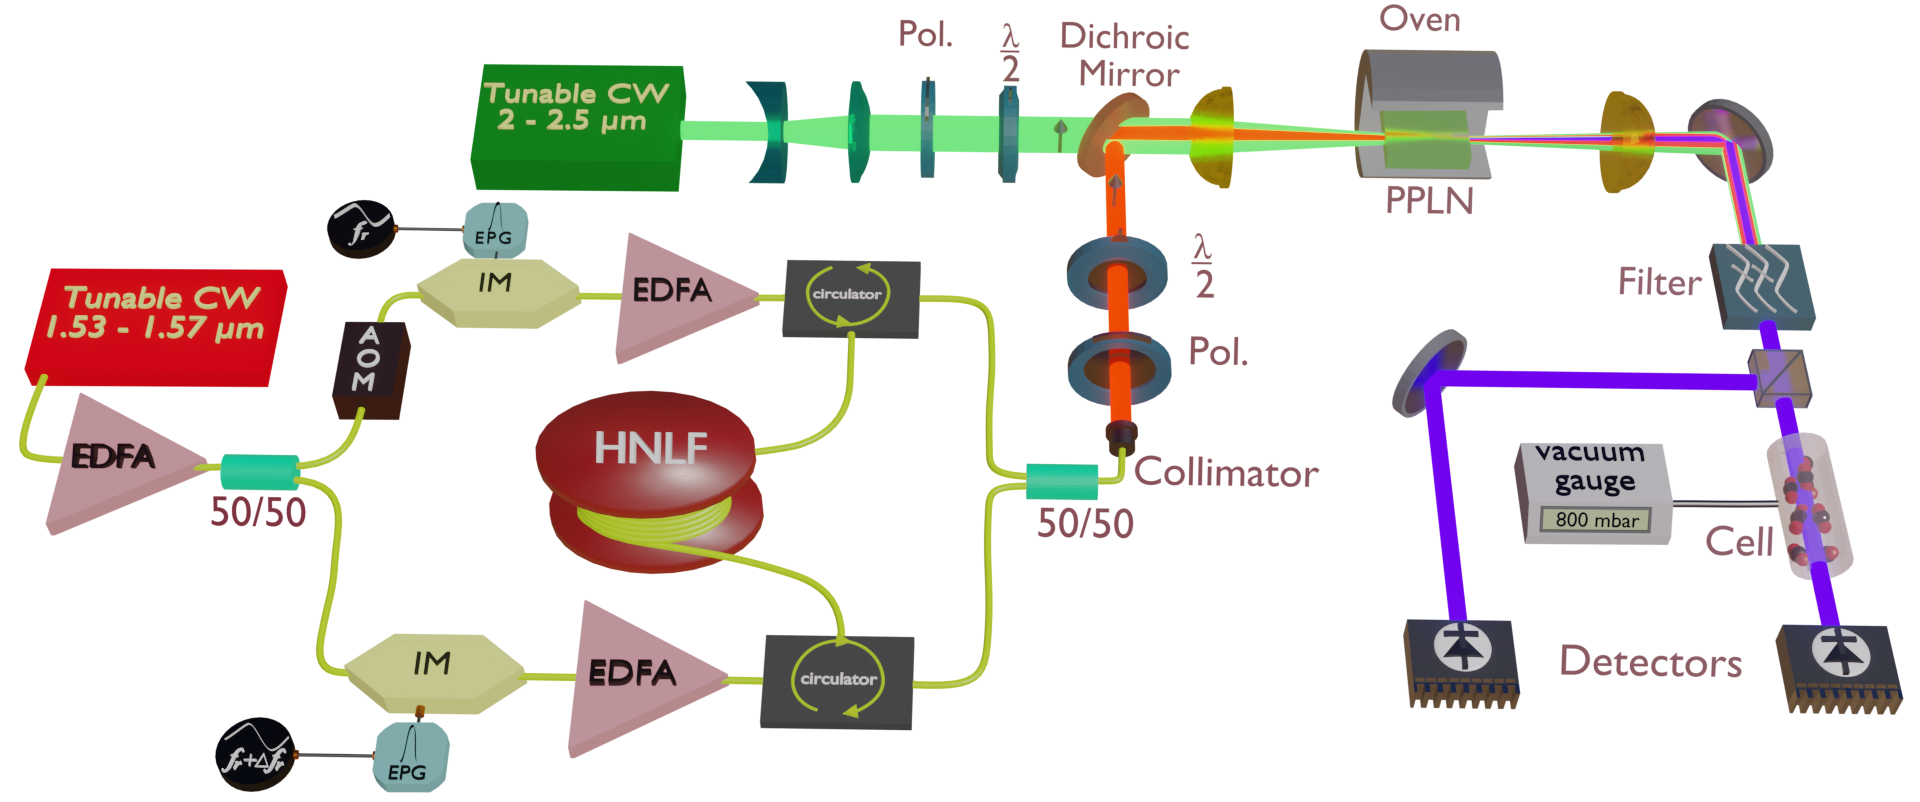
The dual-comb spectrometer can be divided into two parts. The first one is the generation of frequency combs at 1.55µm as described in Ref. [26], and the second part is the frequency conversion of the previous combs in the MIR using DFG. Regarding the part at 1.55µm, we start with a continuous wave (CW) laser at 1.55µm that is amplified up to 150mW. The CW is then split in two arms that are both intensity modulated using electro-optic modulators, which produce 40GHz wide frequency combs with a cardinal sine shape. The intensity modulators are driven by electrical pulse generators which operate by the control of sinusoidal waveform generators that set the repetition frequency of the combs to MHz and MHz. Note that prior to the modulation, one of the arm is frequency shifted by 40MHz using an acousto-optic modulator to prevent aliasing in the later detection. After generating combs, both arms are amplified up to a peak power of 26W and sent counter-propagatively in a 800m long highly nonlinear fiber of dispersion ps.nm-1.km-1, linear loss dB.km-1 and Kerr coefficient W-1.km-1 at 1.55µm. This fiber was chosen to obtain a spectral broadening as high as possible and a flat-topped shape by dispersive shock waves [26, 27, 28], giving us spectra that are 3nm wide.
After spectral broadening, both combs are mixed with a 50/50 combiner and sent to free space using a fibered collimator. Using a dichroic mirror, the combs with a peak power of 1.4W are then combined with an idler wave consisting of a wavelength tunable CW laser from 2µm to 2.5µm whose power can be set up to 5W. The beam is then focused on a 10mm long temperature controlled commercially available PPLN crystal (Covesion) for DFG. Note that the polarization of the combs and the idler wave are controlled with polarizers and half-wave plates to be aligned with the dipole moment of the crystal, which is needed to achieve the highest DFG efficiency. Also note that by modifying appropriately the wavelength of the idler, the temperature and the poling period of the PPLN crystal, the central wavelength of the MIR signal can cover the range 4.2µm to 4.85µm. Here, we choose to convert both combs in a single crystal which shows a certain ease of doing [29], but note that the combs could be converted individually, which would enable the possibility to perform dispersion spectroscopy [27, 30]. At the output of the crystal, the beam is collimated and filtered to keep only the MIR part. A 50/50 beamsplitter is then used to split the MIR signal in two parts, providing a signal and a reference arm which are both ending with a photovoltaic detector (Vigo) for acquiring the dual-comb interferograms. The signal arm is composed of a pressure monitored cell that can be filled with various gases.
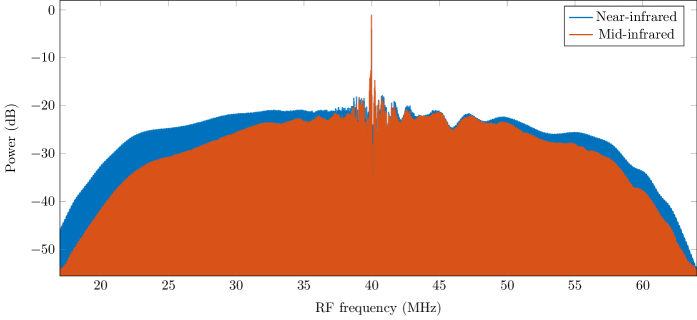
We recorded an interferogram of 80ms that is Fourier transformed to reveal the RF comb made of the beating between the MIR combs. This RF comb is compared with the one we can obtained at 1.55µm under similar conditions and both of them are presented in Figure 2. We can observe that the RF comb resulting from the MIR beating is slightly narrower than the RF comb resulting from the near-infrared beating, which is due to the spectral acceptance bandwidth of the PPLN crystal but besides that, both RF combs are highly similar and possess a signal-to-noise ratio of 35dB.
3 Spectroscopic applications
3.1 Absorption spectroscopy
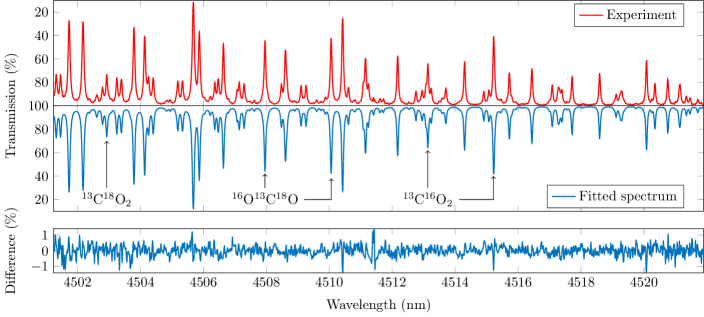
Since MIR combs are generated, spectroscopy can be performed. First, we set the wavelength of the near-infrared combs to 1555nm and the idler wave to 2373nm, giving us a MIR signal around 4511nm. We use a 5cm long cell that is filled with a CO2 gas sample made of 99% of 13CO2 at a total pressure of 173mbar, and we record at the same time two 10s long interferograms, one for the reference arm and one for the signal arm. Both of them are divided into 80ms sub-interferograms, Fourier transformed and averaged to obtain the reference and signal RF combs. The envelope of the resulted combs are extracted and compared for baseline correction, which gives us the transmission spectrum of the sample in the cell that is presented in Figure 3 (top). The frequency scale of the spectrum is converted back in the optical domain using the parameters of our setup and the relation between the RF and optical domains. In the following, the same procedure will be performed to obtain the transmission spectrum of other gas samples under study.
Once the transmission spectrum is obtained, we compared it with a fitted spectrum based on the least-squares regression of a set of Voigt profiles with line parameters given by the HITRAN database [31, 32]. For the regression, the isotopic ratios C/12C and O/16O are taken as free parameters. Since we are not referencing any of the CW lasers we use, we also take into account a small shift for re-centering the spectrum relatively to the rough frequency value expected by the DFG process. We also consider a baseline correction of the absorption spectrum since the comparison between the reference and signal arm is not perfect. The obtained fitted spectrum is shown in Figure 3 (middle) and the difference with the experimental data is presented in Figure 3 (bottom) showing a very good agreement.
Due to the gas chosen for this experiment and the spectral region investigated, Figure 3 shows several lines coming from different isotopologues where some of them are highlighted. With this simple example, one can imagine that the data obtained from the comparison between the experimental and fitted spectra can be used to extract isotopic ratios such as here, or , and thus perform IRMs.
3.2 Isotope ratio measurements
The basic idea for IRMs using absorption spectroscopy is to target a spectral region where the setup can record the absorption features of several isotopologues. In our case, and compared to the last spectrum we presented, we will be more restrictive since we will focus on particular regions where the isotopologues show absorption lines of similar intensities at an isotopic abundance close to the natural one. This is done to avoid lines that saturate, which could deteriorate the data analysis, but also because most of IRMs find values that are close to the natural isotopic abundance. Note that other kind of restrictions could be considered [33]. First, let us consider carbon dioxide and its 13C/12C ratio.
3.2.1 Carbon dioxide and C
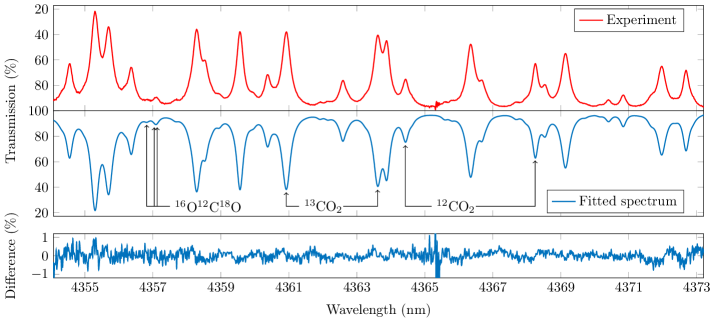
The ratio C/12C can be studied for carbon dioxide by analyzing the spectral region around 4.36µm, which mainly shows absorption lines coming from the band of 12CO2 and 13CO2 at similar intensities when these isotopologues are close to the natural isotopic abundance. In our case, we target the spectral region roughly between 4355nm and 4373nm. Then, we fill a 10cm long cell with a gas mixture of carbon dioxide and synthetic air (the partial pressures will be detailed later) and we record the transmission spectrum of the sample. The experimental spectrum is then compared to a fitted spectrum in the same way as explained before, and with free parameters that are the ratios , , the partial pressure of carbon dioxide , a global frequency shift of the spectrum, and a function to correct the non-perfect baseline.
From the comparison between the experimental data and the fitted spectrum, one can extract the isotopic ratio given by the least-squares regression. However, this way of doing will give us an absolute measurement, which is generally very complex to perform accurately since a lot of phenomena can induce systematic errors [34, 15]. Nevertheless, it is generally possible to bypass significantly this issue by measuring a relative isotopic ratio, rather than an absolute one. By using a reference sample that is pre-characterized in isotopic ratio , one can measure the relative value between an unknown sample of isotopic ratio and the one that is pre-characterized. The relative value is usually expressed using the notation in which is, in the case of 13C and 12C, defined as:
| (1) |
In the case of the ratio measurement, the reference sample is usually related to the Vienna Pee Dee Belemnite (VPDB) [35]. Note that absolute measurements are possible, but they require much more complex setups, and are usually used for highly precise measurements [36]. To summarize, an isotope ratio spectrometer needs to be calibrated.
Several calibration procedures are reported in the literature and a practical guide can be found in Ref. [37]. For an ideal calibration of our setup, the procedure proposed in Ref. [37] should be followed, but in our case, we will choose a more simple approach. The reason for this is that for an ideal calibration procedure, the setup being calibrated should be sufficiently sensitive to the isotopic ratio , which is not our case. Moreover, such kind of calibration procedures are more suitable when targeting high accuracy and low uncertainty measurements, which is not the purpose of this study. Hence we chose an approach inspired by Ref. [37] but more suitable for our setup.
As with other calibration procedures, ours consists of studying the response of the spectrometer with pre-chracterized isotopic ratio gas samples of CO2. Here, we used samples originating from two commercially available gas bottles with a known but different C value to improve the consistency of our measurements [38]. To confirm and refine the values given by the manufacturer, several samples from these two bottles were also characterized using an isotope ratio mass spectrometer (Delta V ThermoScientific) giving us the following values C and C respectively, relatively to the VPDB.
To perform the calibration with our setup, we first fill a 10cm long cell with a mixture of 2.5% of CO2 coming from one pre-characterized gas bottle and the rest of synthetic air, at a total pressure of 800mbar. Note that for the calibration procedure and the further measurements, we will work at the same partial pressure of CO2 and at the same total pressure. This is done to avoid any potential pressure dependence of our measurements. One could also calibrate the setup in partial pressure, but this increases the complexity and induces a new potential source of errors. Then, we record the absorption spectrum of the sample in the cell in the same way as detailed before using 20s long interferograms. The spectrum is then compared to a fitted spectrum and the ratio is extracted from the least-squares regression. A typical example of recorded spectrum is shown in Figure 4 along with the fitted spectrum used for comparison and the difference between the two sets of data. The same measurement under the same condition is made with the second pre-characterized gas bottle. As explained before, the obtained values can be very different from the expected ones, which is due to the non-perfect response of our setup. However, from the measurements with the two pre-characterized gas bottles, we now posses a way of linking the measured values with the expected ones using a calibration equation that we choose as linear.
Once the calibration is done, we can investigate an unknown sample of CO2 which will be here a gas bottle of unknown C value. In the same condition as in the calibration procedure, we record a transmission spectrum that is compared with a fitted spectrum. From the regression, one can extract the isotopic ratio for this gas sample and by applying the inverted calibration equation, we can obtain a C measurement for this sample. The calibration procedure and the measurement using gas samples from the bottle under characterization is repeated several times, over several days. The obtained results and their associated error bars, which are given by two times the calibrated standard deviation resulting from the least-squares regression, are presented in Figure 5.
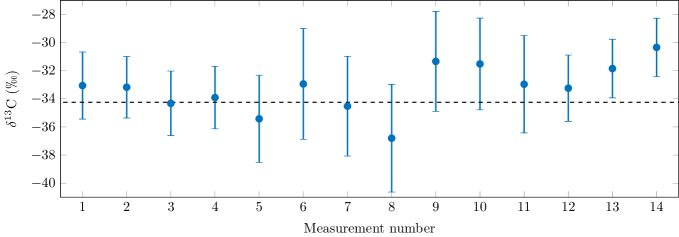
A simple statistical analysis of the results obtained can give us the mean value and their dispersion which is given by the standard deviation of this whole set of measurements. We found a C value that is:
Note that for this measurement set, individual measurements show standard deviation close to 1.1‰ for half of them, and close to 1.8‰ for the other half. The reason for such differences might be due to the setup stability that can slightly change over the days. The value obtained from the statistical analysis can be compared with a set of measurements made by the isotope ratio mass spectrometer previously used. The result obtained with this instrument is C , which shows a good agreement within errors with the value given by our isotope ratio dual-comb spectrometer.
3.2.2 Nitrous oxide and Nα
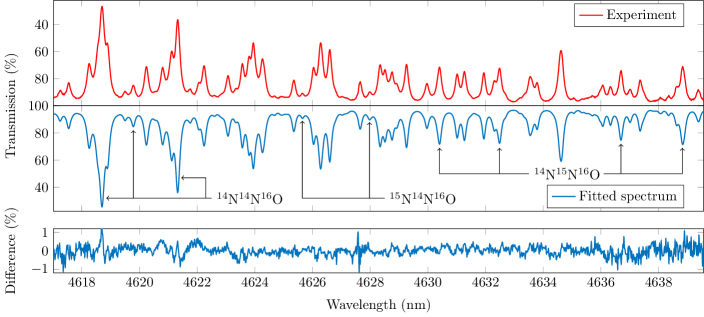
Still using the frequency agility of the setup, it is possible to investigate nitrous oxide since absorption bands of this molecule and its isotopologues are present below 5µm [39]. In our case we study the spectral region around 4.63µm where the nitrous oxide isotopologues 14N2O and 14N15NO show absorption lines with similar intensities when close to the natural isotopic abundance. Hence, in the same way as we did for carbon dioxide and the C measurement, it is possible to perform Nα measurements, the upperscript being used to differentiate 14N15NO and 15N14NO due to the fact that they do not show the same absorption features. As shown with the measurement of C, a complete measurement of the Nα ratio would require a calibration of our spectrometer with pre-characterized samples of nitrous oxide in isotopic ratio. Considering we already presented the same study for the measurement of C, here we will only present raw uncalibrated measurements to illustrate the features of our setup regarding nitrous oxide studies.
The setup is set with an idler CW laser at 2342nm, which gives a MIR signal that is centered at 4627nm. The 10cm cell is filled with a gas mixture of 10% nitrous oxide and 90% synthetic air at a total pressure of 455mbar. A 60s long interferogram is then recorded and treated as explained before to recover the absorption spectrum of the gas injected in the cell, and a typical example of obtained spectrum is shown is Figure 6 (top). As with carbon dioxide, the spectrum is compared with a fitted spectrum obtained by least-squares regression which is shown in Figure 6 (middle), and the difference between the two sets of data is presented in Figure 6 (bottom). For the least-squares regression, the model used here is still a set a Voigt profile with N2O line parameters given by the HTIRAN database, and only the free parameters have been changed to accommodate for the difference of study in isotopic ratios. Several recordings showed a raw standard deviation resulting from the regression around 2‰, which is slightly above the raw standard deviations obtained in the measurements and at the price of a longer interferogram recording. However, it is not possible to give any concrete signification to this value, especially on the measurement uncertainty for the Nα ratio as long as the setup is not calibrated yet.
4 Discussions and conclusion
In this article, we presented a free running dual-comb setup operating in the mid-infrared for isotope ratio measurements. We showed that by an appropriate choice of the analysis spectral range and by calibrating our setup against pre-characterized gas samples, it was possible to accurately measure the relative isotopic ratio C with a standard deviation below 2‰. The measurements performed present a very good repeatability, and a comparison with data obtained using a mass spectrometer showed a very good agreement, thus validating the use of dual-comb spectroscopy for isotope ratio measurements. The work presented here, and especially the measurements uncertainties, could be improved by stabilizing against frequency standards the CW lasers used, by decreasing the repetition rates of the combs for a higher spectral resolution, by increasing the spectral windows investigated with a shorter PPLN crystal, or even by using more advanced procedures for data analyses [40]. We believe these potential enhancements could improve the measurements delivered by our setup and thus compete with several isotope ratio spectrometers currently available on the market. However, let us note that the typical uncertainties obtained here can already be enough for several applications, such as for the detection of Helicobacter Pylori infection by breath test which requires a threshold around 3‰ [41], and even comparable with the precision of embedded spectrometers on martian rovers like Curiosity which is around 2‰ [42, 43].
Although any dual-comb spectrometer could be used for such isotope ratio measurements, electro-optic frequency combs seem to be very good candidates for miniaturizing such kind of setups since they can be generated on-chip [44, 45], which could enable easier on field isotope ratio measurements with embedded systems. Regarding the applications, in the case of carbon isotope ratio measurements, changes in the absorption length could result in the study of atmospheric conditions, or using pure carbon dioxide samples. The first possibility has shown particular interests [46], whereas the second one could avoid the use of diluting the samples in air and be particularly useful for applications where relatively high amount of CO2 can be used. The technique presented here could in principle also be used to target other molecular species, such as sulfur isotopes via the study of sulfur dioxide [47], but this would require to go further in the MIR, above 5µm where PPLN crystals are no more transparent. However, other materials and techniques were reported to be able to study such spectral regions [48, 49]. To conclude, the results presented here show that dual-comb spectroscopy has a high potential in the measurements of isotope ratios, and we believe that these results could paved the way to new kinds of isotope ratio spectrometers.
Acknowledgments
The authors would like to thank Vincent Boudon for his availability to answer many questions related to the HITRAN database and spectroscopy, and Ivan Jovovic for his help in running the isotope ratio mass spectrometer measurements.
Funding
Centre national de la recherche scientifique (CNRS), Conseil régional de Bourgogne Franche-Comté, iXCore Research Fondation, Agence Nationale de la Recherche (ANR-19-CE47-0008, ANR-15-IDEX-0003, ANR-21-CE42-0026-01, ANR-21-ESRE-0040).
Conflict of interest
The authors declare no conflict of interest.
References
- [1] Karin Margarita Frei et al. “Tracing the dynamic life story of a Bronze Age Female” In Scientific Reports 5.1 Springer ScienceBusiness Media LLC, 2015 DOI: 10.1038/srep10431
- [2] Jacques Jaubert et al. “Early Neanderthal constructions deep in Bruniquel Cave in southwestern France” In Nature 534.7605 Springer ScienceBusiness Media LLC, 2016, pp. 111–114 DOI: 10.1038/nature18291
- [3] Chris R. Webster et al. “Isotope Ratios of H, C, and O in CO2 and H2O of the Martian Atmosphere” In Science 341.6143 American Association for the Advancement of Science, 2013, pp. 260–263 DOI: 10.1126/science.1237961
- [4] Zhen Tian, Tomáš Magna, James M.. Day, Klaus Mezger, Erik E. Scherer, Katharina Lodders, Remco C. Hin, Piers Koefoed, Hannah Bloom and Kun Wang “Potassium isotope composition of Mars reveals a mechanism of planetary volatile retention” In Proceedings of the National Academy of Sciences 118.39 National Academy of Sciences, 2021 DOI: 10.1073/pnas.2101155118
- [5] Christopher H. House et al. “Depleted carbon isotope compositions observed at Gale crater, Mars” In Proceedings of the National Academy of Sciences 119.4 National Academy of Sciences, 2022 DOI: 10.1073/pnas.2115651119
- [6] Alexander Ruf et al. “Previously unknown class of metalorganic compounds revealed in meteorites” In Proceedings of the National Academy of Sciences 114.11 National Academy of Sciences, 2017, pp. 2819–2824 DOI: 10.1073/pnas.1616019114
- [7] Romain Tartèse, Marc Chaussidon, Andrey Gurenko, Frédéric Delarue and François Robert “Insights into the origin of carbonaceous chondrite organics from their triple oxygen isotope composition” In Proceedings of the National Academy of Sciences 115.34 National Academy of Sciences, 2018, pp. 8535–8540 DOI: 10.1073/pnas.1808101115
- [8] Federica Camin, Luana Bontempo, Matteo Perini and Edi Piasentier “Stable Isotope Ratio Analysis for Assessing the Authenticity of Food of Animal Origin” In Comprehensive Reviews in Food Science and Food Safety 15.5, 2016, pp. 868–877 DOI: 10.1111/1541-4337.12219
- [9] J. Brooks et al. “Heavy and Light Beer: A Carbon Isotope Approach To Detect C4Carbon in Beers of Different Origins, Styles, and Prices” In Journal of Agricultural and Food Chemistry 50.22 American Chemical Society (ACS), 2002, pp. 6413–6418 DOI: 10.1021/jf020594k
- [10] Martin P Day, Benli Zhang and Gerard J Martin “Determination of the geographical origin of wine using joint analysis of elemental and isotopic composition. II—Differentiation of the principal production zones in france for the 1990 vintage” In Journal of the Science of Food and Agriculture 67.1, 1995, pp. 113–123 DOI: 10.1002/jsfa.2740670118
- [11] Dana Alina Magdas, Stela Cuna, Gabriela Cristea, Roxana Elena Ionete and Diana Costinel “Stable isotopes determination in some Romanian wines” PMID: 22397311 In Isotopes in Environmental and Health Studies 48.2 Taylor & Francis, 2012, pp. 345–353 DOI: 10.1080/10256016.2012.661731
- [12] Ill-Min Chung, Jae-Gu Han, Won-Sik Kong, Jae-Kwang Kim, Min-Jeong An, Ji-Hee Lee, Yeon-Ju An, Mun Yhung Jung and Seung-Hyun Kim “Regional discrimination of Agaricus bisporus mushroom using the natural stable isotope ratios” In Food Chemistry 264, 2018, pp. 92–100 DOI: https://doi.org/10.1016/j.foodchem.2018.04.138
- [13] Federica Camin, Karine Wietzerbin, Anaisabel Blanch Cortes, Georg Haberhauer, Michéle Lees and Giuseppe Versini “Application of Multielement Stable Isotope Ratio Analysis to the Characterization of French, Italian, and Spanish Cheeses” In Journal of Agricultural and Food Chemistry 52.21 American Chemical Society (ACS), 2004, pp. 6592–6601 DOI: 10.1021/jf040062z
- [14] David Y. Graham, Doyle J. Evans, Lesley C. Alpert, Peter D. Klein, Dolores G. Evans, Antone R. Opekun and Thomas W. Boutton “Campylobacter pylori detected noninvasively by the 13C-urea breath test” In The Lancet 329.8543 Elsevier BV, 1987, pp. 1174–1177 DOI: 10.1016/s0140-6736(87)92145-3
- [15] Lu Yang “Accurate and precise determination of isotopic ratios by MC-ICP-MS: A review” In Mass Spectrometry Reviews 28.6, 2009, pp. 990–1011 DOI: https://doi.org/10.1002/mas.20251
- [16] Erik Kerstel “Chapter 34 - Isotope Ratio Infrared Spectrometry” In Handbook of Stable Isotope Analytical Techniques Amsterdam: Elsevier, 2004, pp. 759–787 DOI: https://doi.org/10.1016/B978-044451114-0/50036-3
- [17] Joseph F. Becker, Todd B. Sauke and Max Loewenstein “Stable isotope analysis using tunable diode laser spectroscopy” In Appl. Opt. 31.12 OSA, 1992, pp. 1921–1927 DOI: 10.1364/AO.31.001921
- [18] H. Waechter and M.W. Sigrist “Mid-infrared laser spectroscopic determination of isotope ratios of N2O at trace levels using wavelength modulation and balanced path length detection” In Applied Physics B 87.3 Springer ScienceBusiness Media LLC, 2007, pp. 539–546 DOI: 10.1007/s00340-007-2576-z
- [19] Ed H. Wahl et al. “Applications of cavity ring-down spectroscopy to high precision isotope ratio measurement of 13C/12C in carbon dioxide” PMID: 16500752 In Isotopes in Environmental and Health Studies 42.1 Taylor & Francis, 2006, pp. 21–35 DOI: 10.1080/10256010500502934
- [20] Ian Coddington, Nathan Newbury and William Swann “Dual-comb spectroscopy” In Optica 3.4 OSA, 2016, pp. 414–426 DOI: 10.1364/OPTICA.3.000414
- [21] Tara Fortier and Esther Baumann “20 years of developments in optical frequency comb technology and applications” In Communications Physics 2.1 Springer ScienceBusiness Media LLC, 2019 DOI: 10.1038/s42005-019-0249-y
- [22] Nathalie Picqué and Theodor W. Hänsch “Frequency comb spectroscopy” In Nature Photonics 13.3 Springer ScienceBusiness Media LLC, 2019, pp. 146–157 DOI: 10.1038/s41566-018-0347-5
- [23] A.. Muraviev, V.. Smolski, Z.. Loparo and K.. Vodopyanov “Massively parallel sensing of trace molecules and their isotopologues with broadband subharmonic mid-infrared frequency combs” In Nature Photonics 12.4 Springer ScienceBusiness Media LLC, 2018, pp. 209–214 DOI: 10.1038/s41566-018-0135-2
- [24] Konstantin L. Vodopyanov “Isotopologues Detection and Quantitative Analysis by Mid-Infrared Dual-Comb Laser Spectroscopy” In Encyclopedia of Analytical Chemistry American Cancer Society, 2020, pp. 1–11 DOI: https://doi.org/10.1002/9780470027318.a9321
- [25] Alexandre Parriaux, Kamal Hammani and Guy Millot “Electro-optic frequency combs” In Adv. Opt. Photon. 12.1 OSA, 2020, pp. 223–287 DOI: 10.1364/AOP.382052
- [26] Guy Millot, Stéphane Pitois, Ming Yan, Tatevik Hovhannisyan, Abdelkrim Bendahmane, Theodor W. Hänsch and Nathalie Picqué “Frequency-agile dual-comb spectroscopy” In Nature Photonics 10 Nature Publishing Group, 2016, pp. 27 URL: http://dx.doi.org/10.1038/nphoton.2015.250
- [27] Ming Yan, Pei-Ling Luo, Kana Iwakuni, Guy Millot, Theodor W. Hänsch and Nathalie Picqué “Mid-infrared dual-comb spectroscopy with electro-optic modulators” In Light: Science & Applications 6 The Author(s), 2017, pp. e17076 URL: https://doi.org/10.1038/lsa.2017.76
- [28] A. Parriaux, M. Conforti, A. Bendahmane, J. Fatome, C. Finot, S. Trillo, N. Picqué and G. Millot “Spectral broadening of picosecond pulses forming dispersive shock waves in optical fibers” In Opt. Lett. 42.15 OSA, 2017, pp. 3044–3047 DOI: 10.1364/OL.42.003044
- [29] Borja Jerez, Pedro Martín-Mateos, Frederik Walla, Cristina Dios and Pablo Acedo “Flexible Electro-Optic, Single-Crystal Difference Frequency Generation Architecture for Ultrafast Mid-Infrared Dual-Comb Spectroscopy” In ACS Photonics 5.6, 2018, pp. 2348–2353 DOI: 10.1021/acsphotonics.8b00143
- [30] Pei-Ling Luo, Er-Chien Horng and Yu-Chan Guan “Fast molecular fingerprinting with a coherent, rapidly tunable dual-comb spectrometer near 3 m” In Physical Chemistry Chemical Physics 21.33 Royal Society of Chemistry (RSC), 2019, pp. 18400–18405 DOI: 10.1039/c9cp03090e
- [31] http://www.cfa.harvard.edu/hitran/
- [32] I.E. Gordon et al. “The HITRAN2020 molecular spectroscopic database” In Journal of Quantitative Spectroscopy and Radiative Transfer, 2021, pp. 107949 DOI: https://doi.org/10.1016/j.jqsrt.2021.107949
- [33] Iain Robinson, Helen L. Butcher, Neil A. Macleod and Damien Weidmann “Hollow waveguide integrated laser spectrometer for 12CO2/12CO2 analysis” In Opt. Express 27.24 OSA, 2019, pp. 35670–35688 DOI: 10.1364/OE.27.035670
- [34] Alex L. Sessions “Isotope-ratio detection for gas chromatography” In Journal of Separation Science 29.12, 2006, pp. 1946–1961 DOI: https://doi.org/10.1002/jssc.200600002
- [35] “Reference and Intercomparison Materials for Stable Isotopes of Light Elements”, TECDOC Series 825 Vienna: INTERNATIONAL ATOMIC ENERGY AGENCY, 1995 URL: https://www.iaea.org/publications/5471/reference-and-intercomparison-materials-for-stable-isotopes-of-light-elements
- [36] Adam J. Fleisher, Hongming Yi, Abneesh Srivastava, Oleg L. Polyansky, Nikolai F. Zobov and Joseph T. Hodges “Absolute 13C/12C isotope amount ratio for Vienna PeeDee Belemnite from infrared absorption spectroscopy” In Nature Physics Springer ScienceBusiness Media LLC, 2021 DOI: 10.1038/s41567-021-01226-y
- [37] D… Griffith “Calibration of isotopologue-specific optical trace gas analysers: a practical guide” In Atmospheric Measurement Techniques 11.11, 2018, pp. 6189–6201 DOI: 10.5194/amt-11-6189-2018
- [38] Tyler B. Coplen, Willi A. Brand, Matthias Gehre, Manfred Gröning, Harro A.. Meijer, Blaza Toman and R. Verkouteren “New Guidelines for 13C Measurements” PMID: 16579631 In Analytical Chemistry 78.7, 2006, pp. 2439–2441 DOI: 10.1021/ac052027c
- [39] D. Bailey, Gang Zhao and Adam J. Fleisher “Precision Spectroscopy of Nitrous Oxide Isotopocules with a Cross-Dispersed Spectrometer and a Mid-Infrared Frequency Comb” PMID: 32942855 In Analytical Chemistry 92.20, 2020, pp. 13759–13766 DOI: 10.1021/acs.analchem.0c01868
- [40] Antonio Castrillo, Hemanth Dinesan, Giovanni Casa, Gianluca Galzerano, Paolo Laporta and Livio Gianfrani “Amount-ratio determinations of water isotopologues by dual-laser absorption spectrometry” In Phys. Rev. A 86 American Physical Society, 2012, pp. 052515 DOI: 10.1103/PhysRevA.86.052515
- [41] Tsachi Tsadok Perets, Rachel Gingold-Belfer, Haim Leibovitzh, David Itskoviz, Hemda Schmilovitz-Weiss, Yifat Snir, Ram Dickman, Iris Dotan, Zohar Levi and Doron Boltin “Optimization of 13C-urea breath test threshold levels for the detection of Helicobacter pylori infection in a national referral laboratory” In Journal of Clinical Laboratory Analysis 33.2, 2019, pp. e22674 DOI: 10.1002/jcla.22674
- [42] Christopher R. Webster and Paul R. Mahaffy “Determining the local abundance of Martian methane and its’ 13C/12C and D/H isotopic ratios for comparison with related gas and soil analysis on the 2011 Mars Science Laboratory (MSL) mission” Methane on Mars: Current Observations, Interpretation and Future Plans In Planetary and Space Science 59.2, 2011, pp. 271–283 DOI: https://doi.org/10.1016/j.pss.2010.08.021
- [43] Paul R. Mahaffy et al. “The Sample Analysis at Mars Investigation and Instrument Suite” In Space Science Reviews 170.1-4 Springer ScienceBusiness Media LLC, 2012, pp. 401–478 DOI: 10.1007/s11214-012-9879-z
- [44] Alfredo Rueda, Florian Sedlmeir, Madhuri Kumari, Gerd Leuchs and Harald G.. Schwefel “Resonant electro-optic frequency comb” In Nature 568.7752 Springer Nature, 2019, pp. 378–381 DOI: 10.1038/s41586-019-1110-x
- [45] Mian Zhang, Brandon Buscaino, Cheng Wang, Amirhassan Shams-Ansari, Christian Reimer, Rongrong Zhu, Joseph M. Kahn and Marko Loncar “Broadband electro-optic frequency comb generation in a lithium niobate microring resonator” In Nature, 2019 DOI: 10.1038/s41586-019-1008-7
- [46] D.D. Nelson, J.B. McManus, S.C. Herndon, M.S. Zahniser, B. Tuzson and L. Emmenegger “New method for isotopic ratio measurements of atmospheric carbon dioxide using a 4.3m pulsed quantum cascade laser” In Applied Physics B 90.2 Springer ScienceBusiness Media LLC, 2008, pp. 301–309 DOI: 10.1007/s00340-007-2894-1
- [47] Lance E. Christensen, Benjamin Brunner, Kasey N. Truong, Randall E. Mielke, Christopher R. Webster and Max Coleman “Measurement of Sulfur Isotope Compositions by Tunable Laser Spectroscopy of SO2” PMID: 18020312 In Analytical Chemistry 79.24, 2007, pp. 9261–9268 DOI: 10.1021/ac071040p
- [48] Pei-Ling Luo “Long-wave mid-infrared time-resolved dual-comb spectroscopy of short-lived intermediates” In Opt. Lett. 45.24 OSA, 2020, pp. 6791–6794 DOI: 10.1364/OL.413754
- [49] Abijith S. Kowligy, David R. Carlson, Daniel D. Hickstein, Henry Timmers, Alexander J. Lind, Peter G. Schunemann, Scott B. Papp and Scott A. Diddams “Mid-infrared frequency combs at 10 GHz” In Opt. Lett. 45.13 OSA, 2020, pp. 3677–3680 DOI: 10.1364/OL.391651