Twisted extreme trans-Neptunian orbital parameter space: statistically significant asymmetries confirmed
Abstract
Asymmetric debris discs have been found around stars other than the Sun; asymmetries are sometimes attributed to perturbations induced by unseen planets. The presence or absence of asymmetries in our own trans-Neptunian belt remains controversial. The study of sensitive tracers in a sample of objects relatively free from the perturbations exerted by the four known giant planets and most stellar flybys may put an end to this debate. The analysis of the distribution of the mutual nodal distances of the known extreme trans-Neptunian objects (ETNOs) that measure how close two orbits may get to each other could be such a game changer. Here, we use a sample of 51 ETNOs together with random shufflings of this sample and two unbiased scattered-disc orbital models to confirm a statistically significant (62) asymmetry between the shortest mutual ascending and descending nodal distances as well as the existence of multiple highly improbably () correlated pairs of orbits with mutual nodal distances as low as 0.2 au at 152 au from the Solar system’s barycentre or 1.3 au at 339 au. We conclude that these findings fit best with the notion that trans-Plutonian planets exist.
keywords:
methods: statistical – celestial mechanics – minor planets, asteroids: general – Kuiper belt: general – Oort Cloud.1 Introduction
Asymmetric debris discs or exoKuiper belts are sometimes the result of perturbations induced by companions (see e.g. Marino et al. 2020; Faramaz et al. 2021; Lovell et al. 2021). When no stellar or substellar companions are detected, the observed asymmetries are often attributed to secular interactions with unseen planets (see e.g. Sende & Löhne 2019, but see also Zderic et al. (2021)). In this respect, our local trans-Neptunian belt is not too different from the so-called exoKuiper belts (see e.g. Hughes, Duchêne & Matthews 2018; Wyatt 2020), but our vantage point does not help in confirming or rejecting the presence of asymmetries out there. The existence of asymmetries or gaps in our local trans-Neptunian belt has been suggested (see e.g. Volk & Malhotra 2017; Li & Jeff Xia 2020; Oldroyd & Trujillo 2021) or rejected (see e.g. Van Laerhoven et al. 2019; Gladman & Volk 2021) based on nearly the same input data and similar diagnostic tools, particularly the statistical analysis of the orbital inclination distributions. In order to produce robust results, the identification of asymmetries in the trans-Neptunian or Kuiper belt requires the study of sensitive tracers in a sample of objects the least possible affected by perturbations from the four known giant planets and most stellar flybys.
A promising instance of tracer and object sample is in the distribution of mutual nodal distances of the extreme trans-Neptunian objects (ETNOs) —TNOs with semimajor axis, au and perihelion distance, au— as discussed by de la Fuente Marcos & de la Fuente Marcos (2021). Using data for 39 ETNOs, de la Fuente Marcos & de la Fuente Marcos (2021) found that the distribution of mutual nodal distances of the studied sample showed a statistically significant asymmetry between the shortest mutual ascending and descending nodal distances, hereinafter the – asymmetry. In addition, a highly improbable pair of ETNOs made of (505478) 2013 UT15 and 2016 SG58 with a mutual ascending nodal distance of 1.35 au at 339 au from the barycentre of the Solar system was uncovered by the analysis; the probability of finding such a pair by chance was estimated to be 0.0002050.000005.
The Dark Energy Survey (DES) has recently announced the discovery of 815 new TNOs (Bernardinelli et al., 2022). After this data release, the ETNO data set now includes 51 objects (an increase of nearly 31 per cent, from 39) and the – distribution has 1275 pairs instead of 741 (a 72 per cent increase). Here, we use this larger data set to further investigate the – asymmetry and the presence of improbable orbit pairs. This Letter is organized as follows. In Section 2, we discuss data and methods. Theoretical expectations from two different models are reviewed in Section 3. The updated distribution of mutual nodal distances is presented and assessed in Section 4. Section 5 shows that the statistically significant asymmetries found by de la Fuente Marcos & de la Fuente Marcos (2021) are confirmed. Our results are discussed in Section 6 and our conclusions are summarized in Section 7.
2 Data and methods
The distribution of the mutual nodal distances of the known ETNOs provides information on how close two orbits may get to each other. The shortest mutual nodal distance is the minimum orbit intersection distance or MOID that, in absence of protective mechanisms such as mean-motion or secular resonances, could be close to the minimum approach distance between two ETNOs; in other words, a sufficiently short nodal distance might be signalling recurrent close flybys and, perhaps, even a past physical connection between two ETNOs. Here, we compute the distribution of the mutual nodal distances of the known ETNOs (51 as of 2-February-2022) as described in appendix A of de la Fuente Marcos & de la Fuente Marcos (2021), using eqs. 16 and 17 in Saillenfest et al. (2017).
For a given pair of objects, the computation of the mutual nodal distances requires the values of semimajor axis, , eccentricity, , inclination, , longitude of the ascending node, , and argument of perihelion, . As in de la Fuente Marcos & de la Fuente Marcos (2021), we have used barycentric values accessed from Jet Propulsion Laboratory’s (JPL) Horizons on-line solar system data and ephemeris computation service111https://ssd.jpl.nasa.gov/?horizons that uses the new DE440/441 general-purpose planetary solution (Park et al., 2021). Data were queried using tools provided by the Python package Astroquery (Ginsburg et al., 2019). Statistical analyses were performed using NumPy (van der Walt, Colbert & Varoquaux, 2011; Harris et al., 2020) and visualized using the Matplotlib library (Hunter, 2007).
3 Theoretical expectations
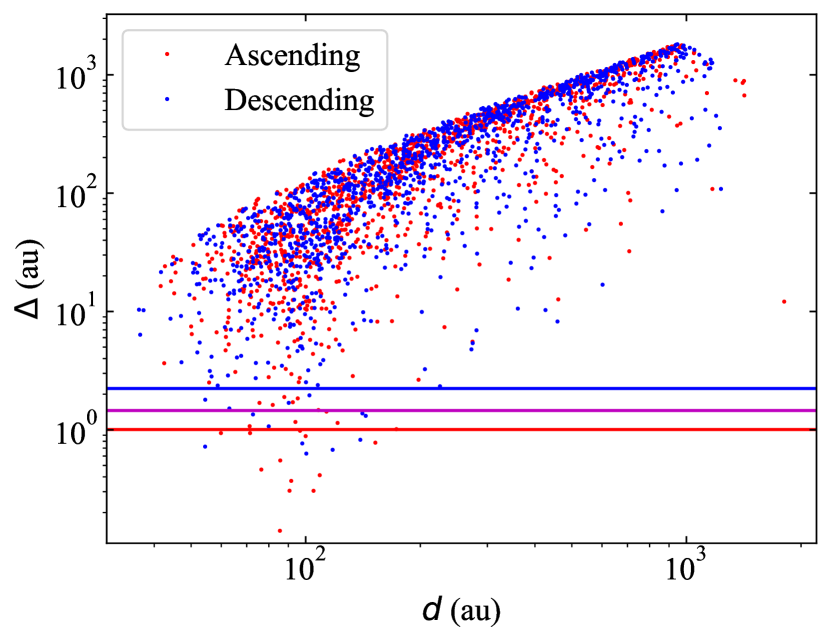
Synthetic ETNOs can be randomly generated in accordance with a nominal scattered-disc model. The study of the distribution of nodal distances of sets of simulated objects can provide an unbiased reference to evaluate the statistical significance of any features identified in the nodal distances distribution of real ETNOs. Following the analysis in de la Fuente Marcos & de la Fuente Marcos (2021), we have considered the scattered-disc models discussed by Brown (2001, 2017) and Napier et al. (2021). The single difference between both models is in the (, , ) set of parameters. While Napier et al. (2021) favours a model in which follows the distribution and is uniformly distributed in the interval (0.69, 0.999), Brown (2001, 2017) argues for a uniform distribution in both and . As described in appendix C of de la Fuente Marcos & de la Fuente Marcos (2021) and for the latter scattered disc model, follows a uniform distribution in the interval (150, 1000) au, is also uniform in the interval (30, 100) au, the angular elements and are drawn from a uniform distribution in the interval (0°, 360°), and follows the so-called Brown distribution of inclinations (Brown, 2001, 2017) in the interval (0°, 60°).
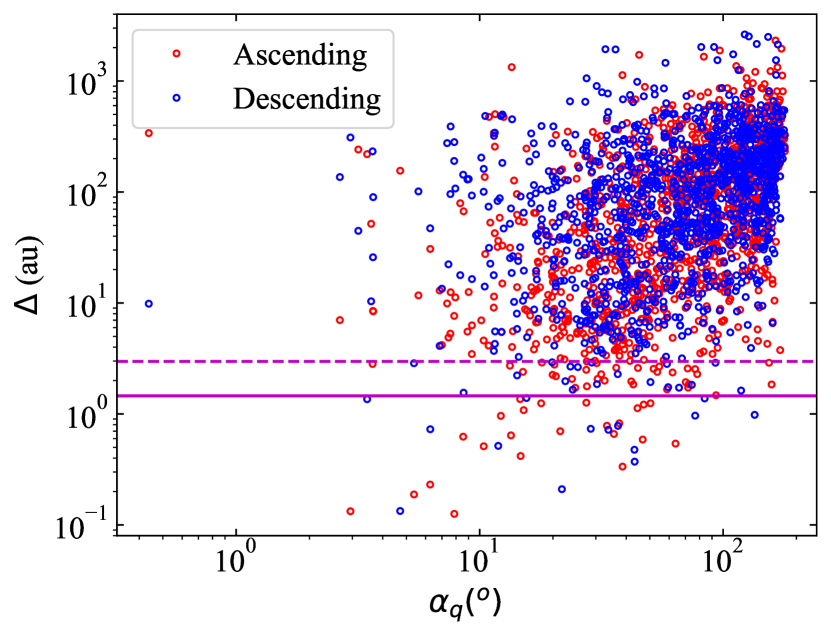
Figure 1 shows representative distributions of both scattered-disc models corresponding to 51 synthetic ETNOs. In de la Fuente Marcos & de la Fuente Marcos (2021) and after analyzing 10 instances of 104 synthetic ETNOs each (or 49995000 pairs per instance) randomly generated in accordance with Brown (2001, 2017), it was found that the first percentile (that signals extreme outliers) of was 1.4600.009 au and the one for was 1.4500.009 au, which implies that, under the assumptions in this model, the median and 16th and 84th percentiles of the first percentiles of the mutual ascending and descending nodal distances must be identical. A similar result was found for the model in Napier et al. (2021), but in this case the first percentile of is 2.98 au and the one for is 2.97 au. Using a steeper slope for the semimajor axis distribution (e.g. ) further increases the value of the extreme outliers threshold. In the following, we will consider 1.455 au as a reference for the first percentile value of .
4 Updated nodal distances distribution
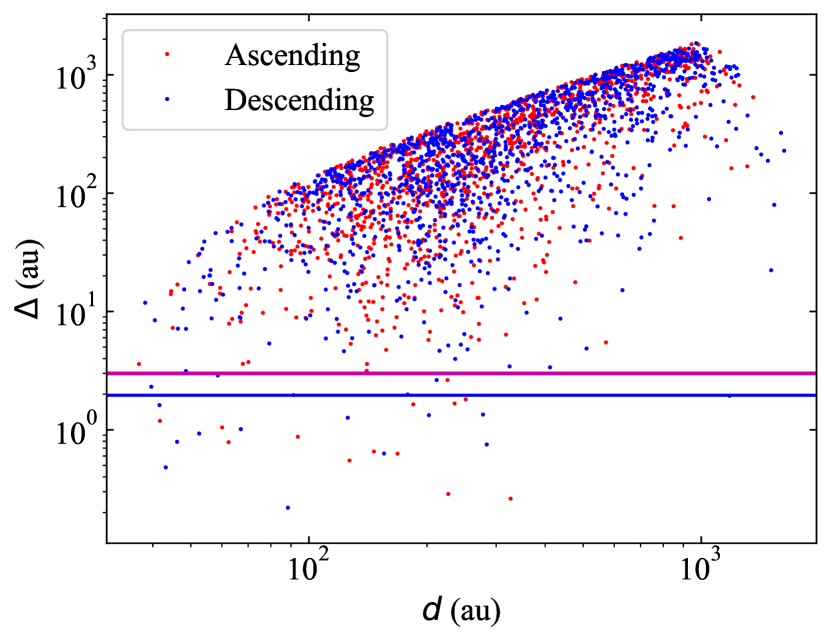
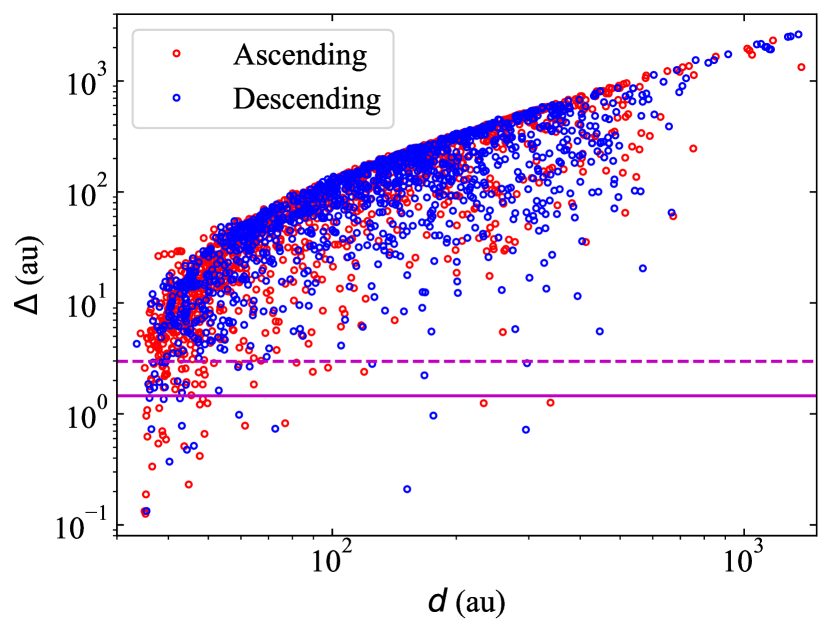
The nodal distances distribution corresponding to the 51 known ETNOs or 1275 pairs was computed as described in appendix A of de la Fuente Marcos & de la Fuente Marcos (2021), taking into account both the nominal (mean) values of the barycentric orbital elements and their uncertainties. Figure 2 shows the median values of the mutual nodal distances as a function of the average barycentric distance to the node. The values of mutual nodal distances of ascending nodes, , are displayed in red and those of descending nodes, , in blue. As in de la Fuente Marcos & de la Fuente Marcos (2021) and in order to identify severe outliers, we use the first percentile of the distribution (see e.g. Wall & Jenkins 2012) that is 0.7680.004 au for and 1.3920.010 au for (means and standard deviations from 10 experiments).
We have tested the significance of the correlations found above by shuffling the orbital elements: the Fisher–Yates shuffle (Fisher & Yates, 1938; Knuth, 1969) in the form implemented in Python’s random.shuffle was applied to each orbital element independently to produce a random permutation of the original sequence. Each randomized data set (sampling 51 orbits times) was processed as the original one was. When considering the nominal values of the orbital elements =1.353 au; if both mean values and uncertainties are included in the shuffling process, then =1.454 au. This randomization test shows that by removing any existing correlations in the data set, the – asymmetry is also removed. We interpret this result as signalling that the asymmetry is intrinsic to the data set and not an artifact or due to chance. On the other hand, =1.454 au is close to the value =1.3920.010 au (but statistically inconsistent, 6.2); we interpret this as evidence in favour of the mutual descending nodes being rather randomly distributed while the distribution of mutual ascending nodes not being statistically compatible (171.5) with a random one.
On the other hand, de la Fuente Marcos & de la Fuente Marcos (2021) found one highly improbably correlated pair of orbits; with the new data, we found five pairs of ETNOs with mutual nodal distances below the first percentile of the distribution and barycentric distance above 150 au. The five pairs are ( as median value and 16th and 84th percentiles): (527603) 2007 VJ305 and 2015 VQ207 with au at 152 au, (594337) 2016 QU89 and 2016 SA59 with au at 295 au, (496315) 2013 GP136 and 2014 SX403 with au at 176 au, 527603 and 2013 RC156 with au at 233 au, and (505478) 2013 UT15 and 2016 SG58 with au at 339 au. As for the statistical significance of these highly improbably correlated pairs within the context of the randomized data set, the probability of having mutual nodal distances below the first percentile of the distribution at a barycentric distance above 300 au is 0.000145070.00000013 and that of having mutual nodes closer than 0.25 au beyond 150 au is 0.0001344400000004. It is therefore confirmed that within the known ETNOs data set, the five pairs pointed out above are indeed remarkable.
5 Statistically significant asymmetries confirmed
In Section 3, we have shown that au and au. The respective values obtained by de la Fuente Marcos & de la Fuente Marcos (2021) were 1.4500.010 au and 2.3350.014 au (for 39 ETNOs or 741 pairs and also from 10 experiments). Therefore, the new data confirm that the distribution of mutual nodal distances has a statistically significant asymmetry between the shortest mutual ascending and descending nodal distances, this time at the 62 level (63 in de la Fuente Marcos & de la Fuente Marcos 2021).
On the other hand, de la Fuente Marcos & de la Fuente Marcos (2021) found that the peculiar pair of ETNOs made of (505478) 2013 UT15 and 2016 SG58 had a mutual ascending nodal distance of 1.35 au at 339 au from the Sun. With the new data, 505478 and 2016 SG58 have au at 339 au and we found four new pairs of ETNOs with mutual nodal distances within the first percentile of the distribution and barycentric distance above 150 au. Within the context of the randomized data set discussed above, these five pairs of ETNOs are highly improbably correlated as the probability of having mutual nodal distances below the first percentile of the distribution at a barycentric distance above 300 au is as low as 0.000145070.00000013.
In Fig. 1, both models fail to reproduce the high density of large nodal distances observed at barycentric distances below 100 au in Fig. 2, although the model in Brown (2001, 2017) appears to produce better results. The actual value of for the sample of 51 known ETNOs is 1.3920.010 au that is somewhat consistent with the one from the scattered-disc model discussed by Brown (2001, 2017), but incompatible with that of Napier et al. (2021).
As for the statistical significance of ETNO pairs like the ones pointed out above within the context of the scattered-disc model discussed by Brown (2001, 2017), the analysis of experiments sampling 51 synthetic orbits each indicates that the probability of finding five pairs with au at a barycentric distance above 150 au is 0.05770.0013 that suggests that the five ETNO pairs could indeed be unusual, although the evidence may not be fully conclusive as there is nearly 6 per cent chance of obtaining a result at least as extreme as the one observed using the scattered-disc model discussed by Brown (2001, 2017).
6 Discussion
The larger ETNO data set assembled thanks to the recent DES data release (Bernardinelli et al., 2022) has led to significant improvements in the results initially reported by de la Fuente Marcos & de la Fuente Marcos (2021). Although it is difficult to argue against the reality of the – asymmetry and the number of strongly correlated orbits seems to defy predictions from two scattered-disc models, the source of these features is still unclear.
Following, e.g., Napier et al. (2021) one may argue that observational bias could be the source of the features observed here; in particular, if the components of some or all the peculiar pairs of ETNOs pointed out above were discovered by the same survey or at similar locations in the sky, observational bias could not be easily rejected as irrelevant. Table 1 shows the discovery circumstances of the members of the pairs discussed above. No components of a given pair were found by the same survey and only one pair had both components appearing closely projected at discovery time, (594337) 2016 QU89 and 2016 SA59. Observational bias may not be the source of the highly improbably correlated pairs.
| Object | disc. date | obs. | ||||
|---|---|---|---|---|---|---|
| (h:m:s) | (°:′:″) | (au) | (″ h-1) | |||
| 496315 | 2013-Apr-04 | 14:07:32.88 | 11:09:38.8 | 45.4 | 2.63 | O |
| 505478 | 2013-Oct-31 | 00:54:20.28 | 05:12:29.1 | 61.2 | 1.91 | O |
| 527603 | 2007-Nov-04 | 00:29:31.74 | 00:45:45.0 | 35.2 | 2.60 | A |
| 594337 | 2016-Aug-25 | 02:44:19.76 | 00:38:53.5 | 35.5 | 1.20 | D |
| 2013 RC156 | 2013-Sep-04 | 20:02:16.73 | 51:57:29.2 | 38.6 | 2.46 | D |
| 2014 SX403 | 2014-Sep-25 | 00:44:30.34 | 23:49:43.1 | 41.1 | 3.12 | D |
| 2015 VQ207 | 2015-Nov-05 | 00:40:57.35 | 24:29:07.9 | 31.4 | 2.70 | D |
| 2016 SA59 | 2016-Sep-28 | 02:41:32.23 | 00:17:00.2 | 40.7 | 2.52 | M |
| 2016 SG58 | 2016-Sep-27 | 02:35:41.45 | 01:05:18.7 | 36.1 | 2.70 | M |
On the other hand, objects with au may still experience close interactions with Neptune that perhaps could induce the observed features. A more selective criterion to avoid this issue is to make the cut at larger (e.g. 37 au or 40 au). Considering au, there are 21 ETNOs or 210 pairs and a similar analysis gives au and au, which confirms a statistically significant (90) asymmetry. On the other hand, four out of nine objects (44 per cent) in Table 1 have perihelion distance au; two out of nine (22 per cent) have au. However, none of the pairs have both members with au.
Other than bias and the influence of Neptune, perhaps the simplest conjecture with which one may try to account for the observed features is in assuming that they are linked to the presence of families, analogues of the well-studied asteroid families present in the main asteroid belt. The subject of finding collisional families of TNOs has been explored by Chiang et al. (2003) and Marcus et al. (2011). Collisional asteroid families have already been found in the regular trans-Neptunian space: the first confirmed family found in the outer Solar system was the one associated with dwarf planet Haumea (Brown et al., 2007) although a candidate collisional family had previously been proposed by Chiang (2002) and later confirmed by de la Fuente Marcos & de la Fuente Marcos (2018), who found four new candidate collisional families of TNOs and a number of unbound TNOs that may have a common origin. However, arguments against the collisional ETNO family conjecture come from different lines of reasoning. On the one hand, there is only one object in common between the five pairs of ETNOs with highly improbably correlated orbits, (527603) 2007 VJ305, that is a member of two pairs but with nodes at rather different barycentric distances. On the other hand, Fig. 3 shows that the unusual pairs have values of the angular separation between orbital poles, , that are generally above 10° with the one of pair (505478) 2013 UT15–2016 SG58 slightly above 14° and that of pair (594337) 2016 QU89–2016 SA59 being about 23°, the others are higher; the values of the angular separations between perihelia, , are also relatively large. In sharp contrast, the values of and are expected to be small when objects come from a recent fragmentation event (see e.g. de la Fuente Marcos & de la Fuente Marcos 2018). The values of and were computed as described in appendix B of de la Fuente Marcos & de la Fuente Marcos (2021).
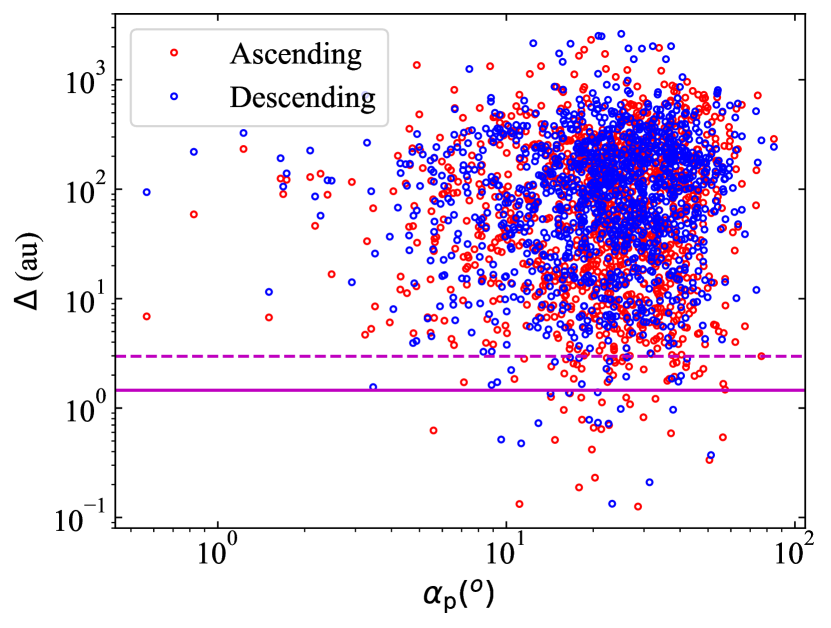
The orbital pole is the intersection between the celestial sphere and a hypothetical axis perpendicular to the plane of the orbit under study. The direction of perihelia is the intersection between the celestial sphere and a hypothetical line that goes from the focus of the orbit towards the point where the orbit under study reaches perihelion. Using observational data, de la Fuente Marcos & de la Fuente Marcos (2018) showed that any fragments produced by a relatively recent disruption event must have low values of and , probably under 2°; fragments from an old disruption episode may have values of uniformly distributed in the interval (0°, 180°) and a wide range in the values of . The distribution of (histogram not shown) is far from uniform. The pairs with low values of and in Fig. 3 all have mutual nodal distances well above the first percentile of the distribution. All this evidence points away from a collisional origin for the highly correlated ETNOs.
The fact remains that some pairs of ETNOs have one improbably close mutual nodal distance and that a mechanism must exist to help keeping them that close for a period of time long enough to make them identifiable even in relatively small samples as the one studied here. Close encounters with a massive planetary perturber may play that role. Small mutual nodal distances have been found for a number of members of the 29P/Schwassmann-Wachmann 1 comet complex; in this case, nodes of Centaurs are kept close by Jupiter (de la Fuente Marcos et al., 2021). Variations of this scenario within the context of the ETNOs have been explored by de León, de la Fuente Marcos & de la Fuente Marcos (2017) and de la Fuente Marcos, de la Fuente Marcos & Aarseth (2017). However, the barycentric distances of the five relevant pairs singled out above show a significant dispersion, so either one planetary perturber moves in an eccentric orbit (e.g. 250 au and 0.4) or multiple perturbers might be necessary to produce the observed effects. The unlikely presence (due to its intrinsically low probability) of a triplet among the outlier pairs might also be signalling the influence of trans-Plutonian perturber(s). It is unclear if the mechanism proposed by Zderic et al. (2021) could be able to produce the observed features; although it leads to a lopsided outer Solar system, it does it via apsidal clustering, which may not be present in the real data (see e.g. Napier et al. 2021).
7 Conclusions
Kuiper belt analogues or exoKuiper belts exhibit a diversity of asymmetries and some of them could be caused by unseen planets (see e.g. Hughes, Duchêne & Matthews 2018; Wyatt 2020). The question of whether or not our Solar system hosts an asymmetric trans-Neptunian belt has been asked for decades. This Letter argues that, thanks to the new data, we might have finally got a definite answer to this important conundrum. The main conclusions of our study are:
-
(i)
We confirm the presence of a statistically significant (62) asymmetry between the shortest mutual ascending and descending nodal distances in a sample of 51 ETNOs.
-
(ii)
We confirm the existence of five highly improbably correlated pairs of orbits with mutual nodal distances as low as 0.2 au at 152 au from the Solar system’s barycentre or 1.26 au at 339 au.
We consider that it is improbable that the features discussed here could result from the presence of collisional families, our findings are more supportive of the existence of trans-Plutonian planets.
Acknowledgements
We thank the referee for constructive and insightful reports, S. J. Aarseth, J. de León, J. Licandro, A. Cabrera-Lavers, J.-M. Petit, M. T. Bannister, D. P. Whitmire, G. Carraro, E. Costa, D. Fabrycky, A. V. Tutukov, S. Mashchenko, S. Deen, and J. Higley for comments on ETNOs, A. B. Chamberlin for helping with the new JPL’s Solar System Dynamics website, and A. I. Gómez de Castro for providing access to computing facilities. This work was partially supported by the Spanish ‘Ministerio de Economía y Competitividad’ (MINECO) under grant ESP2017-87813-R and the ‘Agencia Estatal de Investigación (Ministerio de Ciencia e Innovación)’ under grant PID2020-116726RB-I00 /AEI/10.13039/501100011033. In preparation of this Letter, we made use of the NASA Astrophysics Data System and the MPC data server.
Data Availability
The data underlying this paper were accessed from JPL’s Horizons (https://ssd.jpl.nasa.gov/?horizons). The derived data generated in this research will be shared on reasonable request to the corresponding author.
References
- Bernardinelli et al. (2022) Bernardinelli P. H. et al., 2022, ApJS, 258, 41
- Brown (2001) Brown M. E., 2001, AJ, 121, 2804
- Brown (2017) Brown M. E., 2017, AJ, 154, 65
- Brown et al. (2007) Brown M. E., Barkume K. M., Ragozzine D., Schaller E. L., 2007, Nature, 446, 294
- Chiang (2002) Chiang E. I., 2002, ApJ, 573, L65
- Chiang et al. (2003) Chiang E. I., Lovering J. R., Millis R. L., Buie M. W., Wasserman L. H., Meech K. J., 2003, Earth, Moon, and Planets, 92, 49
- Faramaz et al. (2021) Faramaz V. et al., 2021, AJ, 161, 271
- Fisher & Yates (1938) Fisher R. A., Yates F., 1938, Statistical Tables for Biological, Agricultural, and Medical Research. Oliver and Boyd, London, pp 26–27
- de la Fuente Marcos & de la Fuente Marcos (2018) de la Fuente Marcos C., de la Fuente Marcos R., 2018, MNRAS, 474, 838
- de la Fuente Marcos & de la Fuente Marcos (2021) de la Fuente Marcos C., de la Fuente Marcos R., 2021, MNRAS, 506, 633
- de la Fuente Marcos, de la Fuente Marcos & Aarseth (2017) de la Fuente Marcos C., de la Fuente Marcos R., Aarseth S. J., 2017, Ap&SS, 362, 198
- de la Fuente Marcos et al. (2021) de la Fuente Marcos C., de la Fuente Marcos R., Licandro J., Serra-Ricart M., Martino S., de León J., Chaudry F., Alarcón M. R., 2021, A&A, 649, A85
- de León, de la Fuente Marcos & de la Fuente Marcos (2017) de León J., de la Fuente Marcos C., de la Fuente Marcos R., 2017, MNRAS, 467, L66
- Ginsburg et al. (2019) Ginsburg A. et al., 2019, AJ, 157, 98
- Gladman & Volk (2021) Gladman B., Volk K., 2021, ARA&A, 59, 203
- Harris et al. (2020) Harris C. R. et al., 2020, Nature, 585, 357
- Hughes, Duchêne & Matthews (2018) Hughes A. M., Duchêne G., Matthews B. C., 2018, ARA&A, 56, 541
- Hunter (2007) Hunter J. D., 2007, CSE, 9, 90
- Knuth (1969) Knuth D. E., 1969, The Art of Computer Programming, Vol. 2: Seminumerical algorithms. Addison-Wesley, Reading, MA, pp. 139–140
- Li & Jeff Xia (2020) Li J., Jeff Xia Z., 2020, A&A, 637, A87
- Lovell et al. (2021) Lovell J. B. et al., 2021, MNRAS, 506, 1978
- Marcus et al. (2011) Marcus R. A., Ragozzine D., Murray-Clay R. A., Holman M. J., 2011, ApJ, 733, 40
- Marino et al. (2020) Marino S. et al., 2020, MNRAS, 498, 1319
- Napier et al. (2021) Napier K. J. et al., 2021, PSJ, 2, 59
- Oldroyd & Trujillo (2021) Oldroyd W. J., Trujillo C. A., 2021, AJ, 162, 39
- Park et al. (2021) Park R. S., Folkner W. M., Williams J. G., Boggs D. H., 2021, AJ, 161, 105
- Saillenfest et al. (2017) Saillenfest M., Fouchard M., Tommei G., Valsecchi G. B., 2017, Celest. Mech. Dyn. Astron., 129, 329
- Sende & Löhne (2019) Sende J. A., Löhne T., 2019, A&A, 631, A141
- van der Walt, Colbert & Varoquaux (2011) van der Walt S., Colbert S. C., Varoquaux G., 2011, CSE, 13, 22
- Van Laerhoven et al. (2019) Van Laerhoven C. et al., 2019, AJ, 158, 49
- Volk & Malhotra (2017) Volk K., Malhotra R., 2017, AJ, 154, 62
- Wall & Jenkins (2012) Wall J. V., Jenkins C. R., 2012, Practical Statistics for Astronomers. Cambridge Univ. Press, Cambridge
- Wyatt (2020) Wyatt M., 2020, in Prialnik D., Barucci M. A., Young L., eds, The Trans-Neptunian Solar System. Elsevier, Amsterdam, Netherlands, pp 351–376
- Zderic et al. (2021) Zderic A., Tiongco M., Collier A., Wernke H., Generozov A., Madigan A.-M., 2021, AJ, 162, 278