![[Uncaptioned image]](/html/2202.01386/assets/x2.png)
![]()
|
|
Viscous droplet impingement on soft substrates† |
| Marcus Lin,a Quoc Vo,a Surjyasish Mitra,b and Tuan Tran∗a,b | |
|
|
Viscous droplets impinging on soft substrates may exhibit several distinct behaviours including repeated bouncing, wetting, and hovering, i.e., spreading and retracting after impact without bouncing back or wetting. We experimentally study the conditions enabling these characteristic behaviours by systematically varying the substrate elasticity, impact velocity and the liquid viscosity. For each substrate elasticity, the transition to wetting is determined as the dependence of the Weber number , which measures the droplet’s kinetic energy against its surface energy, on the Ohnesorge number , which compares viscosity to inertia and capillarity. We find that while at the wetting transition monotonically decreases with for relatively rigid substrates, it exhibits a counter-intuitive behaviour in which it first increases then gradually decreases for softer substrates. We experimentally determine the dependence of the maximum Weber number allowing non-wetting impacts on the substrate elasticity and show that it provides an excellent quantitative measure of liquid repellency for a wide range of surfaces, from liquid to soft surfaces and non-deformable surfaces. |
1 Introduction
Droplets impingement on solid surfaces occurs frequently, both in nature, e.g., raindrops falling on leaves, and technological applications, e.g., spray coating and inkjet printing 1, 2, 3, 4. Resulting phenomena — splashing, wetting, bouncing and hovering — occur largely depending on the impact velocity: while wetting and splashing happen for droplets impacting at high velocity 5, 6, bouncing and hovering are often observed for those at low velocity 7, 8, 9. Detailed and mechanistic studies of these phenomena reveal that they are closely related to stability of the air film separating an impacting droplet and a solid surface. Wetting is initiated when the air film 10, 11, 12 is ruptured due to relatively high impact velocity. At higher impact velocity, the lubrication pressure built-up in the air film is sufficiently high to cause splashing, or ejection of spreading lamella 13, 14, 15. In contrast, an impacting droplet rebounds or hovers above the surface for low velocity impacts. In this case, the air film is stable and sustained for a significant duration, allowing the droplet to exhibit non-wetting impact behaviours, similar to water droplets on superhydrophobic surfaces 16, 17, 18, 19, 20, 21. The transition between the two behavioural extremes, non-wetting and wetting droplet impacts, is crucial for either fabrication of surfaces having special functionalities, e.g., self-cleaning, contamination resistant 22, 23, or applications involving high-resolution 3D printing of biomaterials 24. In most of these applications, there are two notable deviations from the bulk of droplet impact studies: the impacted surfaces are not rigid but deformable, and the viscosity of the working liquid is significantly high. The expansion of the parameter space to include surface’s deformity and high liquid viscosity generates numerous impact outcomes, many of which remain unexplored.
On one hand, a solid substrate deforms under impact of a droplet when its rigidity is reasonably low. Deformation of soft substrates with Young’s modulus in the range was found capable of suppressing splashing for high-velocity droplet impacts 6. This is due to early-time substrate deformation, which inhibits break-up of the spreading lamella and prevents it from getting ejected from the surface. At low impact velocity, various impact phenomena were studied for water droplets impacting substrates with shear modulus in the range 7. For surfaces at the lower range of shear modulus, the observed velocity at the transition to wetting increases with the shear modulus for low viscosity liquids, implying that it is more difficult to induce wetting on softer surfaces. In addition, the range of impact velocity for droplet rebound is wider for soft surfaces compared to their rigid counterparts. Interestingly, for water droplets impacting on soft surfaces, air cavities formed in the liquid bulk due to capillary-induced waves were observed near the transition to wetting, suggesting that air cavity formation may alter the wetting mechanism for droplets of low viscosity liquids 7, 9.
On the other hand, the dependence of the transition to wetting on liquid viscosity of impacting droplets has not been conclusive, even for the case of impacts on rigid surfaces. First, for droplets having viscosity mPa s impacting on glass surfaces, the transition to wetting was shown to weakly depend on the viscosity 20. Nonetheless, a dependence on viscosity for transition to wetting at low impact velocity is observed when the viscosity range is expanded to 200 mPa s 25. When droplet viscosity is approximately 200 mPa s, viscous effect becomes dominant and inhibiting to bouncing 25. On soft substrates, the transition to wetting for impacting droplets of high viscosity liquids has not been investigated.
In this paper, we experimentally study the behaviours of viscous droplets impinging on soft substrates by systematically varying the substrate elasticity , impact velocity and liquid viscosity . We then investigate how influences the transition to wetting while varying the substrate elasticity . We explore the connection between air cavity formation in the bulk of impacting droplets and the transition to wetting, in particular how this connection changes for impacts on softer substrates. Finally, we quantify the ability of soft substrates in repelling droplets by determining the maximum Weber number allowing non-wetting behaviour in the explored ranges of substrate elasticity and liquid viscosity.
2 Methods and Materials
To fabricate soft substrates on glass slides, we use Polydimethylsiloxane (PDMS) (Dow Corning, Sylgard®184). The monomer to cross-linker weight ratio is varied between 50:1 and 10:1; correspondingly, the resulting Young’s modulus of the substrate is varied from 30 kPa to 900 kPa. For each batch of fabricated substrates, we measure the Young’s modulus of a representative sample by a rheometer (Discovery Hybrid, TA Instrument). The thickness of all substrates is kept fixed at mm to ensure negligible end effects caused by the glass slides 26.
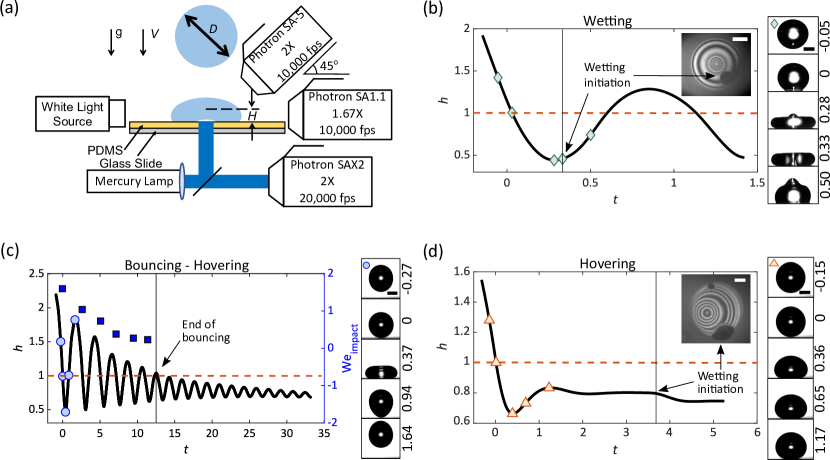
Fig. 1a shows the schematic of our experimental setup. We generate droplets by using a syringe pump to dispense glycerol-water mixture from a flat-tipped needle. We set the pumping rate at 1l/min, sufficiently small to cause droplet detachment from the needle by gravitational force. The droplet diameter is kept fixed at 2.66 0.14 mm. The viscosity of glycerol-water mixtures is varied between 5.0 mPa s to 905.7 mPa s 27, 28. As a result, the corresponding Ohnesorge number, defined as , varies between 0.011 and 1.973. Here, and respectively are the density and surface tension of the mixtures. Once a droplet is detached from the needle, it impinges on a soft substrate with impact velocity , which is varied from 0.17 ms-1 to 0.60 ms-1 by adjusting the needle’s height. Correspondingly, the Weber number, defined as , changes from 0.9 to 16.0.
We record impact behaviours of all droplets from top, bottom and side views using three synchronous high-speed cameras (SA-5, SA-X2 and SA1.1, Photron) operating at 10,000, 10,000 and 20,000 frames per second, respectively (see Fig. 1a). The top-view camera, used to observe air cavity formation in the liquid bulk, is positioned to record impacting droplets at an angle of 45∘ to the horizontal direction. A objective was used with the top-view camera to provide a spatial resolution of 10m per pixel. The side-view camera is connected to a objective to obtain a spatial resolution of 11.97m per pixel. The bottom-view camera, illuminated coaxially using a mercury lamp with a mercury line bandpass filter (wavelength nm), is used to obtain interferometric recordings of the air films between impacting droplets and soft substrates. A objective was used with the bottom-view camera to provide a spatial resolution of 10m per pixel. We use bottom-view recordings to detect wetting initiation during impacts of droplets (insets in Fig. 1b and d).
3 Results and Discussions
In this section, we first examine characteristic impact behaviours observed with varying impact velocity , droplet viscosity , and substrate elasticity . We then focus on the effect of substrate elasticity on the transition between the two major behaviours: wetting and non-wetting. Finally, we discuss the maximum Weber number allowing non-wetting behaviour and how it depends on the substrate elasticity.
3.1 Characteristic impact behaviours of droplets on soft substrates
We observe three characteristic behaviours during impacts of droplets on soft substrates. In the wetting behaviour, a droplet impinging on a soft substrate first reaches its maximum deformation before wetting initiates. In Fig. 1b, we show a representative plot of the dimensionless centre-of-mass height, defined as , versus the dimensionless time . Here, the centre-of-mass height of a droplet during impact is determined using side-view recordings, assuming that the droplet is axisymmetrical; is the Rayleigh timescale with the prefactor 29. The specific conditions in this experiment are , and . We note that wetting initiation at is detected using bottom-view interferometry.
In the so-called bouncing-hovering behaviour, a droplet impacts and bounces multiple times before transitioning into the so-called hovering state in which it periodically deforms without detaching from the substrate. We note that the droplet transitions from bouncing to hovering when the peak value within one impact cycle of becomes smaller than 1, as exemplified in Fig. 1c. In this particular example, both and are the same as those shown in Fig. 1b, but the Weber number is reduced from to . The droplet bounces several times with decreasing due to viscous dissipation within the droplet. Eventually becomes smaller than 1, signifying substantial loss of total kinetic energy to viscous dissipation. It is remarkable that although the bottom surface of the droplet does not appear to leave the soft surface during hovering, its periodic deformation enables the air film separating the droplet and the soft surface to replenish and sustain for a significant duration. For the experiment shown in Fig. 1c, the time to wetting is , considerably larger than that in the wetting behaviour ().
In the so-called hovering behaviour, typically observed for droplets of high viscosity liquids, an impacting droplet first reaches its maximum deformation, then hovers and eventually wets the soft substrate. In Fig. 1d, we show a plot of versus for this behaviour in a representative experiment whereby and are similar to those in Fig. 1c, but the Ohnesorge increases from to . In this case, the droplet reaches its maximum and retracts without either detaching from the surface or oscillating. The hovering state in this case, therefore, differs from that of the bouncing-hovering behaviour in that there is no periodic deformation of the droplet. As a result, the air film under the droplet is not replenished and irreversibly drained, leading to its rupture at .
We highlight the difference between the wetting behaviour (Fig. 1b) and hovering behaviour (Fig. 1d). Although wetting eventually occurs for all impacts due to draining of the air film separating an impacting droplet and a surface, wetting is initiated at widely varying durations after impact. In the wetting regime, wetting occurs within a very short time after impact, e.g., in Fig. 1b, and is similar to the non-dimensionalised crashing time , e.g., for the experiment shown in Fig. 1b. In contrast, wetting in the hovering regime is initiated at , far beyond the crashing time . Furthermore, the droplet in the hovering regime goes through a duration in which it appears floating on the surface without any significant oscillation.
3.2 Transition to wetting of impacting droplets on soft substrates
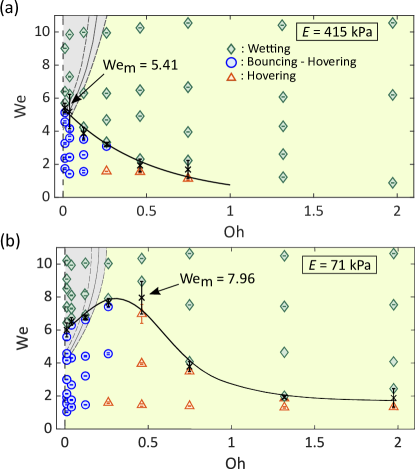
We now focus on the conditions enabling the transition to wetting from the non-wetting behaviours, which include those exhibiting either bouncing-hovering or hovering characteristics. In Fig. 2, we show phase diagrams of the characteristic behaviours obtained on a relatively rigid substrate, with kPa (Fig. 2a) and a much softer one, with kPa (Fig. 2b). The phase diagrams are obtained in the parameter space by varying between and and between and . Typically, we note that the non-wetting and wetting regimes are well separated, and the transition to wetting can be experimentally determined at the dividing line between these regimes. For the impact behaviours obtained on the substrate having kPa, the Weber number at the wetting transition decreases monotonically with increasing , as indicated by the black thick line in Fig. 2a. To understand this dependence, we note that increasing liquid viscosity, or equivalently increasing , reduces the volume of air trapped under impacting droplets 30 and subsequently facilitates wetting initiation. As a result, impacting droplets having higher requires lower to transition to wetting. This is also consistent with our experimental data obtained on other relatively stiff substrates, i.e., kPa.
For softer substrates, exemplified by the one shown in Fig. 2b with kPa, the transition to wetting generally occurs at a higher as the soft substrate acts as a cushion allowing the trapped air film to sustain higher impact energy without being ruptured. Interestingly, we observe a non-intuitive change in the wetting transition for the softer substrate (kPa) compared to its rigid counterpart (kPa). At low Ohnesorge number, the required Weber number for wetting transition first increases with to reach a peak value at and then reduces gradually to reach a plateau. The change in the wetting transition on soft substrates becomes more pronounced with decreasing . This suggests another mechanism causing wetting initiation other than viscosity-induced reduction in volume of the trapped air film under impacting droplets.
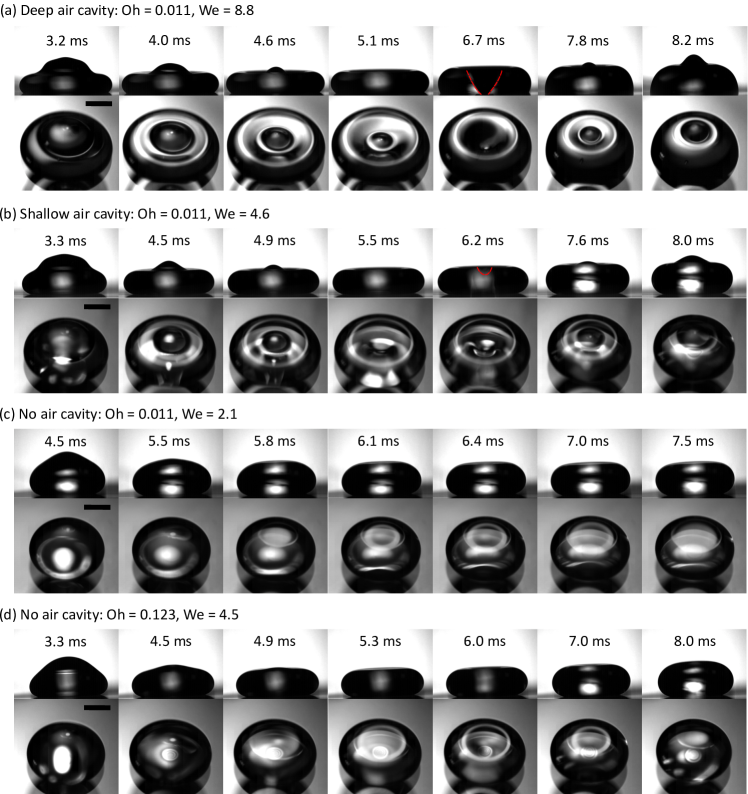
We seek to understand the increase in the required for wetting transition, i.e., the positive slope portion, by noting that there is a region in the phase diagram in which air cavity formation is observed from top surfaces of impacting droplets during the spreading phase (see Fig. 3). This region overlaps with the positive slope portion of the wetting transition, suggesting a connection between air cavity formation and wetting initiation. We note that this type of air cavities forms after the top of an impacting droplet takes a pyramidal shape, which is caused by convergence of capillary waves travelling upwards from the impact point 31, 32, 9, 33. Numerous droplet impact studies reported the occurrence of such air cavities and showed that they were the enabling factor of various phenomena, ranging from jet formation to dimple inversion 31, 32, 9, 33. There are also strong evidences showing that air cavity development causes rupture of the air film trapped between an impacting droplet and a solid surface 34, 9. This can be connected to a pressure surge at the impact point when the droplet reaches its maximum deformation 31, 35. In our experiment, we observe air cavity development for at the lowest value of Ohnesorge number (), regardless of the substrate’s elasticity. With increasing , the required for air cavity formation increases, as indicated by the grey thin lines in both Fig. 2a and b. Remarkably, the decrease in the dependence of on at the wetting transition occurs when air cavity formation is absent.
We attribute the occurrence of air cavity to the positive slope portion of at the wetting transition. We note that air cavity is formed when the capillary waves traveling to the top without being significantly damped 31, 36, 37, thus increasing the liquid viscosity, or equivalently , requires higher to generate and sustain the waves until they reach the droplet’s top apex. In Fig. 3b and Fig. 3d, we show how capillary waves are diminished by keeping the same Weber number () but increasing from 0.011 to 0.123. Since increasing diminishes capillary waves and subsequently air cavity formation, wetting is less likely to occur, suggesting that impacts with higher requires higher to transition to the wetting regime. Indeed, for all of our substrate’s elasticity, the positive slope in the dependence of on for wetting transition is mostly associated with air cavity formation, as shown in Fig. 4. Beyond the range of Ohnesorge number that allows capillary waves and air cavity formation, the transition to wetting recovers its typical characteristics, i.e., monotonically decreases in the required with increasing .
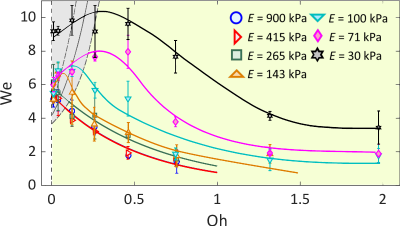
To further understand how the transition to wetting changes with softer substrates, we show in the phase diagram all the transitions to wetting obtained on substrates with the Young’s modulus varying in the range (Fig. 4). In this phase diagram, we also show the region in which air cavity formation is observed for all explored values of . First, we observe that the required Weber number to transition to wetting is lowest for the most rigid substrates, e.g., for kPa and kPa, the maximum Weber number allowing non-wetting impacts is at , similar to the Weber number allowing air cavity formation (). With softer substrates, non-wetting impacts are possible at higher Weber number, which facilitates air cavity formation. As a result, softening the substrate affects the wetting transition in an indirect way. On one hand, a sufficiently soft substrate acts as a cushion allowing the trapped air film to sustain higher impact energy without ruptures. On the other hand, higher impact energy (equivalently higher ) facilitates air cavity formation. The overlap between wetting transition and air cavity formation occurs at the limit of low Ohnesorge number and causes the increase in the required for wetting transition.
3.3 Maximum impact energy for non-wetting behaviour
In this section, we focus on the maximum impact energy, i.e., measured by the Weber number, that non-wetting behaviour is still possible. For stiff substrates where the transition to wetting monotonically decreases with , the maximum Weber number allowing non-wetting behaviour is found at the smallest value of , i.e., . For relatively softer substrates where the transition to wetting first increases and then decreases, is found at the peak of the transition. We note that for a particular substrate with Young’s modulus , the maximum Weber number at the wetting transition is determined experimentally using the phase diagram (see Fig. 2). As a result, depends on the specific liquid (or ) and represents the substrate’s ability to repel droplets without wetting.
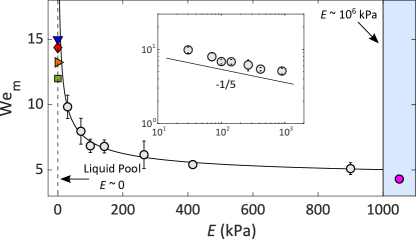
In Fig. 5, we show how depends on substrate elasticity and how this dependence compares with data obtained on the two extreme cases: rigid surfaces with kPa 20 and liquid layers with 38, 39, 40, 41. We observe that unequivocally reduces with increasing , confirming that soft substrates repel liquid droplets more efficiently than their rigid counterparts. We also find that the reduction of with is consistent with the scaling law , as shown in the inset of Fig. 5. Our data obtained for in the range from kPa to kPa nicely bridge the two extreme cases of surface stiffness, from the case of ideally negligible elasticity () and high chance of droplet rebounce to the one of undeformable surface (kPa) with low chance of rebounce.
4 Concluding remarks
In summary, we have experimentally studied the impact characteristics of glycerol-water mixture droplets on PDMS substrates with Young’s modulus varying from kPa to kPa. By varying the mixture viscosity from 5.0 mPa s to 905.7 mPa s (equivalently from 0.011 to 1.973) and the impact velocity from 0.17 ms-1 to 0.60 ms-1 (or from 0.9 to 16.0), we found three characteristic behaviours for a fixed value of elasticity: wetting, bouncing-hovering, i.e., an impacting droplet bounces a few times before transitioning to hovering above the surface, and hovering. Most importantly, we found that the Weber number at the transition to wetting decreases monotonically with increasing for substrates at the upper bound of rigidity (). For softer substrates (), the transition to wetting both increases in Weber number and changes its characteristic to a non-monotonic dependence on : first it increases with to reach a peak value, then gradually decreases to a plateau. Interestingly, we observe a strong link between the increase with at the transition to wetting and air cavity formation in the bulk of impacting droplets. More thorough theoretical and numerical studies are however required to understand the interaction between air cavity formation and the transition to wetting on soft surfaces.
Despite the complex dependence of the transition to wetting on , we found that a maximum Weber number allowing non-wetting behaviour may serve as an excellent indicator of a surface’s capacity in rebouncing impinging droplets. This is quantified by the elasticity dependence of , which was found consistent with the scaling law in the explored range of , from kPa to kPa. This experimental scaling law further extends past studies of droplets impacting liquid pools 38, 39, 40, 41, and those on non-deformable surfaces 20 and may be useful in applications involving actuation of viscous droplets on soft materials.
Author Contributions
M.L., Q.V. and T.T. conceived the research idea. M.L. performed the experiment and data analysis. M.L., Q.V., S.M. and T.T. discussed the results and wrote the manuscript.
Conflicts of interest
There are no conflicts to declare.
Acknowledgements
We acknowledge funding from the Republic of Singapore’s Ministry of Education (MOE, grant number MOE2018-T2-2-113) and the Agency of Science, Technology and Research (A*STAR) through the Pharos initiative (grant number 152 37 00102). M.L. is supported by Nanyang President’s Graduate Scholarship.
Notes and references
- Barthlott and Neinhuis 1997 W. Barthlott and C. Neinhuis, Planta, 1997, 202, 1–8.
- de Gans and Schubert 2004 B.-J. de Gans and U. S. Schubert, Langmuir, 2004, 20, 7789–7793.
- Jia and Qiu 2003 W. Jia and H. H. Qiu, Exp. Therm. Fluid Sci, 2003, 27, 829–838.
- van der Bos et al. 2014 A. van der Bos, M.-J. van der Meulen, T. Driessen, M. van den Berg, H. Reinten, H. Wijshoff, M. Versluis and D. Lohse, Phys. Rev. Appl., 2014, 1, 014004.
- Josserand and Thoroddsen 2016 C. Josserand and S. Thoroddsen, Annu. Rev. Fluid Mech., 2016, 48, 365–391.
- Howland et al. 2016 C. J. Howland, A. Antkowiak, J. R. Castrejón-Pita, S. D. Howison, J. M. Oliver, R. W. Style and A. A. Castrejón-Pita, Phys. Rev. Lett., 2016, 117, 184502.
- Chen et al. 2016 L. Chen, E. Bonaccurso, P. Deng and H. Zhang, Phys. Rev. E, 2016, 94, 063117.
- Ajaev and Kabov 2021 V. S. Ajaev and O. A. Kabov, Annu. Rev. Fluid Mech., 2021, 53, 203–225.
- Mitra et al. 2021 S. Mitra, Q. Vo and T. Tran, Soft Matter, 2021, 17, 5969–5977.
- Thoroddsen et al. 2005 S. T. Thoroddsen, T. G. Etoh, K. Takehara, N. Ootsuka and Y. Hatsuki, J. Fluid Mech., 2005, 545, 203–212.
- Bouwhuis et al. 2012 W. Bouwhuis, R. C. A. van der Veen, T. Tran, D. L. Keij, K. G. Winkels, I. R. Peters, D. van der Meer, C. Sun, J. H. Snoeijer and D. Lohse, Phys. Rev. Lett., 2012, 109, 264501.
- Langley et al. 2020 K. R. Langley, A. A. Castrejón-Pita and S. T. Thoroddsen, Soft Matter, 2020.
- Xu et al. 2005 L. Xu, W. W. Zhang and S. R. Nagel, Phys. Rev. Lett., 2005, 94, 184505.
- Mandre et al. 2009 S. Mandre, M. Mani and M. P. Brenner, Phys. Rev. Lett., 2009, 102, 134502.
- Driscoll and Nagel 2011 M. M. Driscoll and S. R. Nagel, Phys. Rev. Lett., 2011, 107, 154502.
- Chen and Li 2010 L. Chen and Z. Li, Phys. Rev. E, 2010, 82, 016308.
- Kolinski et al. 2012 J. M. Kolinski, S. M. Rubinstein, S. Mandre, M. P. Brenner, D. A. Weitz and L. Mahadevan, Phys. Rev. Lett., 2012, 108, 074503.
- van der Veen et al. 2012 R. C. A. van der Veen, T. Tran, D. Lohse and C. Sun, Phys. Rev. E, 2012, 85, 026315.
- de Ruiter et al. 2012 J. de Ruiter, J. M. Oh, D. van den Ende and F. Mugele, Phys. Rev. Lett., 2012, 108, 074505.
- de Ruiter et al. 2015 J. de Ruiter, R. Lagraauw, D. van den Ende and F. Mugele, Nat. Phys., 2015, 11, 48–53.
- Ruiter et al. 2015 J. d. Ruiter, R. Lagraauw, F. Mugele and D. v. d. Ende, J. Fluid Mech., 2015, 776, 531–567.
- Jung and Bhushan 2008 Y. C. Jung and B. Bhushan, Langmuir, 2008, 24, 6262–6269.
- Bhushan and Jung 2011 B. Bhushan and Y. C. Jung, Prog. Mater. Sci., 2011, 56, 1–108.
- Li et al. 2018 H. Li, C. Tan and L. Li, Mater. Des., 2018, 159, 20–38.
- Jha et al. 2020 A. Jha, P. Chantelot, C. Clanet and D. Quéré, Soft Matter, 2020, 16, 7270–7273.
- Style et al. 2013 R. W. Style, R. Boltyanskiy, Y. Che, J. S. Wettlaufer, L. A. Wilen and E. R. Dufresne, Phys. Rev. Lett., 2013, 110, 066103.
- Cheng 2008 N.-S. Cheng, Ind. Eng. Chem., 2008, 47, 3285–3288.
- Volk and Kähler 2018 A. Volk and C. J. Kähler, Exp Fluids, 2018, 59, 1–4.
- Richard et al. 2002 D. Richard, C. Clanet and D. Quéré, Nature, 2002, 417, 811–811.
- Zhao et al. 2017 B. Zhao, X. Wang, K. Zhang, L. Chen and X. Deng, Langmuir, 2017, 33, 144–151.
- Renardy et al. 2003 Y. Renardy, S. Popinet, L. Duchemin, M. Renardy, S. Zaleski, C. Josserand, M. A. Drumright-Clarke, D. Richard, C. Clanet and D. Quéré, J. Fluid Mech., 2003, 484, 69–83.
- Bartolo et al. 2006 D. Bartolo, C. Josserand and D. Bonn, Phys. Rev. Lett., 2006, 4.
- Chen et al. 2011 L. Chen, J. Wu, Z. Li and S. Yao, Colloids Surf. A Physicochem. Eng., 2011, 384, 726–732.
- Pack et al. 2017 M. Pack, H. Hu, D. Kim, Z. Zheng, H. A. Stone and Y. Sun, Soft Matter, 2017, 13, 2402–2409.
- Nishimura et al. 2018 A. Nishimura, H. Weller, H. Maruoka, M. Takayanagi and H. Ushiki, Open Phys., 2018, 16, 271–284.
- Vo and Tran 2021 Q. Vo and T. Tran, Appl. Phys. Lett., 2021, 118, 161603.
- Vo and Tran 2021 Q. Vo and T. Tran, J. Fluid Mech., 2021, 925, year.
- Zhao et al. 2011 H. Zhao, A. Brunsvold and S. T. Munkejord, Int. J. Multiph, 2011, 37, 1109–1119.
- Tang et al. 2018 X. Tang, A. Saha, C. K. Law and C. Sun, Langmuir, 2018, 34, 2654–2662.
- Tang et al. 2019 X. Tang, A. Saha, C. K. Law and C. Sun, Phys. Fluids, 2019, 31, 013304.
- Wu et al. 2020 Z. Wu, J. Hao, J. Lu, L. Xu, G. Hu and J. M. Floryan, Phys. Fluids, 2020, 32, 012107.