VOS: Learning What You Don’t Know by
Virtual Outlier Synthesis
Abstract
Out-of-distribution (OOD) detection has received much attention lately due to its importance in the safe deployment of neural networks. One of the key challenges is that models lack supervision signals from unknown data, and as a result, can produce overconfident predictions on OOD data. Previous approaches rely on real outlier datasets for model regularization, which can be costly and sometimes infeasible to obtain in practice. In this paper, we present VOS, a novel framework for OOD detection by adaptively synthesizing virtual outliers that can meaningfully regularize the model’s decision boundary during training. Specifically, VOS samples virtual outliers from the low-likelihood region of the class-conditional distribution estimated in the feature space. Alongside, we introduce a novel unknown-aware training objective, which contrastively shapes the uncertainty space between the ID data and synthesized outlier data. VOS achieves competitive performance on both object detection and image classification models, reducing the FPR95 by up to 9.36% compared to the previous best method on object detectors. Code is available at https://github.com/deeplearning-wisc/vos.
1 Introduction
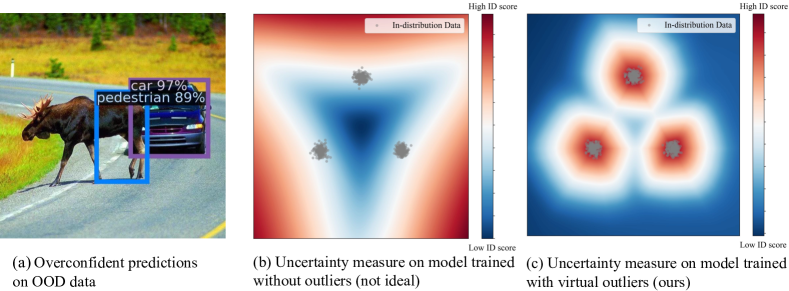
Modern deep neural networks have achieved unprecedented success in known contexts for which they are trained, yet they often struggle to handle the unknowns. In particular, neural networks have been shown to produce high posterior probability for out-of-distribution (OOD) test inputs (Nguyen et al., 2015), which arise from unknown categories and should not be predicted by the model. Taking self-driving car as an example, an object detection model trained to recognize in-distribution objects (e.g., cars, stop signs) can produce a high-confidence prediction for an unseen object of a moose; see Figure 1(a). Such a failure case raises concerns in model reliability, and worse, may lead to catastrophe when deployed in safety-critical applications.
The vulnerability to OOD inputs arises due to the lack explicit knowledge of unknowns during training time. In particular, neural networks are typically optimized only on the in-distribution (ID) data. The resulting decision boundary, despite being useful on ID tasks such as classification, can be ill-fated for OOD detection. We illustrate this in Figure 1. The ID data (gray) consists of three class-conditional Gaussians, on which a three-way softmax classifier is trained. The resulting classifier is overconfident for regions far away from the ID data (see the red shade in Figure 1(b)), causing trouble for OOD detection. Ideally, a model should learn a more compact decision boundary that produces low uncertainty for the ID data, with high OOD uncertainty elsewhere (e.g., Figure 1(c)). However, achieving this goal is non-trivial due to the lack of supervision signal of unknowns. This motivates the question: Can we synthesize virtual outliers for effective model regularization?
In this paper, we propose a novel unknown-aware learning framework dubbed VOS (Virtual Outlier Synthesis), which optimizes the dual objectives of both ID task and OOD detection performance. In a nutshell, VOS consists of three components tackling challenges of outlier synthesis and effective model regularization with synthesized outliers. To synthesize the outliers, we estimate the class-conditional distribution in the feature space, and sample outliers from the low-likelihood region of ID classes (Section 3.1). Key to our method, we show that sampling in the feature space is more tractable than synthesizing images in the high-dimensional pixel space (Lee et al., 2018a). Alongside, we propose a novel unknown-aware training objective, which contrastively shapes the uncertainty surface between the ID data and synthesized outliers (Section 3.2). During training, VOS simultaneously performs the ID task (e.g., classification or object detection) as well as the OOD uncertainty regularization. During inference time, the uncertainty estimation branch produces a larger probabilistic score for ID data and vice versa, which enables effective OOD detection (Section 3.3).
VOS offers several compelling advantages compared to existing solutions. (1) VOS is a general learning framework that is effective for both object detection and image classification tasks, whereas previous methods were primarily driven by image classification. Image-level detection can be limiting as an image could be OOD in certain regions while being in-distribution elsewhere. Our work bridges a critical research gap since OOD detection for object detection is timely yet underexplored in literature. (2) VOS enables adaptive outlier synthesis, which can be flexibly and conveniently used for any ID data without manual data collection or cleaning. In contrast, previous methods using outlier exposure (Hendrycks et al., 2019) require an auxiliary image dataset that is sufficiently diverse, which can be arguably prohibitive to obtain. Moreover, one needs to perform careful data cleaning to ensure the auxiliary outlier dataset does not overlap with ID data. (3) VOS synthesizes outliers that can estimate a compact decision boundary between ID and OOD data. In contrast, existing solutions use outliers that are either too trivial to regularize the OOD estimator, or too hard to be separated from ID data, resulting in sub-optimal performance.
Our key contributions and results are summarized as follows:
-
•
We propose a new framework VOS addressing a pressing issue—unknown-aware deep learning that optimizes for both ID and OOD performance. VOS establishes state-of-the-art results on a challenging object detection task. Compared to the best method, VOS reduces the FPR95 by up to 9.36% while preserving the accuracy on the ID task.
-
•
We conduct extensive ablations and reveal important insights by contrasting different outlier synthesis approaches. We show that VOS is more advantageous than generating outliers directly in the high-dimensional pixel space (e.g., using GAN (Lee et al., 2018a)) or using noise as outliers.
-
•
We comprehensively evaluate our method on common OOD detection benchmarks, along with a more challenging yet underexplored task in the context of object detection. Our effort facilitates future research to evaluate OOD detection in a real-world setting.
2 Problem Setup
We start by formulating the problem of OOD detection in the setting of object detection. Our framework can be easily generalized to image classification when the bounding box is the entire image (see Section 4.2). Most previous formulations of OOD detection treat entire images as anomalies, which can lead to ambiguity shown in Figure 1. In particular, natural images are composed of numerous objects and components. Knowing which regions of an image are anomalous could allow for safer handling of unfamiliar objects. This setting is more realistic in practice, yet also more challenging as it requires reasoning OOD uncertainty at the fine-grained object level.
Specifically, we denote the input and label space by and , respectively. Let be the input image, be the bounding box coordinates associated with object instances in the image, and be the semantic label for -way classification. An object detection model is trained on in-distribution data drawn from an unknown joint distribution . We use neural networks with parameters to model the bounding box regression and the classification .
The OOD detection can be formulated as a binary classification problem, which distinguishes between the in- vs. out-of-distribution objects. Let denote the marginal probability distribution on . Given a test input , as well as an object instance predicted by the object detector, the goal is to predict . We use to indicate a detected object being in-distribution, and being out-of-distribution, with semantics outside the support of .
3 Method
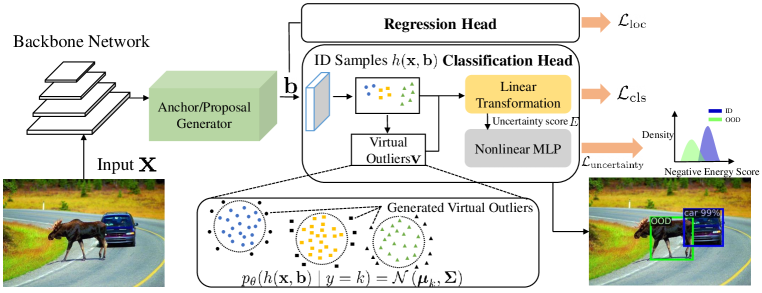
Our novel unknown-aware learning framework is illustrated in Figure 2. Our framework encompasses three novel components and addresses the following questions: (1) how to synthesize the virtual outliers (Section 3.1), (2) how to leverage the synthesized outliers for effective model regularization (Section 3.2), and (3) how to perform OOD detection during inference time (Section 3.3)?
3.1 VOS: Virtual Outlier Synthesis
Our framework VOS generates virtual outliers for model regularization, without relying on external data. While a straightforward idea is to train generative models such as GANs (Goodfellow et al., 2014; Lee et al., 2018a), synthesizing images in the high-dimensional pixel space can be difficult to optimize. Instead, our key idea is to synthesize virtual outliers in the feature space, which is more tractable given lower dimensionality. Moreover, our method is based on a discriminatively trained classifier in the object detector, which circumvents the difficult optimization process in training generative models.
Specifically, we assume the feature representation of object instances forms a class-conditional multivariate Gaussian distribution (see Figure 3):
where is the Gaussian mean of class , is the tied covariance matrix, and is the latent representation of an object instance . To extract the latent representation, we use the penultimate layer of the neural network. The dimensionality is significantly smaller than the input dimension .
To estimate the parameters of the class-conditional Gaussian, we compute empirical class mean and covariance of training samples :
| (1) | ||||
| (2) |
where is the number of objects in class , and is the total number of objects. We use online estimation for efficient training, where we maintain a class-conditional queue with object instances from each class. In each iteration, we enqueue the embeddings of objects to their corresponding class-conditional queues, and dequeue the same number of object embeddings.
Sampling from the feature representation space. We propose sampling the virtual outliers from the feature representation space, using the multivariate distributions estimated above. Ideally, these virtual outliers should help estimate a more compact decision boundary between ID and OOD data.
To achieve this, we propose sampling the virtual outliers from the -likelihood region of the estimated class-conditional distribution:
| (3) |
where denotes the sampled virtual outliers for class , which are in the sublevel set based on the likelihood. is sufficiently small so that the sampled outliers are near class boundary.
Classification outputs for virtual outliers. For a given sampled virtual outlier , the output of the classification branch can be derived through a linear transformation:
| (4) |
where is the weight of the last fully connected layer. We proceed with describing how to regularize the output of virtual outliers for improved OOD detection.
3.2 Unknown-aware Training Objective
We now introduce a new training objective for unknown-aware learning, leveraging the virtual outliers in Section 3.1. The key idea is to perform visual recognition task while regularizing the model to produce a low OOD score for ID data, and a high OOD score for the synthesized outlier.
Uncertainty regularization for classification.
For simplicity, we first describe the regularization in the multi-class classification setting. The regularization loss should ideally optimize for the separability between the ID vs. OOD data under some function that captures the data density. However, directly estimating can be computationally intractable as it requires sampling from the entire space . We note that the log partition function is proportional to with some unknown factor, which can be seen from the following:
where denotes the -th element of logit output corresponding to the label . The negative log partition function is also known as the free energy, which was shown to be an effective uncertainty measurement for OOD detection (Liu et al., 2020a).
Our idea is to explicitly perform a level-set estimation based on the energy function (threshold at 0), where the ID data has negative energy values and the synthesized outlier has positive energy:
This is a simpler objective than estimating density. Since the loss is intractable, we replace it with the binary sigmoid loss, a smooth approximation of the loss, yielding the following:
| (5) |
Here is a nonlinear MLP function, which allows learning flexible energy surface. The learning process shapes the uncertainty surface, which predicts high probability for ID data and low probability for virtual outliers . Liu et al. (2020a) employed energy for model uncertainty regularization, however, the loss function is based on the squared hinge loss and requires tuning two margin hyperparameters. In contrast, our uncertainty regularization loss is completely hyperparameter-free and is much easier to use in practice. Moreover, VOS produces probabilistic score for OOD detection, whereas Liu et al. (2020a) relies on non-probabilistic energy score.
Object-level energy score.
In case of object detection, we can replace the image-level energy with object-level energy score. For ID object , the energy is defined as:
| (6) |
where is the logit output for class in the classification branch. The energy score for the virtual outlier can be defined in a similar way as above. In particular, we will show in Section 4 that a learnable is more flexible than a constant , given the inherent class imbalance in object detection datasets. Additional analysis on is in Appendix G.
Overall training objective.
In the case of object detection, the overall training objective combines the standard object detection loss, along with a regularization loss in terms of uncertainty:
| (7) |
where is the weight of the uncertainty regularization. and are losses for classification and bounding box regression, respectively. This can be simplified to classification task without . We provide ablation studies in Section 4.1 demonstrating the superiority of our loss function.
3.3 Inference-time OOD Detection
During inference, we use the output of the logistic regression uncertainty branch for OOD detection. In particular, given a test input , the object detector produces a bounding box prediction . The OOD uncertainty score for the predicted object is given by:
| (8) |
For OOD detection, one can exercise the thresholding mechanism to distinguish between ID and OOD objects:
| (9) |
The threshold is typically chosen so that a high fraction of ID data (e.g., 95%) is correctly classified. Our framework VOS is summarized in Algorithm 1.
4 Experimental Results
In this section, we present empirical evidence to validate the effectiveness of VOS on several real-world tasks, including both object detection (Section 4.1) and image classification (Section 4.2).
4.1 Evaluation on Object Detection
| In-distribution | Method | FPR95 | AUROC | mAP (ID) |
|---|---|---|---|---|
| OOD: MS-COCO / OpenImages | ||||
| PASCAL-VOC | MSP (Hendrycks & Gimpel, 2017) | 70.99 / 73.13 | 83.45 / 81.91 | 48.7 |
| ODIN (Liang et al., 2018) | 59.82 / 63.14 | 82.20 / 82.59 | 48.7 | |
| Mahalanobis (Lee et al., 2018b) | 96.46 / 96.27 | 59.25 / 57.42 | 48.7 | |
| Energy score (Liu et al., 2020a) | 56.89 / 58.69 | 83.69 / 82.98 | 48.7 | |
| Gram matrices (Sastry & Oore, 2020) | 62.75 / 67.42 | 79.88 / 77.62 | 48.7 | |
| Generalized ODIN (Hsu et al., 2020) | 59.57 / 70.28 | 83.12 / 79.23 | 48.1 | |
| CSI (Tack et al., 2020) | 59.91 / 57.41 | 81.83 / 82.95 | 48.1 | |
| GAN-synthesis (Lee et al., 2018a) | 60.93 / 59.97 | 83.67 / 82.67 | 48.5 | |
| VOS-ResNet50 (ours) | 47.532.9 / 51.331.6 | 88.701.2 / 85.23 0.6 | 48.90.2 | |
| VOS-RegX4.0 (ours) | 47.771.1 / 48.331.6 | 89.000.4 / 87.590.2 | 51.60.1 | |
| Berkeley DeepDrive-100k | MSP (Hendrycks & Gimpel, 2017) | 80.94 / 79.04 | 75.87 / 77.38 | 31.2 |
| ODIN (Liang et al., 2018) | 62.85 / 58.92 | 74.44 / 76.61 | 31.2 | |
| Mahalanobis (Lee et al., 2018b) | 57.66 / 60.16 | 84.92 / 86.88 | 31.2 | |
| Energy score (Liu et al., 2020a) | 60.06 / 54.97 | 77.48 / 79.60 | 31.2 | |
| Gram matrices (Sastry & Oore, 2020) | 60.93 / 77.55 | 74.93 / 59.38 | 31.2 | |
| Generalized ODIN (Hsu et al., 2020) | 57.27 / 50.17 | 85.22 / 87.18 | 31.8 | |
| CSI (Tack et al., 2020) | 47.10 / 37.06 | 84.09 / 87.99 | 30.6 | |
| GAN-synthesis (Lee et al., 2018a) | 57.03 / 50.61 | 78.82 / 81.25 | 31.4 | |
| VOS-ResNet50 (ours) | 44.272.0 / 35.541.7 | 86.872.1 / 88.521.3 | 31.30.0 | |
| VOS-RegX4.0 (ours) | 36.610.9 / 27.241.3 | 89.080.6 / 92.130.5 | 32.50.1 | |
Experimental details. We use PASCAL VOC111PASCAL-VOC consists of the following ID labels: Person, Car, Bicycle, Boat, Bus, Motorbike, Train, Airplane, Chair, Bottle, Dining Table, Potted Plant, TV, Sofa, Bird, Cat, Cow, Dog, Horse, Sheep. (Everingham et al., 2010) and Berkeley DeepDrive (BDD-100k222BDD-100k consists of ID labels: Pedestrian, Rider, Car, Truck, Bus, Train, Motorcycle, Bicycle, Traffic light, Traffic sign.) (Yu et al., 2020) datasets as the ID training data. For both tasks, we evaluate on two OOD datasets that contain subset of images from: MS-COCO (Lin et al., 2014) and OpenImages (validation set) (Kuznetsova et al., 2020). We manually examine the OOD images to ensure they do not contain ID category. We have open-sourced our benchmark data that allows the community to easily evaluate future methods on object-level OOD detection.
We use the Detectron2 library (Girshick et al., 2018) and train on two backbone architectures: ResNet-50 (He et al., 2016) and RegNetX-4.0GF (Radosavovic et al., 2020). We employ a two-layer MLP with a ReLU nonlinearity for in Equation 5, with hidden layer dimension of 512. For each in-distribution class, we use 1,000 samples to estimate the class-conditional Gaussians. Since the threshold can be infinitesimally small, we instead choose based on the -th smallest likelihood in a pool of 10,000 samples (per-class), generated from the class-conditional Gaussian distribution. A larger corresponds to a larger threshold . As shown in Table 6, a smaller yields good performance. We set for all our experiments. Extensive details on the datasets are described in Appendix A, along with a comprehensive sensitivity analysis of each hyperparameter (including the queue size , coefficient , and threshold ) in Appendix C.
Metrics. For evaluating the OOD detection performance, we report: (1) the false positive rate (FPR95) of OOD samples when the true positive rate of ID samples is at 95%; (2) the area under the receiver operating characteristic curve (AUROC). For evaluating the object detection performance on the ID task, we report the common metric of mAP.
VOS outperforms existing approaches. In Table 1, we compare VOS with competitive OOD detection methods in literature. For a fair comparison, all the methods only use ID data without using auxiliary outlier dataset. Our proposed method, VOS, outperforms competitive baselines, including Maximum Softmax Probability (Hendrycks & Gimpel, 2017), ODIN (Liang et al., 2018), energy score (Liu et al., 2020a), Mahalanobis distance (Lee et al., 2018b), Generalized ODIN (Hsu et al., 2020), CSI (Tack et al., 2020) and Gram matrices (Sastry & Oore, 2020). These approaches rely on a classification model trained primarily for the ID classification task, and can be naturally extended to the object detection model due to the existence of a classification head. The comparison precisely highlights the benefits of incorporating synthesized outliers for model regularization.
Closest to our work is the GAN-based approach for synthesizing outliers (Lee et al., 2018a). Compare to GAN-synthesis, VOS improves the OOD detection performance (FPR95) by 12.76% on BDD-100k and 13.40% on Pascal VOC (COCO as OOD). Moreover, we show in Table 1 that VOS achieves stronger OOD detection performance while preserving a high accuracy on the original in-distribution task (measured by mAP). This is in contrast with CSI, which displays degradation, with mAP decreased by 0.7% on BDD-100k. Details of reproducing baselines are in Appendix E.
Ablation on outlier synthesis approaches. We compare VOS with different synthesis approaches in Table 2. Specifically, we consider three types of synthesis approach: (i⋄) synthesizing outliers in the pixel space, (ii♮) using noise as outliers, and (iii♣) using negative proposals from RPN as outliers. For type I, we consider GAN-based (Lee et al., 2018a) and mixup (Zhang et al., 2018) methods. The outputs of the classification branch for outliers are forced to be closer to a uniform distribution. For mixup, we consider two different beta distributions and , and interpolate ID objects in the pixel space. For Type II, we use noise perturbation to create virtual outliers. We consider adding fixed Gaussian noise to the ID features, adding trainable noise to the ID features where the noise is trained to push the outliers away from ID features, and using fixed Gaussian noise as outliers. Lastly, for type III, we directly use the negative proposals in the ROI head as the outliers for Equation 5, similar to Joseph et al. (2021). We consider three variants: randomly sampling negative proposals ( is the number of positive proposals), sampling negative proposals with a larger probability, and using all the negative proposals. All methods are trained under the same setup, with PASCAL-VOC as in-distribution data and ResNet-50 as the backbone. The loss function is the same as Equation 7 for all variants, with the only difference being the synthesis method.
| Method | AUROC | mAP | |
| Image synthesis | ⋄GAN (Lee et al., 2018a) | 83.67 | 48.5 |
| ⋄Mixup (Zhang et al., 2018) (mixing ratio ) | 61.23 | 44.3 | |
| ⋄Mixup (Zhang et al., 2018) (mixing ratio ) | 63.99 | 46.9 | |
| Noise as outliers | ♮Additive Gaussian noise to ID features | 68.02 | 48.7 |
| ♮Trainable noise added to the ID features | 66.67 | 48.6 | |
| ♮Gaussian noise | 85.98 | 48.5 | |
| Negative proposals | ♣All negative proposals | 63.45 | 48.1 |
| ♣Random negative proposals | 66.03 | 48.5 | |
| ♣Proposals with large background prob (Joseph et al., 2021) | 77.26 | 48.5 | |
| VOS (ours) | 88.70 | 48.9 |
The results are summarized in Table 2, where VOS outperforms alternative synthesis approaches both in the feature space (, ) or the pixel space (). Generating outliers in the pixel space () is either unstable (GAN) or harmful for the object detection performance (mixup). Introducing noise (), especially using Gaussian noise as outliers is promising. However, Gaussian noise outliers are relatively simple, and may not effectively regularize the decision boundary between ID and OOD as VOS does. Exploiting the negative proposals () is not effective, because they are distributionally close to the ID data.
Ablation on the uncertainty loss. We perform ablation on several variants of VOS, trained with different uncertainty loss . Particularly, we consider: (1) using the squared hinge loss for regularization as in Liu et al., (2) using constant weight for energy score in Equation 6, and (3) classifying the virtual outliers as an additional class in the classification branch. The performance comparison is summarized in Table 3. Compared to the hinge loss, our proposed logistic loss reduces the FPR95 by 10.02% on BDD-100k. While the squared hinge loss in Liu et al. requires tuning the hyperparameters, our uncertainty loss is completely hyperparameter free. In addition, we find that a learnable for energy score is more desirable than a constant , given the inherent class imbalance in object detection datasets. Finally, classifying the virtual outliers as an additional class increases the difficulty of object classification, which does not outperform either. This ablation demonstrates the superiority of the uncertainty loss employed by VOS.
VOS is effective on alternative architecture. Lastly, we demonstrate that VOS is effective on alternative neural network architectures. In particular, using RegNet (Radosavovic et al., 2020) as backbone yields both better ID accuracy and OOD detection performance. We also explore using intermediate layers for outlier synthesis, where we show using VOS on the penultimate layer is the most effective. This is expected since the feature representations are the most discriminative at deeper layers. We provide details in Appendix F.
| Method | FPR95 | AUROC | object detection mAP (ID) | |
|---|---|---|---|---|
| PASCAL-VOC | VOS w/ hinge loss | 49.75 | 87.90 | 46.5 |
| VOS w/ constant | 51.59 | 88.64 | 48.9 | |
| VOS w/ class | 65.25 | 85.26 | 47.0 | |
| VOS (ours) | 47.53 | 88.70 | 48.9 | |
| Berkeley DeepDrive-100k | VOS w/ hinge loss | 54.29 | 83.47 | 29.5 |
| VOS w/ constant | 49.25 | 85.35 | 30.9 | |
| VOS w/ class | 52.98 | 85.91 | 30.1 | |
| VOS (ours) | 44.27 | 86.87 | 31.3 |
Comparison with training on real outlier data. We also compare with Outlier Exposure (Hendrycks et al., 2019) (OE). OE serves as a strong baseline since it relies on the real outlier data. We train the object detector on PASCAL-VOC using the same architecture ResNet-50, and use the OE objective for the classification branch. The real outliers for OE training are sampled from the OpenImages dataset (Kuznetsova et al., 2020). We perform careful deduplication to ensure there is no overlap between the outlier training data and PASCAL-VOC. Our method achieves OOD detection performance on COCO (AUROC: 88.70%) that favorably matches OE (AUROC: 90.18%), and does not require external data.
4.2 Evaluation on Image Classification
| Method | FPR95 | AUROC |
|---|---|---|
| WideResNet / DenseNet | ||
| MSP | 51.05 / 48.73 | 90.90 / 92.46 |
| ODIN | 35.71 / 24.57 | 91.09 / 93.71 |
| Mahalanobis | 37.08 / 36.26 | 93.27 / 87.12 |
| Energy | 33.01 / 27.44 | 91.88 / 94.51 |
| Gram Matrices | 27.33 / 23.13 | 93.00 / 89.83 |
| Generalized ODIN | 39.94 / 26.97 | 92.44 / 93.76 |
| CSI | 35.66 / 47.83 | 92.45 / 85.31 |
| GAN-synthesis | 37.30 / 83.71 | 89.60 / 54.14 |
| VOS (ours) | 24.87 / 22.47 | 94.06 / 95.33 |
Going beyond object detection, we show that VOS is also suitable and effective on common image classification benchmark. We use CIFAR-10 (Krizhevsky & Hinton, 2009) as the ID training data, with standard train/val splits. We train on WideResNet-40 (Zagoruyko & Komodakis, 2016) and DenseNet-101 (Huang et al., 2017), where we substitute the object detection loss in Equation 7 with the cross-entropy loss. We evaluate on six OOD datasets: Textures (Cimpoi et al., 2014), SVHN (Netzer et al., 2011), Places365 (Zhou et al., 2018), LSUN-C (Yu et al., 2015), LSUN-Resize (Yu et al., 2015), and iSUN (Xu et al., 2015). The comparisons are shown in Table 4, with results averaged over six test datasets. VOS demonstrates competitive OOD detection results on both architectures without sacrificing the ID test classification accuracy (94.84% on pre-trained WideResNet vs. 94.68% using VOS).
4.3 Qualitative Analysis
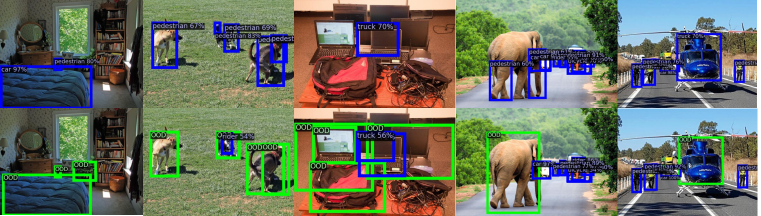
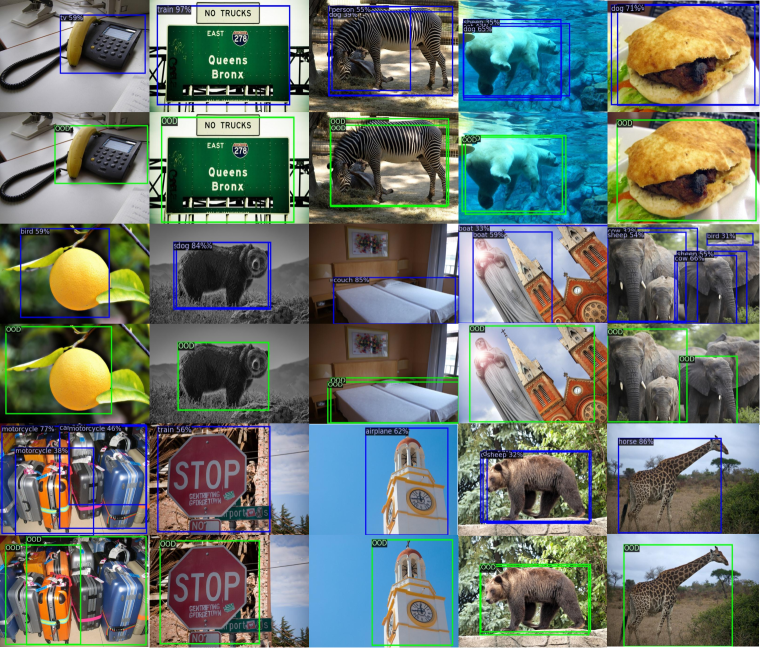
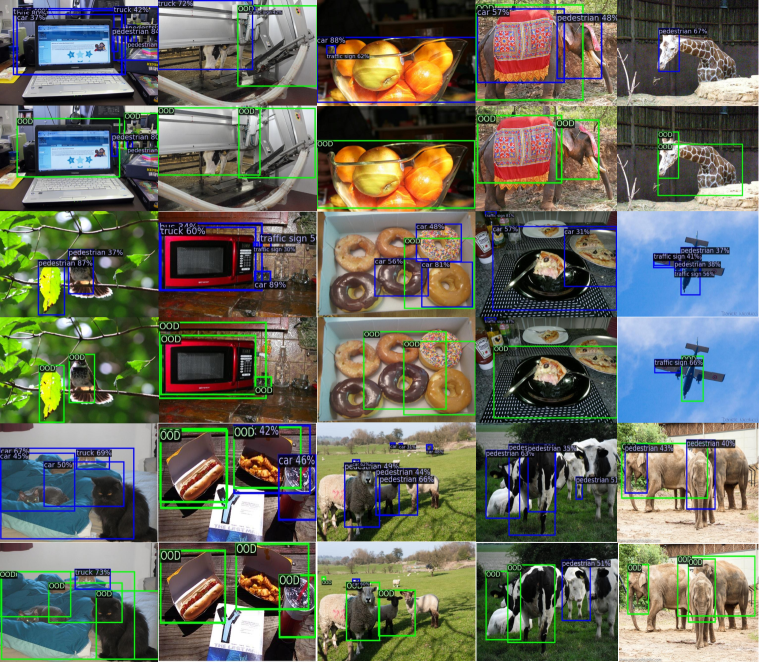
In Figure 4, we visualize the prediction on several OOD images, using object detection models trained without virtual outliers (top) and with VOS (bottom), respectively. The in-distribution data is BDD-100k. VOS performs better in identifying OOD objects (in green) than a vanilla object detector, and reduces false positives among detected objects. Moreover, the confidence score of the false-positive objects of VOS is lower than that of the vanilla model (see the truck in the 3rd column). Additional visualizations are in Appendix D and H.
5 Related work
OOD detection for classification can be broadly categorized into post hoc and regularization-based approaches. In Bendale & Boult (2016), the OpenMax score is developed for OOD detection based on the extreme value theory (EVT). Subsequent work (Hendrycks & Gimpel, 2017) proposed a simple baseline using maximum softmax probability. Improved algorithms have been proposed, such as ensembling (Lakshminarayanan et al., 2017), ODIN (Liang et al., 2018), energy score (Liu et al., 2020a), Mahalanobis distance (Lee et al., 2018b), Gram matrices based score (Sastry & Oore, 2020), and GradNorm score (Huang et al., 2021). Very recently, Sun et al. (2021) showed that a simple activation rectification strategy termed ReAct can significantly improve test-time OOD detection. Theoretical understandings on different post-hoc detection methods are provided in (Morteza & Li, 2022). Different from Lee et al. (2018b), VOS performs dynamic estimation of class-conditional Gaussian during training, which shapes the uncertainty surface over time using our proposed loss.
Another line of approaches explore model regularization using natural outlier images (Hendrycks et al., 2019; Mohseni et al., 2020; Zhang et al., 2021) or images synthesized by GANs (Lee et al., 2018a). However, real outlier data is often infeasible to obtain. Instead, VOS automatically synthesizes virtual outliers which allows greater flexibility and generality. Tack et al. (2020) applied self-supervised learning for OOD detection, which we compare in Section 4. Blum et al. (2021); Jung et al. (2021); Besnier et al. (2021) proposed to detect outliers for semantic segmentation task. Grcic et al. (2021) trained a generative model and synthesize outliers in the pixel space, which cannot be applied to object detection where a scene consists of both known and unknown objects. The regularization is based on entropy maximization, which is different from VOS.
OOD detection for object detection is currently underexplored. Joseph et al. (2021) used energy score (Liu et al., 2020a) to identify the OOD data and then labeled them for incremental object detection. In contrast, VOS focuses on OOD detection and adopts a new unknown-aware training objective with a new test-time detection score. Our learning framework is generally applicable to both object detectors and classification models. Moreover, Joseph et al. (2021) used the negative proposals as unknown samples for model regularization, which is suboptimal as we show in Table 2. Harakeh & Waslander (2021); Riedlinger et al. (2021) focused on uncertainty estimation for the localization regression, rather than OOD detection for classification problems. Several works (Dhamija et al., 2020; Miller et al., 2019; 2018; Hall et al., 2020; Deepshikha et al., 2021) used approximate Bayesian methods, such as MC-Dropout (Gal & Ghahramani, 2016) for OOD detection. They require multiple inference passes to generate the uncertainty score, which are computationally expensive on larger datasets and models.
Open-world object detection includes out-of-domain generalization (Kim et al., 2021; Wang et al., 2021), zero-shot object detection (Gu et al., 2022; Rahman et al., 2020) and incremental object detection (Liu et al., 2020b; Pérez-Rúa et al., 2020). Most of them either developed measures to mitigate catastraphic forgetting (Joseph et al., 2020) or used auxiliary information (Rahman et al., 2020), such as class attributes to perform object detection on unseen data, which is different from our focus of OOD detection.
6 Conclusion
In this paper, we propose VOS, a novel unknown-aware training framework for OOD detection. Different from methods that require real outlier data, VOS adaptively synthesizes outliers during training by sampling virtual outliers from the low-likelihood region of the class-conditional distributions. The synthesized outliers meaningfully improve the decision boundary between the ID data and OOD data, resulting in superior OOD detection performance while preserving the performance of the ID task. VOS is effective and suitable for both object detection and classification tasks. We hope our work will inspire future research on unknown-aware deep learning in real-world settings.
Reproducibility Statement
The authors of the paper recognize the importance and value of reproducible research. We summarize our efforts below to facilitate reproducible results:
- 1.
-
2.
Baselines. The description and hyperparameters of the OOD detection baselines are explained in Appendix E.
-
3.
Model training. Our model training on object detection is based on the publicly available Detectron2 codebase: https://github.com/facebookresearch/detectron2. Hyperparamters are specified in Section 4.1, with a thorough ablation study provided in Appendix C.
- 4.
-
5.
Open Source. The codebase and the dataset will be released for reproducible research. Code is available at https://github.com/deeplearning-wisc/vos.
Ethics statement
Our project aims to improve the reliability and safety of modern machine learning models. Our study can lead to direct benefits and societal impacts, particularly for safety-critical applications such as autonomous driving. Our study does not involve any human subjects or violation of legal compliance. We do not anticipate any potentially harmful consequences to our work. Through our study and releasing our code, we hope to raise stronger research and societal awareness towards the problem of out-of-distribution detection in real-world settings.
Acknowledgement
Research is supported by Wisconsin Alumni Research Foundation (WARF). We sincerely thank Ziyang (Jack) Cai for helping with inspect the OOD datasets, and members in Li’s lab for valuable discussions.
References
- Bendale & Boult (2016) Abhijit Bendale and Terrance E Boult. Towards open set deep networks. In Proceedings of the IEEE conference on computer vision and pattern recognition, pp. 1563–1572, 2016.
- Besnier et al. (2021) Victor Besnier, Andrei Bursuc, David Picard, and Alexandre Briot. Triggering failures: Out-of-distribution detection by learning from local adversarial attacks in semantic segmentation. In Proceedings of the IEEE/CVF International Conference on Computer Vision (ICCV), pp. 15701–15710, October 2021.
- Blum et al. (2021) Hermann Blum, Paul-Edouard Sarlin, Juan I. Nieto, Roland Siegwart, and Cesar Cadena. The fishyscapes benchmark: Measuring blind spots in semantic segmentation. Int. J. Comput. Vis., 129(11):3119–3135, 2021. doi: 10.1007/s11263-021-01511-6.
- Cimpoi et al. (2014) Mircea Cimpoi, Subhransu Maji, Iasonas Kokkinos, Sammy Mohamed, and Andrea Vedaldi. Describing textures in the wild. In IEEE Conference on Computer Vision and Pattern Recognition, CVPR 2014, pp. 3606–3613, 2014.
- Deepshikha et al. (2021) Kumari Deepshikha, Sai Harsha Yelleni, P. K. Srijith, and C. Krishna Mohan. Monte carlo dropblock for modelling uncertainty in object detection. CoRR, abs/2108.03614, 2021.
- Dhamija et al. (2020) Akshay Raj Dhamija, Manuel Günther, Jonathan Ventura, and Terrance E. Boult. The overlooked elephant of object detection: Open set. In IEEE Winter Conference on Applications of Computer Vision, WACV 2020, pp. 1010–1019, 2020.
- Everingham et al. (2010) Mark Everingham, Luc Van Gool, Christopher K. I. Williams, John M. Winn, and Andrew Zisserman. The pascal visual object classes (VOC) challenge. International Journal of Computer Vision, 88(2):303–338, 2010.
- Gal & Ghahramani (2016) Yarin Gal and Zoubin Ghahramani. Dropout as a bayesian approximation: Representing model uncertainty in deep learning. In international conference on machine learning, pp. 1050–1059. PMLR, 2016.
- Girshick et al. (2018) Ross Girshick, Ilija Radosavovic, Georgia Gkioxari, Piotr Dollár, and Kaiming He. Detectron. https://github.com/facebookresearch/detectron, 2018.
- Goodfellow et al. (2014) Ian Goodfellow, Jean Pouget-Abadie, Mehdi Mirza, Bing Xu, David Warde-Farley, Sherjil Ozair, Aaron Courville, and Yoshua Bengio. Generative adversarial nets. In Advances in neural information processing systems, pp. 2672–2680, 2014.
- Grcic et al. (2021) Matej Grcic, Petra Bevandic, and Sinisa Segvic. Dense open-set recognition with synthetic outliers generated by real NVP. In Proceedings of the 16th International Joint Conference on Computer Vision, Imaging and Computer Graphics Theory and Applications, VISIGRAPP 2021, Volume 4: VISAPP, Online Streaming, February 8-10, 2021, pp. 133–143. SCITEPRESS, 2021. doi: 10.5220/0010260701330143.
- Gu et al. (2022) Xiuye Gu, Tsung-Yi Lin, Weicheng Kuo, and Yin Cui. Zero-shot detection via vision and language knowledge distillation. In 10th International Conference on Learning Representations, ICLR 2022, 2022.
- Hall et al. (2020) David Hall, Feras Dayoub, John Skinner, Haoyang Zhang, Dimity Miller, Peter Corke, Gustavo Carneiro, Anelia Angelova, and Niko Sünderhauf. Probabilistic object detection: Definition and evaluation. In IEEE Winter Conference on Applications of Computer Vision, WACV 2020, pp. 1020–1029, 2020.
- Harakeh & Waslander (2021) Ali Harakeh and Steven L. Waslander. Estimating and evaluating regression predictive uncertainty in deep object detectors. In International Conference on Learning Representations, 2021.
- He et al. (2016) Kaiming He, Xiangyu Zhang, Shaoqing Ren, and Jian Sun. Identity mappings in deep residual networks. In European conference on computer vision, pp. 630–645. Springer, 2016.
- Hendrycks & Gimpel (2017) Dan Hendrycks and Kevin Gimpel. A baseline for detecting misclassified and out-of-distribution examples in neural networks. In International Conference on Learning Representations, ICLR 2017, 2017.
- Hendrycks et al. (2019) Dan Hendrycks, Mantas Mazeika, and Thomas Dietterich. Deep anomaly detection with outlier exposure. In International Conference on Learning Representations, 2019.
- Hsu et al. (2020) Yen-Chang Hsu, Yilin Shen, Hongxia Jin, and Zsolt Kira. Generalized odin: Detecting out-of-distribution image without learning from out-of-distribution data. In Proceedings of the IEEE/CVF Conference on Computer Vision and Pattern Recognition, pp. 10951–10960, 2020.
- Huang et al. (2017) Gao Huang, Zhuang Liu, Laurens Van Der Maaten, and Kilian Q Weinberger. Densely connected convolutional networks. In Proceedings of the IEEE conference on computer vision and pattern recognition, pp. 4700–4708, 2017.
- Huang et al. (2021) Rui Huang, Andrew Geng, and Yixuan Li. On the importance of gradients for detecting distributional shifts in the wild. In Advances in Neural Information Processing Systems, 2021.
- Joseph et al. (2020) K. J. Joseph, Jathushan Rajasegaran, Salman H. Khan, Fahad Shahbaz Khan, Vineeth Balasubramanian, and Ling Shao. Incremental object detection via meta-learning. arXiv preprint arXiv:2003.08798, 2020.
- Joseph et al. (2021) K. J. Joseph, Salman Khan, Fahad Shahbaz Khan, and Vineeth N. Balasubramanian. Towards open world object detection. In IEEE/CVF Conference on Computer Vision and Pattern Recognition, CVPR 2021, 2021.
- Jung et al. (2021) Sanghun Jung, Jungsoo Lee, Daehoon Gwak, Sungha Choi, and Jaegul Choo. Standardized max logits: A simple yet effective approach for identifying unexpected road obstacles in urban-scene segmentation. In IEEE International Conference on Computer Vision, ICCV, 2021.
- Kim et al. (2021) Dahun Kim, Tsung-Yi Lin, Anelia Angelova, In So Kweon, and Weicheng Kuo. Learning open-world object proposals without learning to classify. CoRR, abs/2108.06753, 2021.
- Kingma & Ba (2015) Diederik P. Kingma and Jimmy Ba. Adam: A method for stochastic optimization. In 3rd International Conference on Learning Representations, ICLR 2015, 2015.
- Krizhevsky & Hinton (2009) Alex Krizhevsky and Geoffrey Hinton. Learning multiple layers of features from tiny images. Technical Report, 2009.
- Kuznetsova et al. (2020) Alina Kuznetsova, Hassan Rom, Neil Alldrin, Jasper Uijlings, Ivan Krasin, Jordi Pont-Tuset, Shahab Kamali, Stefan Popov, Matteo Malloci, Alexander Kolesnikov, et al. The open images dataset v4. International Journal of Computer Vision, pp. 1–26, 2020.
- Lakshminarayanan et al. (2017) Balaji Lakshminarayanan, Alexander Pritzel, and Charles Blundell. Simple and scalable predictive uncertainty estimation using deep ensembles. In Advances in Neural Information Processing Systems, pp. 6402–6413, 2017.
- Lee et al. (2018a) Kimin Lee, Honglak Lee, Kibok Lee, and Jinwoo Shin. Training confidence-calibrated classifiers for detecting out-of-distribution samples. In International Conference on Learning Representations, 2018a.
- Lee et al. (2018b) Kimin Lee, Kibok Lee, Honglak Lee, and Jinwoo Shin. A simple unified framework for detecting out-of-distribution samples and adversarial attacks. In Advances in Neural Information Processing Systems, pp. 7167–7177, 2018b.
- Liang et al. (2018) Shiyu Liang, Yixuan Li, and Rayadurgam Srikant. Enhancing the reliability of out-of-distribution image detection in neural networks. In International Conference on Learning Representations, ICLR 2018, 2018.
- Lin et al. (2014) Tsung-Yi Lin, Michael Maire, Serge Belongie, James Hays, Pietro Perona, Deva Ramanan, Piotr Dollár, and C Lawrence Zitnick. Microsoft coco: Common objects in context. In European conference on computer vision, pp. 740–755, 2014.
- Liu et al. (2020a) Weitang Liu, Xiaoyun Wang, John Owens, and Yixuan Li. Energy-based out-of-distribution detection. Advances in Neural Information Processing Systems, 2020a.
- Liu et al. (2020b) Xialei Liu, Hao Yang, Avinash Ravichandran, Rahul Bhotika, and Stefano Soatto. Continual universal object detection. CoRR, abs/2002.05347, 2020b.
- Miller et al. (2018) Dimity Miller, Lachlan Nicholson, Feras Dayoub, and Niko Sünderhauf. Dropout sampling for robust object detection in open-set conditions. In IEEE International Conference on Robotics and Automation, ICRA 2018, pp. 1–7, 2018. doi: 10.1109/ICRA.2018.8460700.
- Miller et al. (2019) Dimity Miller, Feras Dayoub, Michael Milford, and Niko Sünderhauf. Evaluating merging strategies for sampling-based uncertainty techniques in object detection. In International Conference on Robotics and Automation, ICRA 2019, pp. 2348–2354, 2019.
- Mohseni et al. (2020) Sina Mohseni, Mandar Pitale, JBS Yadawa, and Zhangyang Wang. Self-supervised learning for generalizable out-of-distribution detection. In Proceedings of the AAAI Conference on Artificial Intelligence, volume 34, pp. 5216–5223, 2020.
- Morteza & Li (2022) Peyman Morteza and Yixuan Li. Provable guarantees for understanding out-of-distribution detection. Proceedings of the AAAI Conference on Artificial Intelligence, 2022.
- Netzer et al. (2011) Yuval Netzer, Tao Wang, Adam Coates, Alessandro Bissacco, Bo Wu, and Andrew Y Ng. Reading digits in natural images with unsupervised feature learning. 2011.
- Nguyen et al. (2015) Anh Nguyen, Jason Yosinski, and Jeff Clune. Deep neural networks are easily fooled: High confidence predictions for unrecognizable images. In Proceedings of the IEEE conference on computer vision and pattern recognition, pp. 427–436, 2015.
- Pérez-Rúa et al. (2020) Juan-Manuel Pérez-Rúa, Xiatian Zhu, Timothy M. Hospedales, and Tao Xiang. Incremental few-shot object detection. In 2020 IEEE/CVF Conference on Computer Vision and Pattern Recognition, CVPR 2020, pp. 13843–13852, 2020. doi: 10.1109/CVPR42600.2020.01386.
- Radosavovic et al. (2020) Ilija Radosavovic, Raj Prateek Kosaraju, Ross B. Girshick, Kaiming He, and Piotr Dollár. Designing network design spaces. In 2020 IEEE/CVF Conference on Computer Vision and Pattern Recognition, CVPR 2020, pp. 10425–10433, 2020.
- Rahman et al. (2020) Shafin Rahman, Salman H. Khan, and Fatih Porikli. Zero-shot object detection: Joint recognition and localization of novel concepts. International Journal of Computer Vision, 128(12):2979–2999, 2020. doi: 10.1007/s11263-020-01355-6.
- Ren et al. (2015) Shaoqing Ren, Kaiming He, Ross Girshick, and Jian Sun. Faster r-cnn: Towards real-time object detection with region proposal networks. In Advances in neural information processing systems, pp. 91–99, 2015.
- Riedlinger et al. (2021) Tobias Riedlinger, Matthias Rottmann, Marius Schubert, and Hanno Gottschalk. Gradient-based quantification of epistemic uncertainty for deep object detectors. CoRR, abs/2107.04517, 2021.
- Sastry & Oore (2020) Chandramouli Shama Sastry and Sageev Oore. Detecting out-of-distribution examples with gram matrices. In Proceedings of the 37th International Conference on Machine Learning, ICML 2020, volume 119, pp. 8491–8501, 2020.
- Sun et al. (2021) Yiyou Sun, Chuan Guo, and Yixuan Li. React: Out-of-distribution detection with rectified activations. In Advances in Neural Information Processing Systems, 2021.
- Tack et al. (2020) Jihoon Tack, Sangwoo Mo, Jongheon Jeong, and Jinwoo Shin. Csi: Novelty detection via contrastive learning on distributionally shifted instances. In Advances in Neural Information Processing Systems, 2020.
- Wang et al. (2021) Xin Wang, Thomas E. Huang, Benlin Liu, Fisher Yu, Xiaolong Wang, Joseph E. Gonzalez, and Trevor Darrell. Robust object detection via instance-level temporal cycle confusion. In Proceedings of the IEEE International Conference on Computer Vision (ICCV), 2021.
- Xu et al. (2015) Pingmei Xu, Krista A Ehinger, Yinda Zhang, Adam Finkelstein, Sanjeev R Kulkarni, and Jianxiong Xiao. Turkergaze: Crowdsourcing saliency with webcam based eye tracking. arXiv preprint arXiv:1504.06755, 2015.
- Yu et al. (2015) Fisher Yu, Ari Seff, Yinda Zhang, Shuran Song, Thomas Funkhouser, and Jianxiong Xiao. Lsun: Construction of a large-scale image dataset using deep learning with humans in the loop. arXiv preprint arXiv:1506.03365, 2015.
- Yu et al. (2020) Fisher Yu, Haofeng Chen, Xin Wang, Wenqi Xian, Yingying Chen, Fangchen Liu, Vashisht Madhavan, and Trevor Darrell. BDD100K: A diverse driving dataset for heterogeneous multitask learning. In IEEE/CVF Conference on Computer Vision and Pattern Recognition, CVPR 2020, pp. 2633–2642, 2020.
- Zagoruyko & Komodakis (2016) Sergey Zagoruyko and Nikos Komodakis. Wide residual networks. arXiv preprint arXiv:1605.07146, 2016.
- Zhang et al. (2018) Hongyi Zhang, Moustapha Cissé, Yann N. Dauphin, and David Lopez-Paz. mixup: Beyond empirical risk minimization. In 6th International Conference on Learning Representations, ICLR 2018, 2018.
- Zhang et al. (2021) Jingyang Zhang, Nathan Inkawhich, Yiran Chen, and Hai Li. Fine-grained out-of-distribution detection with mixup outlier exposure. CoRR, abs/2106.03917, 2021.
- Zhou et al. (2018) Bolei Zhou, Àgata Lapedriza, Aditya Khosla, Aude Oliva, and Antonio Torralba. Places: A 10 million image database for scene recognition. IEEE Transactions Pattern Analysis and Machine Intelligence., 40(6):1452–1464, 2018. doi: 10.1109/TPAMI.2017.2723009.
Supplementary Material
Appendix A Experimental details
We summarize the OOD detection evaluation task in Table 5. The OOD test dataset is selected from MS-COCO and OpenImages dataset, which contains disjoint labels from the respective ID dataset. The PASCAL model is trained for a total of 18,000 iterations, and the BDD-100k model is trained for 90,000 iterations. We add the uncertainty regularizer (Equation 5) starting from 2/3 of the training. The weight is set to . See detailed ablations on the hyperparameters in Appendix C.
| Task 1 | Task 2 | |
|---|---|---|
| ID train dataset | VOC train | BDD train |
| ID val dataset | VOC val | BDD val |
| OOD dataset | COCO and OpenImages val | COCO and OpenImages val |
| ID train images | 16,551 | 69,853 |
| ID val images | 4,952 | 10,000 |
| OOD images for COCO | 930 | 1,880 |
| OOD images for OpenImages | 1,761 | 1,761 |
Appendix B Software and hardware
We run all experiments with Python 3.8.5 and PyTorch 1.7.0, using NVIDIA GeForce RTX 2080Ti GPUs.
Appendix C Effect of hyperparameters
Below we perform sensitivity analysis for each important hyperparameter111Note that our sensitivity analysis uses the speckle noised PASCAL VOC validation dataset as OOD data, which is different from the actual OOD test datasets in use.. We use ResNet-50 as the backbone, trained on in-distribution dataset PASCAL-VOC.
Effect of . Since the threshold can be infinitesimally small, we instead choose based on the -th smallest likelihood in a pool of 10,000 samples (per-class), generated from the class-conditional Gaussian distribution. A larger corresponds to a larger threshold . As shown in Table 6, a smaller yields good performance. We set for all our experiments.
| mAP | FPR95 | AUROC | AUPR | |
|---|---|---|---|---|
| 1 | 48.7 | 54.69 | 83.41 | 92.56 |
| 2 | 48.2 | 57.96 | 82.31 | 88.52 |
| 3 | 48.3 | 62.39 | 82.20 | 88.05 |
| 4 | 48.8 | 69.72 | 80.86 | 89.54 |
| 5 | 48.7 | 57.57 | 78.66 | 88.20 |
| 6 | 48.7 | 74.03 | 78.06 | 91.17 |
| 8 | 48.8 | 60.12 | 79.53 | 92.53 |
| 10 | 47.2 | 76.25 | 74.33 | 90.42 |
Effect of queue size . We investigate the effect of ID queue size in Table 7, where we vary . Overall, a larger is more beneficial since the estimation of Gaussian distribution parameters can be more precise. In our experiments, we set the queue size to for PASCAL and for BDD-100k. The queue size is smaller for BDD because some classes have a limited number of object boxes.
| mAP | FPR95 | AUROC | AUPR | |
|---|---|---|---|---|
| 50 | 48.6 | 68.42 | 77.04 | 92.30 |
| 100 | 48.9 | 59.77 | 79.96 | 89.18 |
| 200 | 48.8 | 57.80 | 80.20 | 89.92 |
| 400 | 48.9 | 66.85 | 77.68 | 89.83 |
| 600 | 48.5 | 57.32 | 81.99 | 91.07 |
| 800 | 48.7 | 51.43 | 82.26 | 91.80 |
| 1000 | 48.7 | 54.69 | 83.41 | 92.56 |
Effect of . As shown in Table 8, a mild value of generally works well. As expected, a large value (e.g., ) will over-regularize the model and harm the performance.
| mAP | FPR95 | AUROC | AUPR | |
|---|---|---|---|---|
| 0.01 | 48.8 | 59.20 | 82.64 | 90.08 |
| 0.05 | 48.9 | 57.21 | 83.27 | 91.00 |
| 0.1 | 48.7 | 54.69 | 83.41 | 92.56 |
| 0.15 | 48.5 | 59.32 | 77.47 | 89.06 |
| 0.5 | 36.4 | 99.33 | 57.46 | 85.25 |
Effect of starting iteration for the regularizer. Importantly, we show that uncertainty regularization should be added in the middle of the training. If it is added too early, the feature space is not sufficiently discriminative for Gaussian distribution estimation. See Table 9 for the effect of starting iteration . We use for the PASCAL-VOC model, which is trained for a total of 18,000 iterations.
| mAP | FPR95 | AUROC | AUPR | |
|---|---|---|---|---|
| 2000 | 48.5 | 60.01 | 78.55 | 87.62 |
| 4000 | 48.4 | 61.47 | 79.85 | 89.41 |
| 6000 | 48.5 | 59.62 | 79.97 | 89.74 |
| 8000 | 48.7 | 56.85 | 80.64 | 90.71 |
| 10000 | 48.6 | 49.55 | 83.22 | 92.49 |
| 12000 | 48.7 | 54.69 | 83.41 | 92.56 |
| 14000 | 49.0 | 55.39 | 81.37 | 93.00 |
| 16000 | 48.9 | 59.36 | 82.70 | 92.62 |
Appendix D Additional visualization results
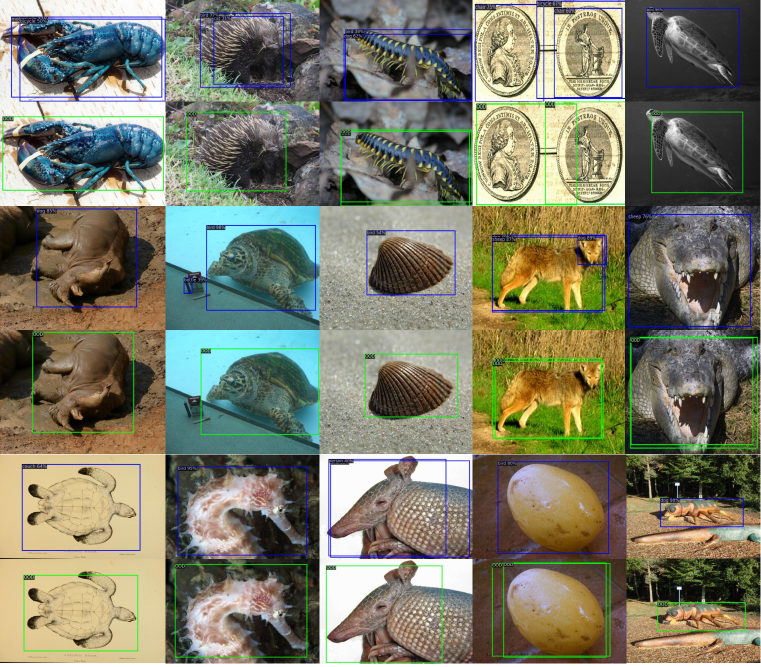
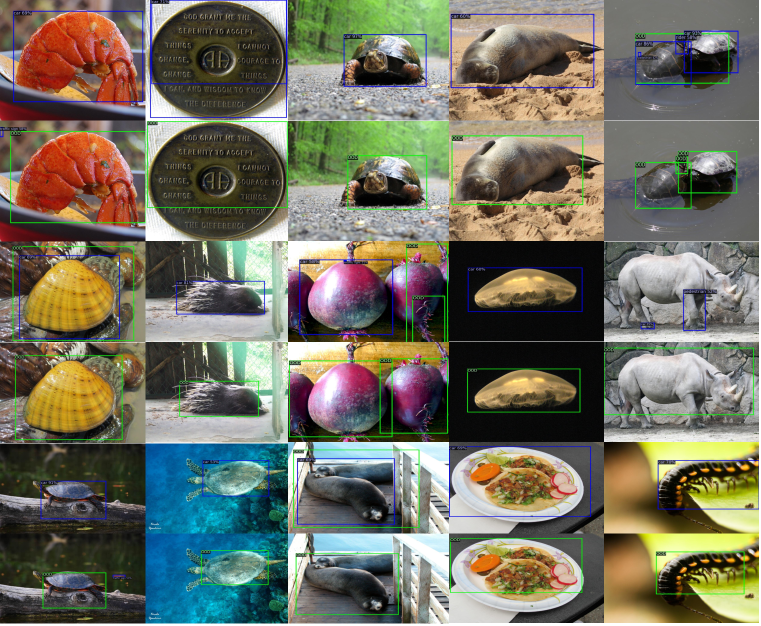
We provide additional visualization of the detected objects on different OOD datasets with models trained on different in-distribution datasets. The results are shown in Figures 5-8.
Appendix E Baselines
To evaluate the baselines, we follow the original methods in MSP (Hendrycks & Gimpel, 2017), ODIN (Liang et al., 2018), Generalized ODIN (Hsu et al., 2020), Mahalanobis distance (Lee et al., 2018b), CSI (Tack et al., 2020), energy score (Liu et al., 2020a) and gram matrices (Sastry & Oore, 2020) and apply them accordingly on the classification branch of the object detectors. For ODIN, the temperature is set to be following the original work. For both ODIN and Mahalanobis distance Lee et al. (2018b), the noise magnitude is set to because the region-based object detector is not end-to-end differentiable given the existence of region cropping and ROIAlign. For GAN (Lee et al., 2018a), we follow the original paper and use a GAN to generate OOD images. The prediction of the OOD images/objects is regularized to be close to a uniform distribution, through a KL divergence loss with a weight of 0.1. We set the shape of the generated images to be 100100 and resize them to have the same shape as the real images. We optimize the generator and discriminator using Adam (Kingma & Ba, 2015), with a learning rate of 0.001. For CSI (Tack et al., 2020), we use the rotations (0∘, 90∘, 180∘, 270∘) as the self-supervision task. We set the temperature in the contrastive loss to 0.5. We use the features right before the classification branch (with the dimension to be 1024) to perform contrastive learning. The weights of the losses that are used for classifying shifted instances and instance discrimination are both set to 0.1 to prevent training collapse. For Generalized ODIN Hsu et al. (2020), we replace and train the classification head of the object detector by the most effective Deconf-C head shown in the original paper.
Appendix F Virtual outlier synthesis using earlier layer
In this section, we investigate the effect of using VOS on an earlier layer within the network. Our main results in Table 1 are based on the penultimate layer of the network. Here, we additionally evaluate the performance using the layer before the penultimate layer, with a feature dimension of . The results are summarized in Table 10. As observed, synthesizing virtual outliers in the penultimate layer achieves better OOD detection performance than the earlier layer, since the feature representations are more discriminative at deeper layers.
| Models | FPR95 | AUROC | mAP |
|---|---|---|---|
| PASCAL VOC | |||
| VOS-final | 47.53 | 88.70 | 48.9 |
| VOS-earlier | 50.24 | 88.24 | 48.6 |
| BDD-100k | |||
| VOS-final | 44.27 | 86.87 | 31.3 |
| VOS-earlier | 49.66 | 86.08 | 30.6 |
Appendix G Visualization of the learnable weight coefficient in generalized energy score
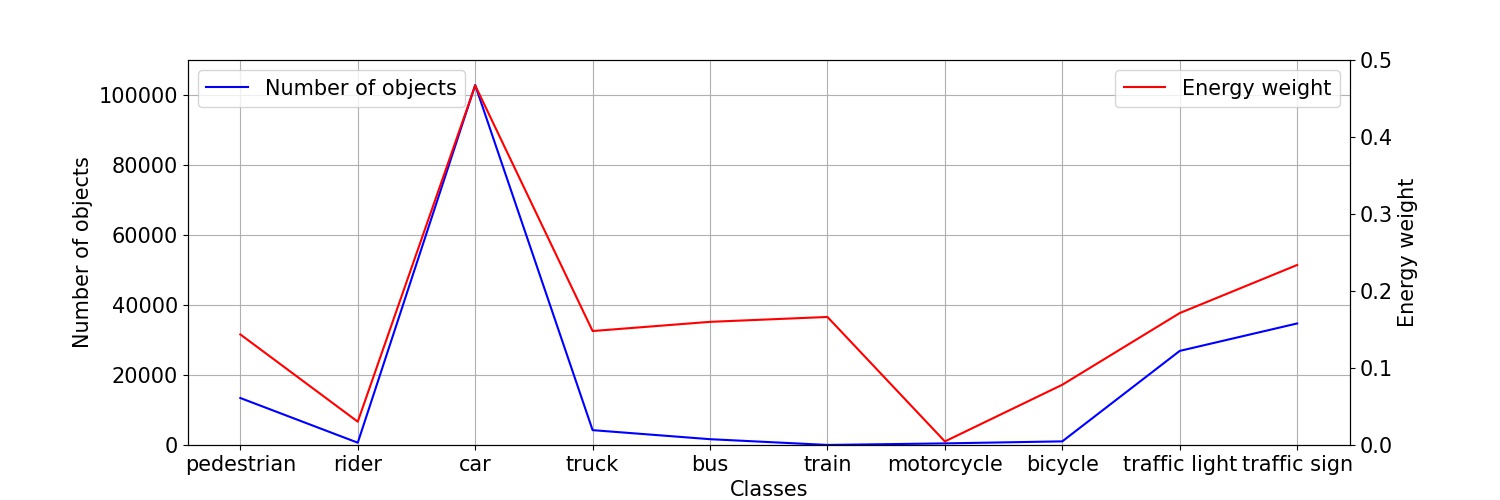
To observe whether the learnable weight coefficient in Equation 6 captures dataset-specific statistics during uncertainty regularization, we visualize w.r.t each in-distribution class and the number of training objects of that class in Figure 9. We use the BDD-100k dataset (Yu et al., 2020) as the in-distribution dataset and the RegNetX-4.0GF (Radosavovic et al., 2020) as the backbone network. As can be observed, the learned weight coefficient displays a consistent trend with the number of training objects per class, which indicates the advantage of using learnable weights rather than constant weight vector with all 1s.
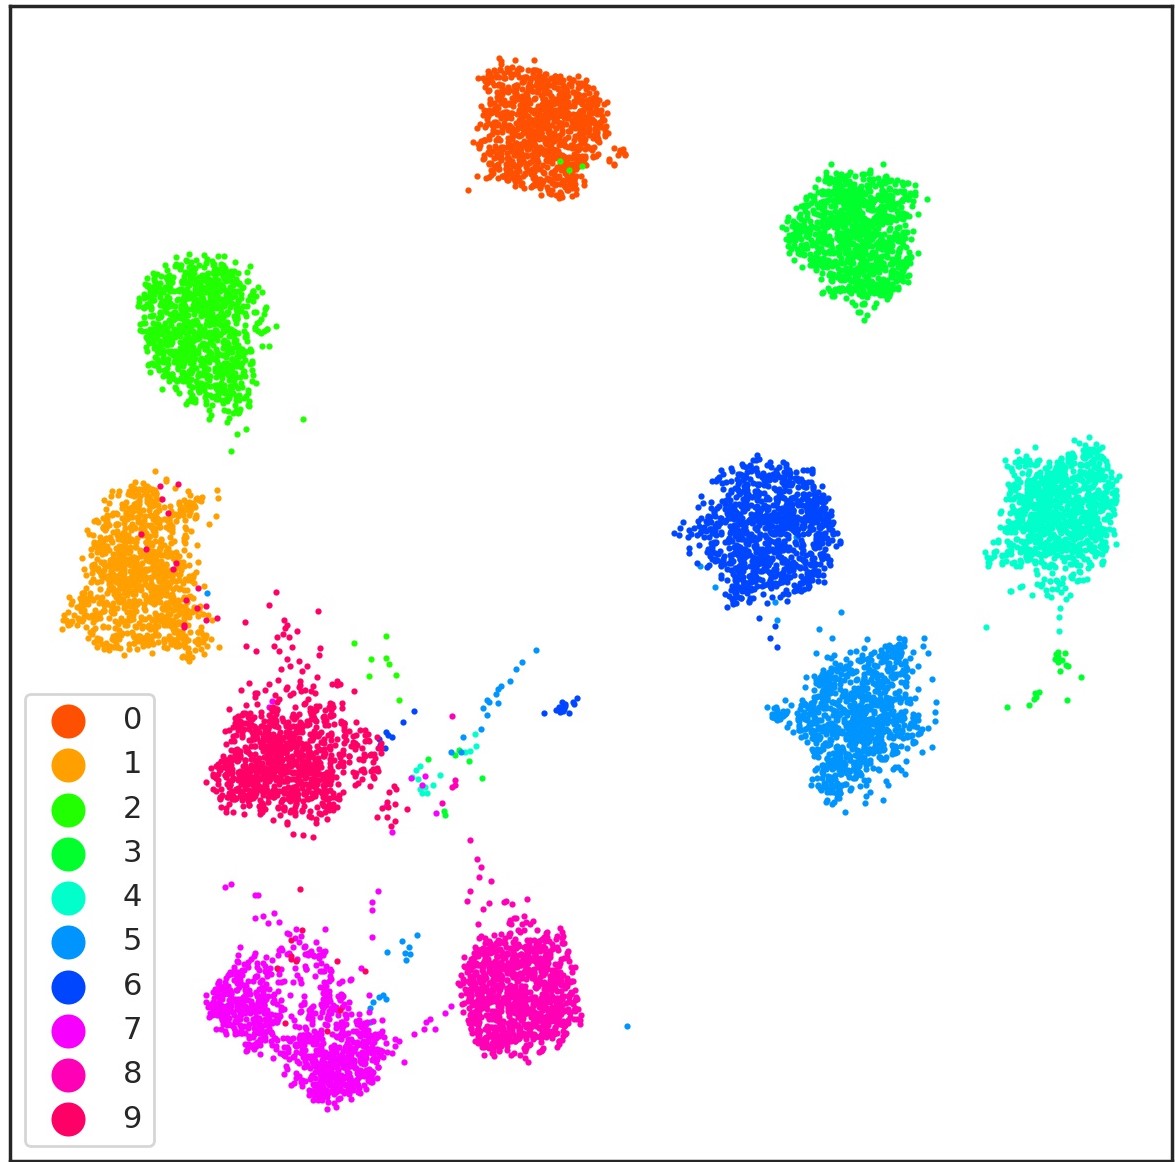
Appendix H Visualization of the virtual outliers
In this section, we visualize the synthesized virtual outliers by VOS using UMAP in Figure 10. The in-distribution dataset is the Pascal VOC dataset with the backbone of ResNet-50. Note that we cannot visualize virtual outliers in the pixel space since they are synthesized in low-dimensional feature space.
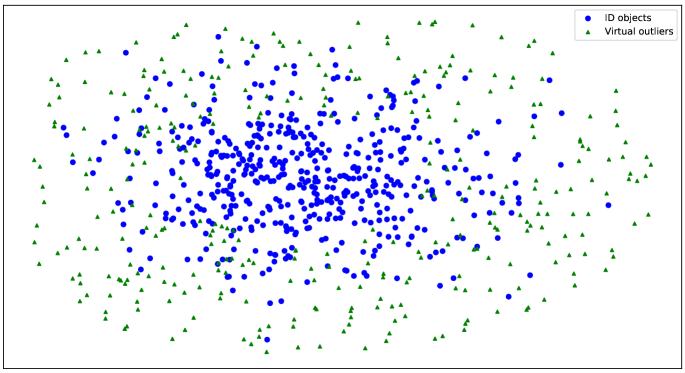
From Figure 10, the virtual outliers reside in the near-boundary region of the in-distribution feature cluster, which helps the model to learn a compact decision boundary between ID and OOD objects.
Appendix I Discussion on the detected, rejected and ignored OOD objects during inference
The focus of VOS is to mitigate the undesirable cases when an OOD object is detected and classified as in-distribution with high confidence. In other words, our goal is to ensure that “if the box is detected, it should be faithfully an in-distribution object rather than OOD”. Although generating the bounding box for OOD data is not the focus of this paper, we do notice that VOS can improve the number of boxes detected for OOD data (+25% on BDD trained model compared to the vanilla Faster-RCNN).
The number of OOD objects ignored by RPN can largely depend on the confidence score threshold and the NMS threshold. Hence, we found it more meaningful to compare relatively with the vanilla Faster-RCNN under the same default thresholds. Using BDD100K as the in-distribution dataset and the ResNet as the backbone, VOS can improve the number of detected OOD boxes by 25% (compared to vanilla object detector). VOS also improves the number of rejected OOD samples by 63%.