The interstellar medium in the environment of the supernova-less long-duration GRB 111005A
Abstract
Long ( s) gamma ray bursts (GRBs) are associated with explosions of massive stars, although in three instances, supernovae (SNe) have not been detected, despite deep observations. With new Hi line and archival optical integral field spectroscopy data, we characterize the interstellar medium (ISM) of the host galaxy of one of these events, GRB 111005A, in order to shed light on the unclear nature of these peculiar objects.
We found that the atomic gas, radio continuum, and rotational patterns are in general very smooth throughout the galaxy, which does not indicate a recent gas inflow or outflow. There is also no gas concentration around the GRB position. The ISM in this galaxy differs from that in hosts of other GRBs and SNe, which may suggest that the progenitor of GRB 111005A was not an explosion of a very massive star (e.g. a compact object merger).
However, there are subtle irregularities of the GRB 111005A host (most at a level), which may point to a weak gas inflow or interaction. Since in the SE part of the host there is 15% more atomic gas and twice less molecular gas than in NW part, the molecular gas fraction is low. In the SE part there is also a region with very high H equivalent width. There is more continuum 1.4 GHz emission to the SE and an S-shaped warp in the UV. Finally, there is also a low-metallicity region 3.5″ (1 kpc) from the GRB position. Two galaxies within 300 kpc or a past merger can be responsible for these irregularities.
1 Introduction
It is well established that there are two types of gamma-ray bursts (GRBs) and they are divided based on the duration of their prompt emission (Kouveliotou et al. 1993). Those lasting less than 2 seconds are called short GRBs, with the cause of the explosion being the collision of compact objects (two neutron stars or a neutron star and a black hole; Abbott et al. 2017). The second group, longer than 2 seconds (long GRBs) are the result of the core collapse of very massive stars (Hjorth et al. 2003; Stanek et al. 2003) and take place in galaxies with ongoing star-formation (Christensen et al. 2004; Castro Cerón et al. 2006, 2010; Michałowski et al. 2008; Savaglio et al. 2009; Perley et al. 2013, 2015; Hunt et al. 2014).
Almost all long GRBs for which deep spectroscopic observations were carried out are accompanied by the explosion of supernovae type Ic (SN Ic; with no hydrogen, helium, or silicon lines in the spectrum; Hjorth & Bloom 2012). There are three exceptions for which the existence of a SN was ruled out down to deep limits: GRB 060505, 060614 (Fynbo et al. 2006; Della Valle et al. 2006; Gal-Yam et al. 2006), and 111005A (Michałowski et al. 2018c).
The most important question regarding these three objects is what their nature and their progenitors were. Some clues on the nature of unusual explosions can be obtained from the properties of gas in their environment (as was done for the enigmatic transient AT 2018cow; Michałowski et al. 2019; Roychowdhury et al. 2019; Morokuma-Matsui et al. 2019). In this paper we focus on GRB 111005A. The current gas data for its host have too poor resolution to attempt this. Michałowski et al. (2018b) obtained a detection of the CO(2-1) line in three pointings and noticed that ESO 580-49, the host galaxy of GRB 111005A, is not symmetrically filled with molecular gas. The central and NW regions are molecule-rich for their star formation rates (SFR), but the SE region turned out to be molecule-deficient. The total molecular gas mass turned out to be similar as that of other galaxies with similar redshift, star formation rate (SFR), and stellar mass (Michałowski et al. 2018b; Hatsukade et al. 2020). Michałowski et al. (2015) examined the Hi line in five GRB host galaxies at z 0.12, including the GRB 111005A host using archival Hi line from the Nançay radio telescope (Theureau et al. 1998; Springob et al. 2005). Due to poor spatial resolution, only the total atomic gas mass was measured, and it turned out to be typical for the SFR and stellar mass of this galaxy.
The objective of this paper is to establish the properties of the interstellar medium (ISM) in the host of GRB 111005A, in order to help shed light on the nature of the progenitor. We use new Hi and archival integral spectroscopy data to investigate both the atomic and the ionised gas.
We use a cosmological model with = 70 km s-1 Mpc-1, = 0.7, and = 0.3. At the redshift of GRB 111005A of this corresponds to a scale of 0.27 kpc per 1″.
2 GRB 111005A and its host
On October 5th 2011 GRB 111005A was detected by the Burst Alert Telescope (BAT, Barthelmy et al. 2005), onboard the Swift satellite. With a burst duration of 26 7 sec (Barthelmy et al. 2011), it was classified as a long GRB. Machine-learning classification that successfully distinguishes between long and short GRBs, shows that GRB 111005A is in the long GRB part of the diagram, in common with other supernova-less long GRBs as well (Jespersen et al. 2020). In this analysis, GRB 111005A lies far from the short-duration group in a densely populated area, making it unlikely that it could belong to the short-duration group. This is consistent with its duration, putting it in the long category.
Michałowski et al. (2018c) carried out an analysis of the GRB afterglow and explosion environment based on new and archival radio, optical and mid-infrared data. With Very Long Baseline Array (VLBA) data the position of the radio afterglow was determined to be = 14:53:07.8078276, = 19:44:11.995387 (J2000), with a 1 error of 0.2 mas. The GRB was found to be associated with the galaxy ESO 580-49 at a redshift of z = 0.01326, exploding from its centre, as defined on the 3.6 µm image (Michałowski et al. 2018c). The radio afterglow lightcurve turned out to be atypical. The afterglow exhibited a plateau phase lasting a month with a very rapid subsequent decay. These properties have never been observed before in a GRB. The host galaxy has been classified as Sbc in HyperLeda111leda.univ-lyon1.fr with an edge-on inclination of 90∘ (Makarov et al. 2014). Based on full spectral energy distribution (SED) modelling including far-infrared data, Michałowski et al. (2018c) determined a star formation rate (SFR) of 0.42 and stellar mass of which is within the range of both long and short GRBs hosts (Savaglio et al. 2009; Castro Cerón et al. 2010; Perley et al. 2016; Fong et al. 2013; Berger 2014; Klose et al. 2019). Michałowski et al. (2018c) and Tanga et al. (2018) rejected the characterisation of the host galaxy as an active galactic nucleus (AGN) based on the Baldwin-Phillips-Terlevich (BPT) diagram (Baldwin et al. 1981).
Another rare feature of GRB 111005A was that no supernova was detected in the optical, near- and mid-infrared, down to an absolute magnitude of mag at , times fainter than SNe associated with long GRBs. This cannot be explained by dust extinction, because in the mid-infrared its influence would be minor. This is similar to GRBs 060505 and 060614 (Fynbo et al. 2006; Della Valle et al. 2006; Gal-Yam et al. 2006).
Moreover, Michałowski et al. (2018c) showed that the explosion occurred in an environment with about solar metallicity. A very similar conclusion was reached by Tanga et al. (2018) based on integral field spectroscopy. They found that the host galaxy is metal-rich (near solar metallicity) and that there is little star formation at the GRB position. There are about twenty known GRBs that have exploded in environments with high (solar or super-solar) metallicity, (measured from absorption spectroscopy) (Prochaska et al. 2009; Krühler et al. 2012, 2015; Savaglio et al. 2012; Elliott et al. 2013; Schulze et al. 2014; Hashimoto et al. 2015; Schady et al. 2015; Stanway et al. 2015). Metallicity is dependent on the galaxy stellar mass, so massive GRB hosts without metalliticty measurements may also have high metallicity. Perley et al. (2016) presented an analysis of 119 galaxies up to redshift 6, of which about 10 are massive galaxies (stellar masses larger than ), which imply solar metallicity. However, all of them are at , whereas the GRB 111005A host is at a low redshift. GRB 130925A was also similar to GRB 111005A with respect to its proximity to the host centre ( or 600 pc in projection; Schady et al. 2015). The lack of a SN, an atypical lightcurve, and the high (around solar) metallicity were used to claim that the explosion mechanism of GRB 111005A was different from that of the majority of GRBs (Michałowski et al. 2018c; Tanga et al. 2018).
3 Data
3.1 GMRT observations
In May and June 2016 the field of GRB 111005A was observed for 2 3 hrs with the Giant Metrewave Radio Telescope (GMRT)222Project no. 30035, PI: M. Michałowski. For calibration of the flux and the bandpass 3C286 was observed for 15 min at the start and the end of the runs. For the phase calibration 1522-275 was observed every 30 min on one day and 1448-163 the other day with the same temporal spacing. The correlator was setup with 16 Mhz bandwidth and 512 channels centred around 1400 MHz.
The data were reduced with a range of data reduction packages. We downloaded the fits files with the raw data from the GMRT archive. These fits files were then loaded into CASA (McMullin et al. 2007) with the importgmrt task without applying the online flags. Further data reduction was done with the CARACal333https://github.com/caracal-pipeline/caracal pipeline which is being developed for Hi data reduction of MeerKAT data. The pipeline is setup in a modular fashion using the platform-independent radio interferometry scripting framework stimela444https://github.com/SpheMakh/Stimela/wiki. In practice this means that the calibrator data are initially flagged with AOflagger (Offringa 2010) and calibrated and transferred to the target with CASA. After this the target is split out of the measurement set, further flagged with AOflagger, imaged with WSclean (Offringa et al. 2014) in Stokes I, using WSclean’s auto and fits masking feature after which this clean model is used in Cubical555https://github.com/ratt-ru/CubiCal (Kenyon et al. 2018) for the self-calibration. This step is repeated until a phase-only self-calibration no longer improves the image and then subsequently an amplitude and phase self-calibration is performed where the solution interval for the amplitude and phase can differ.
After calibration the data for the two separate days were mapped onto the same channel grid with the CASA task mstransform and the continuum was subtracted with uvcontsub. At this stage the data were also Doppler corrected and projected onto a barycentric velocity frame. As the data for the two separate days had opposite sign frequency increment, the pipeline’s more advanced WSclean tasks could not be used to invert the visibilities into an Hi data cube. For this reason we did this final step manually in CASA. TCLEAN was used to transform the visibilities of the 60 channels covering the Hi emission into a data cube. The visibilities were weighted according to a Briggs weighting scheme with the “robust” parameter set to 0 and a uvtaper of 7, 17, and 40 k resulting in data cubes of different resolution. The dirty cubes were cleaned with TCLEAN’s multiscale clean algorithm, at scales of 1, 2 and 5 beams. The cleaning was performed in an iterative process in which we first cleaned the cube to a threshold of 10 in the first iteration. From this first “cleaned” cube a mask was constructed with SoFiA (Serra et al. 2015) and then the emission in this mask was cleaned down to 0.5 and a new mask was created. This last step was repeated until successive iterations showed no changes in the mask and all the visible emission was captured in the mask.
The final cubes had resolutions of FWHM = 16.8″12.9″, 7.4″5.7″, and 4.0″2.8″and a channel width of 32.5 kHz (7 km s-1 at the Hi frequency). The rms is , , and per channel. The frequency axis was converted into a velocity axis using the relativistic definition which results in a channel width of 6.96 km s-1 with an error of 0.005 km s-1 on the outermost channels of the cube.
We also imaged the line-free channels to construct continuum images at the frequency of 1.4 GHz. We applied a uvtaper of 40, 17 and 5k resulting in a resolution of 4.7″3.2″, 8.4″6.5″and 29.7″22.5″ and an rms of , and , respectively. For the flux scale we note that the usual 10% calibration error applies for GMRT data.
3.2 MUSE data
We also used optical data obtained by Tanga et al. (2018). The galaxy in which GRB 111005A occurred was observed on the 23 August 2014 by the ESO Very Large Telescope equipped with the panoramic integral-field spectrograph working in the visible range, the Multi-Unit Spectroscopic Explorer (MUSE; Bacon et al. 2010).
The MUSE optical data obtained by Tanga et al. (2018) has previously been used in order to study the dust reddening , velocity map based on the H line, equivalent width of the H line, star formation rate surface density, and metallicity based on the Pettini & Pagel (2004, O3N2) and Dopita et al. (2016, D16) calibrations.
| Reg. | RA/Dec | MHI | M | molecular | SFR | |||||||||
|---|---|---|---|---|---|---|---|---|---|---|---|---|---|---|
| (109 ) | (%) | gas fraction (%) | ( yr-1) | |||||||||||
| 14.85″ | 6.55″ | 3.4″ | 14.85″ | 6.55″ | 3.4″ | 14.85″ | 6.55″ | 3.4″ | D16 | O3N2 | ||||
| Center | 14:53:7.8 | 0.90 | 1.08 | 1.17 | 16.0 | 18.8 | 19.4 | 38.2 | 34.3 | 32.5 | 8.39 | 8.55 | 0.12 | |
| -19:44:10.97 | 0.02 | 0.03 | 0.03 | 0.7 | 0.8 | 0.8 | 1.8 | 1.6 | 1.6 | |||||
| NW | 14:53:6.2 | 0.80 | 0.95 | 1.03 | 14.1 | 16.5 | 17.1 | 20.4 | 17.7 | 16.5 | 8.23 | 8.49 | 0.03 | |
| -19:43:56.03 | 0.02 | 0.02 | 0.03 | 0.6 | 0.7 | 0.8 | 1.6 | 1.8 | 2.0 | |||||
| SE | 14:53:9.2 | 0.96 | 1.16 | 1.25 | 17.0 | 20.3 | 20.8 | 10.0 | 8.4 | 7.9 | 8.38 | 8.45 | 0.04 | |
| -19:44:29.04 | 0.03 | 0.03 | 0.03 | 0.7 | 0.9 | 0.9 | 1.7 | 2.4 | 2.2 | |||||
| Total | 5.66 | 5.73 | 6.01 | 94.4† | 95.6† | 100.3† | 24.7 | 21.5 | 20.2 | 8.37 | 8.51 | 0.19 | ||
| 0.19 | 0.20 | 0.22 | 4.4 | 4.6 | 4.9 | 1.5 | 1.5 | 1.5 | ||||||
4 Tilted ring modelling
Due to the projection effects that are caused by the almost edge-on ( 85∘) orientation of ESO 580-49 the rotation curve cannot be extracted from the velocity field. Therefore, in order to get a better understanding of the distribution and dynamics of the Hi in ESO 580-49 we fit a tilted ring model (Rogstad et al. 1974) to the GMRT observations. The Fully Automated TiRiFiC (FAT, Kamphuis et al. 2015) fits the titlted ring model directly to the data cube and thus can also accurately model the observed Hi of discs with high inclination (Józsa et al. 2007).
FAT fits all the parameters relating to the orientation and position of the disc. As such it determines the central coordinates and scale height of the disc as a whole for the model and allows for radial variations in the position angle (PA), inclination, rotational velocity, dispersion and surface brightness profile. We run FAT on the different resolution data cubes independently.
For the highest resolution data (FWHM = 4.0″ 2.8″) FAT was unable to find enough flux in the data cube to reliably initiate the fitting process and hence no model was created. The lower resolutions were successfully fitted and all parameters are consistent between the two models at medium and low resolutions. No radial variations are found in the dispersion, inclination, and PA.
5 Results
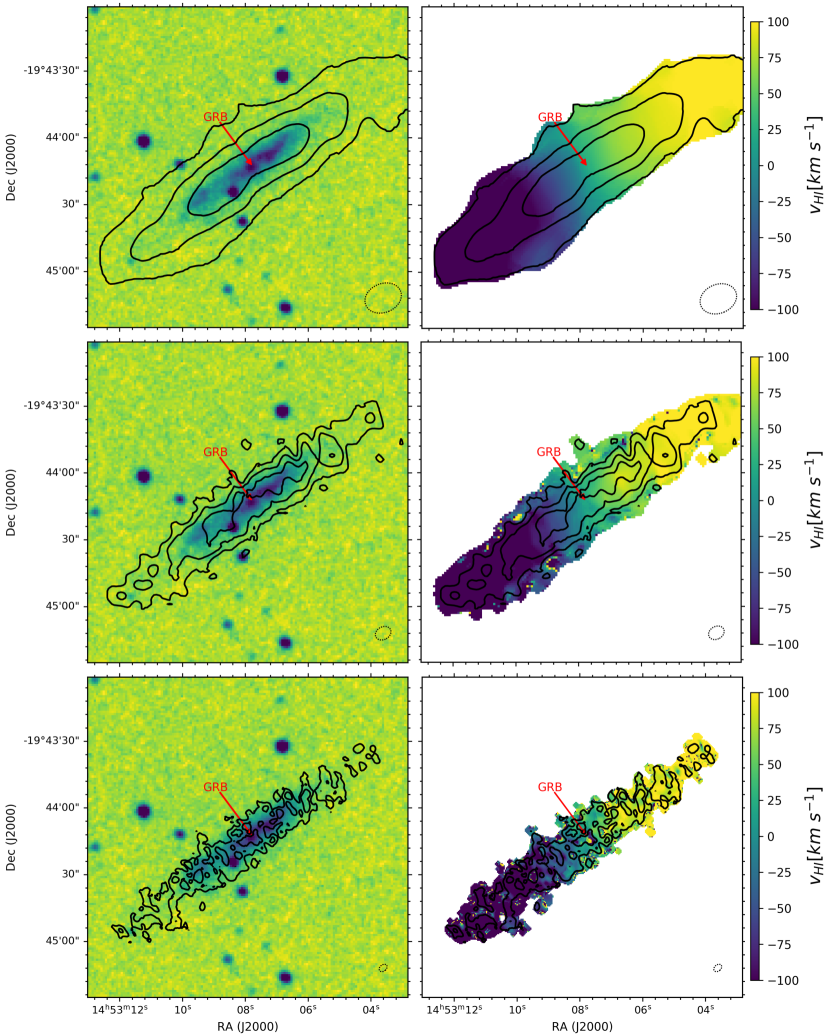
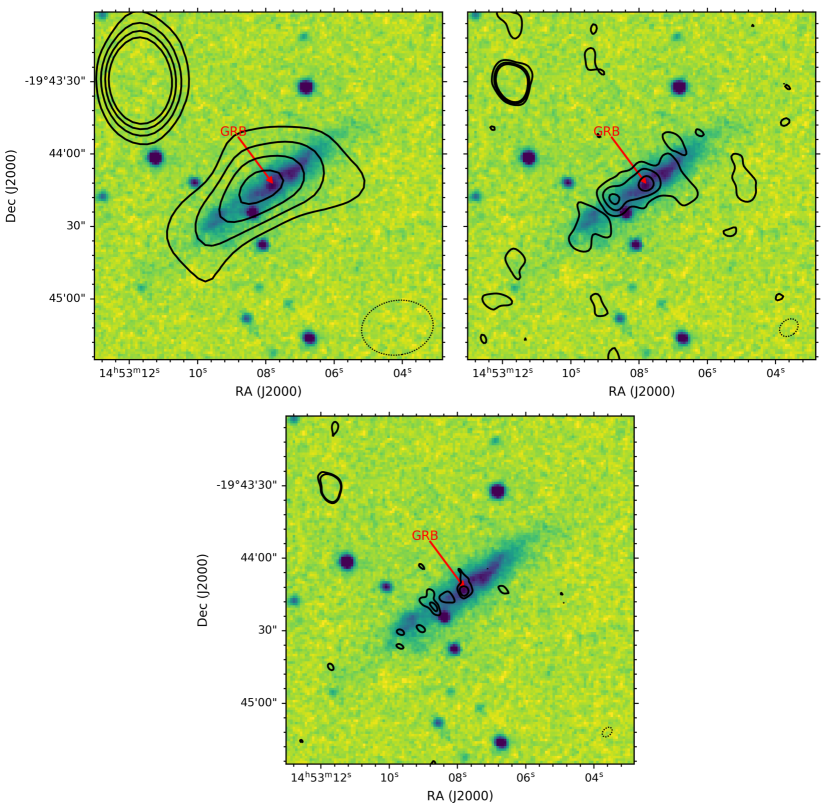
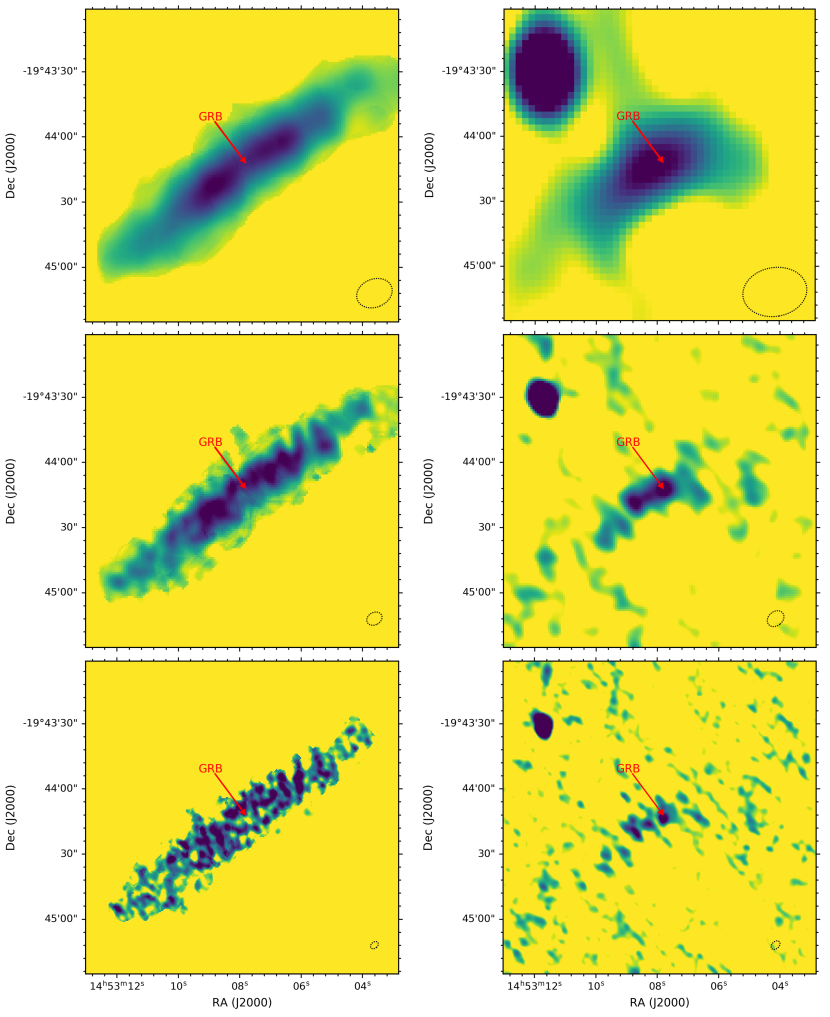
Our GMRT Hi data, the measurements made by MUSE (Tanga et al. 2018) and the ultraviolet (UV) image (Michałowski et al. 2018c) of the host galaxy of GRB 111005A are presented in Figures 1–8. We show the intensity maps as well as profiles along the galaxy. The profiles were constructed for all maps by measuring the signal in rectangular apertures perpendicular to the galaxy disk with a width of 6″ and height of 17″, encompassing together the entire detectable emission. Fig. 9 in the appendix show the color-scale images of the moment 0 and continuum maps.
The host has a clear S-shaped (‘integral sign’) warp in the UV image, which was not discussed in Michałowski et al. (2018c).
5.1 Residual scaling correction
The Hi and radio continuum fluxes in a given region appears to increase with increasing resolution of the cube. This is counter-intuitive, because usually better resolution leads to more flux being missed. First, we stress that for the most of the apertures the increase is less significant than and the maximum significance is only . We however investigated the reason of this behaviour. In order to confirm that the masking does not introduce biases we performed cleaning at all resolution with a fixed masked defined by the emission from a low-resolution cube tapered at 5 k and by just drawing a rectangle around the visible emission. In both cases we obtained similar results to our original analysis. We also repeated the analysis without the TCLEAN’s multiscale clean algorithm, again obtaining similar results.
We conclude that the flux increase with resolution is due to a higher fraction of uncleaned flux and stronger sidelobes in the dirty beam at higher resolutions. This makes the conversions from Jy beam-1 to Jy pixel-1 increasingly uncertain, because the uncleaned emission is not distributed according to a clean Gaussian beam with which the conversion is defined. We verified that this is the case by noting that the flux increase towards the highest resolution is proportional to the difference between the areas of the dirty and cleaned beams.
Hence, all Hi and radio continuum flux measurements were corrected for this effect using the method presented in Novak et al. (2019, 2020), which is based on scaling the residual map by the ratio of areas of the clean and dirty beams. For a given map and aperture size, this ratio can be found as , where , , and are the measurements in this aperture with the clean component map, the dirty image and the residual image. Then the true flux is . In this way the residuals are scaled so that their unit matches that of the clean component map.
As expected, in this way the difference between fluxes at different resolutions decreased to a level less than for all the measurements except of the difference between the Hi measurements at the coarsest and middle resolutions for the circular apertures (Table 1). The difference is less than for the same cubes for larger apertures encompassing the entire galaxy (the last row of Table 1) or halves of the galaxy (Table 2), so it is likely because the small circular apertures (matching the CO apertures) are too small and comparable with the beam size at the coarsest resolution, so the residual correction method works less efficiently for them. Hence, the Hi flux measurements in small circular apertures for the low-resolution cube are less reliable.
5.2 Atomic and molecular gas
The left panels of Fig. 1 show the contours of the Hi line (moment 0 maps) at three different resolutions overlayed on the UV image. Atomic gas is smoothly distributed in the disk without any significant off-centre concentrations, plumes, or extra-planar gas, which could have suggested a recent inflow/outflow of gas or environmental interactions. Specifically, there is no concentration of atomic gas at the GRB position. There is however 15% more atomic gas in the SE part of the galaxy, which is visible at all resolutions. The ratios of the atomic gas mass in the SE and NW halves are 1.16 0.04 (14.85″), 1.15 0.04 (6.55″), and 1.14 0.05 (3.4″). The difference in the extent of the UV emission and atomic gas is clearly visible, with the atomic disk extending beyond the UV disk, which is common for spiral galaxies (e.g. Wang et al. 2013).
The right panels of Fig. 1 show the intensity weighted mean velocity maps. The velocity pattern is regular, as expected for a non-disturbed rotating disk.
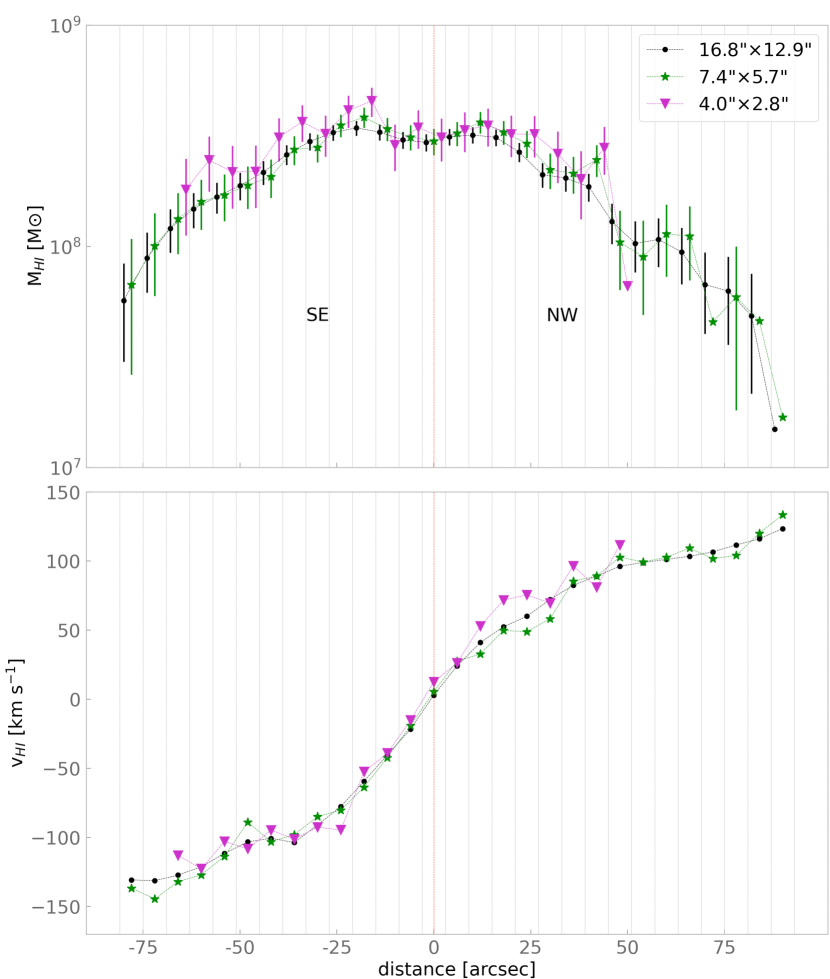
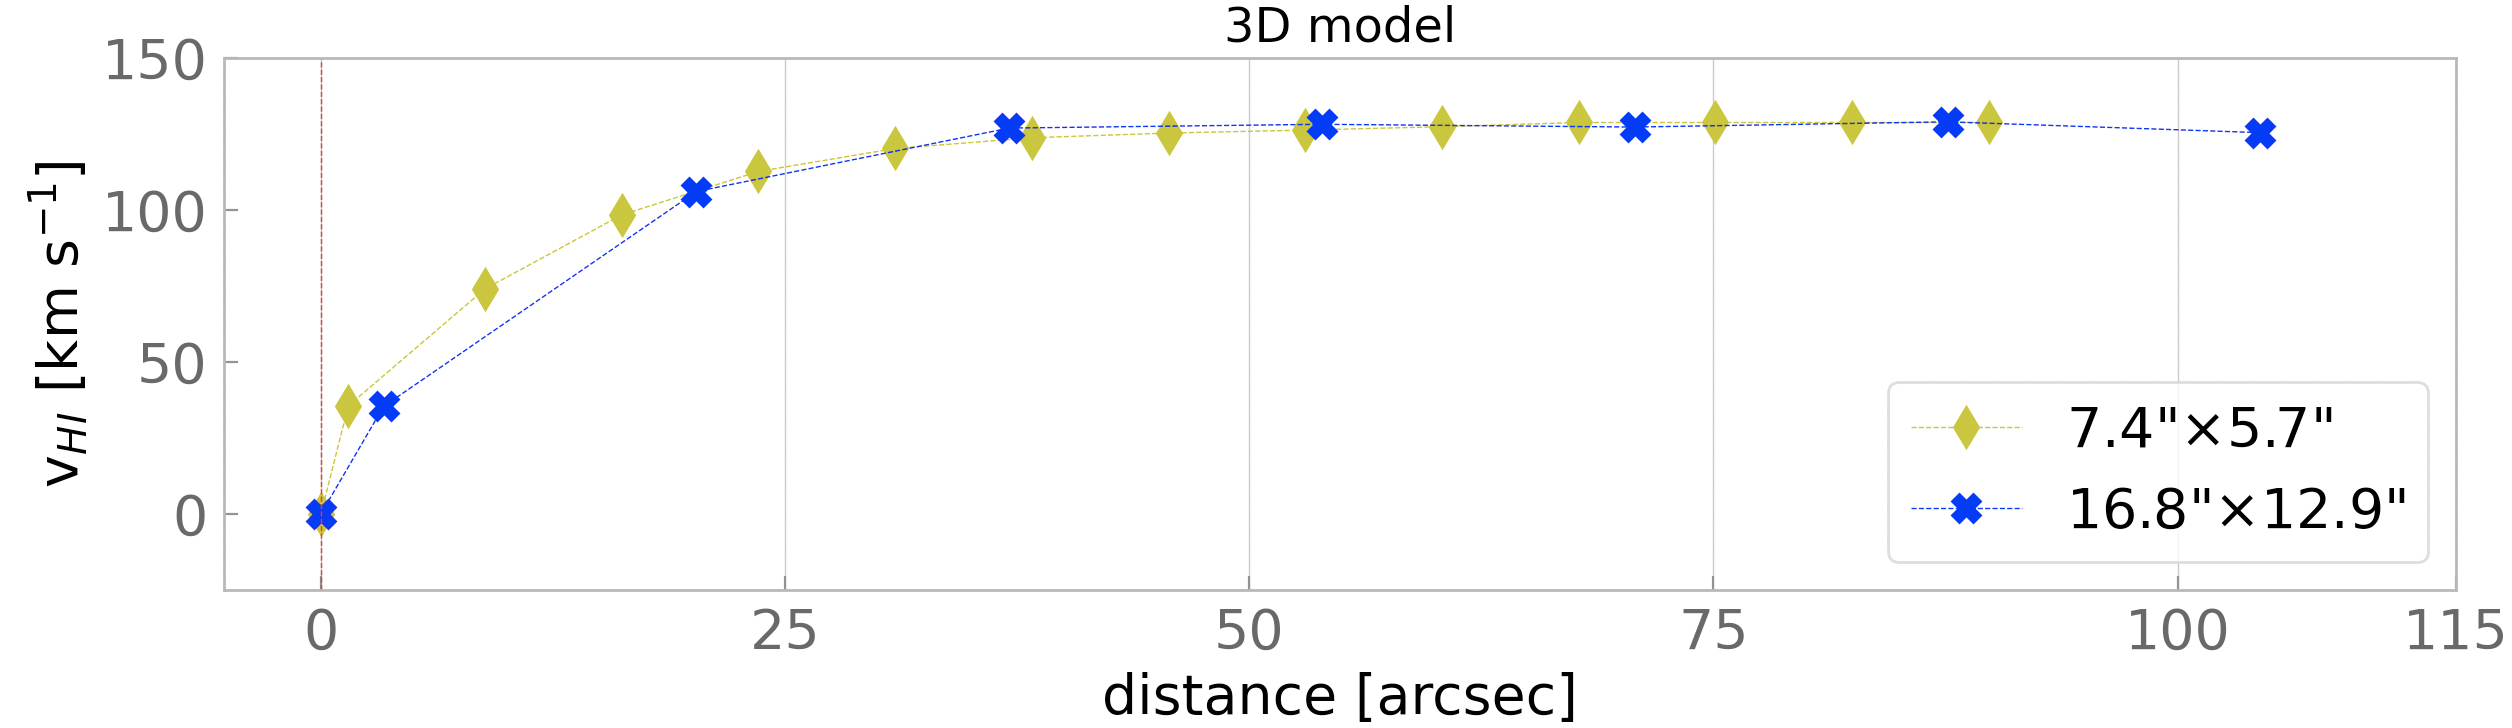
Fig. 2 presents the profiles of the Hi emission along the galaxy. The top panel shows the Hi mass distribution, which is relatively symmetric, but in the NW part the Hi profile falls off faster. The lower panel presents the rotation curves derived from the mean velocity (moment 1) maps. We explored this to search for any irregularities in the moment 1 maps, which we did not find. We note that the rotation curves derived from the tilted ring modelling (see below) are more accurate. The full velocity width is around 250 km s-1.
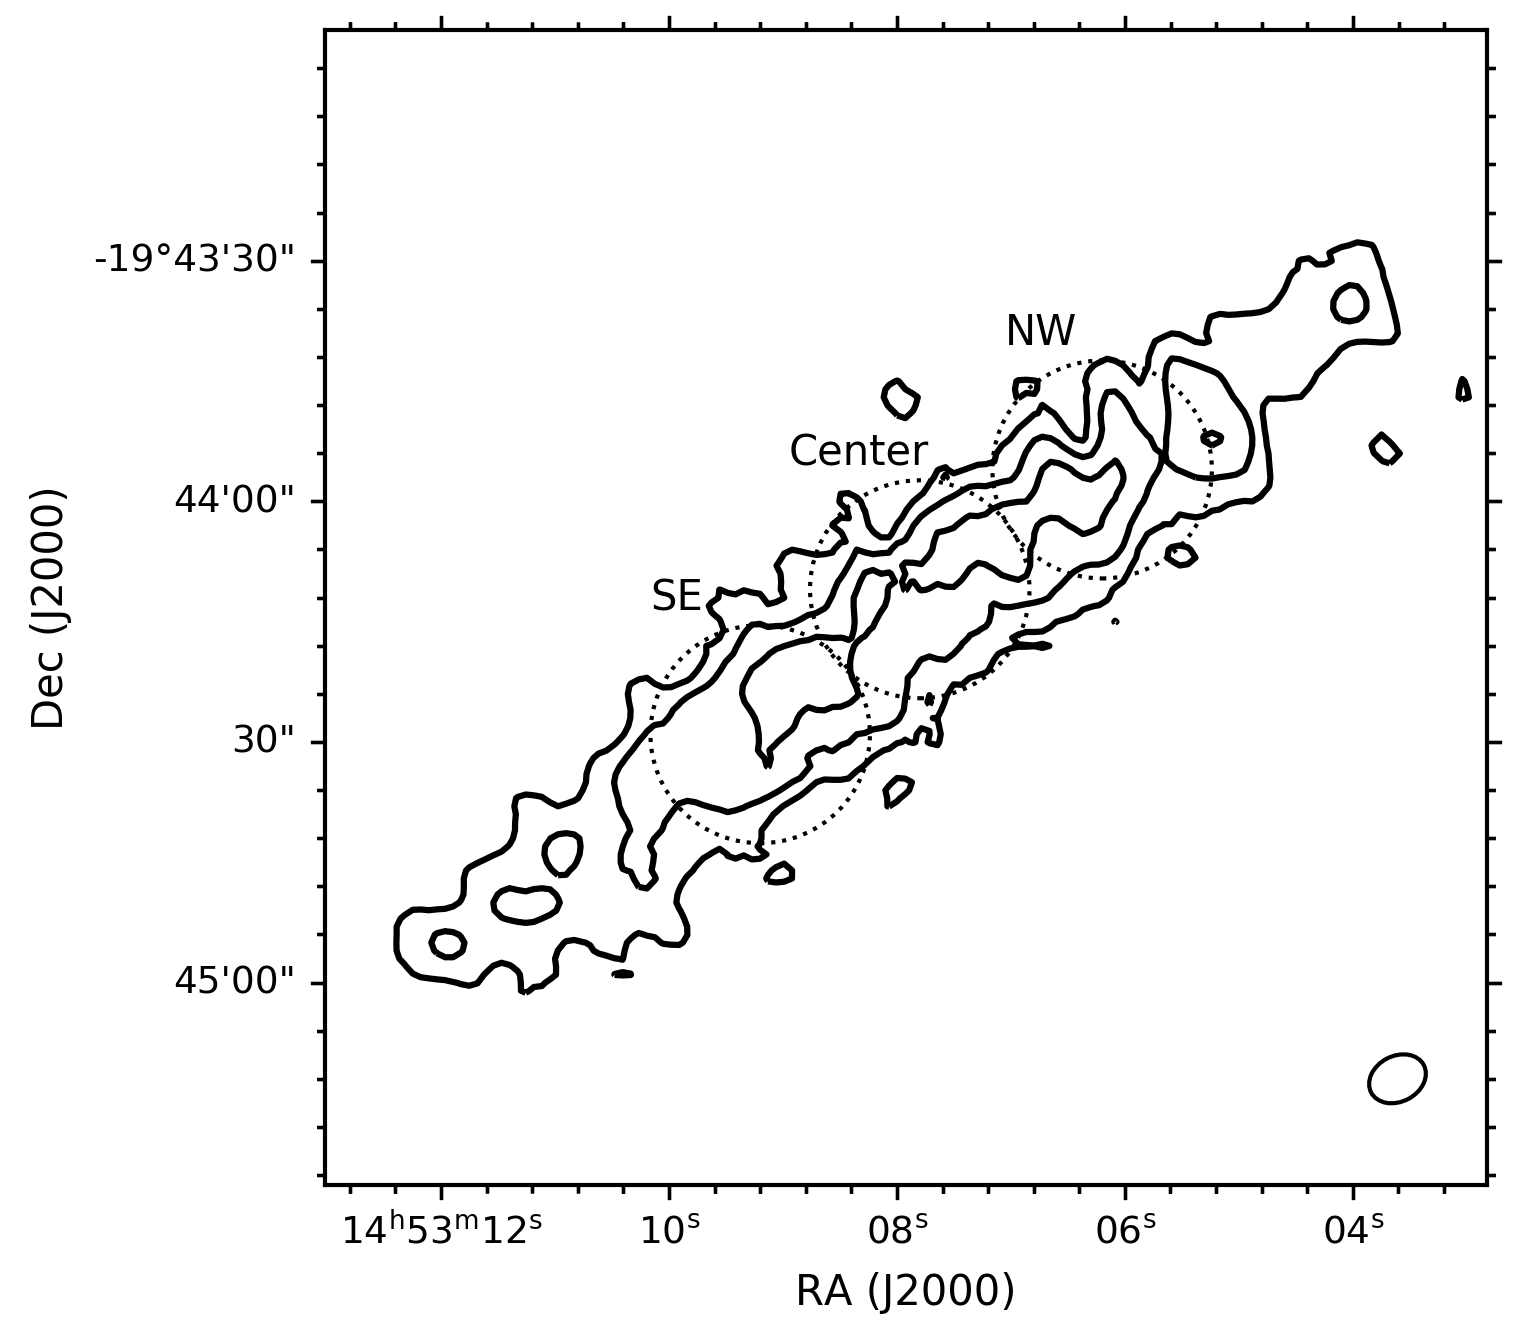
Michałowski et al. (2018b) analysed the CO distribution in three regions in the host galaxy (see their Fig. 1) and we performed analysis of atomic gas and properties derived from MUSE data at the same locations. The total signal from each region was measured using the Starlink package (Currie et al. 2014) with an aperture radius of 13.6″, matching the beam size of the CO observations. From the total Hi fluxes we measured the Hi masses () based on eq. 2 in Devereux & Young (1990). The positions of the apertures on our Hi map is shown on Fig. 10 in the appendix. We also used an elliptical aperture encompassing the entire galaxy to calculate the total atomic gas mass (). Table 1 lists the results of these aperture photometry measurements.
The distribution of atomic gas is slightly asymmetric: there is around 155% more gas in the SE region than in the the NW region. This was suggested by Michałowski et al. (2018c) based on the asymmetry of the Hi line shape. We also calculated the molecular gas fraction using the molecular masses obtained by Michałowski et al. (2018b). The SE region has twice lower molecular gas mass and higher atomic gas mass than the NW region, so the molecular gas fraction is low [, or , see Table 1]. This region encompasses one third of the host, but such low ratios are only found at the very outskirts of other galaxies (Leroy et al. 2008, their Fig. 17).
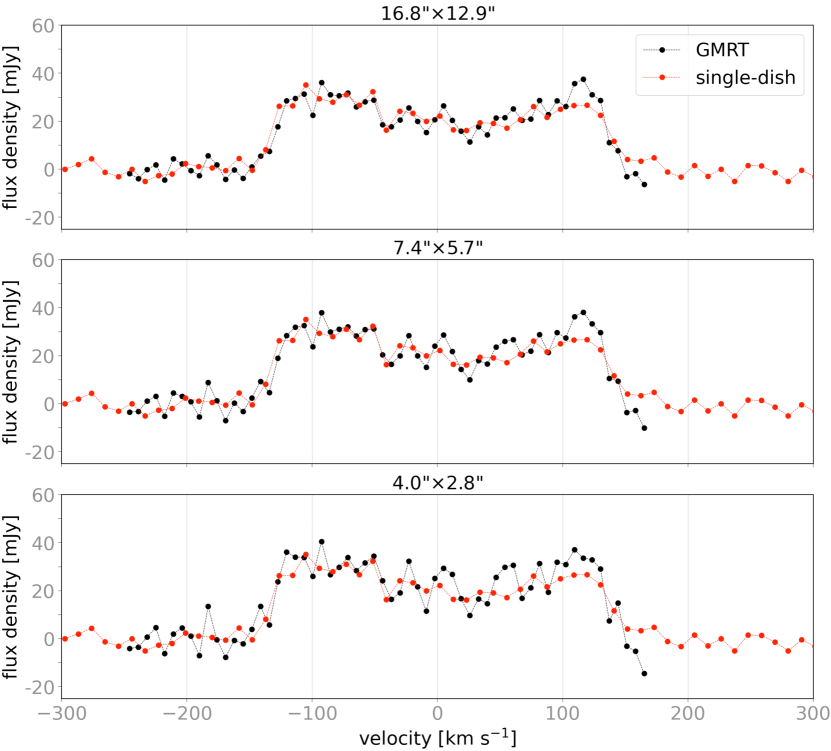
For the entire galaxy the atomic hydrogen mass was calculated using an elliptical aperture encompassing all the detected emission. The value measured here is consistent (M ) with the measurement reported in Michałowski et al. (2015) based on the single-dish spectrum from Theureau et al. (1998), especially taking into account the 10% flux calibration uncertainty. Fig. 3 shows the comparison of this single-dish HI spectrum and our GMRT observations at three spatial resolutions. The spectra are consistent with each other indicating that GMRT did not miss any extended emission.
5.3 Kinematic modelling
Table 3 presents the properties of the GRB 111005A host based on the tilted ring modelling (Sect. 4) of low- and medium-resolution Hi cubes. Inclination values confirm that the model is consistent with a nearly edge-on orientation. The position of the galaxy centre determined in the modelling is consistent with the position of GRB 111005A within 1–2. The GRB position is 0.1″ and 2.1″ away from the centre in the low-resolution cube in right ascension and declination, respectively, whereas the errors of the centre position are 0.2″ and 2.5″. For the medium-resolution cube the distance is 0.2″ and 2.8″ and the errors are 0.1″ and 1.1″.
The rotation curves derived from the tilted ring modelling are shown in Fig. 4 for data with resolutions of 16.8″12.9″ and 7.4″5.7″. They present a flattening at large radii, typical for spiral galaxies (e.g. Rubin et al. 1980), which signals a dominant dark matter contribution. Based on the maximum rotational velocity we calculated a total dynamical mass of the galaxy of 10.81010 (the 14.85″ data) and 9.7 1010 (the 6.55″ data). Subtracting the total Hi mass from Table 1, H2 mass from Michałowski et al. (2018b), and stellar mass from Michałowski et al. (2018c), we estimated a dark matter mass of 9.71010 (14.85″) and 8.61010 (6.55″). This corresponds to a dark matter fraction around 90, so this galaxy is dark-matter dominated.
The ratios of the Hi masses included in these models and the Hi masses measured directly from the GMRT data show that the model is able to explain and of the emission in low- and mid-resolution cubes, respectively. We also compared the GRB 111005A host with the very tight relation between MHI and DHI of Wang et al. (2016, their eq. 2). With a diameter of 178.9″and 158.8″(after deconvolving the beam, at a surface density of 1 pc-2), this relation predicts the Hi mass of 6.910 and 5.410, respectively, factor of and above the measured value. Hence, the host galaxy is 0.13 or 0.02 dex below this relation. The scatter of the relation is 0.06 dex, so the GRB 111005A host galaxy is located at most 2 sigma away from it.
5.4 Radio continuum
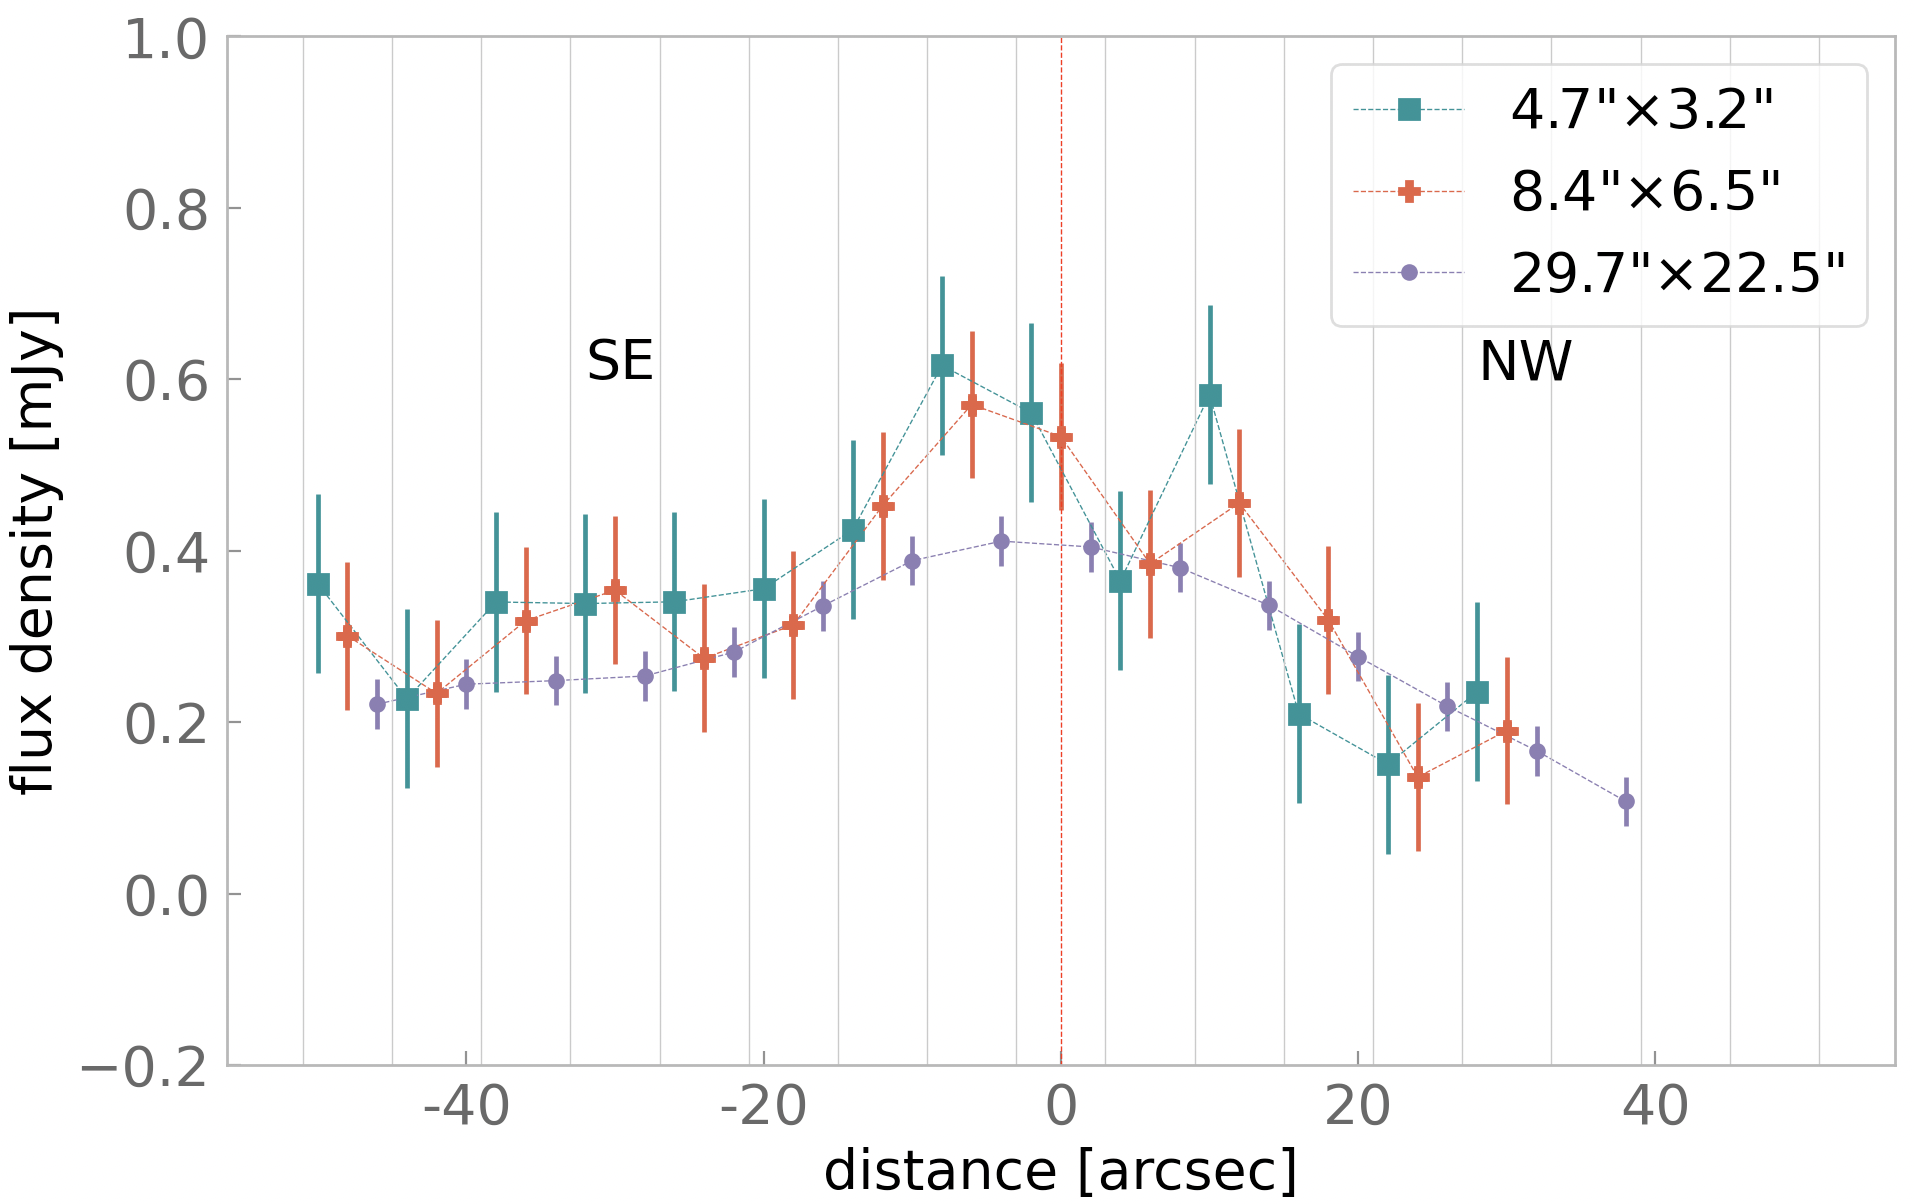
Radio continuum emission at 1.4 GHz presented in Fig. 5 reflects the star formation rate in the host galaxy and has a similar extent to the UV emission. To first order, the maps at the three different resolutions show a symmetrical structure. However, they all show slightly more emission to the SE of the galaxy, with more in the SE part at the lowest resolution.
Radio 1.4 GHz continuum profiles are shown in Fig. 6. The data show a hint of asymmetry at all resolutions, with the peak brightness shifted to the SE from the optical galaxy centre and the emission extending further in the SE direction. However, the sizes of error bars and the beam sizes prevent drawing a definite conclusion on this.
5.5 Stars, ionised gas and dust
The H SFR is corrected for dust extinction assuming the Calzetti et al. (1994) attenuation law with Rv=4.05. It is based on the H flux to SFR conversion described in Kennicutt (1998) but assuming a Chabrier IMF (Chabrier 2003), which reduces the SFR by a factor of 1.7 compared to a Salpeter IMF.
Regardless of the differences in gas content, the H-based SFRs in the NW and SE regions are very similar (Table 1). Using a hybrid calibration combining H with IR luminosities (Kennicutt & Evans 2012), we obtained an SFR of , which is consistent with that presented by Michałowski et al. (2018c) based on infrared luminosity. The total SFR determined from the H alone is , two times smaller than the IR-based SFR determined by Michałowski et al. (2018c). Similarly, the total radio continuum flux (Table 2) implies an SFR of (with the callibration of Bell 2003). The factor of two difference between these estimates and the IR SFR is within the typical calibration uncertainty, but indicates a contribution of evolved stars to dust heating, making the IR estimate too large. However, we cannot rule out the possibility that the H estimate is underestimated due to dust extinction and the radio estimate is underestimated due to age effects.
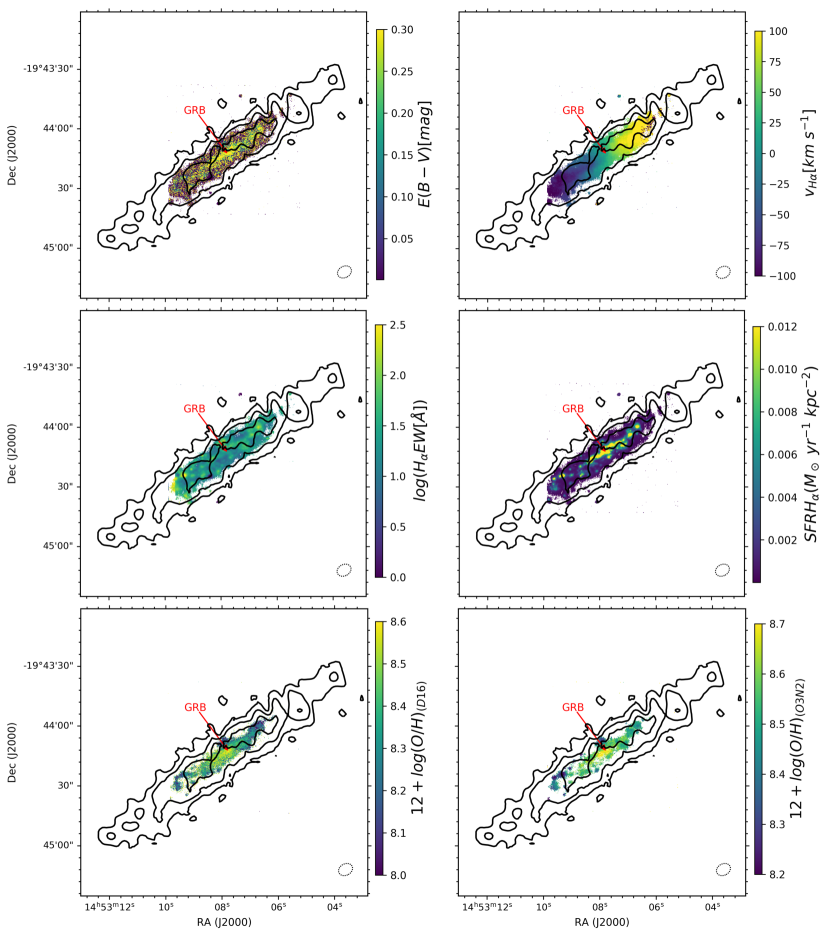
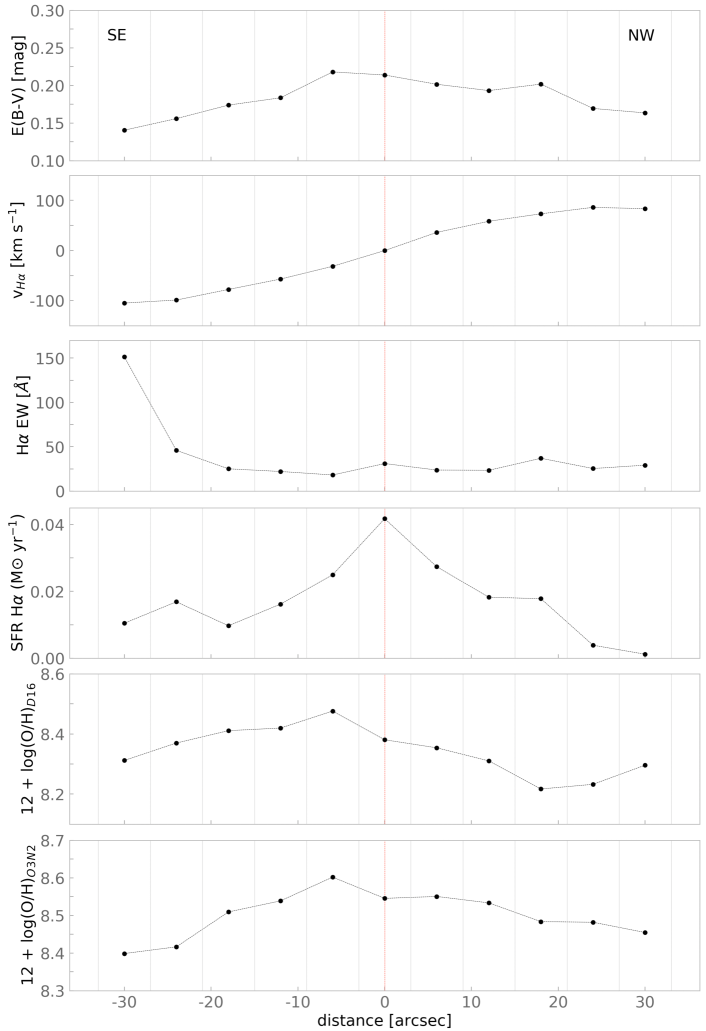
Fig. 7 shows physical quantities derived from MUSE data (Tanga et al. 2018) superimposed on the Hi moment zero map. We show the full extent of the data, whereas Tanga et al. (2018) showed the central . We present the SFR and the O3N2 metallicity maps for the first time. We infer the following results from these data. Similarly to the Hi observations, the H velocity map shows a regular rotational pattern, also noted by Tanga et al. (2018). Dust reddening E(B-V) is highest along the middle of the disk, as expected given the prominent dust lanes (Fig. 15 of Michałowski et al. 2018c). These central regions are also much more active than regions further from the disk plane, given the SFR surface density map based on the H emission. The H equivalent width is a proxy of the age of a stellar population in young ( Myr) starbursts (Stasińska & Leitherer 1996; Fernandes et al. 2003). There are several regions with higher equivalent widths ( and resulting lower ages), mostly at both ends of the disk and (1 kpc) north-east of the centre (the latter was discussed by Tanga et al. 2018). Two methods were used by Tanga et al. (2018) to measure metallicity in the host galaxy. Both diagnostics show a typical radial behaviour with metallicity declining towards the outskirts. The region north-east of the galaxy centre does not fit into this pattern because it has as low metallicity as the regions at a similar height above the disk, but located much further from the centre ( = 8.1–8.2). The diagnostic of Dopita et al. (2016) resulted in the NW region being the most metal-poor, but this is not reflected in the O3N2 method (Pettini & Pagel 2004). Consistently with each other, both methods result in low metallicity for the SE part.
Fig. 8 shows the profiles of six parameters calculated based on the MUSE data. Such analysis was not done by Tanga et al. 2018. Dust reddening, , shows the largest value in the centre of the host galaxy decreasing with distance. The NW region is more reddened, with decreasing less than in the SE half. The H velocity profile is very symmetrical. The H equivalent width is relatively flat, but the outermost region towards the SE reaches 150 Å and clearly stands out from the other locations. The highest value of the star formation density is found in the centre of the galaxy, near the GRB 111005A position, generally declining outwards. For metallicities derived with both the D16 and O3N2 methods, the highest value occurs in the second aperture, from the centre towards SE. This behaviour seems similar to the case of the 1.4 GHz profiles presented in Fig.6. This is because of the low-metallicity region north-east of the galaxy centre, lowering the average metallicity in the central aperture. An asymmetry is also evident in both metallicity profiles. The D16 metallicity in the SE half is higher than in the NW half, while we see the opposite for the O3N2 method.
We made similar measurements as in Table 1 to investigate the differences between the two halves (SE and NW) of the galaxy. In Table 2 we show the results of the aperture photometry on GMRT and MUSE maps with two apertures together encompassing the entire galaxy. There is more atomic gas in the SE half and this is true for each resolution, but the difference is significant only at a level. A similar difference is apparent for the radio continuum flux. The average dust reddening for both halves is similar, unlike what the profile suggests (Fig. 8). This is because the average value is dominated by a large number of pixels with low . Due to regions with high H equivalent widths in the SE end of the galaxy, the corresponding half has a high average value of this parameter. The total H SFRs of the galaxy halves are comparable. In the case of metallicity, we again see differences in results depending on the method used. For D16 the average metallicity of the SE half is higher, whereas the O3N2 method results in similar values for both halves.
5.6 Large-scale environment
We also analysed the large-scale environment around the GRB 111005A host using the NASA/IPAC Extragalactic Database (NED). The closest galaxies are WISEA J145239.17-192125.8 and ESO 580-G052, 24′ and 30′ (321 kpc and 301 kpc) away, respectively. Within 1 Mpc in projection and there are 6 galaxies. Moreover, 1.37 Mpc (1.4 deg) away from the GRB 111005A host there is a galaxy group with NGC 5791 as the brightest member (Crook et al. 2007; Díaz-Giménez et al. 2012). The GRB 111005A host appears to lie in the outskirts of this group.
6 Discussion
The host of GRB 111005A displays many regular features: largely symmetrical atomic gas (Fig. 1 and 2, Table 2) and radio continuum (Fig. 5 and 6, Table 2) distributions, and rotational patterns derived from both Hi and H lines (Fig. 7 and 8). There are only small deviations from this regularity, which will be discussed below.
Hence, there is no evidence of strong and recent gas inflow/outflow or environmental interactions. This is different from the irregular ISM distributions in the hosts of GRBs, broad-lined type Ic (Ic-BL) SNe, and fast radio bursts (FRBs). Four such explosions were found near the most significant concentration of atomic gas: GRB 980425 (Arabsalmani et al. 2015, 2019; Michałowski et al. 2015), GRB 060505 (Michałowski et al. 2015), SN 2009bb (Michałowski et al. 2018a), and SN 2002ap (Michałowski et al. 2020a). Moreover, GRB 980425 (Michałowski et al. 2014, 2016), GRB 060505 (Thöne et al. 2008, 2014), GRB 100316D (Izzo et al. 2017), and SN 2009bb (Michałowski et al. 2018a) exploded close to the region that is the brightest in the infrared, radio, H, and [OI]. Similarly, the Hi line profiles of two FRB hosts for which such measurement is possible were found to be extremely asymmetric, compared to those of the general population of galaxies (Michałowski 2021). On the other hand the ISM was found to be more regular for the host of SNe type Ib (Michałowski et al. 2020b) and the transient AT 2018cow (Michałowski et al. 2019). However, Roychowdhury et al. (2019) reported AT 2018cow in a distorted dense Hi ring-like structure.
Most long nearby GRBs for which deep spectral observations are possible are associated with SNe type Ic-BL (Hjorth & Bloom 2012), exhibit sub-solar metallicities in their environments (Leloudas et al. 2011; Modjaz et al. 2011; Japelj et al. 2016), and exploded in galaxies with irregular ISM distributions (see above). On the other hand, GRB 111005A was not associated with an SN, exploded in a region with solar metallicity, and its host has a regular ISM distribution. These properties may suggest that the progenitor of GRB 111005A is different from that of most long GRBs. This could be a compact object merger (Wang et al. 2017; Michałowski et al. 2018c; Tanga et al. 2018; Yue et al. 2018; Dado & Dar 2018). Indeed, the host galaxy of the neutron star merger GW 170817 has a regular ISM distribution with only minor irregularities (Levan et al. 2017). Low numbers of GRB hosts with characterised ISM properties precludes drawing conclusions from the ISM distribution alone.
There are a few more subtle irregularities of the GRB 111005A host, which may point to a weak gas inflow or interaction. We note that these irregularities are weak and the significance of most of them is around , so deeper observations are needed to investigate this topic. However, these irregularities were found in independent datasets, so their combined significance is higher. We also note that these features can in principle be explained by different mechanisms.
The S-shape of the galaxy, clear on the UV image (Fig. 5), asymmetry in the 1.4 GHz continuum image (Figs. 5 and 6, Table 2), and the asymmetric Hi profile (Fig. 3) suggests an interaction. S-shaped warps in stellar (Reshetnikov & Combes 1999; Reshetnikov et al. 2016; Ann & Park 2006) and Hi (Sancisi et al. 2008) distributions are common and were claimed to be indications of tidal interaction or gas accretion. Similarly, S-shapes in simulations have been induced by interactions, or by gas accretion, and can be sustained several Gyr after such events (Kim et al. 2014; Gómez et al. 2016, 2017; Semczuk et al. 2020). Such a long timescale makes the GRB event unlikely to be connected with a potential interaction. Ram pressure stripping can also induce S-shaped warps (Haan & Braun 2014), but this probably does not apply to the GRB 111005A host because it is more than 1 Mpc away from a galaxy group, so the intragroup medium density is unlikely to be high at its position and any infall velocity must be low.
Asymmetric Hi spectrum (Michałowski et al. 2018c; Fig. 3) resulting from more atomic gas in the SE part of the galaxy (Table 2) also indicates external influence, e.g. tidal interaction or gas inflow. Indeed, Watts et al. (2020) found that galaxies with asymmetric Hi line profiles generally contain 29% less Hi than their symmetric counterparts, and this is due to gas removal during the interaction with galaxy environment (see also Reynolds et al. 2020; Hu et al. 2021). Indeed, the host of GRB 111005A contains ()% less atomic gas than predicted from the relation between the atomic gas and size (see Sect. 5.3).
We quantified the Hi line asymmetry of the GRB 111005A host using the diagnostics defined by Reynolds et al. (2020). The GRB 111005A host has a difference between the flux-weighted velocity and the midpoint velocity at 50% of the peak flux of (eq. 4 in Reynolds et al. 2020); the integrated flux ratio between the left and right halves of the spectrum of (eq. 6); the flux ratio between the left and right peaks of the spectrum of (eq. 7); and the residual from the subtraction of the spectrum flipped around the flux-weighted velocity from the original spectrum of (eq. 8). We compared these values with measurements for galaxies with stellar masses of from the Local Volume Hi Survey (LVHIS; Koribalski et al. 2018) and the VLA Imaging of Virgo in Atomic Gas (VIVA; Chung et al. 2009), with low and high environmental density respectively (see Fig. 8 and Table 3 of Reynolds et al. 2020). All asymmetry diagnostics for the GRB 111005A host, except , are 1–2 standard deviations higher than the mean for the low-density LVHIS galaxies and consistent with the mean for the high-density VIVA galaxies. Hence, the Hi spectrum of the GRB 111005A host is at the highest end of asymmetry for galaxies in the low-density environments and is similarly asymmetric as spectra of galaxies in a cluster. This supports the hypothesis that this asymmetry is related to the interaction with the environment (gas inflow, merger, etc.).
The SE part of the galaxy also shows some features, which may suggest gas accretion. There is twice less molecular gas (Michałowski et al. 2018b) and more atomic gas than in the NW part, so the molecular gas fraction is approximately a factor of two lower, but this is significant only at a level (Tables 1 and 2). The radio continuum emission is also stronger in the SE than in the NW (Figs. 5, 6 and Table 2), again significant at a level. If these differences are confirmed with deeper data, then they can be explained by either interaction or gas inflow. Both processes can lead to higher atomic gas density in a part of a galaxy (either directly during inflow or by rearranging gas distribution during interaction). This can can also enhance the SFR at that position due to a higher gas density, explaining stronger radio emission. If this process was recent, then the Hi to H2 conversion has not taken place yet. The metallicity effect could in principle explain low CO emission (Bolatto et al. 2013), but we measured a similar metallicity in the CO-rich north-western part (Fig. 7, 8 and Table 1), so this is not the case for the SE region.
Similarly, the region just outside of the galaxy centre, 3.5″ (1 kpc) to the north-east has unusual properties (see Figs. 5–7 of Tanga et al. 2018 for a zoom-in view of the MUSE data). It has untypically low metallicity (8.15 for the D16 calibration and 8.25 for the O3N2 calibration), compared to other regions at similar galactocentric distances, and exhibits high H equivalent width (), suggesting a very young stellar population (Fig. 7). These properties are consistent with gas flowing from the intergalactic medium and enhancing star formation (see also Sánchez Almeida et al. 2013, 2014b, 2014a, 2015). However, only the detection of a stream of gas extending outside the galaxy would provide strong evidence supporting this conclusion. If this is correct, then the birth of the progenitor of GRB 111005A may be related to this process.
On the other hand, we did not find any definitive signature of outflows. The MUSE spectrum at the GRB 111005A position does not show any deviation from a single Gaussian profile. Conversely, Thöne et al. (2019) found that all long GRB hosts experience strong outflows, based on the existence of broad mostly blueshifted H components, kinematically decoupled from narrow components. However, in our case, even if such an outflow is present, we would not be able to detect it in the spectra, because it would likely be directed perpendicular to the line-of-sight for this edge-on galaxy.
With our radio continuum image (Fig. 5) we can also test for the presence of a radio-loud AGN. We did not detect a strong point source in the centre, so we rule out this possibility.
The reason for the discrepancy between the metallicity measurements using the D16 and O3O2 methods (Fig. 8 and Table 1) is likely the same as described in Krühler et al. (2012). Namely the O3N2 method misinterprets highly ionised regions for having low metallicity. The D16 method takes ionisation into account and therefore is more accurate.
Interaction with two nearby galaxies 300 kpc away (in projection) may be responsible for the S-shape of the GRB 111005A host, if in the past they were closer. The distortion may also be due to a past minor merger. On the other hand the projected distance to the NGC 5791 galaxy group of 1.37 Mpc makes it unlikely that interaction with the group can significantly modify the distribution of gas or stars the GRB 111005A host. However, the proximity to the group implies the presence of a supply of intergalactic gas to be accreted by the GRB 111005A host. A similar situation was found for the SN 2009bb host (Michałowski et al. 2018a). The projected virial radius of the NGC 5791 group is 0.24 Mpc (Crook et al. 2007, based on the separations of the group members). Hot, X-ray emitting gas has been detected out to more than 0.5 Mpc from group centres (Rasmussen & Ponman 2007; Mernier et al. 2017). Hence, the GRB 111005A host is not a member of this group, but at its position, i.e. at the distance of 3–4 times the group radius, one can expect some gas from the group.
| Reg. | MHI | 1.4 GHz | E | HEW | SFR | |||||||
|---|---|---|---|---|---|---|---|---|---|---|---|---|
| (109 ) | (mJy) | (mag) | () | ( yr-1) | ||||||||
| 14.85″ | 6.55″ | 3.4″ | 26.5″ | 7.45″ | 3.95″ | D16 | O3N2 | |||||
| NW half | 2.58 | 2.66 | 2.83 | 1.37 | 1.78 | 1.90 | 0.19 | 29 | 8.31 | 8.52 | 0.09 | |
| 0.09 | 0.09 | 0.12 | 0.36 | 0.45 | 0.33 | |||||||
| SE half | 2.98 | 3.06 | 3.23 | 2.49 | 2.93 | 2.97 | 0.18 | 70 | 8.41 | 8.51 | 0.10 | |
| 0.06 | 0.07 | 0.09 | 0.36 | 0.45 | 0.33 | |||||||
| Res. | RA | Dec | incl. | vrot,max | DHI | DHI | fluxtot | MHI,mod | MHI,mod / |
|---|---|---|---|---|---|---|---|---|---|
| (hh:mm:ss) | (dd:mm:ss) | (∘) | (km s-1) | (arcsec) | (kpc) | (Jy km s-1) | (109 ) | MHI | |
| 14.85″ | 14:53:07.92 | -19:44:14.08 | 85 | 125 | 179 | 48.4 | 6.36 | 4.7 | 0.830.03 |
| 6.55″ | 14:53:07.98 | -19:44:14.75 | 83 | 129 | 159 | 43.0 | 5.48 | 4.0 | 0.700.03 |
7 Conclusions
Based on new GMRT and archival MUSE observations of the host galaxy of the unusual long GRB 111005A, we have characterized the interstellar medium properties of the host across the galaxy and in the vicinity of the GRB explosion. Deep observations of SN-less GRB hosts are scarce and hence this study contributes significantly to the understanding of ISM properties in such galaxies.
The host galaxy of GRB 111005A is characterized by regular largely symmetrical atomic gas, radio continuum distribution, and rotational patterns with only small deviations from this regularity. This is different from the irregular ISM distributions seen in the hosts of long GRBs and type Ic SN, which may suggest that the progenitor of GRB 111005A is different from the explosion of a very massive star, consistent with the fact that no SN was found to be associated with the GRB.
Subtle irregularities include a warped S-shape in the UV image, asymmetry in the Hi and radio continuum distribution, a low-metallicity region close to the GRB position, and a region with very high H EW. This suggests weak interaction with inflowing gas or tidal forces with another galaxy. We note that these irregularities are weak and the significance of most of them is around , so deeper observations are needed to investigate this topic. However, these irregularities were found in independent datasets, so their combined significance is higher.
Two other galaxies are present within 300 kpc and they can be responsible for the S-shape of the GRB 111005A host. Additionally there is a group of galaxies 1.37 Mpc away, whose intergalactic medium may fuel frequent gas inflows into the GRB host.
References
- Abbott et al. (2017) Abbott B.P., et al., 2017, ApJ, 848, L12
- Ann & Park (2006) Ann H.B., Park J.C., 2006, New A, 11, 293
- Arabsalmani et al. (2015) Arabsalmani M., Roychowdhury S., Zwaan M.A., Kanekar N., Michałowski M.J., 2015, MNRAS, 454, L51
- Arabsalmani et al. (2019) Arabsalmani M., et al., 2019, MNRAS, 485, 5411
- Bacon et al. (2010) Bacon R., et al., 2010, In: Ground-based and Airborne Instrumentation for Astronomy III, vol. 7735 of Society of Photo-Optical Instrumentation Engineers (SPIE) Conference Series, 773508
- Baldwin et al. (1981) Baldwin J.A., Phillips M.M., Terlevich R., 1981, PASP, 93, 5
- Barthelmy et al. (2005) Barthelmy S.D., et al., 2005, Space Sci. Rev., 120, 143
- Barthelmy et al. (2011) Barthelmy S.D., et al., 2011, GRB Coordinates Network, 12415, 1
- Bell (2003) Bell E.F., 2003, ApJ, 586, 794
- Berger (2014) Berger E., 2014, ARA&A, 52, 43
- Bolatto et al. (2013) Bolatto A.D., Wolfire M., Leroy A.K., 2013, ARA&A, 51, 207
- Calzetti et al. (1994) Calzetti D., Kinney A.L., Storchi-Bergmann T., 1994, ApJ, 429, 582
- Castro Cerón et al. (2006) Castro Cerón J.M., Michałowski M.J., Hjorth J., Watson D., Fynbo J.P.U., Gorosabel J., 2006, ApJ, 653, L85
- Castro Cerón et al. (2010) Castro Cerón J.M., Michałowski M.J., Hjorth J., Malesani D., Gorosabel J., Watson D., Fynbo J.P.U., Morales Calderón M., 2010, ApJ, 721, 1919
- Christensen et al. (2004) Christensen L., Hjorth J., Gorosabel J., 2004, A&A, 425, 913
- Chung et al. (2009) Chung A., van Gorkom J.H., Kenney J.D.P., Crowl H., Vollmer B., 2009, AJ, 138, 1741
- Crook et al. (2007) Crook A.C., Huchra J.P., Martimbeau N., Masters K.L., Jarrett T., Macri L.M., 2007, ApJ, 655, 790
- Currie et al. (2014) Currie M.J., Berry D.S., Jenness T., Gibb A.G., Bell G.S., Draper P.W., 2014, In: Manset N., Forshay P. (eds.) Astronomical Data Analysis Software and Systems XXIII, vol. 485 of Astronomical Society of the Pacific Conference Series, 391
- Dado & Dar (2018) Dado S., Dar A., 2018, ApJ, 855, 88
- Della Valle et al. (2006) Della Valle M., et al., 2006, Nature, 444, 1050
- Devereux & Young (1990) Devereux N.A., Young J.S., 1990, ApJ, 359, 42
- Díaz-Giménez et al. (2012) Díaz-Giménez E., Mamon G.A., Pacheco M., Mendes de Oliveira C., Alonso M.V., 2012, MNRAS, 426, 296
- Dopita et al. (2016) Dopita M.A., Kewley L.J., Sutherland R.S., Nicholls D.C., 2016, Ap&SS, 361, 61
- Elliott et al. (2013) Elliott J., et al., 2013, A&A, 556, A23
- Fernandes et al. (2003) Fernandes R.C., Leão J.R.S., Lacerda R.R., 2003, MNRAS, 340, 29
- Fong et al. (2013) Fong W., et al., 2013, ApJ, 769, 56
- Fynbo et al. (2006) Fynbo J.P.U., et al., 2006, Nature, 444, 1047
- Gal-Yam et al. (2006) Gal-Yam A., et al., 2006, Nature, 444, 1053
- Gómez et al. (2016) Gómez F.A., White S.D.M., Marinacci F., Slater C.T., Grand R.J.J., Springel V., Pakmor R., 2016, MNRAS, 456, 2779
- Gómez et al. (2017) Gómez F.A., White S.D.M., Grand R.J.J., Marinacci F., Springel V., Pakmor R., 2017, MNRAS, 465, 3446
- Haan & Braun (2014) Haan S., Braun R., 2014, MNRAS, 440, L21
- Hashimoto et al. (2015) Hashimoto T., Perley D.A., Ohta K., Aoki K., Tanaka I., Niino Y., Yabe K., Kawai N., 2015, ApJ, 806, 250
- Hatsukade et al. (2020) Hatsukade B., Ohta K., Hashimoto T., Kohno K., Nakanishi K., Niino Y., Tamura Y., 2020, ApJ, accepted [arXiv:2002.09121]
- Hjorth & Bloom (2012) Hjorth J., Bloom J.S., 2012, Cambridge University Press, 169
- Hjorth et al. (2003) Hjorth J., et al., 2003, ApJ, 597, 699
- Hu et al. (2021) Hu W., Cortese L., Staveley-Smith L., Catinella B., Chauhan G., Lagos C.d.P., Oosterloo T., Chen X., 2021, arXiv e-prints, arXiv:2108.12712
- Hunt et al. (2014) Hunt L.K., et al., 2014, A&A, 565, A112
- Izzo et al. (2017) Izzo L., et al., 2017, MNRAS, 472, 4480
- Japelj et al. (2016) Japelj J., et al., 2016, A&A, 590, A129
- Jespersen et al. (2020) Jespersen C.K., Severin J.B., Steinhardt C.L., Vinther J., Fynbo J.P.U., Selsing J., Watson D., 2020, ApJ, 896, L20
- Joye & Mandel (2003) Joye W.A., Mandel E., 2003, In: H. E. Payne, R. I. Jedrzejewski, & R. N. Hook (ed.) Astronomical Data Analysis Software and Systems XII, vol. 295 of Astronomical Society of the Pacific Conference Series, 489
- Józsa et al. (2007) Józsa G.I.G., Kenn F., Klein U., Oosterloo T.A., 2007, A&A, 468, 731
- Kamphuis et al. (2015) Kamphuis P., Józsa G.I.G., Oh S..H., Spekkens K., Urbancic N., Serra P., Koribalski B.S., Dettmar R.J., 2015, MNRAS, 452, 3139
- Kennicutt & Evans (2012) Kennicutt R.C., Evans N.J., 2012, ARA&A, 50, 531
- Kenyon et al. (2018) Kenyon J.S., Smirnov O.M., Grobler T.L., Perkins S.J., 2018, MNRAS, 478, 2399
- Kim et al. (2014) Kim J.H., Peirani S., Kim S., Ann H.B., An S.H., Yoon S.J., 2014, ApJ, 789, 90
- Klose et al. (2019) Klose S., et al., 2019, ApJ, 887, 206
- Koribalski et al. (2018) Koribalski B.S., et al., 2018, MNRAS, 478, 1611
- Kouveliotou et al. (1993) Kouveliotou C., Meegan C.A., Fishman G.J., Bhat N.P., Briggs M.S., Koshut T.M., Paciesas W.S., Pendleton G.N., 1993, ApJ, 413, L101
- Krühler et al. (2012) Krühler T., et al., 2012, A&A, 546, A8
- Krühler et al. (2015) Krühler T., et al., 2015, A&A, 581, A125
- Leloudas et al. (2011) Leloudas G., et al., 2011, A&A, 530, A95
- Leroy et al. (2008) Leroy A.K., Walter F., Brinks E., Bigiel F., de Blok W.J.G., Madore B., Thornley M.D., 2008, AJ, 136, 2782
- Levan et al. (2017) Levan A.J., et al., 2017, ApJ, 848, L28
- Makarov et al. (2014) Makarov D., Prugniel P., Terekhova N., Courtois H., Vauglin I., 2014, A&A, 570, A13
- McMullin et al. (2007) McMullin J.P., Waters B., Schiebel D., Young W., Golap K., 2007, In: Shaw R.A., Hill F., Bell D.J. (eds.) Astronomical Data Analysis Software and Systems XVI, vol. 376 of Astronomical Society of the Pacific Conference Series, 127
- Mernier et al. (2017) Mernier F., et al., 2017, A&A, 603, A80
- Michałowski (2021) Michałowski M.J., 2021, ApJ, 920, L21
- Michałowski et al. (2008) Michałowski M.J., Hjorth J., Castro Cerón J.M., Watson D., 2008, ApJ, 672, 817
- Michałowski et al. (2014) Michałowski M.J., et al., 2014, A&A, 562, A70
- Michałowski et al. (2015) Michałowski M.J., et al., 2015, A&A, 582, A78
- Michałowski et al. (2016) Michałowski M.J., et al., 2016, A&A, 595, A72
- Michałowski et al. (2018a) Michałowski M.J., et al., 2018a, A&A, 618, A104
- Michałowski et al. (2018b) Michałowski M.J., et al., 2018b, A&A, 617, A143
- Michałowski et al. (2018c) Michałowski M.J., et al., 2018c, A&A, 616, A169
- Michałowski et al. (2019) Michałowski M.J., et al., 2019, A&A, 627, A106
- Michałowski et al. (2020a) Michałowski M.J., Gotkiewicz N., Hjorth J., Kamphuis P., 2020a, A&A, 638, A47
- Michałowski et al. (2020b) Michałowski M.J., et al., 2020b, A&A, 642, A84
- Modjaz et al. (2011) Modjaz M., Kewley L., Bloom J.S., Filippenko A.V., Perley D., Silverman J.M., 2011, ApJ, 731, L4
- Morokuma-Matsui et al. (2019) Morokuma-Matsui K., et al., 2019, ApJ, 879, L13
- Novak et al. (2019) Novak M., et al., 2019, ApJ, 881, 63
- Novak et al. (2020) Novak M., et al., 2020, ApJ, 904, 131
- Offringa (2010) Offringa A.R., 2010, AOFlagger: RFI Software
- Offringa et al. (2014) Offringa A.R., et al., 2014, MNRAS, 444, 606
- Perley et al. (2013) Perley D.A., et al., 2013, ApJ, 778, 128
- Perley et al. (2015) Perley D.A., et al., 2015, ApJ, 801, 102
- Perley et al. (2016) Perley D.A., et al., 2016, ApJ, 817, 8
- Pettini & Pagel (2004) Pettini M., Pagel B.E.J., 2004, MNRAS, 348, L59
- Prochaska et al. (2009) Prochaska J.X., et al., 2009, ApJ, 691, L27
- Rasmussen & Ponman (2007) Rasmussen J., Ponman T.J., 2007, MNRAS, 380, 1554
- Reshetnikov & Combes (1999) Reshetnikov V., Combes F., 1999, A&AS, 138, 101
- Reshetnikov et al. (2016) Reshetnikov V.P., Mosenkov A.V., Moiseev A.V., Kotov S.S., Savchenko S.S., 2016, MNRAS, 461, 4233
- Reynolds et al. (2020) Reynolds T.N., Westmeier T., Staveley-Smith L., Chauhan G., Lagos C.D.P., 2020, MNRAS, accepted [arXiv:2002.11857]
- Rogstad et al. (1974) Rogstad D.H., Lockhart I.A., Wright M.C.H., 1974, ApJ, 193, 309
- Roychowdhury et al. (2019) Roychowdhury S., Arabsalmani M., Kanekar N., 2019, MNRAS, 485, L93
- Rubin et al. (1980) Rubin V.C., Ford J. W. K., Thonnard N., 1980, ApJ, 238, 471
- Sánchez Almeida et al. (2013) Sánchez Almeida J., Muñoz-Tuñón C., Elmegreen D.M., Elmegreen B.G., Méndez-Abreu J., 2013, ApJ, 767, 74
- Sánchez Almeida et al. (2014a) Sánchez Almeida J., Elmegreen B.G., Muñoz-Tuñón C., Elmegreen D.M., 2014a, A&A Rev., 22, 71
- Sánchez Almeida et al. (2014b) Sánchez Almeida J., Morales-Luis A.B., Muñoz-Tuñón C., Elmegreen D.M., Elmegreen B.G., Méndez-Abreu J., 2014b, ApJ, 783, 45
- Sánchez Almeida et al. (2015) Sánchez Almeida J., et al., 2015, ApJ, 810, L15
- Sancisi et al. (2008) Sancisi R., Fraternali F., Oosterloo T., van der Hulst T., 2008, A&A Rev., 15, 189
- Savaglio et al. (2009) Savaglio S., Glazebrook K., LeBorgne D., 2009, ApJ, 691, 182
- Savaglio et al. (2012) Savaglio S., et al., 2012, MNRAS, 420, 627
- Schady et al. (2015) Schady P., et al., 2015, A&A, 579, A126
- Schulze et al. (2014) Schulze S., et al., 2014, A&A, 566, A102
- Semczuk et al. (2020) Semczuk M., Lokas E.L., D’Onghia E., Athanassoula E., Debattista V.P., Hernquist L., 2020, MNRAS, submitted [arXiv:2002.07022]
- Serra et al. (2015) Serra P., et al., 2015, MNRAS, 448, 1922
- Springob et al. (2005) Springob C.M., Haynes M.P., Giovanelli R., Kent B.R., 2005, ApJS, 160, 149
- Stanek et al. (2003) Stanek K.Z., et al., 2003, ApJ, 591, L17
- Stanway et al. (2015) Stanway E.R., Levan A.J., Tanvir N., Wiersema K., van der Horst A., Mundell C.G., Guidorzi C., 2015, MNRAS, 446, 3911
- Stasińska & Leitherer (1996) Stasińska G., Leitherer C., 1996, ApJS, 107, 661
- Tanga et al. (2018) Tanga M., Krühler T., Schady P., Klose S., Graham J.F., Greiner J., Kann D.A., Nardini M., 2018, A&A, 615, A136
- Theureau et al. (1998) Theureau G., Bottinelli L., Coudreau-Durand N., Gouguenheim L., Hallet N., Loulergue M., Paturel G., Teerikorpi P., 1998, A&AS, 130, 333
- Thöne et al. (2008) Thöne C.C., et al., 2008, ApJ, 676, 1151
- Thöne et al. (2014) Thöne C.C., Christensen L., Prochaska J.X., Bloom J.S., Gorosabel J., Fynbo J.P.U., Jakobsson P., Fruchter A.S., 2014, MNRAS, 441, 2034
- Thöne et al. (2019) Thöne C.C., et al., 2019, A&A, submitted
- Wang et al. (2013) Wang J., et al., 2013, MNRAS, 433, 270
- Wang et al. (2016) Wang J., Koribalski B.S., Serra P., van der Hulst T., Roychowdhury S., Kamphuis P., Chengalur J.N., 2016, MNRAS, 460, 2143
- Wang et al. (2017) Wang Y.Z., et al., 2017, ApJ, 851, L20
- Watts et al. (2020) Watts A.B., Catinella B., Cortese L., Power C., 2020, MNRAS, 492, 3672
- Yue et al. (2018) Yue C., Hu Q., Zhang F.W., Liang Y.F., Jin Z.P., Zou Y.C., Fan Y.Z., Wei D.M., 2018, ApJ, 853, L10
Appendix A Color-scale maps
Below we present color-scale images of the moment 0 and continuum maps.
Appendix B Positions of regions
Below we show the positions of regions analysed in CO in Michałowski et al. (2018b).