Photochemical Anisotropy and Direction-dependent Optical Absorption in Semiconductors
Abstract
Photochemical reactions on semiconductors are anisotropic, since they occur with different rates on surfaces of different orientation. Understanding the origin of this anisotropy is crucial to engineering more efficient photocatalysts. In this work, we use hybrid density functional theory (DFT) to identify the surfaces associated with the largest number of photo-generated carriers in different semiconductors. For each material we create a spherical heat map of the probability of optical transitions at different wave vectors. These maps allow to identify the directions associated with the majority of the photo-generated carriers and can thus be used to make predictions about the most reactive surfaces for photochemical applications. Results indicate that it is generally possible to correlate the heat maps with the anisotropy of the bands observed in conventional band-structure plots, as previously suggested. However, we also demonstrate that conventional bands-structure plots do not always provide all the informations and that taking into account the contribution of all possible transitions weighted by their transition dipole moments is crucial to obtain a complete picture.
I Introduction
Since Fujishima and Honda for the first time reported \ceH2 production from water using \ceTiO2-based photoelectrodes in 1972 Fujishima and Honda (1972), semiconductor-based heterogeneous photocatalysis has received great attention due to the increasing energy demand and diminishing fossil resources. Indeed, heterogeneous photocatalytic processes, such as photocatalytic water splitting (water oxidation and hydrogen reduction), artificial photosynthesis (\ceCO2 reduction), or the degradation of pollutants, constitute one of the most promising solutions for environmental and energy sustainability via direct harvesting of solar energy Xie et al. (2016); Li, Yu, and Jaroniec (2016); Tee et al. (2017); San Martín, Rivero, and Ortiz (2020).
It is well accepted that photocatalytic reactions involve three sequential processes. First, electron/hole pairs are photo-generated when the semiconductor is illuminated by light with an energy equal or greater than the material’s bandgap, which leads to excitation of electrons from the valence (VB) to the conduction band (CB). While recombination of electron/hole pairs can occur in the bulk, a fraction of the generated electrons and holes migrate, in a second step, towards the surfaces of the catalyst, where they can, in a final step, initiate reduction and oxidation reactions respectively. However, these reactions can be driven by the photo-generated electrons and holes only if the reduction and oxidation potentials of the targeted reaction lie within the CB and VB of the material, respectively. According to the relative position of the VB and CB and the redox potential of specific reactions, it is possible to identify different types of catalysts: i) strongly oxidative semiconductors with sufficiently positive VB potentials to produce OH radicals such as \ceSnO2, \ceBiVO4, \ceTiO2, \ceWO3 (see left side of Fig. 1), that are promising candidates for the photo-degradation of organic pollutants; ii) strongly reductive catalysts with CB position more negative than the hydrogen evolution and \ceCO2 reduction potentials, such as \ceCu2O, \ceBi2Se3, \ceSiC, and \ceSi (see right side of Fig. 1), which are promising semiconductors for solar-fuel production under visible light; and iii) materials with VB/CB potential more positive/negative than the \ceH2/\ceO2 evolution potentials that are suitable to catalyze the overall water splitting reaction (see pink shaded area in Fig. 1) Li, Yu, and Jaroniec (2016).

Hundreds of materials are currently available for different photocatalytic applications, however, so far, no semiconductor is able to meet all the requirements in terms of efficiency, stability, safety, cost and ability to absorb solar energy. Efforts to design new materials or to improve the performance of already existing ones can benefit from a deeper understanding of the fundamental properties and mechanisms leading to the observed behavior. For example, it is well known that photochemical reactions on semiconductors are anisotropic, since they occur with different rates on surfaces of different orientation that, hence, have different photocatalytic activities towards reduction and oxidation reactions Lowekamp et al. (1998); Giocondi and Rohrer (2001); Ohno, Sarukawa, and Matsumura (2002); Taguchi et al. (2003); Giocondi, Salvador, and Rohrer (2007). Despite this phenomenon being fundamental for the design of photocatalysts, the underlying mechanism is not well understood Giocondi, Salvador, and Rohrer (2007). Giocondi et al. Giocondi, Salvador, and Rohrer (2007) suggested, as a general principle, that the observed anisotropic photochemical reactivity can be explained by the spectral distribution of the incident light and the anisotropic dispersion of the photocatalyst’s electronic band structure: the lowest energy photons that are able to initiate optical transitions will lead to charge carriers with wave vectors aligned with the transition’s position in reciprocal space. The photo-generated carriers will therefore preferentially migrate to surfaces perpendicular to that wave vector, leading to an increased reactivity of these surfaces. Using this concept, they explained the observed larger activity of the (100) surface of \ceSrTiO3 micro crystals compared to the (110) and (111) surfaces towards both oxidation and reduction reactions. Photons with energies larger than the band-gap (3.25 eV) and up to 4.1 eV (maximum within the experimental set-up) can excite transitions near the -point, some along the [110] and [111] directions, but the large majority along the [100] direction where the bands are weakly dispersive (flat). The electronic band structure of the material thus favors the creation of photo-generated carriers with wave vector perpendicular to the (100) surface. The authors suggest that this is a fundamental principle applicable not only to \ceSrTiO3, but to all photocatalysts. We note here that, as explained in Ref. Giocondi, Salvador, and Rohrer, 2007, there can be several reason for the surface perpendicular to which most carriers are created to not appear as most reactive in experiments: phonon scattering resulting in a change of the carrier momentum and recombination of the carriers in the bulk or at surface or defect states that act as traps are only some of the possible explanations. Nevertheless, the principle reflects a fundamental property of photocatalysts and can be invoked to predict the photochemical anisotropy of semiconductor materials.
DFT is a valuable tool for material design and discovery. In particular, hybrid DFT can provide accurate structural and electronic properties of semiconductors Corà et al. (2004); Brothers et al. (2008); Henderson, Paier, and Scuseria (2011). It can also be used to predict optical properties of materials Gajdoš et al. (2006a); Wang et al. (2019); Nishiwaki and Fujiwara (2020). Quantities like the absorption coefficient can be derived from the frequency-dependent dielectric function, computed within the independent particle approximation. This consists of an imaginary part determined as a summation over CB states, and a real part, obtained from the Kramers-Kronig transformation Gajdoš et al. (2006a). According to Fermi’s Golden Rule, the optical absorption of a semiconductor at a photon energy is proportional to Dresselhaus et al. (2001)
| (1) |
where the Brillouin-zone integral sums the joint density of states at energy over different vectors and is the transition dipole moment (TDM) matrix, i.e. the electric dipole moment associated with a transition from a valence state to a conduction state . The direction of TDM gives the polarization of the transition and determines how the system will interact with an electromagnetic wave of a given polarization, while the square of its norm represents the probability for a transition between the two states to occur.
In this work, we use hybrid DFT to investigate the anisotropy of the optical absorption of different photocatalysts by creating spherical heat maps of optical-transition probabilities along different directions in space, when the material interacts with photons within a specific energy range. These direction-dependent maps of the optical absorption identify wave vector associated with the majority of photo-generated carriers upon irradiation with light of a specific energy. Hence, they can be used to make predictions about the most reactive surfaces for photochemical applications, as suggested in Ref. Giocondi, Salvador, and Rohrer, 2007. However, differently from Ref. Giocondi, Salvador, and Rohrer, 2007, our predictions do not only reflect the dispersion of the material’s electronic band structure as shown in conventional two-dimensional (2D) band structure plots, but they take into account the full three-dimensional (3D) band structure as well as the probability for each transition to occur (transition allowed or forbidden by the selection rules) via the calculation of the TDM. Indeed, while in the majority of cases, results can be explained by a straightforward comparison of the heat map with the 2D electronic band structure, in line with the hypothesis suggested of Giocondi et al., more generally, taking into account all possible transitions weighted by the corresponding transition dipole moments is crucial to obtain a complete picture.
II Methods
DFT calculations were carried out with the Vienna Ab-initio Simulation Package (VASP) Kresse and Hafner (1993, 1994); Kresse and Furthmüller (1996a, b) using the Heyd-Scuseria-Ernzerhof (HSE) Heyd, Scuseria, and Ernzerhof (2003); Heyd and Scuseria (2004) hybrid exchange-correlation functional. Projector augmented-wave potentials Blöchl (1994); Kresse and Joubert (1999) were used with a plane-wave cut-off of 500 eV. Space group, magnetic properties, and dimension of the -centered -mesh used to sample the Brillouin zone, as well as the type of pseudopotential and the percentage of exact exchange used to model the primitive cell of the various materials are reported in Table S1 of the supporting information (SI). All internal and lattice parameters were relaxed with a force threshold of 10-3 eV/Å. This setup provides an excellent agreement with experiment (see SI Section S1). Optical properties of the materials were obtained via the calculation of the frequency-dependent dielectric function within the independent particle approximation Gajdoš et al. (2006b) and analyzed using the pymatgen Wavederf module Ong et al. (2013).
The direction-dependent probability of a material to absorb photons in a given wavelength range ( to ) was mapped on spherical heat maps, obtained by projecting the k-mesh used to sample reciprocal space on the surface of a unit sphere centered at the origin of the reciprocal lattice. Each k-point is associated with an absorption coefficient () computed by summing over the square of the TDM for transitions between bands and at that k-point , if the wavelength () of the transition is within the considered energy range ( to ):
| (2) |
The final spherical heat map of direction-dependent absorption is created by interpolating the obtained discrete data onto a regular grid in spherical coordinates. We considered transitions in the energy range going from the bandgap () of each material up to a minimum energy () necessary to observe vertical transitions (cf. Table S1).
III Results and Discussion
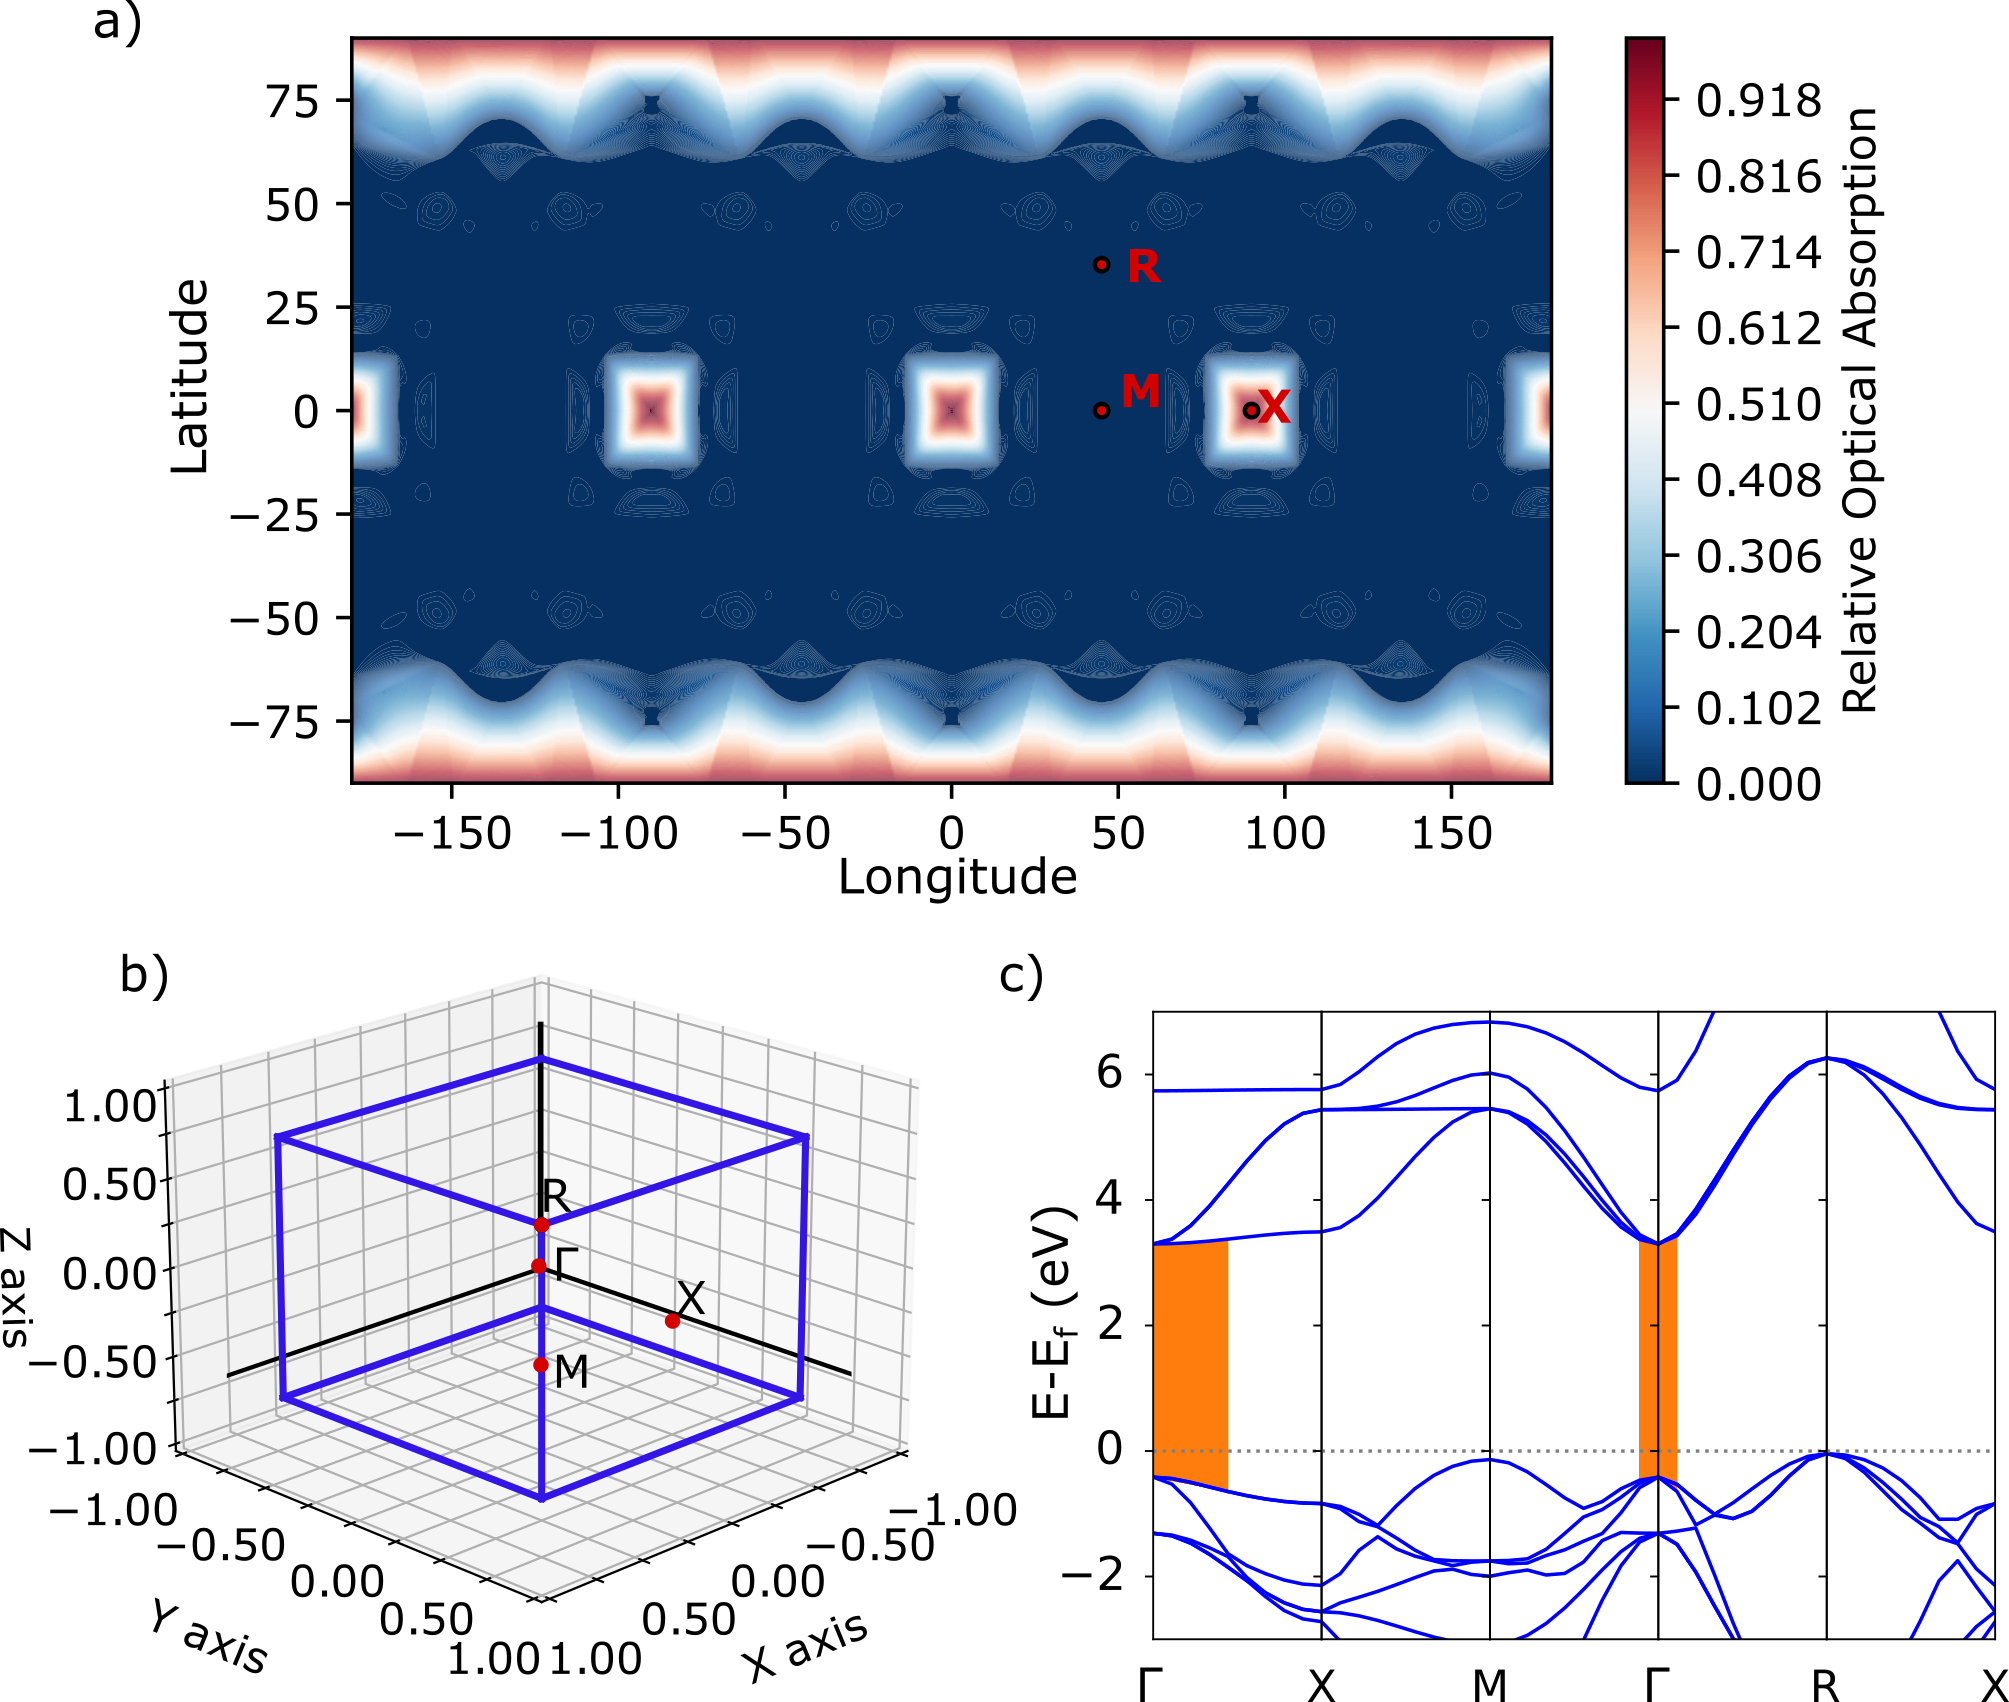
Giocondi et al. Giocondi, Salvador, and Rohrer (2007) investigated the anisotropic reactivity of \ceSrTiO3 using photochemical reactions that deposit insoluble products on the surface of \ceSrTiO3 micro crystals. Their results indicated that surfaces are most reactive. This observation was explained considering that the majority of electron-hole pairs used for photochemical reactions are created by photons with energies greater than the band gap but lower than 4.1 eV and that, according to the band structure of \ceSrTiO3, photons with these energies can excite a larger number of transitions along than other directions, due to the weakly dispersive bands along this direction.
The heat map of Fig. 2a) shows the direction-dependent probability of \ceSrTiO3 to absorb photons with energies up to 4.1 eV, computed according to the procedure described in Sec. II. In agreement with the experimental observations, we predict the surfaces to be most active for photochemical processes, since the largest absorption is observed projected on this direction. As suggested in Ref. Giocondi, Salvador, and Rohrer, 2007, this result can be rationalized using arguments based on the computed band structure: photons with energies between the \ceSrTiO3 bandgap and 4.1 eV can excite transitions near the -point, with excited states in the ( to X, cf. Fig. 2b) and Fig. S2 in the SI), ( to M), or ( to R) directions as shown by the shaded regions in Fig. 2c). However, the flat character of the bands in the to X direction results in a much larger number of photo-generated carriers with wave-vector perpendicular to the (100) surface, explaining the larger absorption intensity along this direction.
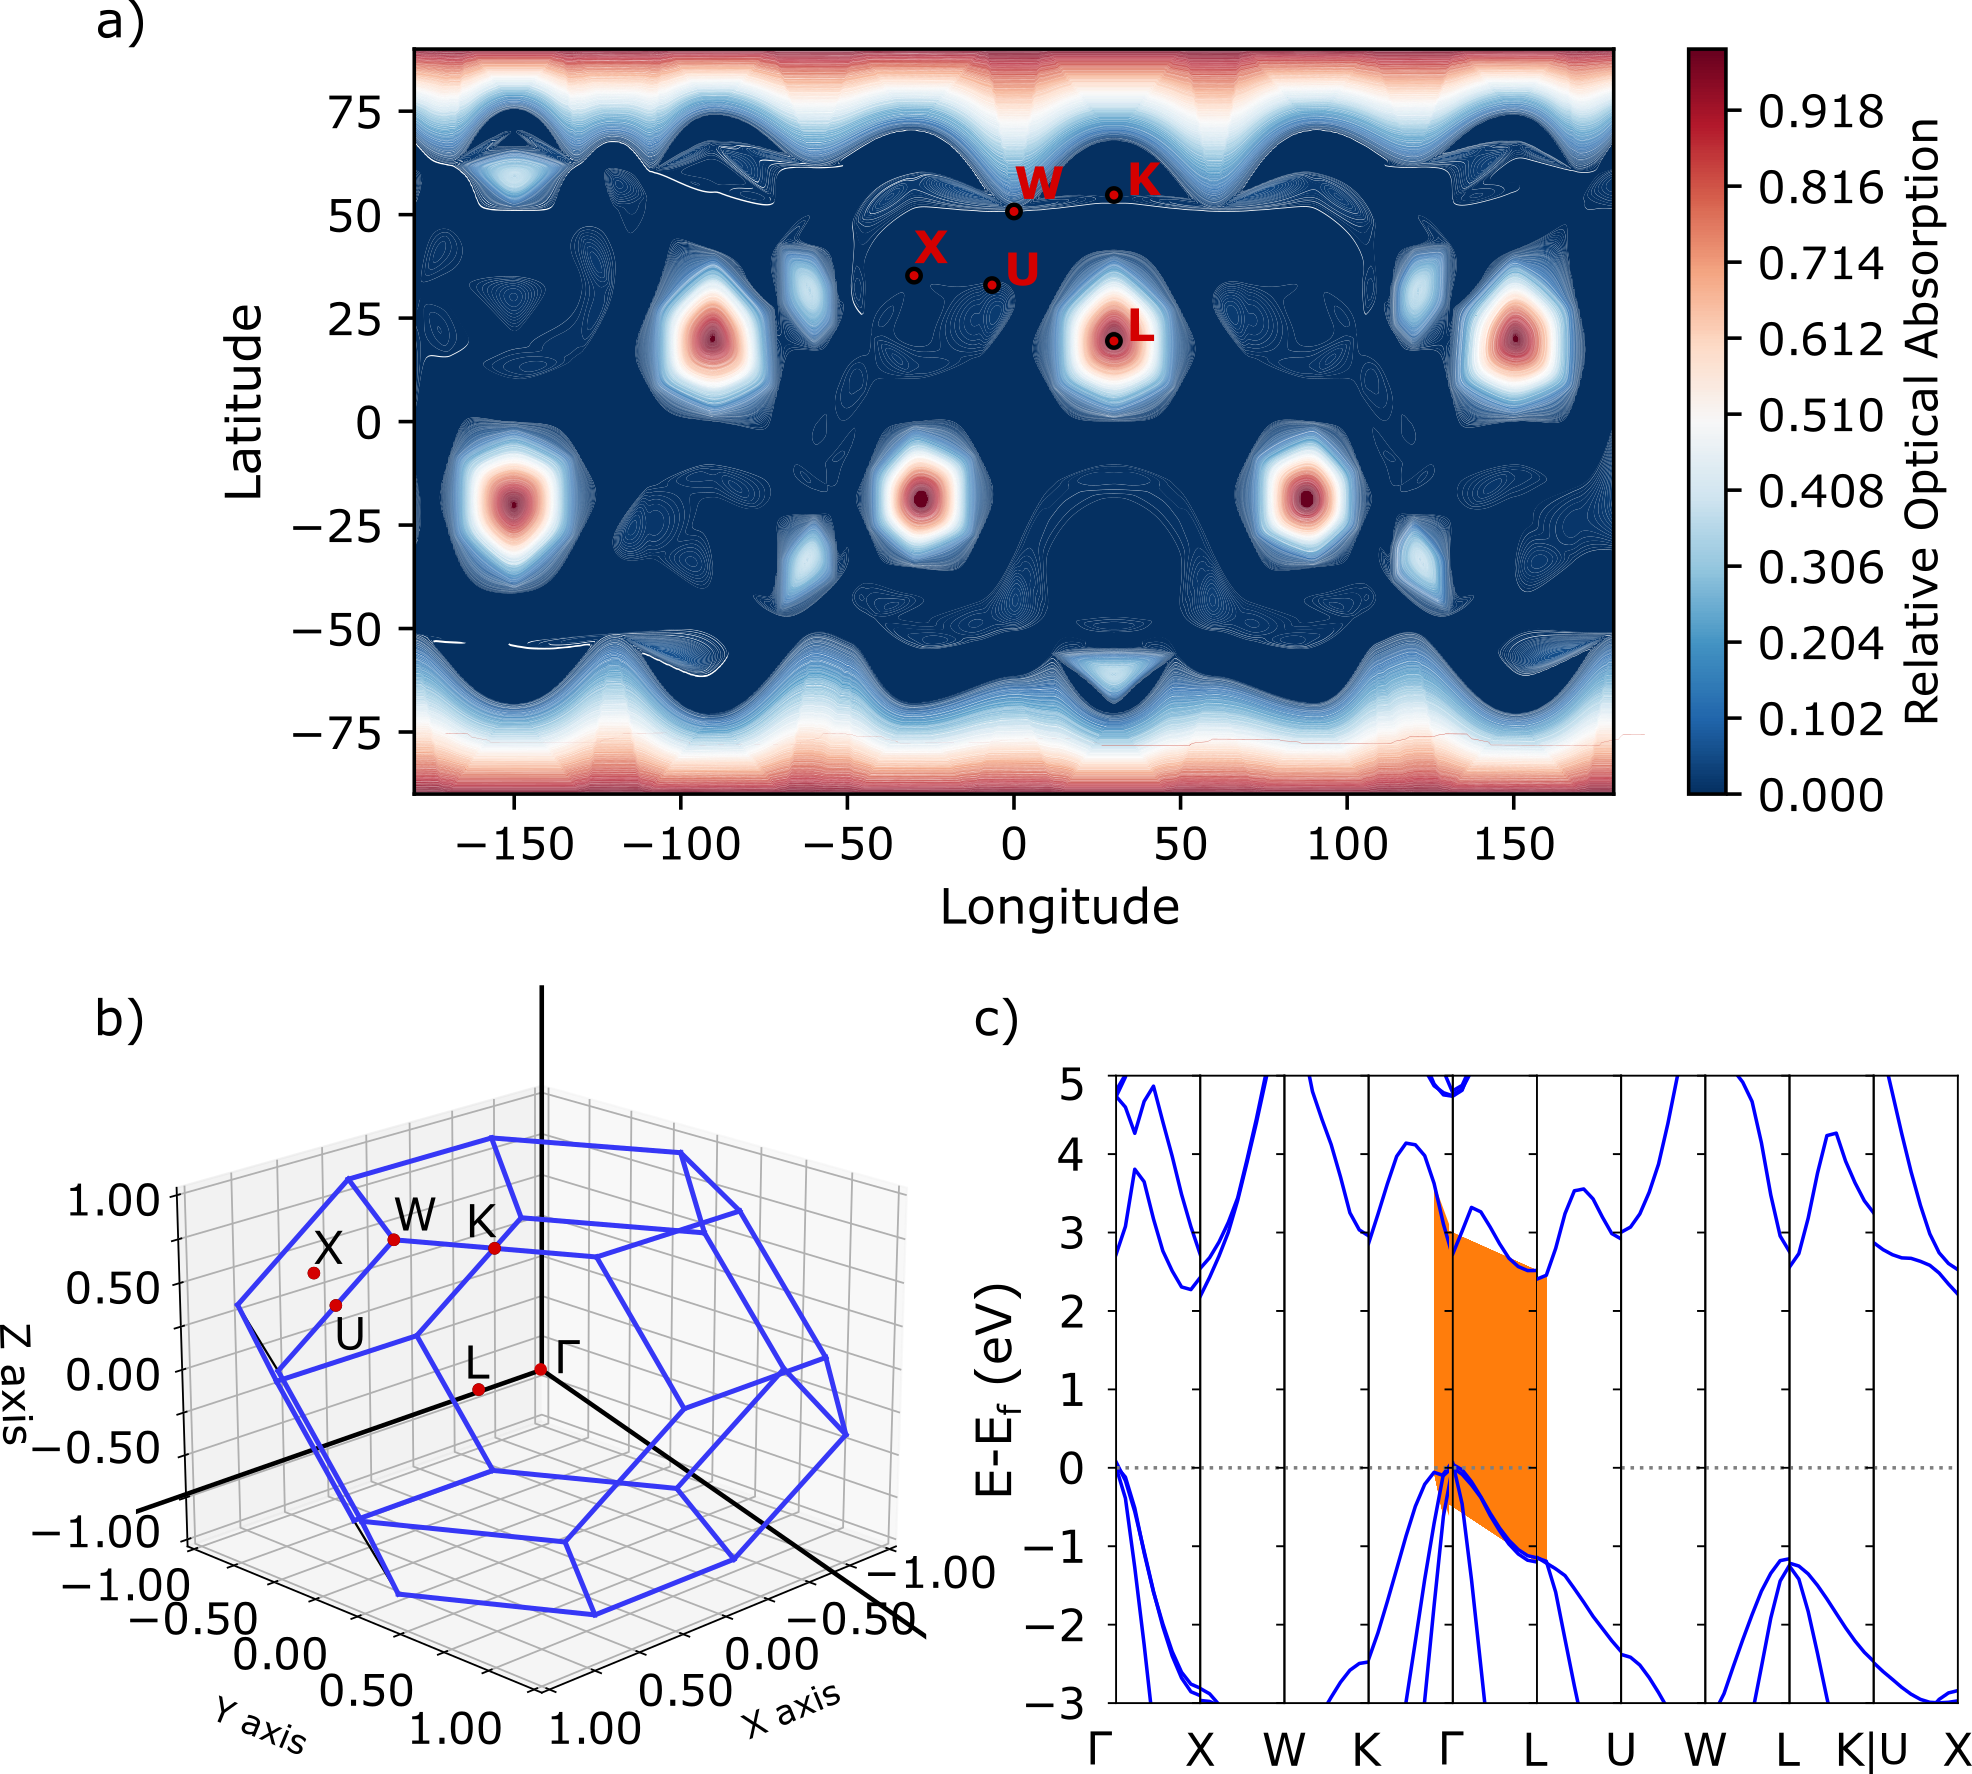
When the same procedure is applied to other photocatalyst materials, the argument based on the conventional 2D band-structure plots is verified in the majority of cases. For example, our heat map for GaP in Fig. 3a confirms the suggestion by Giocondi et al. Giocondi, Salvador, and Rohrer (2007) that for materials with zinc-blende structure the most reactive orientation should be (111). Indeed, photons with energies between the GaP bandgap and 4.0 eV can excite transitions near the -point with excited states in the direction ( to L, cf. Fig. 3c) and Fig. S2 in the SI).
However, there are materials for which the conventional 2D band structure does not seem to provide all the necessary information to correctly predict the most reactive surface orientation. For example, the band structure computed for the rutile polymorph of \ceTiO2 in Fig. 4c) suggests that the largest number of excited transitions induced by photons of energy larger than the bandgap (E) up to E+0.8 eV takes place from to X ( direction) and from to M ( direction) and with a smaller contribution also from to Z ( direction). Do due the less dispersive character of the 2D bands along the first two directions, one would expect the (110) and (100) surfaces to be more reactive than the (001) surface. The heat map of the direction-dependent optical absorption of Fig. 4a) suggests, instead, that photo-generated carriers with wave-vectors perpendicular to this latter surface should be most abundant, followed by carriers with wave-vectors perpendicular to . In order to explain this apparent contradiction, we computed the TDM for a vertical transition from the top of the valence band to the bottom of the conduction band at the k-points Z (12.3 Debye2), M (2.0 Debye2), and X (0.2 Debye2) using the VASPKIT package Wang et al. (2021). Based on these TDM values, we conclude that, even though the flattest path in the band structure is from to M or to X, the larger probability for transitions at the Z point leads to photo-generated carriers with wave-vectors perpendicular to to be most abundant.
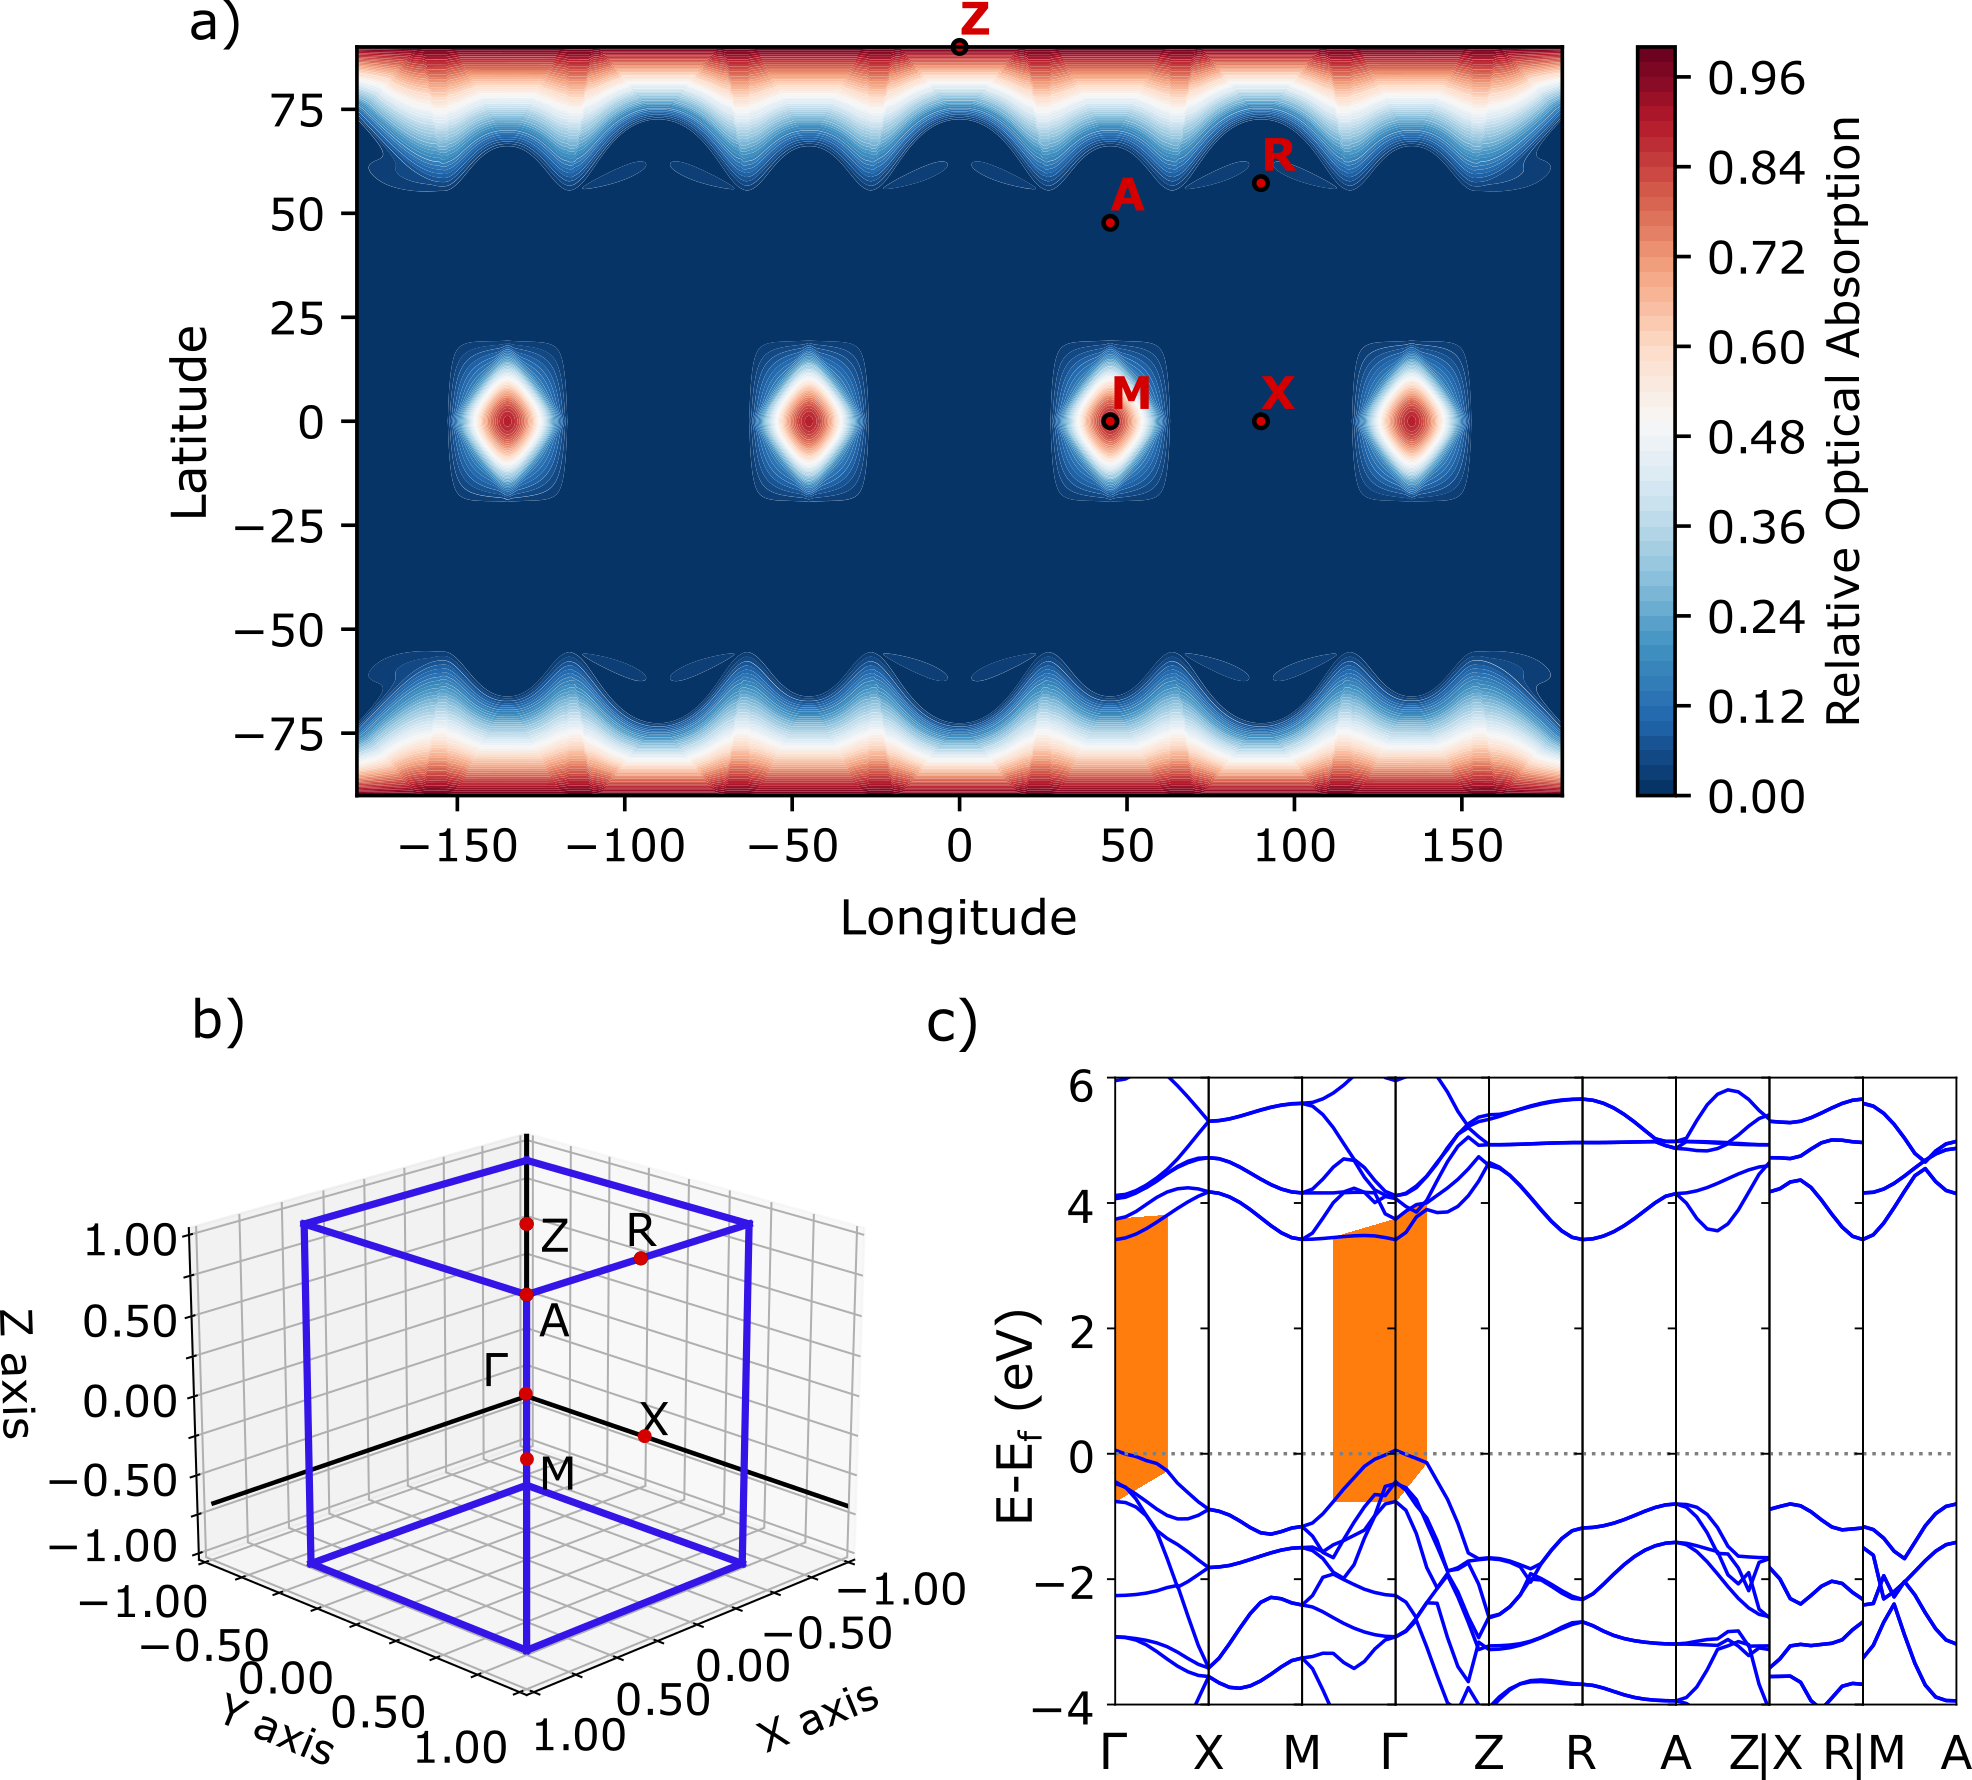
These result shed light on the experimental results for rutile that are often contradictory and obtained under different experimental conditions, for different photochemical reactions, and on different types of samples. For example, Ohno et al. Ohno, Sarukawa, and Matsumura (2002) reported that Pt deposits preferentially on rutile facets, consistent with the band-structure prediction. Instead, Guennemann et al. Günnemann et al. (2019) showed (001) to be one of the rutile surfaces with the largest photonic efficiency and to be the most reactive surface for methanol oxidation. This is in agreement with our prediction and also with the results of Ahmad et al. Ahmed et al. (2011) reporting the (001) surface to show a higher photocatalytic activity than both the (110) and (100) surfaces for both methanol oxidation and terephthalic acid hydroxylation. Also Lowekamp et al. Lowekamp et al. (1998) reported that facets show a higher reactivity for \ceAg+ reduction compared to the and the facets, even though the facets are the most active. Larger photocatalytic activity of surfaces was reported also by Giocondi et al. Giocondi and Rohrer (2001), Ohno et al. Ohno, Sarukawa, and Matsumura (2002), Luttrell et al. Luttrell et al. (2014) for decomposition of methyl orange, or by Guennemann et al. Günnemann et al. (2019) for terephthalic acid hydroxylation. On the other hand, Quah et al. Quah, Wilson, and Idriss (2010) reported that there is no special photocatalytic activity of this latter facet compared to other rutile surfaces, in line with our heat map that does not suggest the creation of carriers with momentum along this direction.
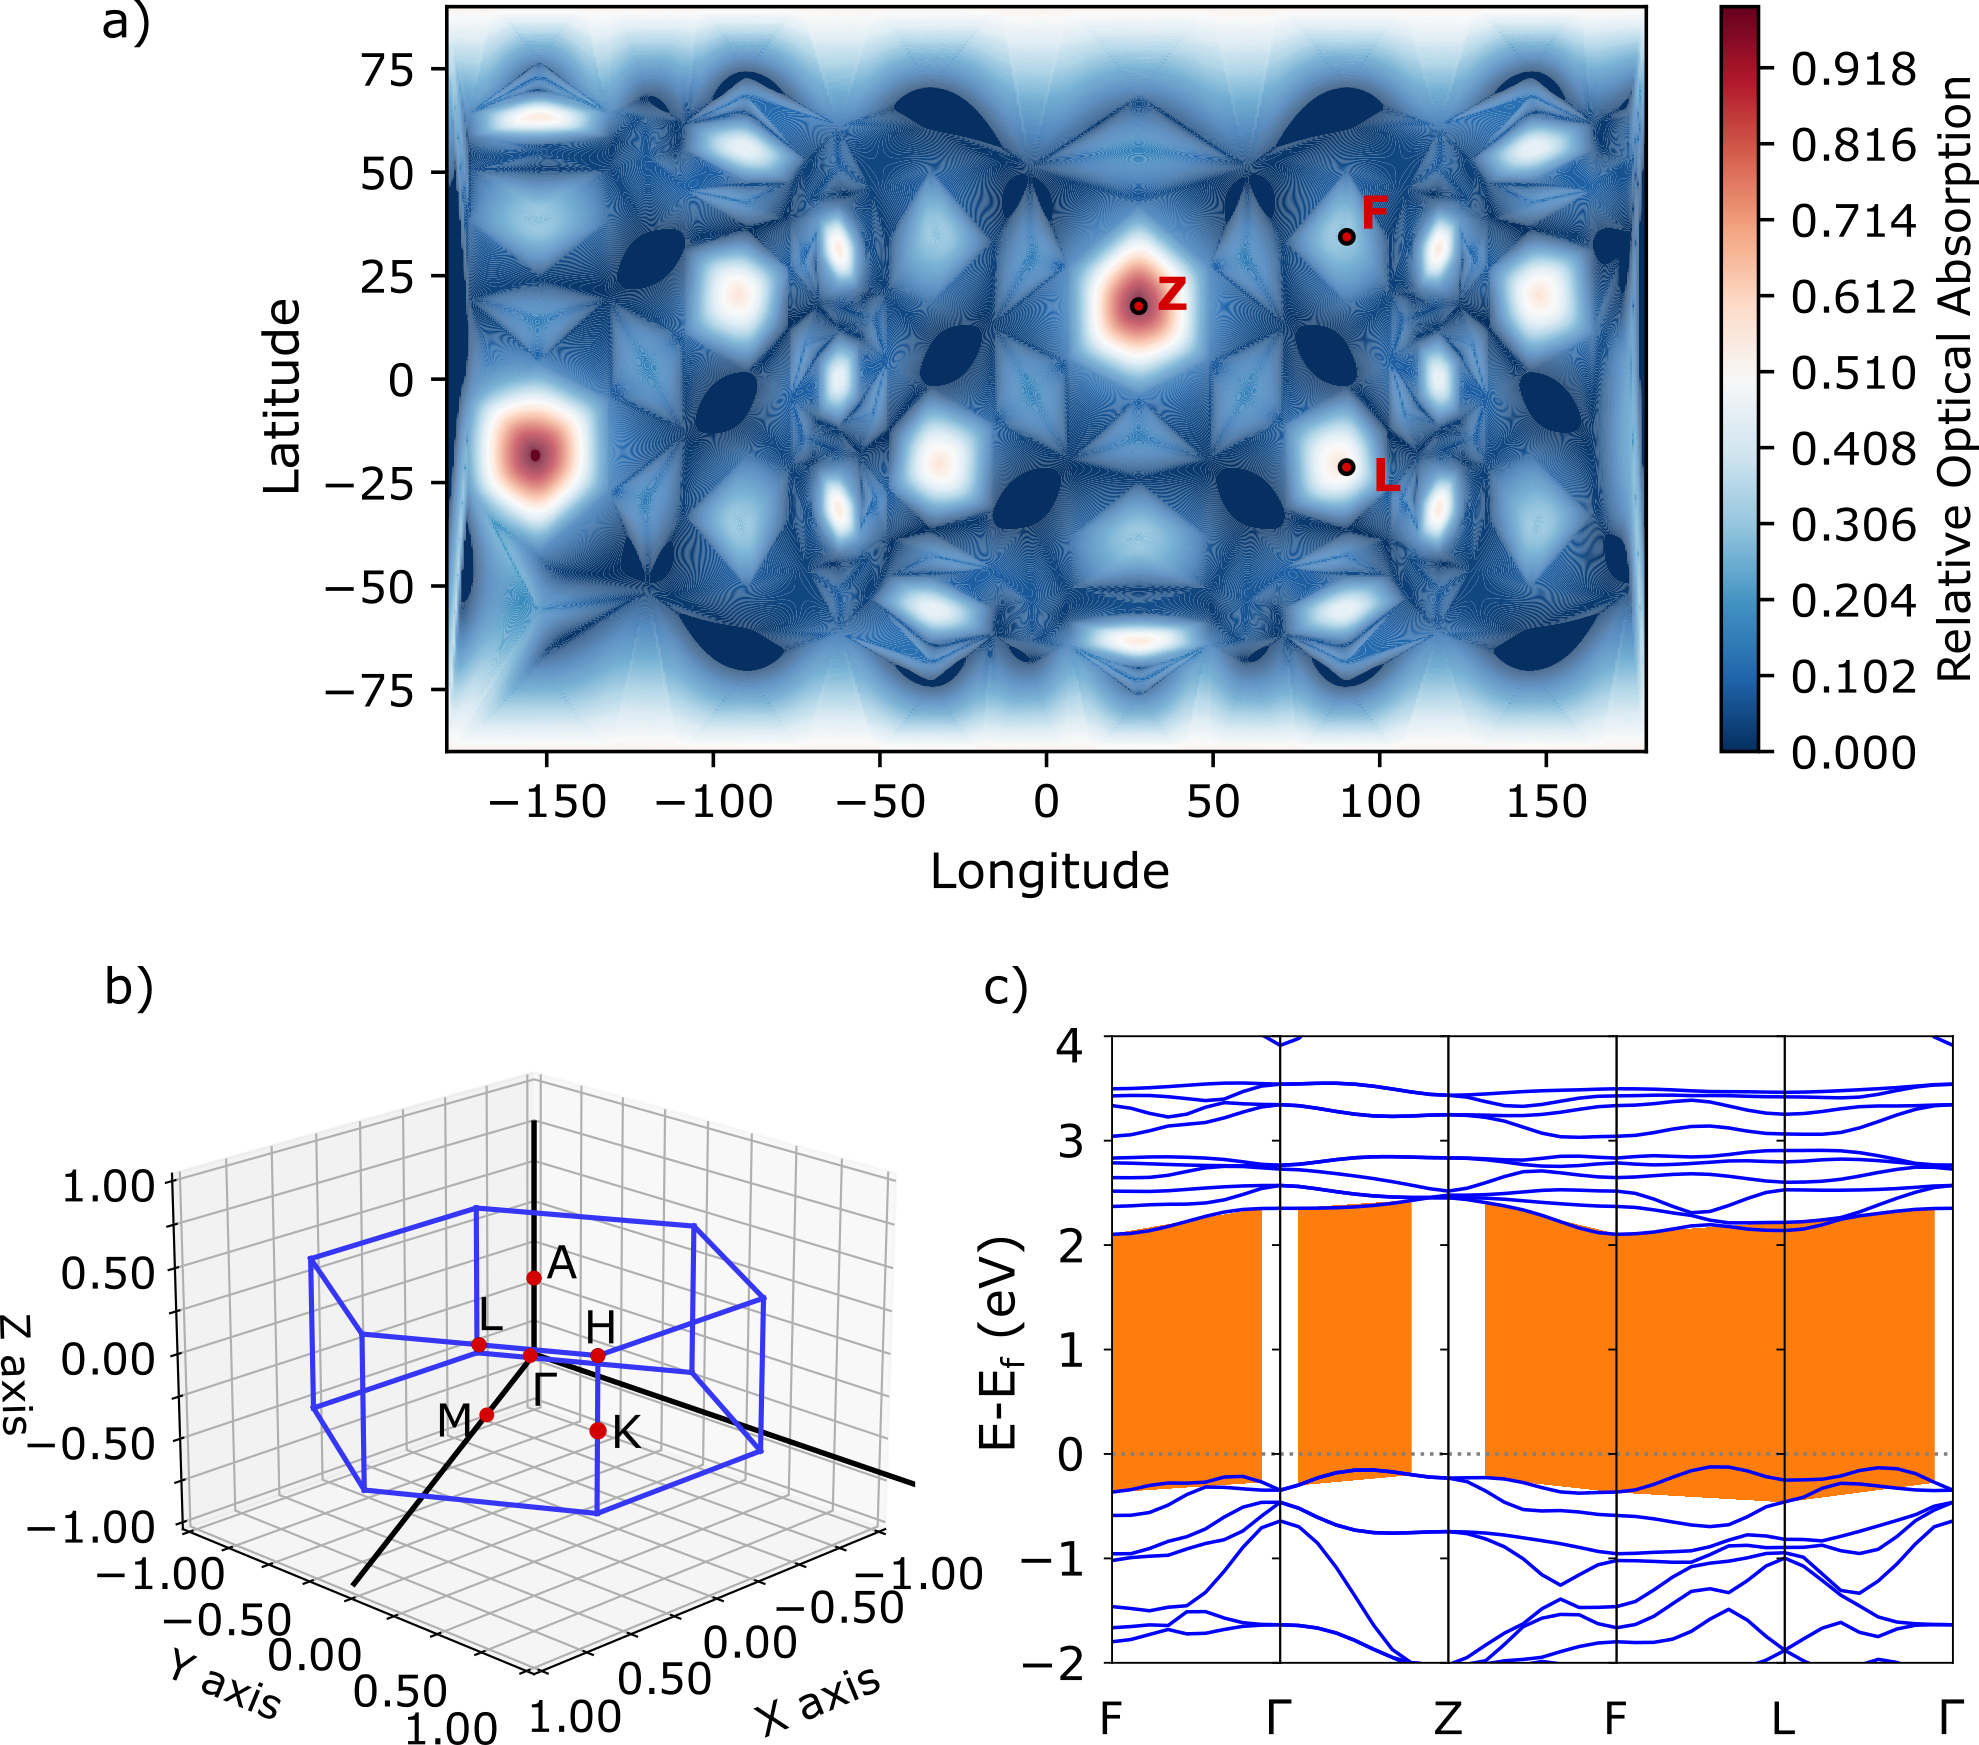
A similar situation is observed also for \ceFe2O3. While the band structure in Fig. 5c) shows fairly non-dispersive bands and hence possible transitions with momenta along different directions in space, the heat map of the direction-dependent optical absorption in Fig. 5a) indicates that the (111) facet (transitions from from to Z) should be much more active than other surfaces. This prediction can also be rationalized by the larger TDM for a transition from the top of the VB to the bottom of the CB at the Z point (68.3 Debye2), compared to the other high symmetry k-points, such as L (43.3 Debye2) or F (10.3 Debye2).
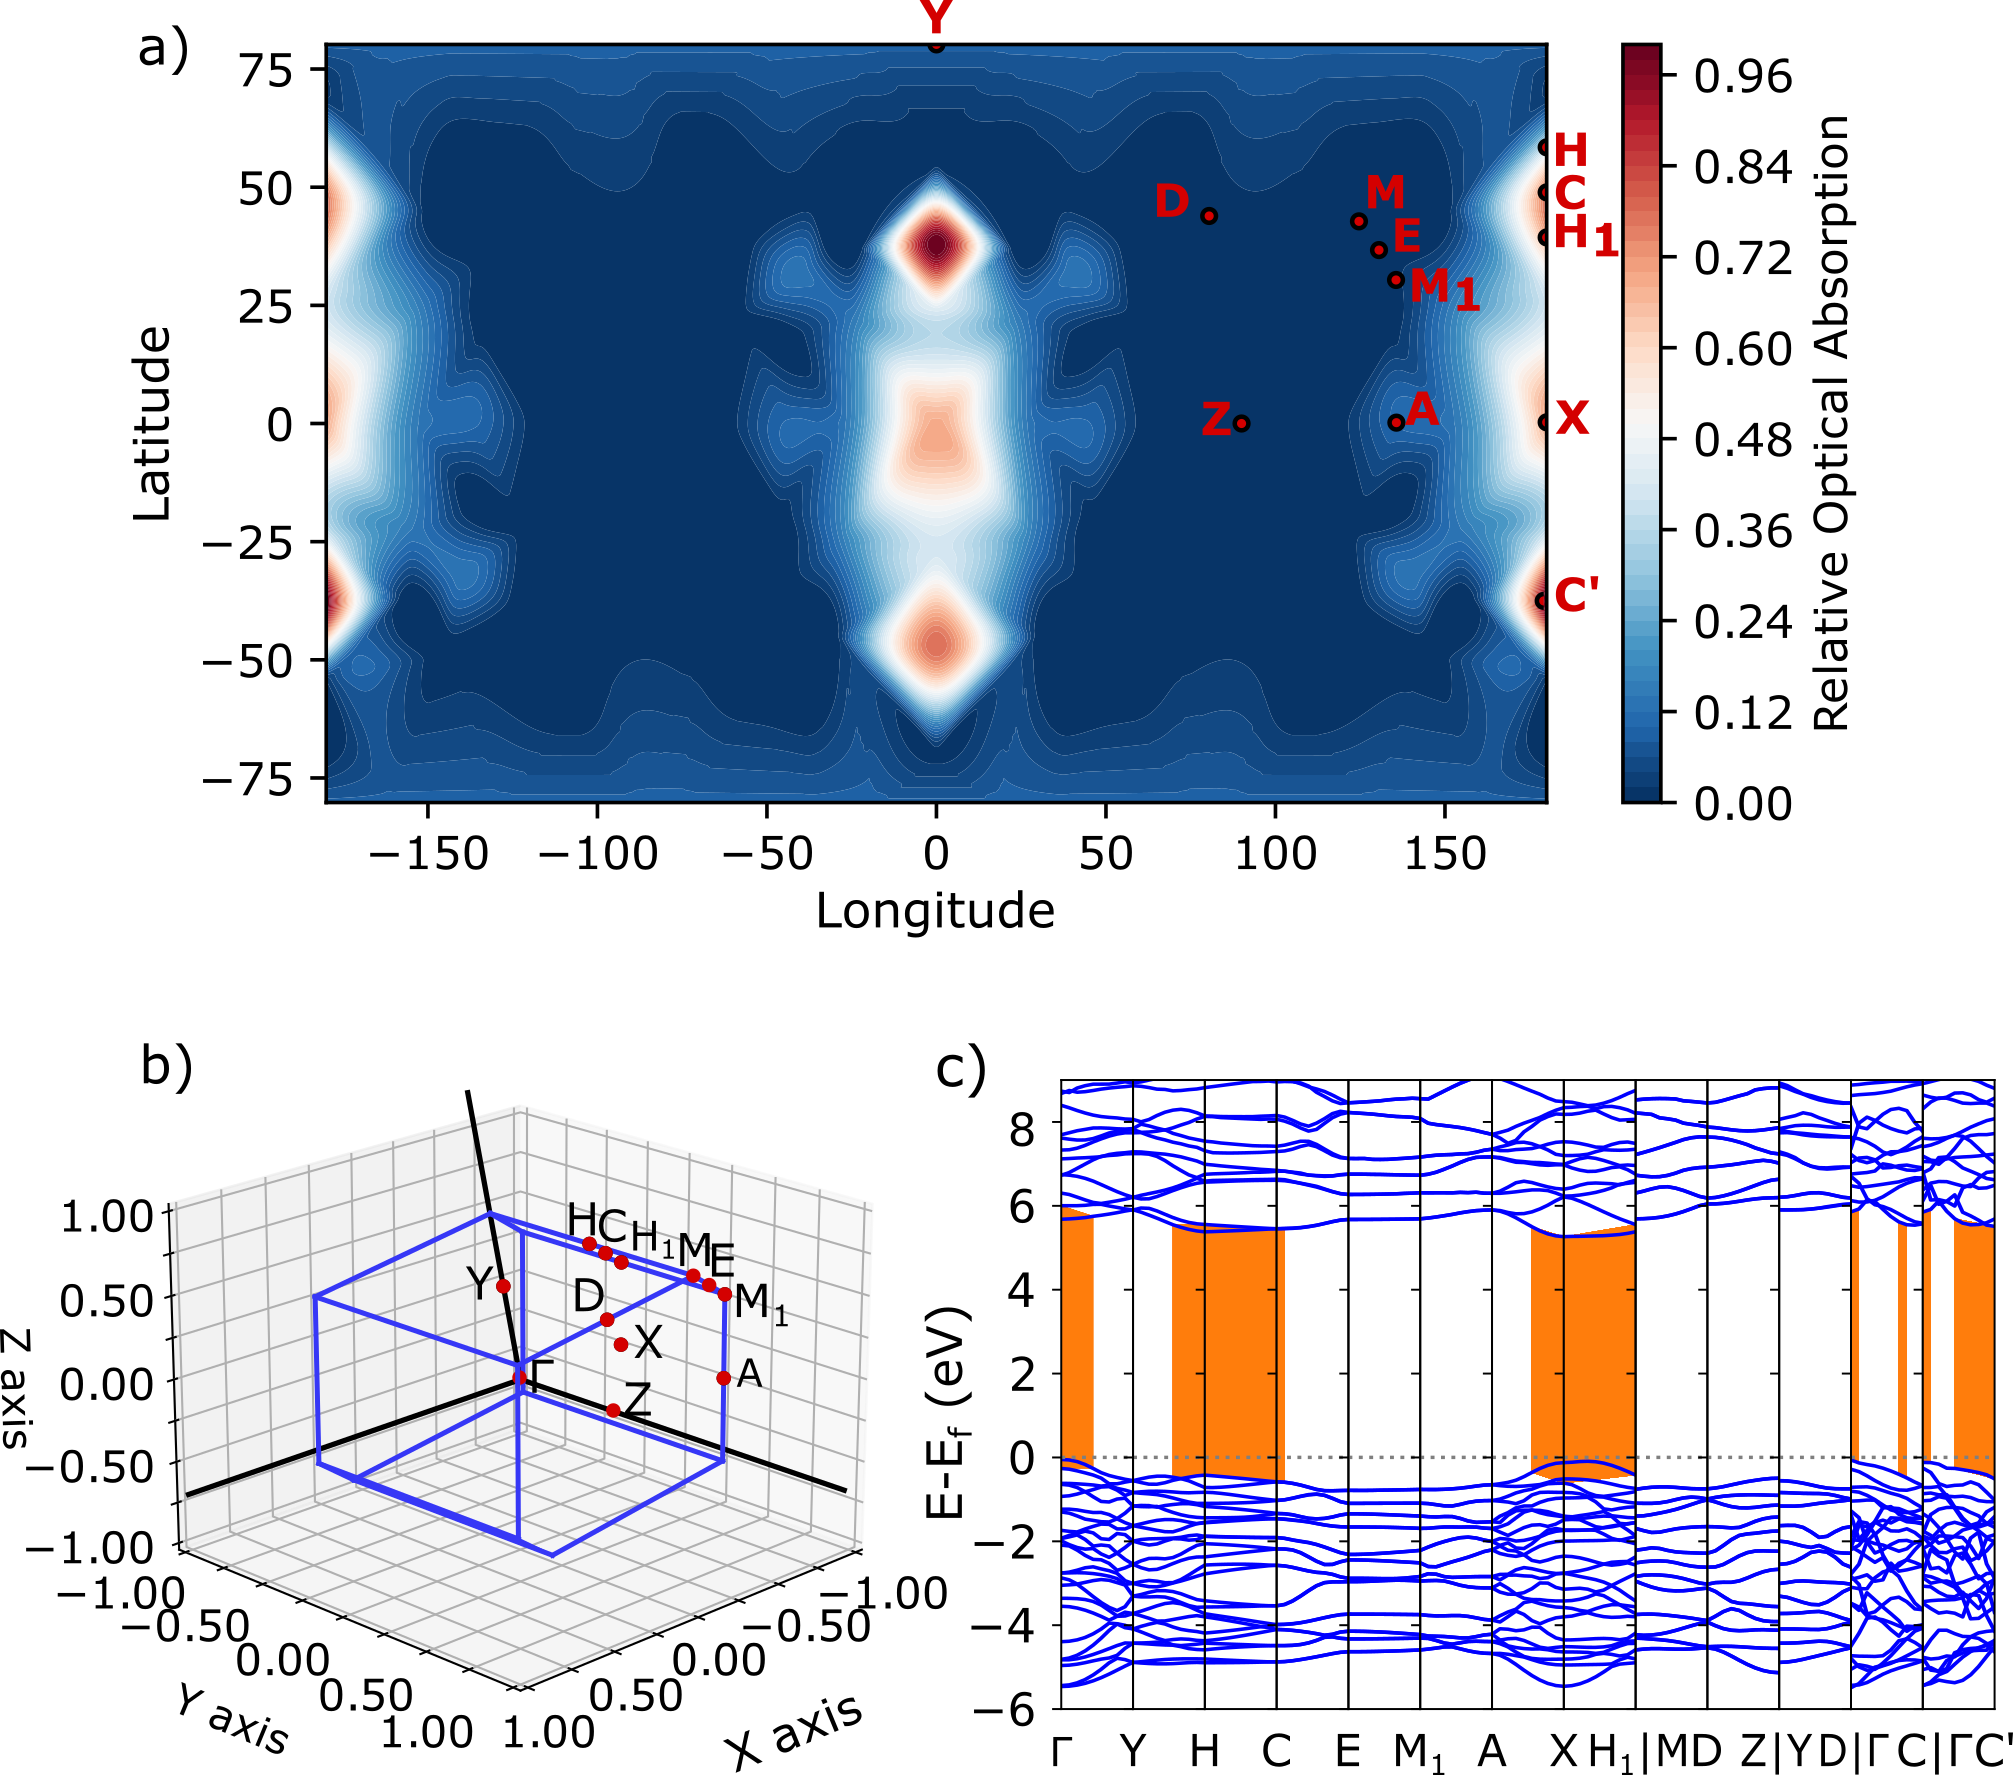
Finally, one has to consider that conventional band structures along a high-symmetry path do not show the band dispersion along all directions. For example, the heat map for \ceZrO2 in Fig. 6a) suggests that the strongest absorption should occur at a point we indicated as C’ ( direction). The segment from to C’ (see Fig. 6c)) is indeed quite non-dispersive and definitely flatter than the segment from to C ( direction), which is the one with the second strongest optical absorption in Fig. 6a), but which is not reported in conventional band-structure plots for \ceZrO2.
These results not only show that our approach intrinsically takes into account the probability of a transition to happen via the calculation of the TDM, which was not considered in the original approach of Ref. Giocondi, Salvador, and Rohrer, 2007, but also highlight that using only the dispersion of the conventional band structure to make predictions may not result in a complete description of the direction-dependent absorption properties.
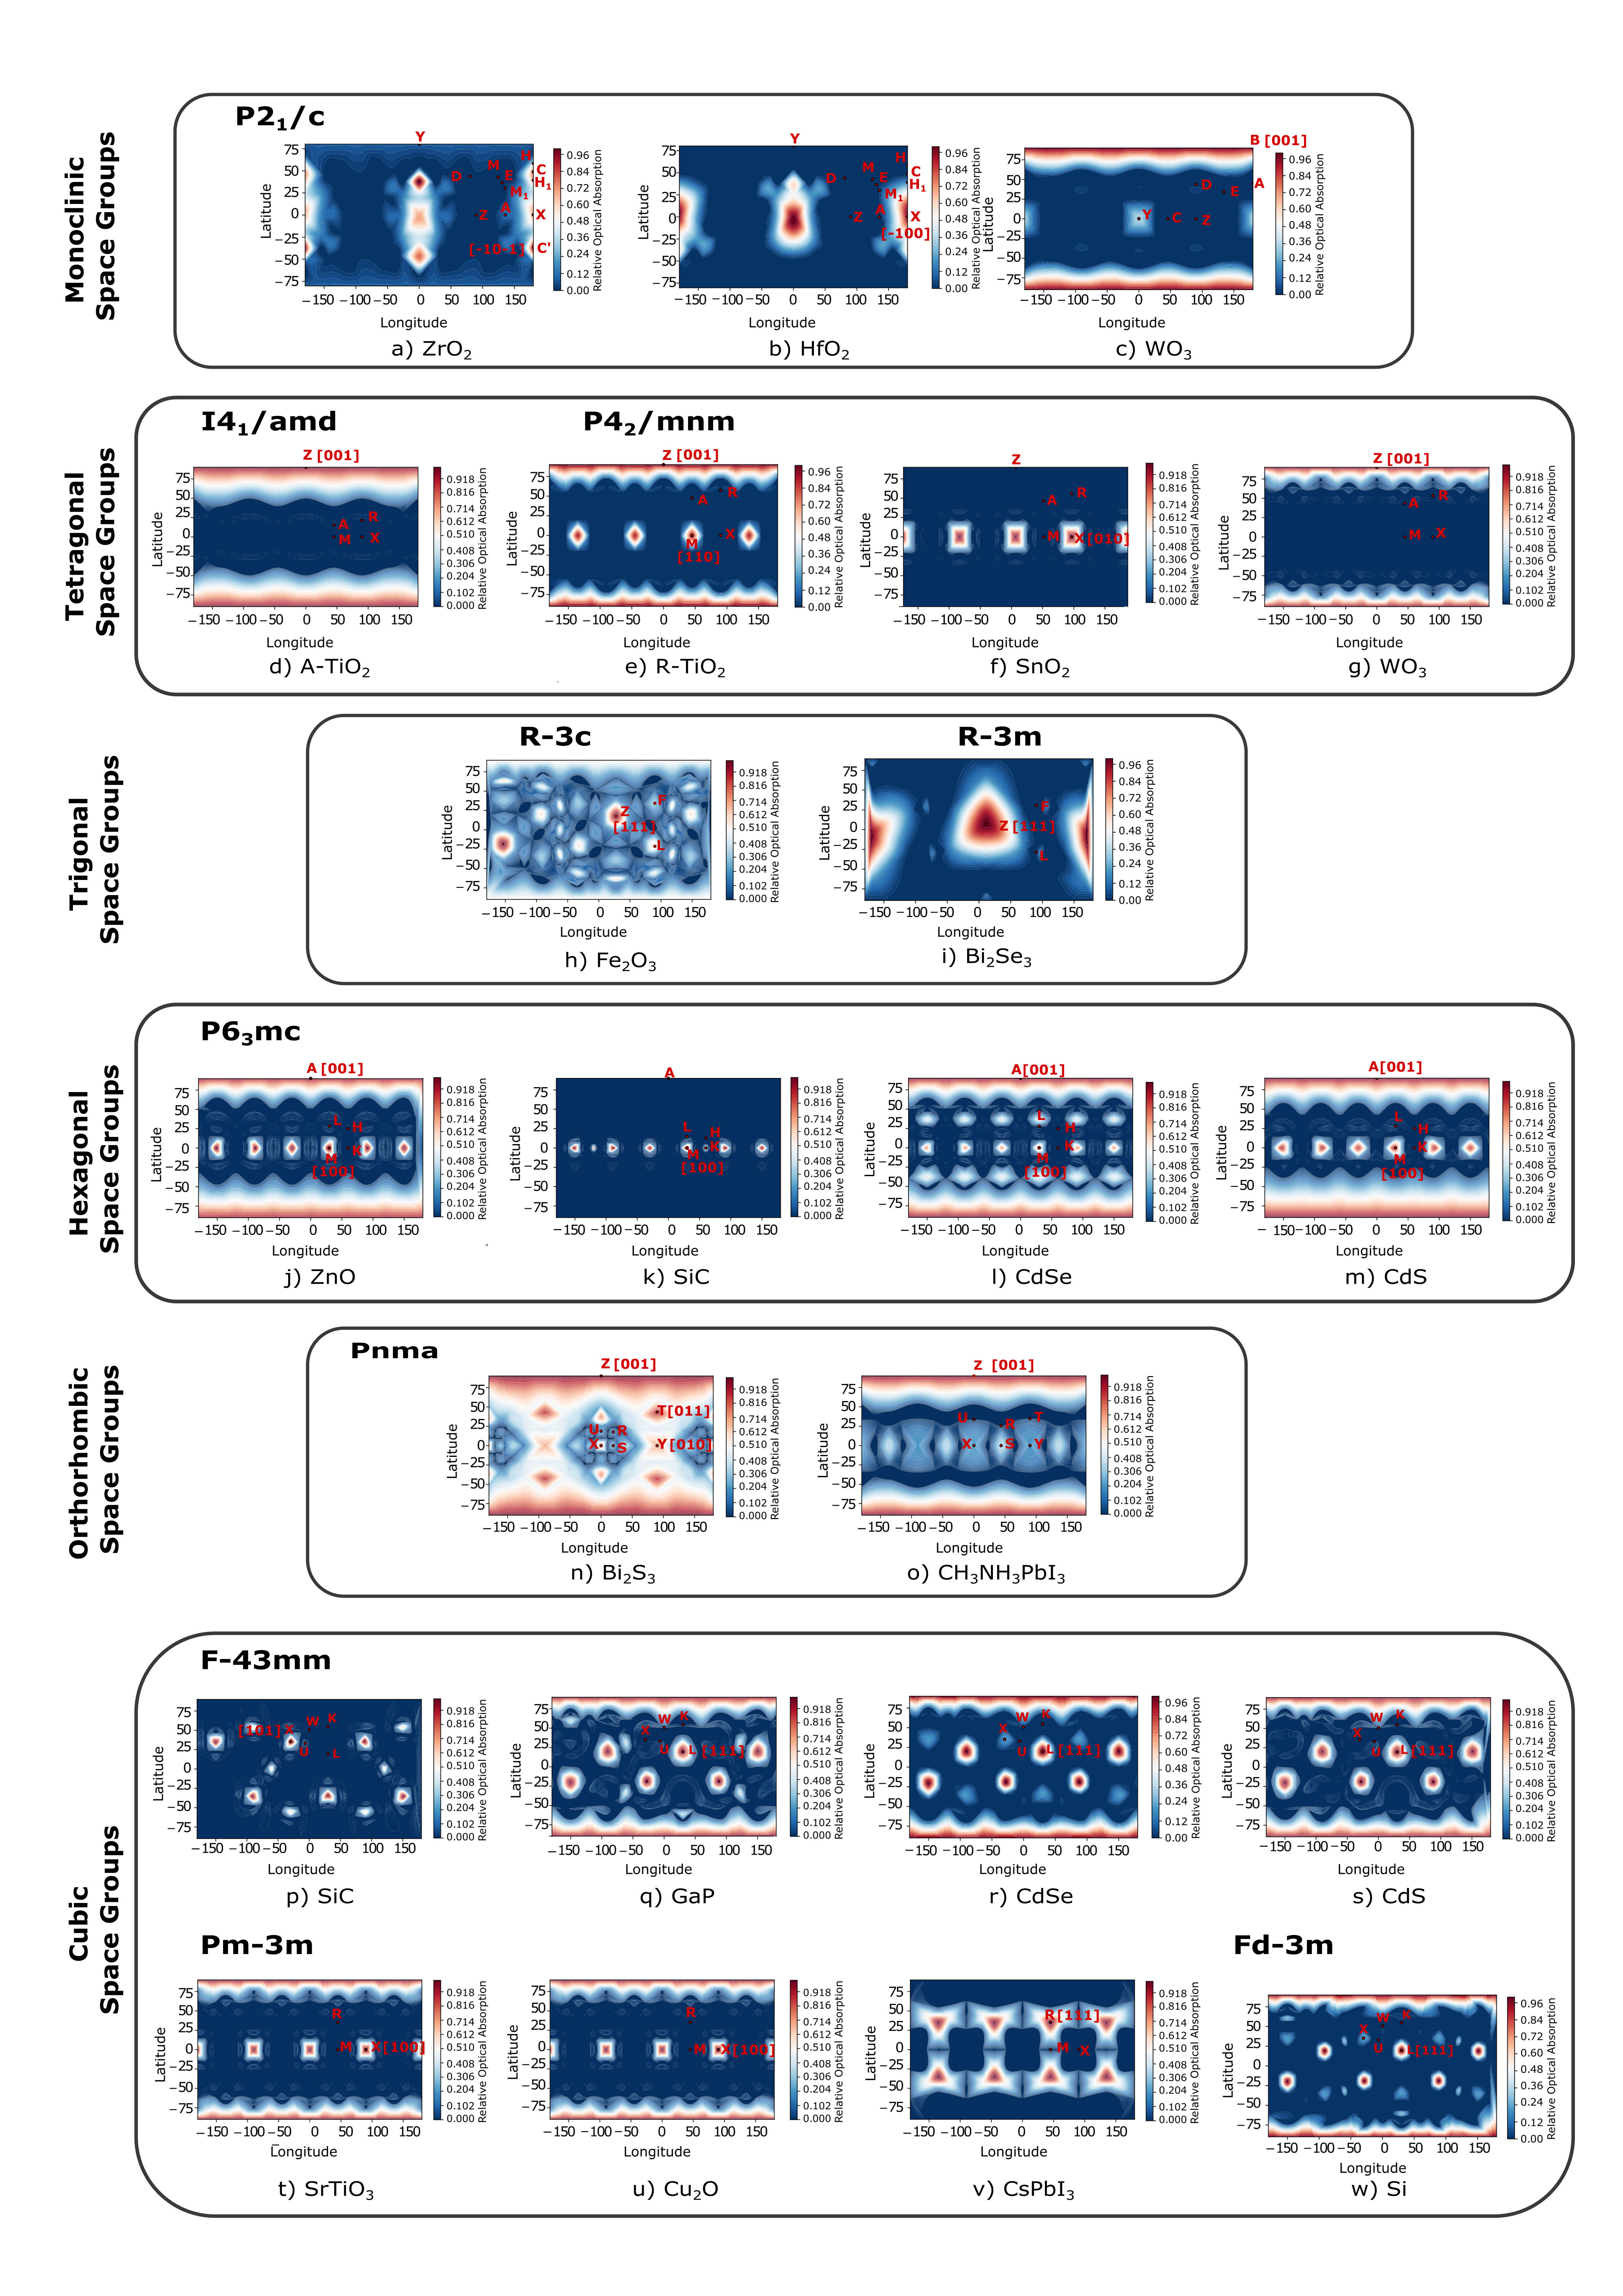
Fig. 7 reports the heat maps for the selected photocatalysts computed for transitions in the energy range going from the bandgap of each material up to the minimum energy necessary to observe vertical transitions. These heat maps can be used to predict the anisotropic reactivity of different photocatalysts. For example, the (100) surface is predicted to be the most reactive surface for \ceSrTiO3, \ceCu2O, \ceHfO2, \ceSnO2, and the hexagonal \ceSiC or together with the (001) surface for ZnO, and the hexagonal CdSe and CdS structures. Strong reactivity of the facets is predicted for materials like \ceWO3, anatase, \ceCH3NH3PbI3, and \ceBi2S3. Finally, the (111) surface should be the most reactive not only for materials with the zinc-blend structure, as discussed above, but also for Si, \ceBi2Se3, \ceFe2O3, and \ceCsPbI3, while for the cubic SiC phase a larger reactivity is expected for the facets.
We stress here that our heat maps suggest which surfaces are perpendicular to directions with the largest number of photo-generated carriers, but nothing ensures that these surfaces will necessarily be the most reactive in actual experiments. Phonon scattering can, for example, result in a change of the carrier momentum, implying that carrier mobility and mean free path need to be large for the carrier to reach a surface perpendicular to the initial direction Giocondi, Salvador, and Rohrer (2007).
Furthermore, our approach does not take into account surface band bending and hence the band-edge position at different surfaces nor the possibility of surface or surface defect states to act as trapping or recombination centers Giocondi, Salvador, and Rohrer (2007). Once at the surface, photo-generated carriers have to be efficiently transferred to acceptor/donor molecules, which may be preferentially absorbed on a surface different from the one with the largest number of carriers Giocondi, Salvador, and Rohrer (2007); Tan et al. (2016). The stability and structural properties of the surface are also important; in some cases, the reactivity of a surface can by related to the type and number of exposed undercoordinated surface sites Su et al. (2017) or the most reactive surface may not be the most stable one Chang et al. (2014a, b); Danilovic et al. (2014); Roy et al. (2018). For example, the larger photocatalytic activity of anatase nanoparticles with respect to rutile powders has sometimes been explained by the more active anatase (101) and (100) surfaces to be among the thermodynamically most stable surfaces Ahmed et al. (2011).
The mechanism of the studied redox process is also important. The above-mentioned contradictory results for rutile’s reactivity were partially explained by some authors investigating oxidation and others reduction reactions. In addition, depending on experimental conditions, a reaction can happen following different mechanisms: for example, methanol is oxidized directly by photo-generated holes for high methanol concentration, while for larger water content, the oxidation is mediated by hydroxyl radicals, thus resulting in different reactivity of rutile surfaces for the same reaction but under different experimental conditions Günnemann et al. (2019).
Finally, the activity of a photocatalyst is strongly dependent on its physicochemical properties, like the particle shape and size Tan et al. (2016). Giocondi et al. Giocondi, Salvador, and Rohrer (2007) suggested that the different conclusions of various experimental works on rutile can also be rationalized by having been performed using either extended planar samples or single crystal particles. The reactivity of these two types of samples is hard to compare. A planar sample may exhibit a reduced reactivity compared to a surface with the same orientation on a micro crystal bounded by several different facets, because the planar specimen only contains a subset of the particle’s surface sites and may therefore lack highly active sites for a given redox reaction.
Despite these limitations, our spherical heat maps contain information about a fundamental material property - the optical absorption and hence ability to photo-generate carriers along a given direction - and can thus be used as a guide in material engineering to enhance the photocatalytic performance of a catalyst.
IV Conclusions
In the present work, the direction-dependent optical properties of different photocatalysts were investigated via hybrid DFT calculations to elucidate their anisotropic reactivity. The probability of a crystal to photo-generate carriers with momentum along a certain direction in space upon irradiation with light of a specific energy was mapped on the surface of a unit sphere centered on the origin of the reciprocal lattice to obtain 3D heat maps. For each point of the map, the contribution of all possible excited transitions weighted by their probability (transition-dipole matrix) was taken into account.
Results indicate that, in the majority of the cases, the pattern of the heat map, and hence the anisotropy of the photo-generated carriers, can be directly explained using the anisotropy of the band dispersion observed in conventional 2D band-structure plots: the flatter the bands along one direction, the larger the number of photo-generated carriers with momentum in that direction, as suggested by Giocondi et al. Giocondi, Salvador, and Rohrer (2007). However, the results also suggest that 2D band-structure plots are not always sufficient to understand the direction-dependence of the optical properties, but that weighing by a transition’s probability according to the the transition-dipole matrix can be crucial to obtain a complete picture.
Despite the possibility that the surface associated with the largest number of photo-generated carriers will not appear as most reactive in experiments, our approach captures a fundamental material property and can thus be invoked to predict the anisotropic reactivity of crystals to guide the design and development of highly efficient photocatalysts.
Acknowledgements.
This research was supported by the NCCR MARVEL, funded by the Swiss National Science Foundation. Computational resources were provided by the University of Bern (on the HPC cluster UBELIX, http://www.id.unibe.ch/hpc) and by the Swiss National Supercomputing Center (CSCS) under projects ID mr26 and s1033.Data Availability Statement
The data used to derive the findings in this study are openly available on Materials Cloud at http://doi.org/[doi].
References
- Fujishima and Honda (1972) A. Fujishima and K. Honda, “Electrochemical Photolysis of Water at a Semiconductor Electrode,” Nature 238, 37–38 (1972).
- Xie et al. (2016) S. Xie, Q. Zhang, G. Liu, and Y. Wang, “Photocatalytic and Photoelectrocatalytic Reduction of \ceCO2 using Heterogeneous Catalysts with Controlled Nanostructures,” Chem. Commun. 52, 35–59 (2016).
- Li, Yu, and Jaroniec (2016) X. Li, J. Yu, and M. Jaroniec, “Hierarchical Photocatalysts,” Chem. Soc. Rev. 45, 2603–2636 (2016).
- Tee et al. (2017) S. Y. Tee, K. Y. Win, W. S. Teo, L.-D. Koh, S. Liu, C. P. Teng, and M.-Y. Han, “Recent Progress in Energy-Driven Water Splitting,” Advanced Science 4, 1600337 (2017).
- San Martín, Rivero, and Ortiz (2020) S. San Martín, M. J. Rivero, and I. Ortiz, “Unravelling the Mechanisms that Drive the Performance of Photocatalytic Hydrogen Production,” Catalysts 10, 901 (2020).
- Lowekamp et al. (1998) J. B. Lowekamp, G. S. Rohrer, P. A. Morris Hotsenpiller, J. D. Bolt, and W. E. Farneth, “Anisotropic Photochemical Reactivity of Bulk \ceTiO2 Crystals,” The Journal of Physical Chemistry B 102, 7323–7327 (1998).
- Giocondi and Rohrer (2001) J. L. Giocondi and G. S. Rohrer, “Spatial Separation of Photochemical Oxidation and Reduction Reactions on the Surface of Ferroelectric \ceBaTiO3,” The Journal of Physical Chemistry B 105, 8275–8277 (2001).
- Ohno, Sarukawa, and Matsumura (2002) T. Ohno, K. Sarukawa, and M. Matsumura, “Crystal Faces of Rutile and Anatase \ceTiO2 Particles and Their Roles in Photocatalytic Reactions,” New J. Chem. 26, 1167–1170 (2002).
- Taguchi et al. (2003) T. Taguchi, Y. Saito, K. Sarukawa, T. Ohno, and M. Matsumura, “Formation of New Crystal Faces on \ceTiO2 Particles by Treatment with Aqueous HF solution or hot sulfuric acid,” New J. Chem. 27, 1304–1306 (2003).
- Giocondi, Salvador, and Rohrer (2007) J. L. Giocondi, P. A. Salvador, and G. S. Rohrer, “The Origin of Photochemical Anisotropy in \ceSrTiO3,” Topics in Catalysis 44, 529–533 (2007).
- Corà et al. (2004) F. Corà, M. Alfredsson, G. Mallia, D. S. Middlemiss, W. C. Mackrodt, R. Dovesi, and R. Orlando, “The Performance of Hybrid Density Functionals in Solid State Chemistry,” in Principles and Applications of Density Functional Theory in Inorganic Chemistry II (Springer Berlin Heidelberg, Berlin, Heidelberg, 2004) pp. 171–232.
- Brothers et al. (2008) E. N. Brothers, A. F. Izmaylov, J. O. Normand, V. Barone, and G. E. Scuseria, “Accurate Solid-State Band Gaps via Screened Hybrid Electronic Structure Calculations,” The Journal of Chemical Physics 129, 011102 (2008).
- Henderson, Paier, and Scuseria (2011) T. M. Henderson, J. Paier, and G. E. Scuseria, “Accurate Treatment of Solids with the HSE Screened Hybrid,” Physica Status Solidi (b) 248, 767–774 (2011).
- Gajdoš et al. (2006a) M. Gajdoš, K. Hummer, G. Kresse, J. Furthmüller, and F. Bechstedt, “Linear Optical Properties in the Projector-Augmented Wave Methodology,” Phys. Rev. B 73, 045112 (2006a).
- Wang et al. (2019) J. Wang, H. Chen, S.-H. Wei, and W.-J. Yin, “Materials Design of Solar Cell Absorbers Beyond Perovskites and Conventional Semiconductors via Combining Tetrahedral and Octahedral Coordination,” Advanced Materials 31, 1806593 (2019).
- Nishiwaki and Fujiwara (2020) M. Nishiwaki and H. Fujiwara, “Highly Accurate Prediction of Material Optical Properties Based on Density Functional Theory,” Computational Materials Science 172, 109315 (2020).
- Dresselhaus et al. (2001) M. Dresselhaus et al., “Solid State Physics Part II : Optical Properties of Solids,” Lecture Notes (Massachusetts Institute of Technology, Cambridge, MA) 17, 15–16 (2001).
- Kresse and Hafner (1993) G. Kresse and J. Hafner, “Ab Initio Molecular Dynamics for Liquid Metals,” Phys. Rev. B 47, 558–561 (1993).
- Kresse and Hafner (1994) G. Kresse and J. Hafner, “Ab Initio Molecular-Dynamics Simulation of the Liquid-Metal–Amorphous-Semiconductor Transition in Germanium,” Phys. Rev. B 49, 14251–14269 (1994).
- Kresse and Furthmüller (1996a) G. Kresse and J. Furthmüller, “Efficiency of ab-initio Total Energy Calculations for Metals and Semiconductors using a Plane-Wave Basis Set,” Comput. Mater. Sci. 6, 15–50 (1996a).
- Kresse and Furthmüller (1996b) G. Kresse and J. Furthmüller, “Efficient Iterative Schemes for Ab Initio Total-Energy Calculations using a Plane-Wave Basis Set,” Phys. Rev. B 54, 11169–11186 (1996b).
- Heyd, Scuseria, and Ernzerhof (2003) J. Heyd, G. E. Scuseria, and M. Ernzerhof, “Hybrid Functionals Based on a Screened Coulomb Potential,” J. Chem. Phys. 118, 8207–8215 (2003).
- Heyd and Scuseria (2004) J. Heyd and G. E. Scuseria, “Efficient Hybrid Density Functional Calculations in Solids: Assessment of the Heyd–Scuseria–Ernzerhof screened Coulomb Hybrid Functional,” J. Chem. Phys. 121, 1187–1192 (2004).
- Blöchl (1994) P. E. Blöchl, “Projector Augmented-Wave Method,” Phys. Rev. B 50, 17953–17979 (1994).
- Kresse and Joubert (1999) G. Kresse and D. Joubert, “From Ultrasoft Pseudopotentials to the Projector Augmented-Wave Method,” Phys. Rev. B 59, 1758–1775 (1999).
- Gajdoš et al. (2006b) M. Gajdoš, K. Hummer, G. Kresse, J. Furthmüller, and F. Bechstedt, “Linear Optical Properties in the Projector-Augmented Wave Methodology,” Phys. Rev. B 73, 045112 (2006b).
- Ong et al. (2013) S. P. Ong, W. D. Richards, A. Jain, G. Hautier, M. Kocher, S. Cholia, D. Gunter, V. L. Chevrier, K. A. Persson, and G. Ceder, “Python Materials Genomics (pymatgen): A Robust, Open-Source python Library for Materials Analysis,” Computational Materials Science 68, 314–319 (2013).
- Wang et al. (2021) V. Wang, N. Xu, J.-C. Liu, G. Tang, and W.-T. Geng, “VASPKIT: A User-friendly Interface Facilitating High-throughput Computing and Analysis using VASP Code,” Computer Physics Communications 267, 108033 (2021).
- Günnemann et al. (2019) C. Günnemann, C. Haisch, M. Fleisch, J. Schneider, A. V. Emeline, and D. W. Bahnemann, “Insights into Different Photocatalytic Oxidation Activities of Anatase, Brookite, and Rutile Single-Crystal Facets,” ACS Catalysis 9, 1001–1012 (2019).
- Ahmed et al. (2011) A. Y. Ahmed, T. A. Kandiel, T. Oekermann, and D. Bahnemann, “Photocatalytic Activities of Different Well-defined Single Crystal \ceTiO2 Surfaces: Anatase versus Rutile,” The Journal of Physical Chemistry Letters 2, 2461–2465 (2011).
- Luttrell et al. (2014) T. Luttrell, S. Halpegamage, J. Tao, A. Kramer, E. Sutter, and M. Batzill, “Why is Anatase a Better Photocatalyst than Rutile?-Model Studies on Epitaxial \ceTiO2 Films,” Scientific reports 4, 1–8 (2014).
- Quah, Wilson, and Idriss (2010) E. L. Quah, J. N. Wilson, and H. Idriss, “Photoreaction of the Rutile \ceTiO2(011) Single-Crystal Surface: Reaction with Acetic Acid,” Langmuir 26, 6411–6417 (2010).
- Tan et al. (2016) H. L. Tan, X. Wen, R. Amal, and Y. H. Ng, “\ceBiVO4 010 and 110 Relative Exposure Extent: Governing Factor of Surface Charge Population and Photocatalytic Activity,” The Journal of Physical Chemistry Letters 7, 1400–1405 (2016).
- Su et al. (2017) Y. Su, H. Li, H. Ma, J. Robertson, and A. Nathan, “Controlling Surface Termination and Facet Orientation in \ceCu2O Nanoparticles for High Photocatalytic Activity: A combined Experimental and Density Functional Theory Study,” ACS Applied Materials & Interfaces 9, 8100–8106 (2017).
- Chang et al. (2014a) S. H. Chang, N. Danilovic, K.-C. Chang, R. Subbaraman, A. P. Paulikas, D. D. Fong, M. J. Highland, P. M. Baldo, V. R. Stamenkovic, J. W. Freeland, J. A. Eastman, and N. M. Markovic, “Functional Links between Stability and Reactivity of Strontium Ruthenate Single Crystals during Oxygen Evolution,” Nature Communications 5, 4191 (2014a).
- Chang et al. (2014b) S. H. Chang, J. G. Connell, N. Danilovic, R. Subbaraman, K.-C. Chang, V. R. Stamenkovic, and N. M. Markovic, “Activity–Stability Relationship in the Surface Electrochemistry of the Oxygen Evolution Reaction,” Faraday Discuss. 176, 125–133 (2014b).
- Danilovic et al. (2014) N. Danilovic, R. Subbaraman, K.-C. Chang, S. H. Chang, Y. J. Kang, J. Snyder, A. P. Paulikas, D. Strmcnik, Y.-T. Kim, D. Myers, V. R. Stamenkovic, and N. M. Markovic, “Activity–Stability Trends for the Oxygen Evolution Reaction on Monometallic Oxides in Acidic Environments,” The Journal of Physical Chemistry Letters 5, 2474–2478 (2014).
- Roy et al. (2018) C. Roy, R. R. Rao, K. A. Stoerzinger, J. Hwang, J. Rossmeisl, I. Chorkendorff, Y. Shao-Horn, and I. E. L. Stephens, “Trends in Activity and Dissolution on \ceRuO2 under Oxygen Evolution Conditions: Particles versus Well-Defined Extended Surfaces,” ACS Energy Letters 3, 2045–2051 (2018).
- Sandratskii, Uhl, and Kübler (1996) L. M. Sandratskii, M. Uhl, and J. Kübler, “Band Theory for Electronic and Magnetic Properties of -\ceFe2O3,” Journal of Physics: Condensed Matter 8, 983–989 (1996).
- Yang et al. (2016) C. Yang, J.-F. Chen, X. Zeng, D. Cheng, H. Huang, and D. Cao, “Enhanced Near-infrared Shielding Ability of (Li,K)-codoped \ceWO3 for Smart Windows: DFT Prediction Validated by Experiment,” Nanotechnology 27, 075203 (2016).
- Zhou, Shi, and Guo (2016) Z. Zhou, J. Shi, and L. Guo, “A Comparative Study on Structural and Electronic Properties and Formation Energy of Bulk -\ceFe2O3 using First-Principles Calculations with Different density Functionals,” Computational Materials Science 113, 117–122 (2016).
- Bashyal et al. (2018) K. Bashyal, C. K. Pyles, S. Afroosheh, A. Lamichhane, and A. T. Zayak, “Empirical Optimization of DFT+U and HSE for the band structure of \ceZnO,” Journal of Physics: Condensed Matter 30, 065501 (2018).
- Heyd et al. (2005) J. Heyd, J. E. Peralta, G. E. Scuseria, and R. L. Martin, “Energy Band Gaps and Lattice Parameters Evaluated with the Heyd-Scuseria-Ernzerhof Screened Hybrid Functional,” The Journal of Chemical Physics 123, 174101 (2005).
- Savory et al. (2016) C. N. Savory, R. G. Palgrave, H. Bronstein, and D. O. Scanlon, “Spatial Electron-Hole Separation in a One Dimensional Hybrid Organic–Inorganic Lead Iodide,” Scientific Reports 6, 1–7 (2016).
- Howard, Hill, and Reichert (1988) C. J. Howard, R. J. Hill, and B. E. Reichert, “Structures of \ceZrO2 Polymorphs at Room Temperature by High-Resolution Neutron Powder Diffraction,” Acta Crystallographica Section B 44, 116–120 (1988).
- Adam and Rogers (1959) J. Adam and M. D. Rogers, “The Crystal Structure of \ceZrO2 and \ceHfO2,” Acta Crystallographica 12, 951 (1959).
- Loopstra and Boldrini (1966) B. O. Loopstra and P. Boldrini, “Neutron Diffraction Investigation of \ceWO3,” Acta Crystallographica 21, 158–162 (1966).
- Burdett et al. (1987) J. K. Burdett, T. Hughbanks, G. J. Miller, J. W. Richardson, and J. V. Smith, “Structural-Electronic Relationships in Inorganic Solids: Powder Neutron Diffraction Studies of the Rutile and Anatase Polymorphs of Titanium Dioxide at 15 and 295 K,” Journal of the American Chemical Society 109, 3639–3646 (1987).
- Kehl, Hay, and Wahl (1952) W. L. Kehl, R. G. Hay, and D. Wahl, “The Structure of Tetragonal Tungsten Trioxide,” Journal of Applied Physics 23, 212–215 (1952).
- Baur (1956) W. H. Baur, “Über die Verfeinerung der Kristallstrukturbestimmung einiger Vertreter des Rutiltyps: \ceTiO2, \ceSO2, \ceGeO2 und \ceMgF2,” Acta Crystallographica 9, 515–520 (1956).
- Cornell and Schwertmann (2003) R. Cornell and U. Schwertmann, “Colour Plates,” in The Iron Oxides (John Wiley and Sons, Ltd, 2003) pp. xxi–xxxix.
- Nakajima (1963) S. Nakajima, “The Crystal Structure of \ceBi2Te3-xSex,” Journal of Physics and Chemistry of Solids 24, 479–485 (1963).
- Sabine and Hogg (1969) T. M. Sabine and S. Hogg, “The Wurtzite Z Parameter for Beryllium Oxide and Zinc Oxide,” Acta Crystallographica Section B 25, 2254–2256 (1969).
- Bauer et al. (2001) A. Bauer, P. Reischauer, J. Kräusslich, N. Schell, W. Matz, and K. Goetz, “Structure Refinement of the Silicon Carbide Polytypes 4ıt H and 6ıt H: Unambiguous Determination of the Refinement Parameters,” Acta Crystallographica Section A 57, 60–67 (2001).
- Madelung (2004) O. Madelung, Semiconductors: Data Handbook (Springer Science & Business Media, 2004).
- Dalvand, Mohammadi, and Fray (2011) P. Dalvand, M. R. Mohammadi, and D. J. Fray, “One-dimensional Cadmium Sulfide (\ceCdS) Nanostructures by the Solvothermal Process: Controlling Crystal Structure and Morphology Aided by Different Solvents,” Materials Letters 65, 1291–1294 (2011).
- Sharma et al. (2012) Y. Sharma, P. Srivastava, A. Dashora, L. Vadkhiya, M. K. Bhayani, R. Jain, A. R. Jani, and B. L. Ahuja, “Electronic Structure, Optical Properties and Compton Profiles of \ceBi2S3 and \ceBi2Se3,” Solid State Sciences 14, 241–249 (2012).
- Baikie et al. (2013) T. Baikie, Y. Fang, J. M. Kadro, M. Schreyer, F. Wei, S. G. Mhaisalkar, M. Graetzel, and T. J. White, “Synthesis and Crystal Chemistry of the Hybrid Perovskite ((\ceCH3NH3)\cePbI3 for Solid-State Sensitised Solar Cell Applications,” J. Mater. Chem. A 1, 5628–5641 (2013).
- Cao, Sozontov, and Zegenhagen (2000) L. Cao, E. Sozontov, and J. Zegenhagen, “Cubic to Tetragonal Phase Transition of \ceSrTiO3 Under Epitaxial Stress: An X-ray Backscattering Study,” physica status solidi (a) 181, 387–404 (2000).
- Werner and Hochheimer (1982) A. Werner and H. D. Hochheimer, “High-Pressure X-ray Study of \ceCu2O and \ceAg2O,” Phys. Rev. B 25, 5929–5934 (1982).
- Trots and Myagkota (2008) D. M. Trots and S. V. Myagkota, “High-Temperature Structural Evolution of aesium and Rubidium Triiodoplumbates,” Journal of Physics and Chemistry of Solids 69, 2520–2526 (2008).
- Dash et al. (2004) L. K. Dash, N. Vast, P. Baranek, M.-C. Cheynet, and L. Reining, “Electronic Structure and Electron Energy-Loss Spectroscopy of \ceZrO2 Zirconia,” Phys. Rev. B 70, 245116 (2004).
- Ni et al. (2008) J. Ni, Q. Zhou, Z. Li, and Z. Zhang, “Oxygen Defect Induced Photoluminescence of \ceHfO2 Thin Films,” Applied Physics Letters 93, 011905 (2008).
- Koffyberg, Dwight, and Wold (1979) F. P. Koffyberg, K. Dwight, and A. Wold, “Interband Transitions of Semiconducting Oxides Determined from Photoelectrolysis Spectra,” Solid State Communications 30, 433–437 (1979).
- Hodes, Cahen, and Manassen (1976) G. Hodes, D. Cahen, and J. Manassen, “Tungsten Trioxide as a Photoanode for a Photoelectrochemical Cell (PEC),” Nature 260, 312–313 (1976).
- Quarto, Paola, and Sunseri (1981) F. D. Quarto, A. D. Paola, and C. Sunseri, “Semiconducting Properties of Anodic \ceWO3 Amorphous Films,” Electrochimica Acta 26, 1177–1184 (1981).
- Tang et al. (1993) H. Tang, H. Berger, P. E. Schmid, F. Lévy, and G. Burri, “Photoluminescence in \ceTiO2 Anatase Single Crystals,” Solid State Communications 87, 847–850 (1993).
- Tang et al. (1995) H. Tang, F. Lévy, H. Berger, and P. E. Schmid, “Urbach Tail of Anatase \ceTiO2,” Phys. Rev. B 52, 7771–7774 (1995).
- Iwai (1960) T. Iwai, “Temperature Dependence of the Optical Absorption Edge of Tungsten Trioxide Single Crystal,” Journal of the Physical Society of Japan 15, 1596–1600 (1960).
- Cho et al. (2002) Y. M. Cho, W. K. Choo, H. Kim, D. Kim, and Y. Ihm, “Effects of Rapid Thermal Annealing on the Ferromagnetic Properties of Sputtered Zn1-x(Co0.5Fe0.5)xO Thin Films,” Applied Physics Letters 80, 3358–3360 (2002).
- Mochizuki (1977) S. Mochizuki, “Electrical Conductivity of -\ceFe2O3,” physica status solidi (a) 41, 591–594 (1977).
- Reynolds et al. (1999) D. C. Reynolds, D. C. Look, B. Jogai, C. W. Litton, G. Cantwell, and W. C. Harsch, “Valence-Band Ordering in \ceZnO,” Phys. Rev. B 60, 2340–2344 (1999).
- Kaplan, Bermudez, and Harris (1995) R. Kaplan, V. Bermudez, and G. Harris, “Properties of Silicon Carbide,” EMIS Datareview Series INSPEC, London (1995).
- Maity and Chattopadhyay (2006) R. Maity and K. Chattopadhyay, “Synthesis and Optical Characterization of \ceCdS Nanowires by Chemical Process,” Journal of Nanoparticle Research 8, 125–130 (2006).
- van Benthem, Elsässer, and French (2001) K. van Benthem, C. Elsässer, and R. H. French, “Bulk Electronic Structure of \ceSrTiO3: Experiment and Theory,” Journal of Applied Physics 90, 6156–6164 (2001).
- Lide (2007) D. R. Lide, CRC Handbook of Chemistry and Physics 88th ed., edited by D. R. Lide (CRC Press/Taylor & Francis Group: Boca Raton, FL, 2007).
- Sutton et al. (2018) R. J. Sutton, M. R. Filip, A. A. Haghighirad, N. Sakai, B. Wenger, F. Giustino, and H. J. Snaith, “Cubic or Orthorhombic? Revealing the Crystal Structure of Metastable Black-Phase \ceCsPbI3 by Theory and Experiment,” ACS Energy Letters 3, 1787–1794 (2018).
Supplementary information for
Photochemical Anisotropy and Direction-Dependent Optical Absorption Properties in Semiconductors
Chiara Ricca,1,2 and Ulrich Aschauer1,2
1Department of Chemistry and Biochemistry, University of Bern, Freiestrasse 3, CH-3012 Bern, Switzerland
2National Centre for Computational Design and Discovery of Novel Materials (MARVEL), Switzerland
(Dated: )
S1 Computational Details
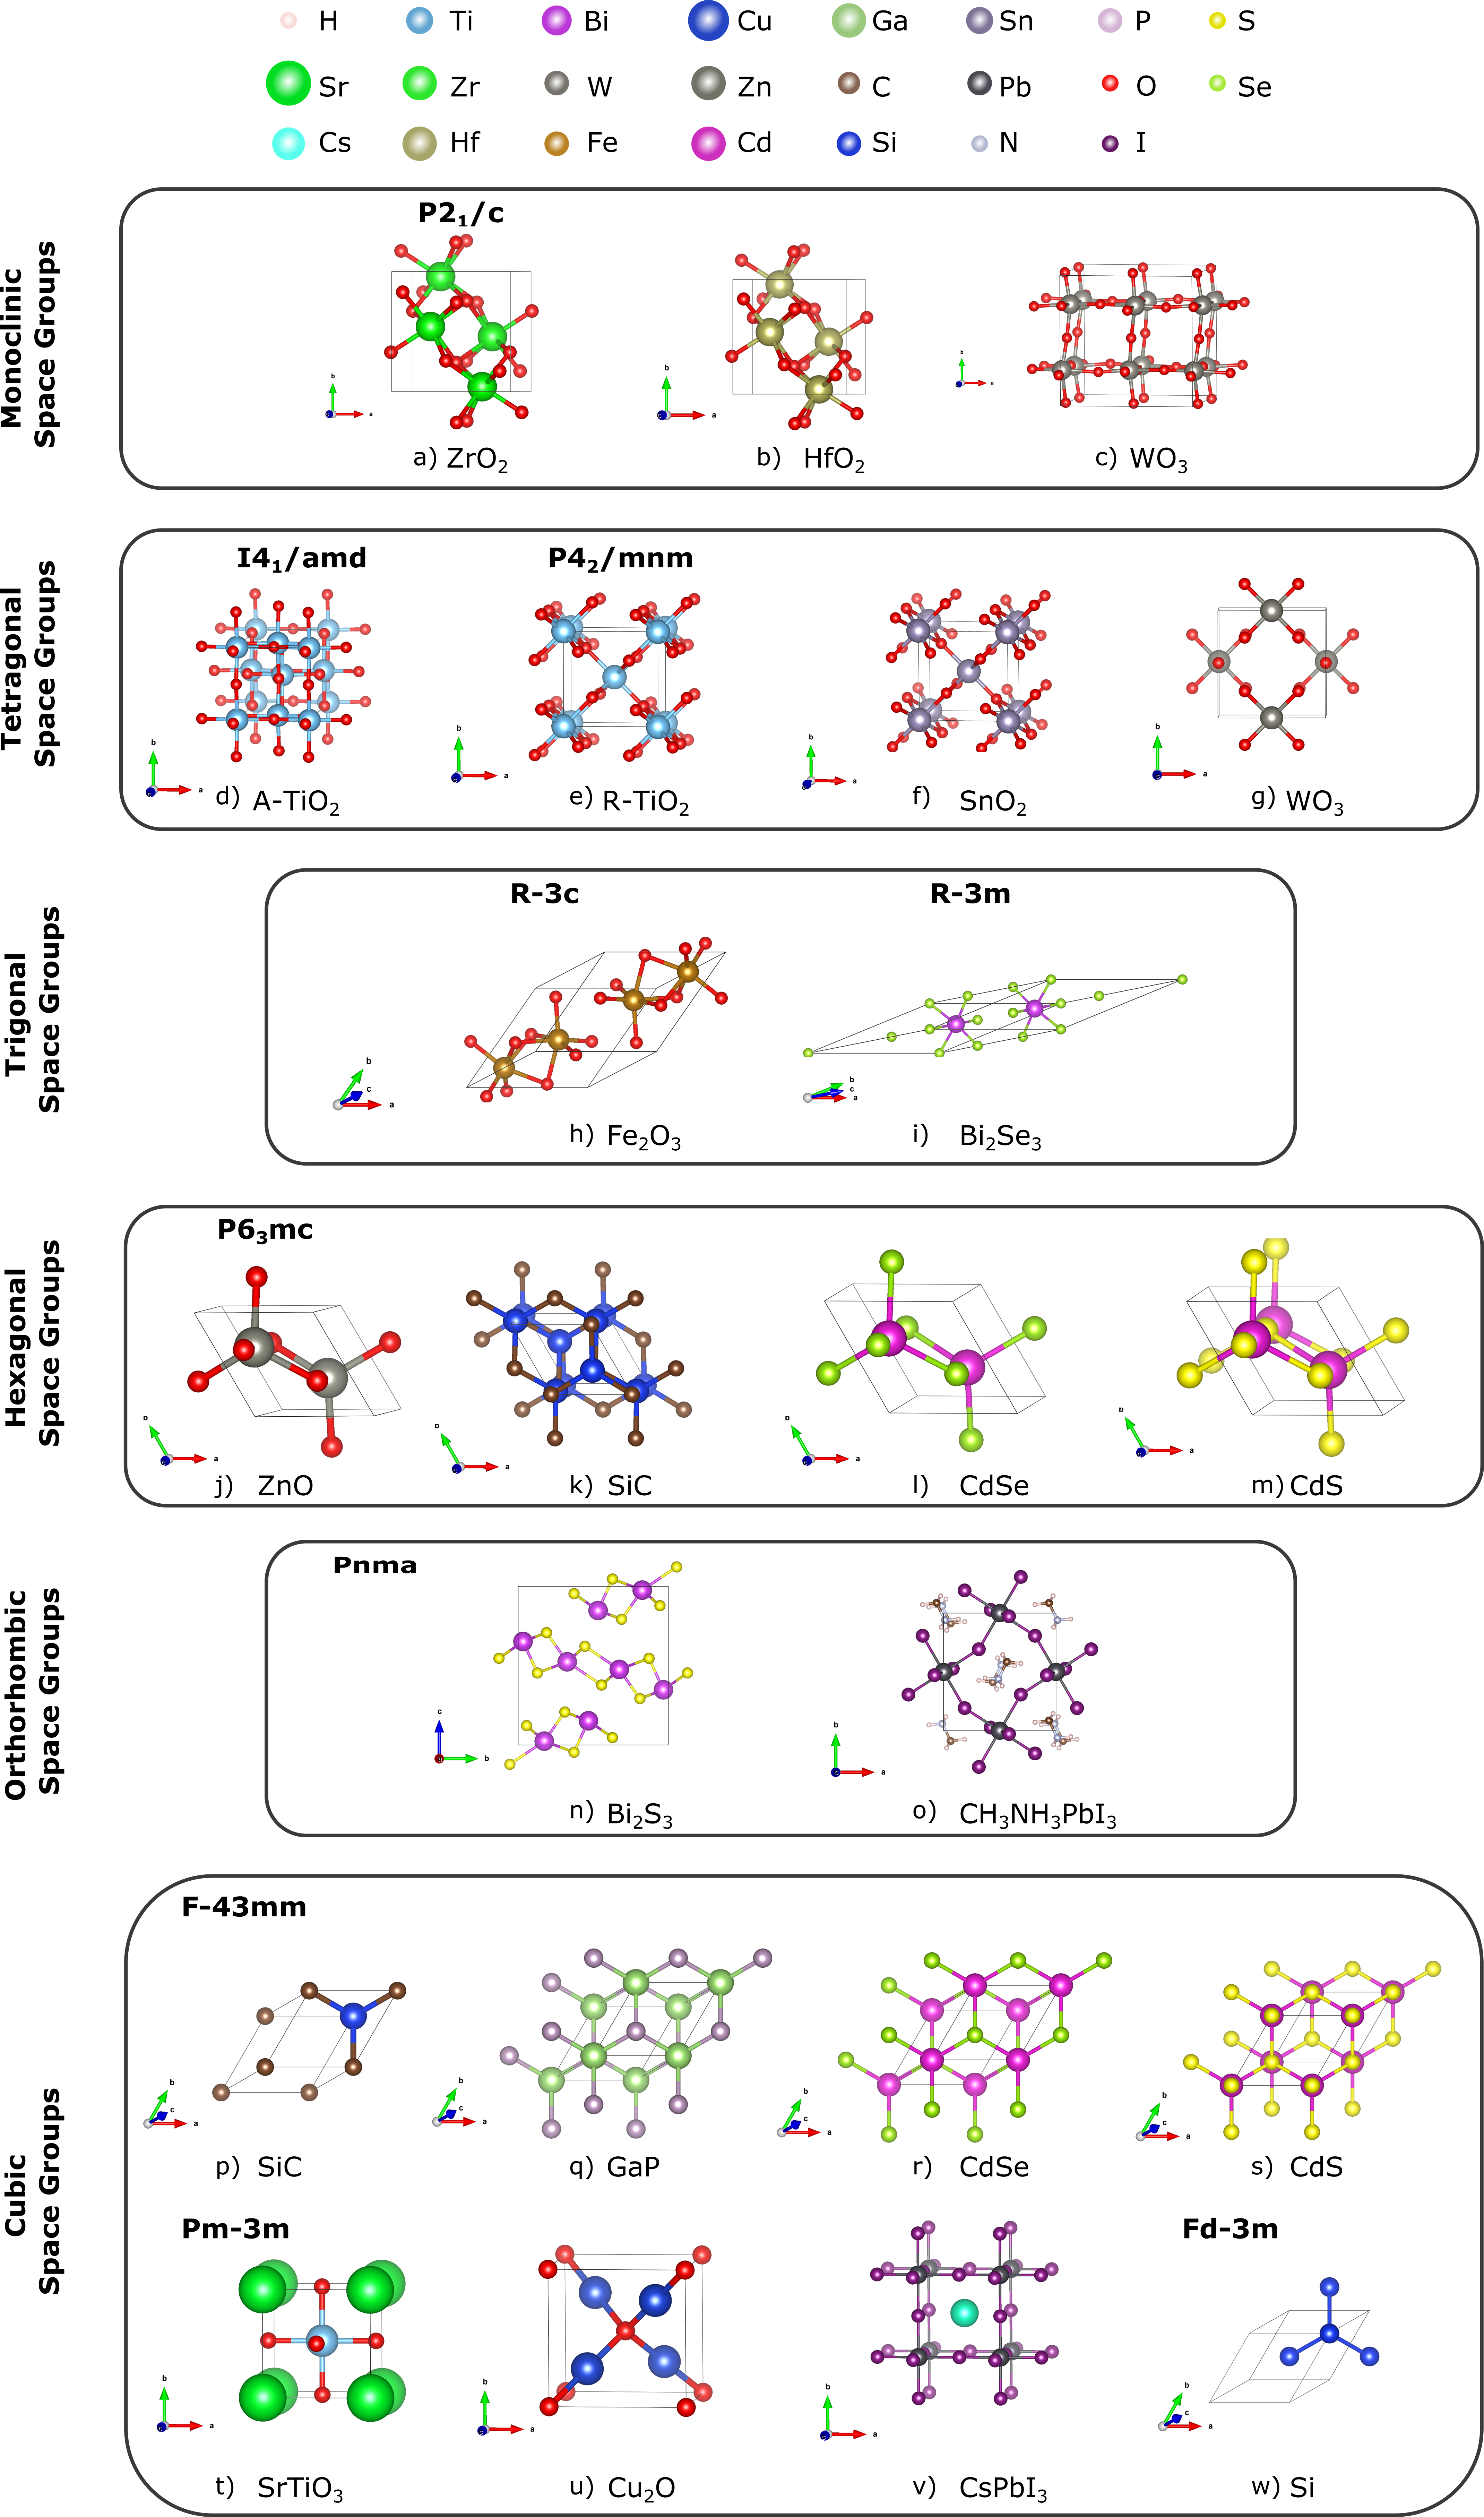
Table S1 report computational parameters (magnetic order, pseudopotential, k-point mesh, fraction of exact exchange and energy range for transitions), while Fig. S1 shows the unit cells used for the various materials.
| Space group Type | Material | Space group | Magnetism | Pseudop | K-points | HF% | E (eV) |
|---|---|---|---|---|---|---|---|
| \ceZrO2 | NM | Zr; O | 4x4x4 | 25.0 | 0.8 | ||
| \ceHfO2 | NM | Hf; O | 4x4x4 | 25.0 | 0.75 | ||
| Monoclinic | \ceWO3 | NM | W; O | 4x4x4 | 25.0 | 0.75 | |
| \ceTiO2-A | NM | Ti; O | 6x6x4 | 25.0 | 0.8 | ||
| \ceTiO2-R | NM | Ti; O | 4x4x6 | 25.0 | 0.8 | ||
| \ceSnO2 | NM | Sn; O | 6x6x8 | 32.0Yang et al. (2016) | 1.0 | ||
| Tetragonal | \ce\ceWO3 | NM | W; O | 6x6x8 | 25.0 | 0.8 | |
| \ceFe2O3 | AFM (+ – – +) | Fe; O | 6x6x6 | 15.0Zhou, Shi, and Guo (2016) | 0.5 | ||
| Trigonal | \ceBi2Se3 | NM | Bi; Se | 4x4x4 | 25.0 | 1.0 | |
| ZnO | NM | Zn;O | 8x8x4 | 37.5Bashyal et al. (2018) | 1.5 | ||
| SiC | NM | Si; C | 8x8x2 | 25.0 | 2.00 | ||
| CdS | NM | Cd; S | 6x6x4 | 25.0 | 1.5 | ||
| Hexagonal | CdSe | NM | Cd; Se | 6x6x4 | 25.0 | 1.5 | |
| \ceBi2S3 | NM | Bi; Se | 6x2x2 | 25.0 | 0.8 | ||
| Orthorhombic | \ceCH3NH3PbI3 | NM | C; H; N;Ob;I | 4x4x2 | 25.0 | 0.8 | |
| Si | NM | Si | 8x8x8 | 25.0 | 2.5 | ||
| GaP | NM | Ga; P | 6x6x6 | 25.0 | 1.5 | ||
| CdS | NM | Cd; S | 6x6x6 | 25.0 | 1.5 | ||
| CdSe | NM | Cd; S | 6x6x6 | 25.0 | 2.5 | ||
| SiC | NM | Si; C | 8x8x8 | 25.0 | 4.0 | ||
| \ceCu2O | NM | Cu; O | 6x6x6 | 25.0 | 0.8 | ||
| \ce\ceSrTiO3 | NM | Sr; Ti;O | 8x8x8 | 25.0 | 0.8 | ||
| Cubic | \ceCsPbI3 | NM | Cs; Pb; I | 4x4x4 | 25.0 | 0.8 |
S2 Structural and Electronic Properties of the Photocatalysts
Table S2 shows the comparison of the experimental lattice parameters with the ones computed using the setup reported in Table S1 for the selected photocatalysts. Results are in excellent agreement with experiments, the maximum relative error being lower than 3% and with a mean absolute error (MAE) of 0.07 Å, close to the one of 0.04 Å reported in Ref Heyd et al., 2005, where the performance of the HSE functional has been assessed using a set of 40 simple and binary semiconductors.
Hybrid functionals are often used to accurately describe the electronic properties of semiconductors, because they incorporate a fraction of exact Fock exchange into standard DFT functionals, allowing to correct for self-interaction errors. However, their application is still quite expensive, especially for large cells and when plane-wave pseudopotentials are used as basis set. Table S3 suggests a very good agreement between the computed and experimental bandgaps with a mean absolute error of 0.17 eV, in good agreement with the MAE of 0.26 eV reported in Ref Heyd et al., 2005. The largest error are obtained for materials containing heavy elements (Bi, I, or Pb), for which we observed the well-known tendency of HSE to overestimate their bandgap due to spin-orbit coupling effects Savory et al. (2016).
| Material | Space Group | |||||||
|---|---|---|---|---|---|---|---|---|
| \ceZrO2 | 5.151 | 5.151 Howard, Hill, and Reichert (1988) | 5.201 | 5.212 | 5.323 | 5.317 | ||
| \ceHfO2 | 5.095 | 5.115 Adam and Rogers (1959) | 5.146 | 5.172 | 5.267 | 5.294 | ||
| \ceWO3m | 7.643 | 7.31 Loopstra and Boldrini (1966) | 7.449 | 7.540 | 7.775 | 7.690 | ||
| \ceTiO2-A | 3.762 | 3.989 Burdett et al. (1987) | 3.762 | 3.989 | 9.603 | 9.522 | ||
| \ceTiO2-R | 4.581 | 4.593 Burdett et al. (1987) | 4.581 | 4.593 | 2.946 | 2.958 | ||
| \ceWO3t | 5.238 | 5.25 Kehl, Hay, and Wahl (1952) | 5.238 | 5.250 | 3.917 | 3.92 | ||
| \ceSnO2 | 4.742 | 4.737 Baur (1956) | 4.742 | 4.737 | 3.181 | 3.186 | ||
| \ceFe2O3 | 5.035 | 5.035 Cornell and Schwertmann (2003) | 5.035 | 5.035 | 13.818 | 13.740 | ||
| \ceBi2Se3 | 4.139 | 4.134 Nakajima (1963) | 4.139 | 4.134 | 31.124 | 28.634 | ||
| ZnO | 3.248 | 3.2427 Sabine and Hogg (1969) | 3.248 | 3.2427 | 5.202 | 5.194 | ||
| SiCh | 3.071 | 3.067 Bauer et al. (2001) | 3.071 | 3.067 | 10.051 | 10.032 | ||
| CdSeh | 4.353 | 4.30 Madelung (2004) | 4.353 | 4.300 | 7.095 | 7.011 | ||
| CdSh | 4.176 | 4.142 Dalvand, Mohammadi, and Fray (2011) | 4.176 | 4.142 | 6.7849 | 6.724 | ||
| \ceBi2S3 | 3.974 | 3.981 Sharma et al. (2012) | 11.161 | 11.305 | 11.794 | 11.147 | ||
| MAPIo | 8.648 | 8.560 Baikie et al. (2013) | 9.051 | 8.840 | 12.953 | 12.580 | ||
| SiCz | 4.347 | 4.358 Madelung (2004) | 4.347 | 4.358 | 4.347 | 4.358 | ||
| GaP | 5.458 | 5.451 Madelung (2004) | 5.458 | 5.451 | 5.458 | 5.451 | ||
| CdSez | 6.151 | 6.052 Madelung (2004) | 6.151 | 6.052 | 6.151 | 6.052 | ||
| CdSz | 5.895 | 5.818 Madelung (2004) | 5.895 | 5.818 | 5.895 | 5.818 | ||
| STO | 3.898 | 3.900 Cao, Sozontov, and Zegenhagen (2000) | 3.898 | 3.900 | 3.898 | 3.900 | ||
| \ceCu2O | 4.288 | 4.270 Werner and Hochheimer (1982) | 4.288 | 4.270 | 4.288 | 4.270 | ||
| \ceCsPbI3c | 6.360 | 6.289 Trots and Myagkota (2008) | 6.360 | 6.2894 | 6.360 | 6.2894 | ||
| Si | 5.433 | 5.430 Madelung (2004) | 5.433 | 5.430 | 5.433 | 5.430 |
| Material | Space Group | Eg | E |
|---|---|---|---|
| \ceZrO2 | 5.31 | 5.30 Dash et al. (2004) | |
| \ceHfO2 | 5.71 | 5.90 Ni et al. (2008) | |
| \ceWO3m | 2.63 | 2.6-3.00 Koffyberg, Dwight, and Wold (1979); Hodes, Cahen, and Manassen (1976); Quarto, Paola, and Sunseri (1981) | |
| \ceTiO2-A | 3.76 | 3.20 Tang et al. (1993) | |
| \ceTiO2-R | 3.48 | 3.03 Tang et al. (1995) | |
| \ceWO3t | 3.44 | 1.80 Iwai (1960) | |
| \ceSnO2 | 3.57 | 3.60 Cho et al. (2002) | |
| \ceFe2O3 | 2.15 | 2.20 Mochizuki (1977) | |
| \ceBi2Se3 | 1.24 | 0.56 Sharma et al. (2012) | |
| ZnO | 3.45 | 3.20 Reynolds et al. (1999) | |
| SiCh | 3.17 | 3.33 Kaplan, Bermudez, and Harris (1995) | |
| CdSeh | 1.54 | 1.83 Madelung (2004) | |
| CdSh | 2.19 | 2.40 Maity and Chattopadhyay (2006) | |
| \ceBi2S3 | 2.53 | 1.36 Sharma et al. (2012) | |
| MAPIo | 2.43 | 1.51 Baikie et al. (2013) | |
| SiCz | 2.25 | 2.45 Madelung (2004) | |
| GaP | 2.45 | 2.32 Madelung (2004) | |
| CdSez | 1.48 | 1.90 Madelung (2004) | |
| CdSz | 2.11 | 2.55 Madelung (2004) | |
| STO | 3.34 | 3.25 van Benthem, Elsässer, and French (2001) | |
| \ceCu2O | 2.00 | 2.00 Lide (2007) | |
| \ceCsPbI3c | 1.95 | 1.78 Sutton et al. (2018) | |
| Si | 1.27 | 1.17 Madelung (2004) |
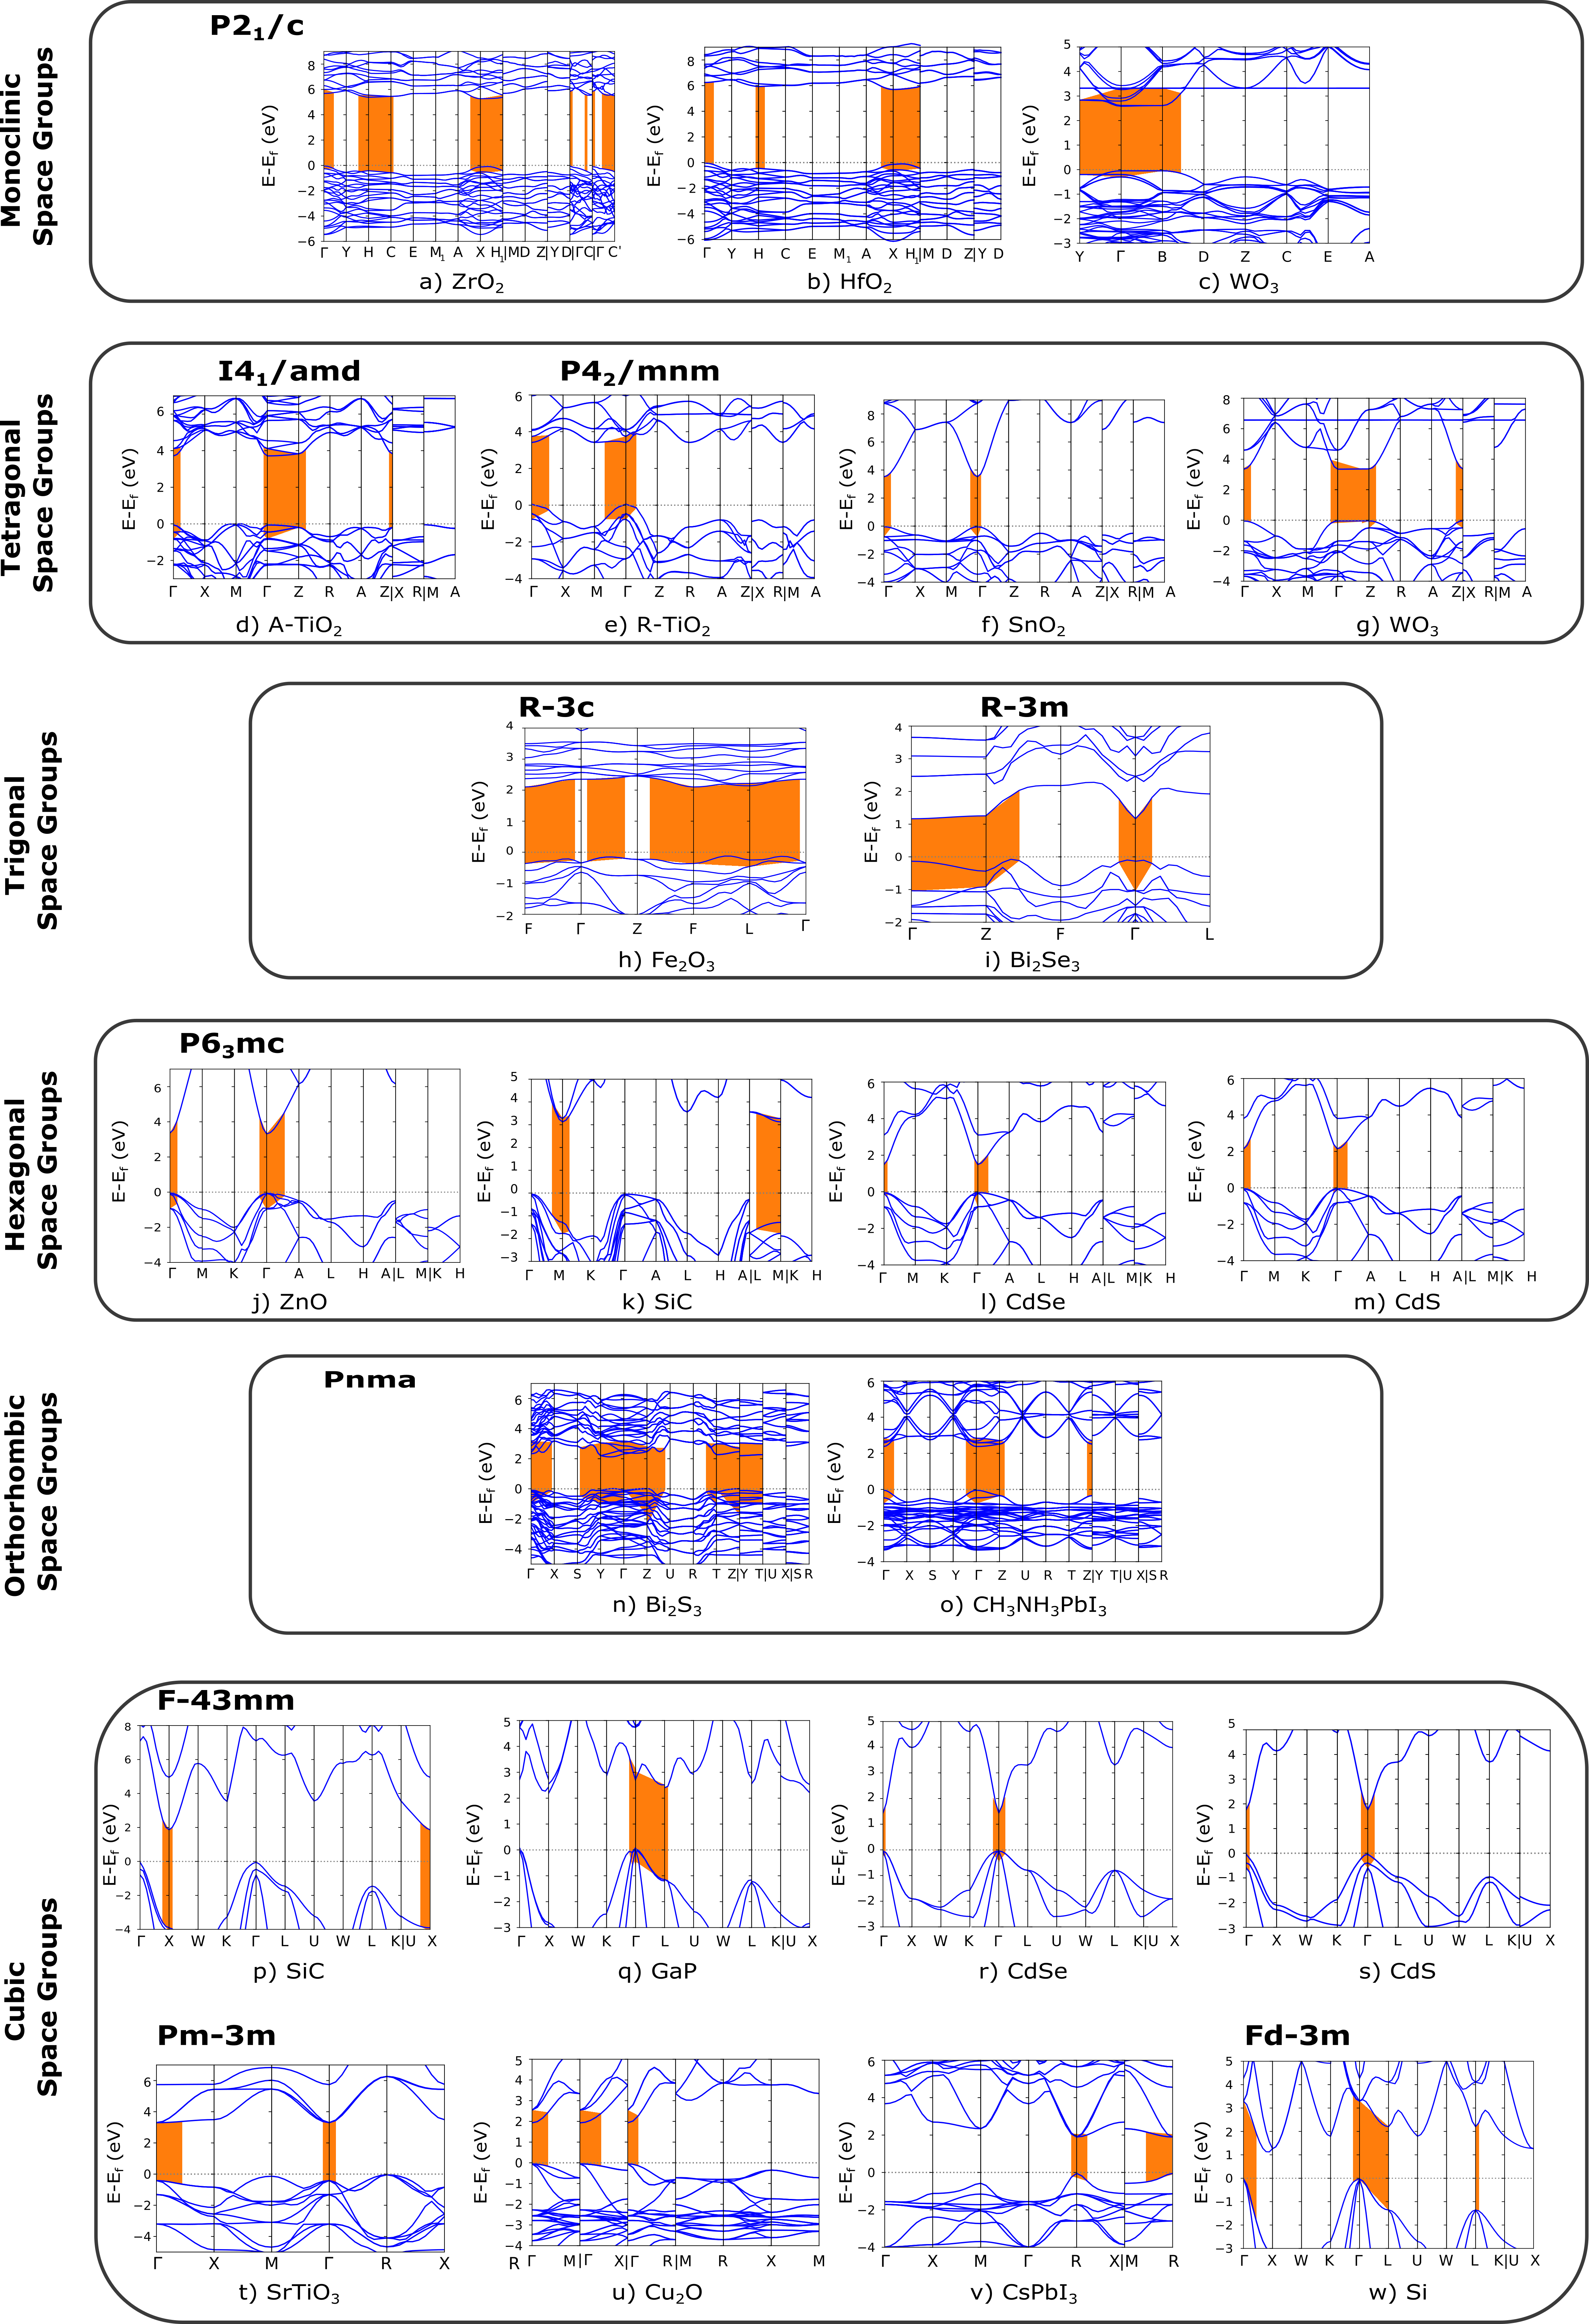
S3 Band structures
S4 High-symmetry k-points
| Material | Space Group | K-point | |||
|---|---|---|---|---|---|
| \ceZrO2 | 0.00 | 0.00 | 0.00 | ||
| \ceHfO2 | Y | 0.00 | 0.00 | 0.50 | |
| H | -0.43 | 0.00 | 0.57 | ||
| C | -0.50 | 0.00 | 0.50 | ||
| E | -0.50 | 0.50 | 0.50 | ||
| M1 | -0.57 | 0.50 | 0.43 | ||
| A | -0.50 | 0.50 | 0.00 | ||
| X | -0.50 | 0.00 | 0.00 | ||
| H1 | -0.50 | 0.00 | 0.44 | ||
| M | -0.43 | 0.50 | 0.57 | ||
| D | 0.00 | 0.50 | 0.50 | ||
| Z | 0.00 | 0.50 | 0.00 | ||
| \ceWO3 | 0.00 | 0.00 | 0.00 | ||
| Y | 0.50 | 0.00 | 0.00 | ||
| B | 0.00 | 0.00 | 0.50 | ||
| D | 0.00 | 0.50 | 0.50 | ||
| Z | 0.00 | 0.50 | 0.00 | ||
| C | 0.50 | 0.50 | 0.00 | ||
| E | -0.50 | 0.50 | 0.50 | ||
| A | -0.50 | 0.00 | 0.50 |
| Material | Space Group | K-point | |||
|---|---|---|---|---|---|
| \ceTiO2 | 0.00 | 0.00 | 0.00 | ||
| X | 0.00 | 0.50 | 0.00 | ||
| M | 0.50 | 0.50 | 0.00 | ||
| Z | 0.00 | 0.00 | 0.50 | ||
| R | 0.00 | 0.50 | 0.50 | ||
| A | 0.50 | 0.50 | 0.50 | ||
| \ceTiO2 | 0.00 | 0.00 | 0.00 | ||
| \ceSnO2 | X | 0.00 | 0.50 | 0.00 | |
| \ceWO3 | M | 0.50 | 0.50 | 0.00 | |
| Z | 0.00 | 0.00 | 0.50 | ||
| R | 0.00 | 0.50 | 0.50 | ||
| A | 0.50 | 0.50 | 0.50 |
| Material | Space Group | K-point | |||
|---|---|---|---|---|---|
| \ceFe2O3 | 0.00 | 0.00 | 0.00 | ||
| L | 0.50 | 0.00 | 0.00 | ||
| Z | 0.50 | 0.50 | 0.50 | ||
| F | 0.50 | 0.50 | 0.00 | ||
| \ceBi2Se3 | 0.00 | 0.00 | 0.00 | ||
| L | 0.50 | 0.00 | 0.00 | ||
| Z | 0.50 | 0.50 | 0.50 | ||
| F | 0.50 | 0.50 | 0.00 |
| Material | Space Group | K-point | |||
|---|---|---|---|---|---|
| \ceZnO | 0.00 | 0.00 | 0.00 | ||
| \ceSiC | M | 0.50 | 0.00 | 0.00 | |
| \ceCdS | K | 0.33 | 0.33 | 0.00 | |
| \ceCdSe | A | 0.00 | 0.00 | 0.50 | |
| L | 0.50 | 0.00 | 0.50 | ||
| H | 0.33 | 0.33 | 0.50 |
| Material | Space Group | K-point | |||
|---|---|---|---|---|---|
| \ceSi | 0.00 | 0.00 | 0.00 | ||
| X | 0.50 | 0.00 | 0.50 | ||
| W | 0.50 | 0.25 | 0.75 | ||
| K | 0.375 | 0.375 | 0.75 | ||
| L | 0.50 | 0.50 | 0.50 | ||
| U | 0.625 | 0.25 | 0.625 | ||
| \ceGaP | 0.00 | 0.00 | 0.00 | ||
| \ceCdS | X | 0.50 | 0.00 | 0.50 | |
| \ceCdSe | W | 0.50 | 0.25 | 0.75 | |
| \ceSiC | K | 0.375 | 0.375 | 0.75 | |
| L | 0.50 | 0.50 | 0.50 | ||
| U | 0.625 | 0.25 | 0.625 | ||
| \ceCu2O | 0.00 | 0.00 | 0.00 | ||
| \ceSrTiO3 | X | 0.00 | 0.50 | 0.00 | |
| \ceCsPbI3 | M | 0.50 | 0.50 | 0.00 | |
| R | 0.50 | 0.50 | 0.50 |
| Material | Space Group | K-point | |||
|---|---|---|---|---|---|
| \ceBi2S3 | 0.00 | 0.00 | 0.00 | ||
| \ceCH3NH3PbI3 | X | 0.50 | 0.00 | 0.00 | |
| S | 0.50 | 0.50 | 0.00 | ||
| Y | 0.00 | 0.50 | 0.00 | ||
| Z | 0.00 | 0.00 | 0.50 | ||
| U | 0.50 | 0.00 | 0.50 | ||
| R | 0.50 | 0.50 | 0.50 | ||
| T | 0.00 | 0.50 | 0.50 |
References
- Fujishima and Honda (1972) A. Fujishima and K. Honda, “Electrochemical Photolysis of Water at a Semiconductor Electrode,” Nature 238, 37–38 (1972).
- Xie et al. (2016) S. Xie, Q. Zhang, G. Liu, and Y. Wang, “Photocatalytic and Photoelectrocatalytic Reduction of \ceCO2 using Heterogeneous Catalysts with Controlled Nanostructures,” Chem. Commun. 52, 35–59 (2016).
- Li, Yu, and Jaroniec (2016) X. Li, J. Yu, and M. Jaroniec, “Hierarchical Photocatalysts,” Chem. Soc. Rev. 45, 2603–2636 (2016).
- Tee et al. (2017) S. Y. Tee, K. Y. Win, W. S. Teo, L.-D. Koh, S. Liu, C. P. Teng, and M.-Y. Han, “Recent Progress in Energy-Driven Water Splitting,” Advanced Science 4, 1600337 (2017).
- San Martín, Rivero, and Ortiz (2020) S. San Martín, M. J. Rivero, and I. Ortiz, “Unravelling the Mechanisms that Drive the Performance of Photocatalytic Hydrogen Production,” Catalysts 10, 901 (2020).
- Lowekamp et al. (1998) J. B. Lowekamp, G. S. Rohrer, P. A. Morris Hotsenpiller, J. D. Bolt, and W. E. Farneth, “Anisotropic Photochemical Reactivity of Bulk \ceTiO2 Crystals,” The Journal of Physical Chemistry B 102, 7323–7327 (1998).
- Giocondi and Rohrer (2001) J. L. Giocondi and G. S. Rohrer, “Spatial Separation of Photochemical Oxidation and Reduction Reactions on the Surface of Ferroelectric \ceBaTiO3,” The Journal of Physical Chemistry B 105, 8275–8277 (2001).
- Ohno, Sarukawa, and Matsumura (2002) T. Ohno, K. Sarukawa, and M. Matsumura, “Crystal Faces of Rutile and Anatase \ceTiO2 Particles and Their Roles in Photocatalytic Reactions,” New J. Chem. 26, 1167–1170 (2002).
- Taguchi et al. (2003) T. Taguchi, Y. Saito, K. Sarukawa, T. Ohno, and M. Matsumura, “Formation of New Crystal Faces on \ceTiO2 Particles by Treatment with Aqueous HF solution or hot sulfuric acid,” New J. Chem. 27, 1304–1306 (2003).
- Giocondi, Salvador, and Rohrer (2007) J. L. Giocondi, P. A. Salvador, and G. S. Rohrer, “The Origin of Photochemical Anisotropy in \ceSrTiO3,” Topics in Catalysis 44, 529–533 (2007).
- Corà et al. (2004) F. Corà, M. Alfredsson, G. Mallia, D. S. Middlemiss, W. C. Mackrodt, R. Dovesi, and R. Orlando, “The Performance of Hybrid Density Functionals in Solid State Chemistry,” in Principles and Applications of Density Functional Theory in Inorganic Chemistry II (Springer Berlin Heidelberg, Berlin, Heidelberg, 2004) pp. 171–232.
- Brothers et al. (2008) E. N. Brothers, A. F. Izmaylov, J. O. Normand, V. Barone, and G. E. Scuseria, “Accurate Solid-State Band Gaps via Screened Hybrid Electronic Structure Calculations,” The Journal of Chemical Physics 129, 011102 (2008).
- Henderson, Paier, and Scuseria (2011) T. M. Henderson, J. Paier, and G. E. Scuseria, “Accurate Treatment of Solids with the HSE Screened Hybrid,” Physica Status Solidi (b) 248, 767–774 (2011).
- Gajdoš et al. (2006a) M. Gajdoš, K. Hummer, G. Kresse, J. Furthmüller, and F. Bechstedt, “Linear Optical Properties in the Projector-Augmented Wave Methodology,” Phys. Rev. B 73, 045112 (2006a).
- Wang et al. (2019) J. Wang, H. Chen, S.-H. Wei, and W.-J. Yin, “Materials Design of Solar Cell Absorbers Beyond Perovskites and Conventional Semiconductors via Combining Tetrahedral and Octahedral Coordination,” Advanced Materials 31, 1806593 (2019).
- Nishiwaki and Fujiwara (2020) M. Nishiwaki and H. Fujiwara, “Highly Accurate Prediction of Material Optical Properties Based on Density Functional Theory,” Computational Materials Science 172, 109315 (2020).
- Dresselhaus et al. (2001) M. Dresselhaus et al., “Solid State Physics Part II : Optical Properties of Solids,” Lecture Notes (Massachusetts Institute of Technology, Cambridge, MA) 17, 15–16 (2001).
- Kresse and Hafner (1993) G. Kresse and J. Hafner, “Ab Initio Molecular Dynamics for Liquid Metals,” Phys. Rev. B 47, 558–561 (1993).
- Kresse and Hafner (1994) G. Kresse and J. Hafner, “Ab Initio Molecular-Dynamics Simulation of the Liquid-Metal–Amorphous-Semiconductor Transition in Germanium,” Phys. Rev. B 49, 14251–14269 (1994).
- Kresse and Furthmüller (1996a) G. Kresse and J. Furthmüller, “Efficiency of ab-initio Total Energy Calculations for Metals and Semiconductors using a Plane-Wave Basis Set,” Comput. Mater. Sci. 6, 15–50 (1996a).
- Kresse and Furthmüller (1996b) G. Kresse and J. Furthmüller, “Efficient Iterative Schemes for Ab Initio Total-Energy Calculations using a Plane-Wave Basis Set,” Phys. Rev. B 54, 11169–11186 (1996b).
- Heyd, Scuseria, and Ernzerhof (2003) J. Heyd, G. E. Scuseria, and M. Ernzerhof, “Hybrid Functionals Based on a Screened Coulomb Potential,” J. Chem. Phys. 118, 8207–8215 (2003).
- Heyd and Scuseria (2004) J. Heyd and G. E. Scuseria, “Efficient Hybrid Density Functional Calculations in Solids: Assessment of the Heyd–Scuseria–Ernzerhof screened Coulomb Hybrid Functional,” J. Chem. Phys. 121, 1187–1192 (2004).
- Blöchl (1994) P. E. Blöchl, “Projector Augmented-Wave Method,” Phys. Rev. B 50, 17953–17979 (1994).
- Kresse and Joubert (1999) G. Kresse and D. Joubert, “From Ultrasoft Pseudopotentials to the Projector Augmented-Wave Method,” Phys. Rev. B 59, 1758–1775 (1999).
- Gajdoš et al. (2006b) M. Gajdoš, K. Hummer, G. Kresse, J. Furthmüller, and F. Bechstedt, “Linear Optical Properties in the Projector-Augmented Wave Methodology,” Phys. Rev. B 73, 045112 (2006b).
- Ong et al. (2013) S. P. Ong, W. D. Richards, A. Jain, G. Hautier, M. Kocher, S. Cholia, D. Gunter, V. L. Chevrier, K. A. Persson, and G. Ceder, “Python Materials Genomics (pymatgen): A Robust, Open-Source python Library for Materials Analysis,” Computational Materials Science 68, 314–319 (2013).
- Wang et al. (2021) V. Wang, N. Xu, J.-C. Liu, G. Tang, and W.-T. Geng, “VASPKIT: A User-friendly Interface Facilitating High-throughput Computing and Analysis using VASP Code,” Computer Physics Communications 267, 108033 (2021).
- Günnemann et al. (2019) C. Günnemann, C. Haisch, M. Fleisch, J. Schneider, A. V. Emeline, and D. W. Bahnemann, “Insights into Different Photocatalytic Oxidation Activities of Anatase, Brookite, and Rutile Single-Crystal Facets,” ACS Catalysis 9, 1001–1012 (2019).
- Ahmed et al. (2011) A. Y. Ahmed, T. A. Kandiel, T. Oekermann, and D. Bahnemann, “Photocatalytic Activities of Different Well-defined Single Crystal \ceTiO2 Surfaces: Anatase versus Rutile,” The Journal of Physical Chemistry Letters 2, 2461–2465 (2011).
- Luttrell et al. (2014) T. Luttrell, S. Halpegamage, J. Tao, A. Kramer, E. Sutter, and M. Batzill, “Why is Anatase a Better Photocatalyst than Rutile?-Model Studies on Epitaxial \ceTiO2 Films,” Scientific reports 4, 1–8 (2014).
- Quah, Wilson, and Idriss (2010) E. L. Quah, J. N. Wilson, and H. Idriss, “Photoreaction of the Rutile \ceTiO2(011) Single-Crystal Surface: Reaction with Acetic Acid,” Langmuir 26, 6411–6417 (2010).
- Tan et al. (2016) H. L. Tan, X. Wen, R. Amal, and Y. H. Ng, “\ceBiVO4 010 and 110 Relative Exposure Extent: Governing Factor of Surface Charge Population and Photocatalytic Activity,” The Journal of Physical Chemistry Letters 7, 1400–1405 (2016).
- Su et al. (2017) Y. Su, H. Li, H. Ma, J. Robertson, and A. Nathan, “Controlling Surface Termination and Facet Orientation in \ceCu2O Nanoparticles for High Photocatalytic Activity: A combined Experimental and Density Functional Theory Study,” ACS Applied Materials & Interfaces 9, 8100–8106 (2017).
- Chang et al. (2014a) S. H. Chang, N. Danilovic, K.-C. Chang, R. Subbaraman, A. P. Paulikas, D. D. Fong, M. J. Highland, P. M. Baldo, V. R. Stamenkovic, J. W. Freeland, J. A. Eastman, and N. M. Markovic, “Functional Links between Stability and Reactivity of Strontium Ruthenate Single Crystals during Oxygen Evolution,” Nature Communications 5, 4191 (2014a).
- Chang et al. (2014b) S. H. Chang, J. G. Connell, N. Danilovic, R. Subbaraman, K.-C. Chang, V. R. Stamenkovic, and N. M. Markovic, “Activity–Stability Relationship in the Surface Electrochemistry of the Oxygen Evolution Reaction,” Faraday Discuss. 176, 125–133 (2014b).
- Danilovic et al. (2014) N. Danilovic, R. Subbaraman, K.-C. Chang, S. H. Chang, Y. J. Kang, J. Snyder, A. P. Paulikas, D. Strmcnik, Y.-T. Kim, D. Myers, V. R. Stamenkovic, and N. M. Markovic, “Activity–Stability Trends for the Oxygen Evolution Reaction on Monometallic Oxides in Acidic Environments,” The Journal of Physical Chemistry Letters 5, 2474–2478 (2014).
- Roy et al. (2018) C. Roy, R. R. Rao, K. A. Stoerzinger, J. Hwang, J. Rossmeisl, I. Chorkendorff, Y. Shao-Horn, and I. E. L. Stephens, “Trends in Activity and Dissolution on \ceRuO2 under Oxygen Evolution Conditions: Particles versus Well-Defined Extended Surfaces,” ACS Energy Letters 3, 2045–2051 (2018).
- Sandratskii, Uhl, and Kübler (1996) L. M. Sandratskii, M. Uhl, and J. Kübler, “Band Theory for Electronic and Magnetic Properties of -\ceFe2O3,” Journal of Physics: Condensed Matter 8, 983–989 (1996).
- Yang et al. (2016) C. Yang, J.-F. Chen, X. Zeng, D. Cheng, H. Huang, and D. Cao, “Enhanced Near-infrared Shielding Ability of (Li,K)-codoped \ceWO3 for Smart Windows: DFT Prediction Validated by Experiment,” Nanotechnology 27, 075203 (2016).
- Zhou, Shi, and Guo (2016) Z. Zhou, J. Shi, and L. Guo, “A Comparative Study on Structural and Electronic Properties and Formation Energy of Bulk -\ceFe2O3 using First-Principles Calculations with Different density Functionals,” Computational Materials Science 113, 117–122 (2016).
- Bashyal et al. (2018) K. Bashyal, C. K. Pyles, S. Afroosheh, A. Lamichhane, and A. T. Zayak, “Empirical Optimization of DFT+U and HSE for the band structure of \ceZnO,” Journal of Physics: Condensed Matter 30, 065501 (2018).
- Heyd et al. (2005) J. Heyd, J. E. Peralta, G. E. Scuseria, and R. L. Martin, “Energy Band Gaps and Lattice Parameters Evaluated with the Heyd-Scuseria-Ernzerhof Screened Hybrid Functional,” The Journal of Chemical Physics 123, 174101 (2005).
- Savory et al. (2016) C. N. Savory, R. G. Palgrave, H. Bronstein, and D. O. Scanlon, “Spatial Electron-Hole Separation in a One Dimensional Hybrid Organic–Inorganic Lead Iodide,” Scientific Reports 6, 1–7 (2016).
- Howard, Hill, and Reichert (1988) C. J. Howard, R. J. Hill, and B. E. Reichert, “Structures of \ceZrO2 Polymorphs at Room Temperature by High-Resolution Neutron Powder Diffraction,” Acta Crystallographica Section B 44, 116–120 (1988).
- Adam and Rogers (1959) J. Adam and M. D. Rogers, “The Crystal Structure of \ceZrO2 and \ceHfO2,” Acta Crystallographica 12, 951 (1959).
- Loopstra and Boldrini (1966) B. O. Loopstra and P. Boldrini, “Neutron Diffraction Investigation of \ceWO3,” Acta Crystallographica 21, 158–162 (1966).
- Burdett et al. (1987) J. K. Burdett, T. Hughbanks, G. J. Miller, J. W. Richardson, and J. V. Smith, “Structural-Electronic Relationships in Inorganic Solids: Powder Neutron Diffraction Studies of the Rutile and Anatase Polymorphs of Titanium Dioxide at 15 and 295 K,” Journal of the American Chemical Society 109, 3639–3646 (1987).
- Kehl, Hay, and Wahl (1952) W. L. Kehl, R. G. Hay, and D. Wahl, “The Structure of Tetragonal Tungsten Trioxide,” Journal of Applied Physics 23, 212–215 (1952).
- Baur (1956) W. H. Baur, “Über die Verfeinerung der Kristallstrukturbestimmung einiger Vertreter des Rutiltyps: \ceTiO2, \ceSO2, \ceGeO2 und \ceMgF2,” Acta Crystallographica 9, 515–520 (1956).
- Cornell and Schwertmann (2003) R. Cornell and U. Schwertmann, “Colour Plates,” in The Iron Oxides (John Wiley and Sons, Ltd, 2003) pp. xxi–xxxix.
- Nakajima (1963) S. Nakajima, “The Crystal Structure of \ceBi2Te3-xSex,” Journal of Physics and Chemistry of Solids 24, 479–485 (1963).
- Sabine and Hogg (1969) T. M. Sabine and S. Hogg, “The Wurtzite Z Parameter for Beryllium Oxide and Zinc Oxide,” Acta Crystallographica Section B 25, 2254–2256 (1969).
- Bauer et al. (2001) A. Bauer, P. Reischauer, J. Kräusslich, N. Schell, W. Matz, and K. Goetz, “Structure Refinement of the Silicon Carbide Polytypes 4ıt H and 6ıt H: Unambiguous Determination of the Refinement Parameters,” Acta Crystallographica Section A 57, 60–67 (2001).
- Madelung (2004) O. Madelung, Semiconductors: Data Handbook (Springer Science & Business Media, 2004).
- Dalvand, Mohammadi, and Fray (2011) P. Dalvand, M. R. Mohammadi, and D. J. Fray, “One-dimensional Cadmium Sulfide (\ceCdS) Nanostructures by the Solvothermal Process: Controlling Crystal Structure and Morphology Aided by Different Solvents,” Materials Letters 65, 1291–1294 (2011).
- Sharma et al. (2012) Y. Sharma, P. Srivastava, A. Dashora, L. Vadkhiya, M. K. Bhayani, R. Jain, A. R. Jani, and B. L. Ahuja, “Electronic Structure, Optical Properties and Compton Profiles of \ceBi2S3 and \ceBi2Se3,” Solid State Sciences 14, 241–249 (2012).
- Baikie et al. (2013) T. Baikie, Y. Fang, J. M. Kadro, M. Schreyer, F. Wei, S. G. Mhaisalkar, M. Graetzel, and T. J. White, “Synthesis and Crystal Chemistry of the Hybrid Perovskite ((\ceCH3NH3)\cePbI3 for Solid-State Sensitised Solar Cell Applications,” J. Mater. Chem. A 1, 5628–5641 (2013).
- Cao, Sozontov, and Zegenhagen (2000) L. Cao, E. Sozontov, and J. Zegenhagen, “Cubic to Tetragonal Phase Transition of \ceSrTiO3 Under Epitaxial Stress: An X-ray Backscattering Study,” physica status solidi (a) 181, 387–404 (2000).
- Werner and Hochheimer (1982) A. Werner and H. D. Hochheimer, “High-Pressure X-ray Study of \ceCu2O and \ceAg2O,” Phys. Rev. B 25, 5929–5934 (1982).
- Trots and Myagkota (2008) D. M. Trots and S. V. Myagkota, “High-Temperature Structural Evolution of aesium and Rubidium Triiodoplumbates,” Journal of Physics and Chemistry of Solids 69, 2520–2526 (2008).
- Dash et al. (2004) L. K. Dash, N. Vast, P. Baranek, M.-C. Cheynet, and L. Reining, “Electronic Structure and Electron Energy-Loss Spectroscopy of \ceZrO2 Zirconia,” Phys. Rev. B 70, 245116 (2004).
- Ni et al. (2008) J. Ni, Q. Zhou, Z. Li, and Z. Zhang, “Oxygen Defect Induced Photoluminescence of \ceHfO2 Thin Films,” Applied Physics Letters 93, 011905 (2008).
- Koffyberg, Dwight, and Wold (1979) F. P. Koffyberg, K. Dwight, and A. Wold, “Interband Transitions of Semiconducting Oxides Determined from Photoelectrolysis Spectra,” Solid State Communications 30, 433–437 (1979).
- Hodes, Cahen, and Manassen (1976) G. Hodes, D. Cahen, and J. Manassen, “Tungsten Trioxide as a Photoanode for a Photoelectrochemical Cell (PEC),” Nature 260, 312–313 (1976).
- Quarto, Paola, and Sunseri (1981) F. D. Quarto, A. D. Paola, and C. Sunseri, “Semiconducting Properties of Anodic \ceWO3 Amorphous Films,” Electrochimica Acta 26, 1177–1184 (1981).
- Tang et al. (1993) H. Tang, H. Berger, P. E. Schmid, F. Lévy, and G. Burri, “Photoluminescence in \ceTiO2 Anatase Single Crystals,” Solid State Communications 87, 847–850 (1993).
- Tang et al. (1995) H. Tang, F. Lévy, H. Berger, and P. E. Schmid, “Urbach Tail of Anatase \ceTiO2,” Phys. Rev. B 52, 7771–7774 (1995).
- Iwai (1960) T. Iwai, “Temperature Dependence of the Optical Absorption Edge of Tungsten Trioxide Single Crystal,” Journal of the Physical Society of Japan 15, 1596–1600 (1960).
- Cho et al. (2002) Y. M. Cho, W. K. Choo, H. Kim, D. Kim, and Y. Ihm, “Effects of Rapid Thermal Annealing on the Ferromagnetic Properties of Sputtered Zn1-x(Co0.5Fe0.5)xO Thin Films,” Applied Physics Letters 80, 3358–3360 (2002).
- Mochizuki (1977) S. Mochizuki, “Electrical Conductivity of -\ceFe2O3,” physica status solidi (a) 41, 591–594 (1977).
- Reynolds et al. (1999) D. C. Reynolds, D. C. Look, B. Jogai, C. W. Litton, G. Cantwell, and W. C. Harsch, “Valence-Band Ordering in \ceZnO,” Phys. Rev. B 60, 2340–2344 (1999).
- Kaplan, Bermudez, and Harris (1995) R. Kaplan, V. Bermudez, and G. Harris, “Properties of Silicon Carbide,” EMIS Datareview Series INSPEC, London (1995).
- Maity and Chattopadhyay (2006) R. Maity and K. Chattopadhyay, “Synthesis and Optical Characterization of \ceCdS Nanowires by Chemical Process,” Journal of Nanoparticle Research 8, 125–130 (2006).
- van Benthem, Elsässer, and French (2001) K. van Benthem, C. Elsässer, and R. H. French, “Bulk Electronic Structure of \ceSrTiO3: Experiment and Theory,” Journal of Applied Physics 90, 6156–6164 (2001).
- Lide (2007) D. R. Lide, CRC Handbook of Chemistry and Physics 88th ed., edited by D. R. Lide (CRC Press/Taylor & Francis Group: Boca Raton, FL, 2007).
- Sutton et al. (2018) R. J. Sutton, M. R. Filip, A. A. Haghighirad, N. Sakai, B. Wenger, F. Giustino, and H. J. Snaith, “Cubic or Orthorhombic? Revealing the Crystal Structure of Metastable Black-Phase \ceCsPbI3 by Theory and Experiment,” ACS Energy Letters 3, 1787–1794 (2018).