Microfluidic osmotic compression of a charge-stabilized colloidal dispersion:
Equation of state and collective diffusion coefficient
Abstract
We show, using a model coupling mass transport and liquid theory calculations for a charge-stabilized colloidal dispersion, that diffusion significantly limits measurement times of its Equation Of State (EOS), osmotic pressure vs composition, using the osmotic compression technique. Following this result, we present a microfluidic chip allowing one to measure the entire EOS of a charged dispersion at the nanoliter scale in a few hours. We also show that time-resolved analyses of relaxation to equilibrium in this microfluidic experiment lead to direct estimates of the collective diffusion coefficient of the dispersion in Donnan equilibrium with a salt reservoir.
The dynamics of many out-of-equilibrium processes involving colloidal dispersions, such as drying, ultrafiltration, or sedimentation rely primarily on two fundamental inputs: the Equation of State (EOS) osmotic pressure vs colloid concentration , and the collective diffusion coefficient relating the concentration gradient to the colloid flux in Fick’s law [1, 2, 3, 4, 5, 6, 7]. In ultrafiltration for example, the colloid accumulation at the membrane, the so-called concentration polarization, limits the process by the local increase in osmotic pressure, but is limited by collective diffusion that opposes the formation of concentration gradients [8]. These quantities are also central to many fundamental questions, such as the validity of a generalized Stokes-Einstein relation for colloidal dispersions [9, 10, 11]. Beyond dispersions, these quantities, and more particularly the EOS vs , are also fundamental to probe and understand interactions of soft matter systems at colloidal scales (see e.g., Refs. [12, 13, 14]).
For charge-stabilized dispersions, and depend on colloidal interactions [15] and thus on the ion concentration, and they are difficult to measure. The EOS can be estimated by various techniques such as analytical ultracentrifugation, vapor pressure or membrane osmometry [16], but osmotic compression remains the primary technique because it allows one to measure the EOS at fixed and imposed chemical potentials of salts in order to control colloidal interactions. In this experiment [see Fig. 1(a)], a dialysis bag (typical volume mL) filled with a dispersion is immersed in a bath containing salts and polymers that impose an osmotic pressure, . The bag is not permeable to polymers and colloids but allows the exchange of solvent and ions to balance their chemical potentials, the so-called Donnan equilibrium. The colloid concentration in the bag is then measured (often by dry extract) leading to one point of the EOS, vs , for the conditions imposed by the reservoir. For most dispersions, the long equilibration times ( days) prevent rapid measurements of the EOS by osmotic compression and therefore its use in particular in research and development to quickly screen formulations. Moreover, this technique uses relatively large sample volumes, a few milliliters per measurement point, and is therefore unsuitable for the measurement of EOS of samples that are either expensive or available in too small quantities.
Measurements of are even more challenging for charged dispersions. is often estimated from dynamic scattering experiments whose clear interpretation is limited to monodisperse colloids diluted enough to avoid multiple scattering [17, 18, 19, 20, 21, 22]. For less monodisperse and more concentrated colloids, recent works reported estimates of using direct measurements of both concentration gradient and colloid flux in microfluidic experiments [23, 24]. Such experiments, however, do not allow one to control the ionic concentration as for the Donnan equilibrium, so that these measurements remain tricky to extrapolate to other processes. In this work, we first use a model coupling mass transport and liquid theory to highlight the limiting factor that makes osmotic compression so slow for charged dispersions. Following this result, we then develop a microfluidic chip to measure simultaneously the EOS of a charge-stabilized dispersion in a few hours and its collective diffusion coefficient , both in Donnan equilibrium.
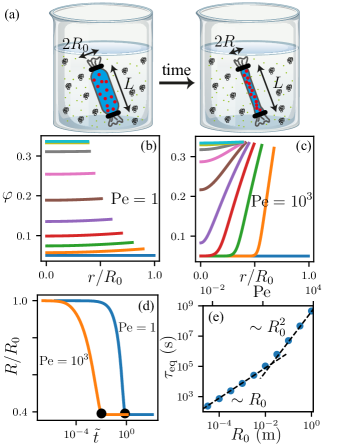
Consider first a cylindrical dialysis bag of radius and fixed length , filled by an aqueous dispersion of spherical colloids of radius carrying unit charges [see Fig. 1(a)]. The concentration of monovalent salt in the bath is assumed to be fixed. The shrinkage rate of the bag is given in this axisymmetrical model by [25]:
| (1) |
where is the permeability of the membrane. As decreases over time, both colloid concentration and osmotic pressure increase and equilibrium is reached for a homogeneous concentration , defined by . Computing the time to reach equilibrium requires solving mass transport within the bag. For this, we first assume that ions are always at equilibrium because of their high diffusivity. For local thermodynamic equilibrium conditions (ignoring, e.g., phase nucleation kinetics), assuming isothermal conditions at room temperature and neglecting advection, the colloid volume fraction follows:
| (2) |
For spherical and monodisperse colloids, is given by [26]:
| (3) |
where is the Stokes-Einstein coefficient ( is the solvent viscosity and is the Boltzmann constant), is the long-time sedimentation hindrance function, and is the osmotic compressibility coefficient defined by:
| (4) |
where , , and is the colloid structure factor. Note that both and are evaluated at fixed reservoir conditions . The boundary condition:
| (5) |
ensures the rejection of the colloids by the membrane. As shown in the Supplemental Material (SM) [27], this model can be made dimensionless defining and , with , and depends on the Péclet number comparing the rate of bag shrinkage to colloid diffusion.
To solve this model, and are evaluated as follows. First, an effective interaction potential between colloids is designed as follows:
| (6) |
where is the Bjerrum length, and and are respectively an effective charge and an effective screening length obtained by the Extrapolated Point Charge (EPC) renormalization method [28]. The Ornstein-Zernike (OZ) equation is then solved for the structure factor with either the Rescaled Mean-Spherical Approximation or the HyperNetted-Chain closure, which yield indistinguishable results for this system. follows from the virial theorem [28]. is estimated using Eq. (3), assuming the long-time can be approximated by its short-time counterpart evaluated using the renormalized density fluctuation expansion of Beenakker and Mazur ( method) [29, 30, 31, 32, 33, 26, 34, 35, 36] taking as sole input the structure factor . Any difference between and would be due to non-pairwise hydrodynamic interactions, negligible at small [18]. As a relevant case, we consider nm, , C, mPas, and mM. The above calculations give –16 with m2/s, and –80 kPa for –0.34 (see Figs. 3 and 4).
Equations (1), (2) and (5) have been solved numerically for an initial concentration , kPa, and various Pe. For , diffusion homogenizes the concentration during the shrinkage of the bag as illustrated in Fig. 1(b). In this regime, owing to mass conservation, and Eq. (1) shows that [see Fig. 1(e)]. For , Fig. 1(c) shows that the concentration close to the membrane quickly tends to defined by . The dynamics is then limited by the relaxation by diffusion of the concentration gradient over the bag, and (see Fig. 1(e) and SM [27]). Figure 1(e) shows that, for a permeability of m/(Pa s) typical of dialysis bags used for osmotic compression, day for cm. These results also show that increasing the permeability does not decrease equilibration times in this regime because the transport is diffusion-limited, and this would only reinforce the importance of the concentration gradient (). Figure 1(e) indicates, however, that reducing the bag size to the microfluidic scale (m) should significantly accelerate osmotic compression.
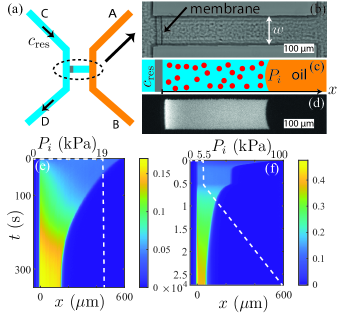
To measure EOSs in short times, we thus developed a microfluidic chip mimicking membrane osmometry at the nanoliter scale to improve mass transport, and with a reservoir to impose a salt chemical potential. First, we made poly(ethylene glycol) diacrylate (PEGDA) chips using a rapid prototyping technique [37] (see SM for details [27]). Figure 2(a) shows their design: two parallel channels (AB and CD) are connected by a transverse channel of height m, width m, and length m. To integrate a nanoporous membrane, we then inject an aqueous formulation containing PEGDA, a photoinitiator, and poly(ethylene glycol) (PEG) and use spatially-resolved photo-polymerization [38] to cross-link a hydrogel at one end of the transverse channel. PEG chains induce a phase separation during polymerization leading to a nanoporous hydrogel [39]. After polymerization, the hydrogel is flushed leading to the nanoporous membrane of width m shown in Fig. 2(b). Such membranes withstand pressure drops up to several bars thanks to the chemical bonds with the acrylate groups of the channel walls, and they reject nanoparticles nm in diameter while being permeable to water and salts [38].
For EOS measurements, we studied dispersions of polystyrene particles stabilized by sulfate charges to avoid charge regulation effects (ThermoFisher, S37200, Lot No. 1677598). According to the manufacturer, nm and from titration. To perform measurements of concentration profiles, this dispersion is seeded with a tiny amount (concentration ratio ) of fluorescent colloids of the same size and the same chemistry (ThermoFisher, F8845, Lot No. 2059222). We checked that the fluorescence intensity varies linearly with the colloid concentration, and that photobleaching is negligible thanks to a shutter limiting the overall exposure.
In a typical experiment, we first impose kPa to ensure a steady flow (L/h) of an aqueous sodium chloride (NaCl) solution at concentration ranging from to 100 mM. Then, we fill channel AB with the dispersion at a volume fraction of . Colloids invade the transverse channel by diffusion and diffusio-phoresis induced by any ion concentration gradient, as shown in a similar geometry [40]. After enough colloids have invaded the transverse channel, we flow an inert oil (AR200, Sigma-Aldrich) in channel AB to trap the colloids upstream of the membrane in the volume nL [see Fig. 2(c)]. In a typical experiment, we impose a fixed pressure at inlets A and B, and acquire fluorescence images [see Fig. 2(d) for a typical image]. The pressure drop across the transverse channel, , ranges from to 100 kPa, and is higher than the capillary pressure drop ( kPa) across the oil/dispersion interface.
Figure 2(e) shows a space-time plot of the concentration profile estimated from the fluorescence images averaged over the width for kPa and mM. The pressure drop compresses the dispersion upstream of the membrane, therefore concentrating the particles. After a transient s, a steady state is reached with the homogeneous concentration . In such experiments, the thermodynamic equilibrium corresponds to the balance between the imposed mechanical pressure and the osmotic pressure of the dispersion, , and thus to one point of the EOS, measured here in a few minutes.
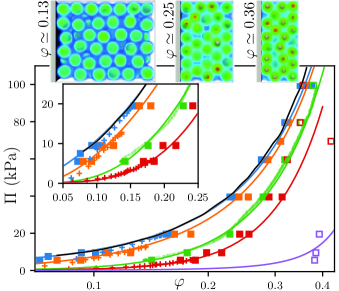
To get the entire EOS, is increased up to 100 kPa by steps of 10 kPa, and the concentration upstream of the membrane is measured when equilibrium is reached. Figure 3 shows such data for different reservoirs conditions. The measurement accuracy allows one to highlight the screening reduction due to a salinity decrease (increase of at fixed for decreasing ), even when approaching the salt-free limit.
After each point acquisition, is set to in order to check the redispersibility of the particles upstream of the membrane (see Fig. 3). The particles aggregate regardless of the imposed pressure for mM, but remain redispersible up to kPa for mM. This point by point acquisition was also compared to a continuous acquisition in which has been slowly increased up to kPa during h after an initial step at kPa. For this experiment at mM, the slow pressure ramp ensures quasi-equilibrium with almost homogeneous concentration [see Fig. 2(f)]. As shown in Fig. 3, the corresponding curve perfectly overlaps the point-by-point acquisition, demonstrating the possibility to determine EOS with an unprecedented resolution.
These experimental EOS have not been compared to measurements made by classical osmotic compression as this would require too large volumes of the commercial dispersion, and would therefore be prohibitively expensive. Instead, they are compared to the theoretical estimates obtained from the solution of the OZ equation with renormalization in Fig. 3. Note that this same theoretical framework has already been successfully used to describe EOS measured by classical osmotic compression for a dispersion very close to the system studied here [41]. For the dispersion considered here, perfect agreement over the full range of and is obtained using the measured bare charge , and a unique colloid radius nm slightly smaller than the value measured by dynamic light scattering, – nm with a polydispersity index PdI–0.2 in line with other measurements on the same dispersion, evidencing also a broad size distribution [42]. We believe this small mismatch is primarily due to polydispersity, while calculations strictly consider monodisperse colloids.
Although there is no universal model or scaling behavior for the osmotic pressure in the range of volume fraction and salt concentration considered here, a few comments on the physics underlying the EOS shown in Fig. 3 are in order. The compressibility factor (with nm) reported in Fig. S2 in the SM [27] is always much larger than unity (typically in the range 10–200) because of the significant electrostatic repulsions at the finite volume fractions studied here. Long-range interactions come into play fairly quickly for all but the highest salt concentration. Therefore, an ”effectively concentrated” regime in which the mean intercolloid distance is less than a few times the interaction range is obtained for greater than a few percents. Under these conditions, colloids are trapped in electrostatic cages, leading to a solidlike (glassy or crystalline) state whose thermodynamic properties are well described by the simple, albeit nonlinear, Poisson-Boltzmann cell model which assumes that the osmotic pressure of the dispersion is dominated by the contribution of ions [43, 44, 45, 46, 47, 41]. This model, used with the same physicochemical parameters as those used for the OZ theory, indeed allows one to describe most of the experimental points quite well (see Fig. S2 in SM [27]). However, the high colloidal surface charge and associated significant ion condensation prevent any analytical scaling law from being obtained. Data points at intermediate salt content and volume fraction which are not well described by the cell model correspond to a liquidlike phase in which colloids interact at a non-vanishing distance (compared to their size). In this regime, the osmotic pressure is dominated by the contribution of direct colloid-colloid interactions and can be estimated from perturbation methods or solutions of the OZ equation (see Ref. [41] for more detailed discussions on the different methods to estimate EOS of charge-stabilized dispersions).
As the use of effective potentials and closures with the OZ equation remains an active research topic especially under concentrated and low salt conditions [15], we also performed particle scale numerical calculations using Brownian dynamics coupled to a three-dimensional nonlinear Poisson-Boltzmann solver providing the many-body electrostatic forces exerted on each colloid (Particle-Field Brownian Dynamics, PFBD, see SM [27]) [48, 49, 47, 50, 51]. This method is more precise as it does not rely on approximate closure relations and does not require the definition of an effective potential. As in the experiments where compression occurs in a single direction, compression is driven along a given axis in the simulation. Because these numerical calculations are long, they have been undertaken only for mM, the most difficult case to capture with the renormalized OZ approach. The close agreement among simulation, theory, and experiments [see Fig. 3] confirms again the robustness of the EPC renormalization used with liquid theories, and also shows that the anisotropy of the compression, as compared to the isotropic case considered with OZ theory, does not play a role in our configuration.
We now exploit the time-resolved concentration profiles during the compression to measure the collective diffusion coefficient . In the framework of the local thermodynamic equilibrium, the imposed pressure drop induces a mean flow in the channel given by:
| (7) |
because the pressure drop due to the viscous forces is negligible. In this one-dimensional model, the colloid volume fraction obeys:
| (8) | |||
| (9) |
with Eq. (9) ensuring the rejection of the colloids by the membrane. Again in this model, and are assumed in Donnan equilibrium with the salt concentration imposed upstream of the membrane.
We first exploited vs measured during the first steps of imposed [see Fig. 2(e)], to estimate the EOS using Eq. (7) and known values of the permeability . is measured from the temporal evolution of the area of the dispersion estimated from the fluorescence images [see Fig. 2(d)]. The data vs measured this way are shown in Fig. 3 with m/(Pa s) in agreement with values measured using the same technique and only water upstream of the membrane (). These out-of-equilibrium data at low are in good agreement with the theoretical EOS at equilibrium thus confirming the hypothesis of local Donnan equilibrium, despite the transmembrane flow.
In a second step, we measured , the amount of colloids trapped upstream of the membrane up to the position . Temporal variations of are related to the colloid flux at position [see Eqs. (8) and (9)] and can thus be used to estimate providing we compute and from the data. The inset of Fig. 4 shows such analysis for various at mM and 10 mM.
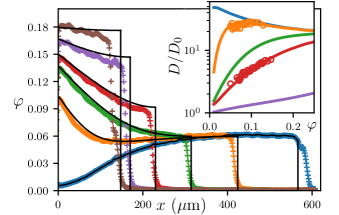
As expected, is significantly larger than the Stokes-Einstein due to the electrostatic repulsion, in particular when the dispersion is in equilibrium with a low salinity reservoir. These data are compared in the inset of Fig. 4 to the theoretical estimates given by the methods explained above, showing a very good agreement. To further confirm our model, we numerically solved Eqs. (7), (8), and (9) with and estimated theoretically for mM, using the experimental initial condition at kPa. Figure 4 shows that the overall dynamics is well predicted by the model, without any free parameters, confirming the assumption of Donnan equilibrium despite the fluid flow.
In the above comparison, the theoretical is estimated using the short-time sedimentation hindrance function , showing that for these charged colloids up to . Such a similarity has already been shown numerically for hard-sphere dispersions [52], but experimental evidence is still lacking for polydisperse and concentrated dispersions. The range of experimental parameters explored above leads to unambiguous measurements of the long-time only in the range –0.15 and new experiments are now needed to access a wider range, especially to investigate the possible role of many-body hydrodynamics.
In this work, we developed a chip to measure with improved resolution and acquisition time, EOS of charged dispersions in equilibrium with a salt reservoir down to osmotic pressures of a few kPa. The dynamics can also be used to measure simultaneously the long-time collective diffusion coefficient of the dispersion, also in Donnan equilibrium, a quantity difficult to measure using classical means. In the future, we plan to use these tools to address the breakdown of the Donnan equilibrium hypothesis, a subtle issue that could be relevant to many processes, such as ultrafiltration, that involve potentially intense flows.
Acknowledgements.
We thank M. Guirardel, H. Fay, J. Castaing, P. Bacchin and M. Meireles for fruitful discussions. This work benefited from meetings within the French working group GDR CNRS 2019 Solliciter LA Matière Molle (SLAMM). We also acknowledge Solvay and the ANR program Grant No. ANR-18-CE06-0021 for financial support. This work was performed using HPC resources from GENCI-CINES/IDRIS (Grant No. A0080911444) and CALMIP (Grant No. 21BP21039R1).References
- Russel et al. [1989] W. B. Russel, D. A. Saville, and W. R. Schowalter, Colloidal dispersions (Cambridge University Press, 1989).
- Routh [2013] A. F. Routh, Drying of thin colloidal films, Rep. Prog. Phys. 76, 046603 (2013).
- Peppin et al. [2006] S. S. Peppin, J. A. Elliott, and M. G. Worster, Solidification of colloidal suspensions, J. Fluid Mech. 554, 147 (2006).
- Bowen and Williams [2007] W. R. Bowen and P. M. Williams, Quantitative predictive modelling of ultrafiltration processes: Colloidal science approaches, Adv. Colloid Interface Sci. 134-135, 3 (2007).
- Roa et al. [2016] R. Roa, D. Menne, J. Riest, P. Buzatu, E. K. Zholkovskiy, J. K. G. Dhont, M. Wessling, and G. Nägele, Ultrafiltration of charge-stabilized dispersions at low salinity, Soft Matter 12, 4638 (2016).
- Piazza et al. [1993] R. Piazza, T. Bellini, and V. Degiorgio, Equilibrium sedimentation profile of screened charged colloids: a test of the Hard-Sphere equation of state, Phys. Rev. Lett. 71, 4267 (1993).
- Petsev et al. [1993] D. N. Petsev, V. M. Starov, and I. B. Ivanov, Concentrated dispersions of charged colloidal particles: Sedimentation, ultrafiltration and diffusion, Colloids Surf., A 81, 65 (1993).
- Belfort et al. [1994] G. Belfort, R. Davis, and A. L. Zydney, The behavior of suspensions and macromolecular solutions in crossflow microfiltration, J. Membrane Sci. 96, 1 (1994).
- Segre et al. [1995] P. N. Segre, S. P. Meeker, P. N. Pusey, and W. C. K. Poon, Viscosity and structural relaxation in suspensions of hard-sphere colloids, Phys. Rev. Lett. 75, 958 (1995).
- Banchio et al. [1999] A. J. Banchio, J. Bergenholtz, and G. Nägele, Rheology and dynamics of colloidal suspensions, Phys. Rev. Lett. 82, 1792 (1999).
- Gupta et al. [2015] S. Gupta, J. Stellbrink, E. Zaccarelli, C. N. Likos, M. Camargo, P. Holmqvist, J. Allgaier, L. Willner, and D. Richter, Validity of the stokes-einstein relation in soft colloids up to the glass transition, Phys. Rev. Lett. 115, 128302 (2015).
- Carrière et al. [2007] D. Carrière, M. Page, M. Dubois, T. Zemb, H. Cölfen, A. Meister, L. Belloni, M. Schönhoff, and H. Möhwald, Osmotic pressure in colloid science: clay dispersions, catanionics, polyelectrolyte complexes and polyelectrolyte multilayers, Colloids Surf., A 303, 137 (2007).
- Yasuda et al. [2020] T. Yasuda, N. Sakumichi, U.-i. Chung, and T. Sakai, Universal equation of state describes osmotic pressure throughout gelation process, Phys. Rev. Lett. 125, 267801 (2020).
- Scotti et al. [2021] A. Scotti, M. Pelaez-Fernandez, U. Gasser, and A. Fernandez-Nieves, Osmotic pressure of suspensions comprised of charged microgels, Phys. Rev. E 103, 012609 (2021).
- Belloni [2000] L. Belloni, Colloidal interactions, J. Phys.: Condens. Matter 12, R549 (2000).
- Page et al. [2008] M. G. Page, T. Zemb, M. Dubois, and H. Cölfen, Osmotic Pressure and Phase Boundary Determination of Multiphase Systems by Analytical Ultracentrifugation, ChemPhysChem 9, 882 (2008).
- Pusey [1978] P. N. Pusey, Intensity fluctuation spectroscopy of charged brownian particles: the coherent scattering function, J. Phys. A: Math. Gen. 11, 119 (1978).
- Ackerson [1978] B. J. Ackerson, Correlations for interacting brownian particles. II, J. Chem. Phys. 69, 684 (1978).
- Pusey and Tough [1982] P. N. Pusey and R. J. A. Tough, Langevin approach to the dynamics of interacting brownian particles, J. Phys. A: Math. Gen. 15, 1291 (1982).
- Petsev and Denkov [1992] D. N. Petsev and N. D. Denkov, Diffusion of charged colloidal particles at low volume fraction: Theoretical model and light scattering experiments, J. Colloid Interface Sci. 149, 329 (1992).
- Nägele [1996] G. Nägele, On the dynamics and structure of charge-stabilized suspensions, Phys. Rep. 272, 215 (1996).
- Gapinski et al. [2007] J. Gapinski, A. Patkowski, A. J. Banchio, P. Holmqvist, G. Meier, M. P. Lettinga, and G. Nägele, Collective diffusion in charge-stabilized suspensions: concentration and salt effects, J. Chem. Phys. 126, 104905 (2007).
- Goehring et al. [2017] L. Goehring, J. Li, and P.-C. Kiatkirakajorn, Drying paint: from micro-scale dynamics to mechanical instabilities, Philos. Trans. R. Soc., A 375, 2093 (2017).
- Sobac et al. [2020] B. Sobac, S. Dehaeck, A. Bouchaudy, and J.-B. Salmon, Collective diffusion coefficient of a charged colloidal dispersion: Interferometric measurements in a drying drop, Soft Matter 16, 8213 (2020).
- Marbach and Bocquet [2019] S. Marbach and L. Bocquet, Osmosis, from molecular insights to large-scale applications, Chem. Soc. Rev. 48, 3102 (2019).
- Banchio and Nägele [2008] A. J. Banchio and G. Nägele, Short-time transport properties in dense suspensions: from neutral to charge-stabilized colloidal spheres, J. Chem. Phys. 128, 104903 (2008).
- [27] See Supplemental Material at http://link.aps.org/supplemental/ 10.1103/PhysRevE.104.L062601 for the dimensionless transport model; more details on liquid theory calculations, PEGDA chip prototyping, and PFBD simulations; and more discussion on the compressibility factor. The Supplemental Material also includes Refs. [53, 54].
- Boon et al. [2015] N. Boon, G. I. Guerrero-García, R. van Roij, and M. O. de la Cruz, Effective charges and virial pressure of concentrated macroion solutions, Proc. Natl. Acad. Sci. USA 112, 9242 (2015).
- Beenakker and Mazur [1984] C. W. J. Beenakker and P. Mazur, Diffusion of spheres in a concentrated suspension II, Physica A 126, 349 (1984).
- Beenakker and Mazur [1983] C. W. J. Beenakker and P. Mazur, Diffusion of spheres in a concentrated suspension: Resummation of many-body hydrodynamic interactions, Phys. Lett. A 98, 22 (1983).
- Beenakker [1984] C. W. J. Beenakker, The effective viscosity of a concentrated suspension of spheres (and its relation to diffusion), Physica A 128, 48 (1984).
- Genz and Klein [1991] U. Genz and R. Klein, Collective diffusion of charged spheres in the presence of hydrodynamic interaction, Physica A 171, 26 (1991).
- Banchio et al. [2006] A. J. Banchio, J. Gapinski, A. Patkowski, W. Häußler, A. Fluerasu, S. Sacanna, P. Holmqvist, G. Meier, M. P. Lettinga, and G. Nägele, Many-body hydrodynamic interactions in charge-stabilized suspensions, Phys. Rev. Lett. 96, 138303 (2006).
- Heinen et al. [2011] M. Heinen, A. J. Banchio, and G. Nägele, Short-time rheology and diffusion in suspensions of yukawa-type colloidal particles, J. Chem. Phys. 135, 154504 (2011).
- Westermeier et al. [2012] F. Westermeier, B. Fischer, W. Roseker, G. Grübel, G. Nägele, and M. Heinen, Structure and short-time dynamics in concentrated suspensions of charged colloids, J. Chem. Phys. 137, 114504 (2012).
- Riest and Nägele [2015] J. Riest and G. Nägele, Short-time dynamics in dispersions with competing short-range attraction and long-range repulsion, Soft Matter 11, 9273 (2015).
- Rogers et al. [2011] C. I. Rogers, J. V. Pagaduan, G. P. Nordin, and A. T. Woolley, Single-monomer formulation of polymerized polyethylene glycol diacrylate as a nonadsorptive material for microfluidics, Anal. Chem. 83, 6418 (2011).
- Decock et al. [2018] J. Decock, M. Schlenk, and J.-B. Salmon, In situ photo-patterning of pressure-resistant hydrogel membranes with controlled permeabilities in PEGDA microfluidic channels, Lab Chip 18, 1075 (2018).
- Lee et al. [2010] A. G. Lee, C. P. Arena, D. J. Beebe, and S. P. Palecek, Development of macroporous poly(ethylene glycol) hydrogel arrays within microfluidic channels, Biomacromolecules 11, 3316 (2010).
- Shin et al. [2016] S. Shin, E. Um, B. Sabass, J. T. Ault, M. Rahimi, P. B. Warren, and H. A. Stone, Size-dependent control of colloid transport via solute gradients in dead-end channels, Proc. Natl. Acad. Sci. USA 113, 257 (2016).
- Hallez and Meireles [2017] Y. Hallez and M. Meireles, Fast, Robust Evaluation of the Equation of State of Suspensions of Charge-Stabilized Colloidal Spheres, Langmuir 33, 10051 (2017).
- Herman and Walz [2015] D. Herman and J. Y. Walz, Adsorption and stabilizing effects of highly-charged latex nanoparticles in dispersions of weakly-charged silica colloids, J. Colloid Interface Sci. 449, 143 (2015).
- Alexander et al. [1984] S. Alexander, P. M. Chaikin, P. Grant, G. J. Morales, P. Pincus, and D. Hone, Charge renormalization, osmotic pressure, and bulk modulus of colloidal crystals: Theory, J. Chem. Phys. 80, 5776 (1984).
- Denton [2010] A. R. Denton, Poisson-Boltzmann theory of charged colloids: limits of the cell model for salty suspensions, J. Phys.: Condens. Matter 22, 364108 (2010).
- Holm et al. [2000] C. Holm, P. Kékicheff, and R. Podgornik, Electrostatic Effects in Soft Matter and Biophysics, edited by C. Holm, P. Kékicheff, and R. Podgornik (NATO Science Series, 2000).
- Trizac et al. [2007] E. Trizac, L. Belloni, J. Dobnikar, H. H. von Grünberg, and R. Castañeda-Priego, Macroion virial contribution to the osmotic pressure in charge-stabilized colloidal suspensions, Phys. Rev. E 75, 011401 (2007).
- Hallez et al. [2014] Y. Hallez, J. Diatta, and M. Meireles, Quantitative Assessment of the Accuracy of the Poisson–Boltzmann Cell Model for Salty Suspensions, Langmuir 30, 6721 (2014).
- Fushiki [1992] M. Fushiki, Molecular-dynamics simulations for charged colloidal dispersions, J. Chem. Phys. 97, 6700 (1992).
- Dobnikar et al. [2004] J. Dobnikar, D. Haložan, M. Brumen, H.-H. Von Grünberg, and R. Rzehak, Poisson-Boltzmann Brownian dynamics of charged colloids in suspension, Comput. Phys. Commun. 159, 73 (2004).
- Hallez and Meireles [2016] Y. Hallez and M. Meireles, Modeling the electrostatics of hollow shell suspensions: Ion distribution, pair interactions, and many-body effects, Langmuir 32, 10430 (2016).
- Teulon et al. [2019] L. Teulon, Y. Hallez, S. Raffy, F. Guerin, E. Palleau, and L. Ressier, Electrostatic directed assembly of colloidal microparticles assisted by convective flow, J. Phys. Chem. C 123, 783 (2019).
- Wajnryb et al. [2004] E. Wajnryb, P. Szymczak, and B. Cichocki, Brownian dynamics: divergence of mobility tensor, Physica A 335, 339 (2004).
- Salmon et al. [2017] J.-B. Salmon, F. Doumenc, and B. Guerrier, Humidity-insensitive water evaporation from molecular complex fluids, Phys. Rev. E 96, 032612 (2017).
- Liu et al. [2000] X.-D. Liu, R. P. Fedkiw, and M. Kang, A boundary condition capturing method for Poisson’s equation on irregular domains, J. Comput. Phys. 160, 151 (2000).