X-ray response to disk evolution in two Cas stars††thanks: Based on XMM-Newton, Swift, and ESO data.
Abstract
The H emission of a set of southern Cas stars was monitored since 2019, with the aim of detecting transition events and examining how their peculiar X-ray emission would react in such cases. Two stars, HD 119682 and V767 Cen, were found to display slowly decreasing disk emissions. These decreases were not perfectly monotonic and several temporary and limited re-building events were observed. For HD 119682, the emission component in H disappeared in mid-July 2020. In X-rays, the X-ray flux was twice smaller than recorded two decades ago but of a similar level as observed a decade ago. The X-ray flux decreased over the campaign by 30%, but the hardness remained similar in datasets of all epochs. In particular, the Cas character remained as clear as before even when there was no trace of disk emission in the H line. For V767 Cen, the full disappearance of disk emission in H never occurred. We followed closely a disk rebuilding event, but no significant change in flux or hardness was detected. These behaviours are compared to those of other Cas stars and their consequences on the X-ray generation are discussed.
keywords:
stars: early-type – stars: massive – stars: emission-line,Be – X-rays: stars – stars: variables: general1 Introduction
The vast majority of stars are known X-ray emitters, and the most massive ones are no exception. The cause of their high-energy emission lies in the material ejected by those stars. The stellar winds of OB stars are driven by the scattering of the UV radiation by metallic ions. This driving process is intrinsically unstable and the resulting shocks lead to the generation of X-rays (Feldmeier et al., 1997). This wind emission is soft (plasma temperature of about 0.6 keV) and rather faint (). If a large-scale magnetic field is present, the wind flows can be channeled by the field and collide, generating hot plasma. This leads to an additional X-ray emission, generally harder in character (ud-Doula & Nazé, 2016). Alternatively, when two massive stars form a binary system, the two winds may collide and the strong shock may generate X-rays (Rauw & Nazé, 2016): some massive binary systems thus appear harder (plasma temperature of about 2. keV) and brighter ( up to ). Finally, a small subgroup of stars have emerged in the last decade: the Cas analogs (Smith et al., 2016). These stars also display thermal X-ray spectra, but much harder (plasma temperature keV) and brighter ( between and ). Only X-ray binaries appear brighter in the X-ray range than those Cas stars. It must be noted that all of these objects are of the Oe/Be spectral type, i.e. they possess a decretion disk. However, up to now, the only difference spotted between the other Oe/Be stars and the Cas analogs resides in their X-ray properties (Nazé et al., 2020, 2021).
While the link between the outflows and the X-ray emission is well understood for the other cases (embedded wind shocks, magnetically confined winds, colliding winds), the origin of the peculiar Cas characteristics remains debated. Up to now, all detected Cas analogs belong to the Oe/Be category, i.e. they possess a decretion disk in Keplerian rotation. This gives us an important clue, but the exact role of the disk in the generation of the high-energy emission remains unclear. In this context, two broad classes of scenarios to explain the Cas phenomenon have been proposed. The first one relies on the presence of a companion. It could be a compact object (WD or NS) and the X-rays would then come from its accretion of material from the Be star and its disk (Murakami et al., 1986; Postnov et al., 2017). In such a case, if the disk dissipates, the source of material disappears hence the X-ray emission should ultimately (i.e. after some travelling delay) stop. Another possibility is to consider a stripped He-star companion whose stellar wind collides with the peripheral regions of the disk, thereby leading to a possible emission of X-rays (Langer et al., 2020). Again, disappearance of the disk implies cutting the feeding of the X-ray source. In contrast, the second type of scenario requires no companion as it involves magnetic interactions between the Be star and its inner disk (Robinson et al., 2002; Motch et al., 2015). In such a case, if the disk fully dissipates, the interactions will no longer take place hence the peculiar X-ray emission should disappear, with a faster reaction time than for the previous case. Similar arguments can be built perforce if considering a disk outburst rather than a disk dissipation. Following the behaviour of the X-ray emission in reaction to changes in the disk therefore has an important diagnostic value. In this context, long-term monitorings are required as they are the only way to assess the amplitude of the correlated X-ray response to an optical event (if any) and to derive the time lag between them (if any).
In this paper, we present the results of such an exercise for two Cas stars, HD 119682 and V767 Cen. The Cas nature of HD 119682 (B0Ve, =7.9) was first reported by Rakowski et al. (2006) and Safi-Harb et al. (2007). Indeed, the X-ray emission is both much harder (plasma temperature of 10 keV, hard-to-soft flux ratio of 2.5) and brighter () than for ordinary OB stars (Nazé & Motch, 2018). The star was also classified as a binary candidate in Nazé et al. (2021). The X-ray emission of V767 Cen (HD 120991, B2Ve, =6.1) was studied in detail by Nazé & Motch (2018) thanks to an XMM-Newton archival exposure. The star displayed a , a plasma temperature of 6.4 keV, and a hard-to-soft flux ratio of 2, all pointing to a Cas nature. Unfortunately, no optical data were available for the two stars at the time of these discovery observations. However, our optical monitoring fills this gap and enlarges the view by revealing changes in their disks. X-ray observations were then triggered to assess the reaction of the high-energy emission to the disk variations. Section 2 presents the data used in this study, while Section 3 derives the results, Section 4 discusses them and Section 5 summarizes them.
2 Data
2.1 Optical data
To ensure a regular monitoring of the H line, we set up a collaboration with amateur astronomers. Since 2019, four persons regularly observed a set of southern Be stars, with three observers (co-authors TB, BH, PMcG) based in Australia and one (co-author PC) in Brazil. Their instruments were 11–14 inches reflectors equipped with spectrographs (Gerlach LowSpec, Shelyak LHIRESIII, LISA, eShel) which provided spectral resolutions between 400 and 20 000 (most common value was 4000 for HD 119682 and 10000 for the brighter V767 Cen). For HD 119682, exposure times ranged from 5 minutes to 3.5 hrs, leading to typical signal-to-noise ratios of 75; for V767 Cen, exposure times were similar but average signal-to-noise was 50. The spectra were reduced in a standard way using ISIS111http://www.astrosurf.com/buil/isis-software.html and finally normalized over the same set of continuum windows using polynomials of low order. No telluric correction could be made for the low resolution spectra (all HD 119682 data and a quarter of V767 Cen data) but it was applied for observations taken with higher resolution. All Australian amateur spectra were deposited on the Be Star Spectra (BeSS) open-access database222http://basebe.obspm.fr. Note that HD 119682 belongs to a small group made of several stars, notably CPD–62∘3559 (K 2 II/III) and HD 119699 (A 1 II), but their spectral types being different from that of HD 119682 and their separation being large enough, the amateur spectra of HD 119682 were not contaminated by these close neighbours.
In parallel, a few spectra of both stars were obtained at the Cerro Paranal ESO Observatory for our ESO program ID 105.204D. They were taken with the Ultraviolet and Visual Echelle Spectrograph (UVES) in dichroic mode (covered regions: 3300–4560 Å at and 4730–6830 Å at ). These spectra were already used and presented in Nazé et al. (2021), and we refer to that publication for details on this dataset. An additional X-Shooter spectrum of each star was also taken for the same program. Their spectral resolution is lower than that of UVES ( in the visible range) but the signal-to-noise ratios are high (). These spectra were reduced in the same way as the UVES data.
H equivalent widths were estimated for all spectra using the first-order moment over a given velocity range (–600 to 600 km s-1). They are listed in Tables 1 and 2 for HD 119682 and V767 Cen, respectively.
| Date | ID | (Å) | Date | ID | (Å) |
|---|---|---|---|---|---|
| 8564.993 | BHn | -4.290.12 | 9049.936 | TB | 1.250.02 |
| 8573.977 | TB | -3.810.03 | 9053.961 | PMcGl | 1.120.02 |
| 8580.956 | TB | -3.530.03 | 9057.953 | PMcGl | 1.220.03 |
| 8602.994 | BHn | -3.040.05 | 9060.885 | BHl | 1.120.04 |
| 8610.011 | BHn | -3.120.11 | 9061.954 | TB | 1.210.03 |
| 8661.063 | PMcGl | 0.070.07: | 9074.952 | TBl | 0.800.03 |
| 8662.012 | TBl | -1.030.06 | 9080.974 | TB | 0.590.04 |
| 8676.913 | TB | -0.190.02 | 9089.902 | BHl | 0.000.07 |
| 8682.954 | TB | 0.140.02 | 9098.880 | BHl | 0.340.07 |
| 8698.991 | TB | 0.300.03 | 9185.837 | UVES | 1.6500.003 |
| 8713.963 | TB | 1.060.03 | 9205.842 | UVES | 1.6390.003 |
| 8719.949 | TB | 1.150.02 | 9218.850 | Xsh | 1.0070.012 |
| 8721.940 | TB | 0.970.02 | 9234.113 | PMcGl | 1.390.04 |
| 8724.925 | PMcG | 0.210.06 | 9242.753 | UVES | 1.1860.003 |
| 8728.935 | TB | 0.990.03 | 9256.984 | TB | 1.250.05 |
| 8756.956 | PMcGn | 1.420.27 | 9257.801 | UVES | 1.2260.004 |
| 8837.225 | PMcGn | -3.060.14 | 9274.662 | UVES | -0.2940.003 |
| 8865.210 | PMcGn | -2.680.13 | 9275.999 | TB | -0.530.03 |
| 8878.205 | PMcG | -1.980.06 | 9277.079 | PMcGl | -0.270.04 |
| 8934.002 | PMcGn | 1.920.17 | 9297.953 | TB | -0.880.03 |
| 8952.069 | TB | 1.060.03 | 9329.994 | TB | -0.740.02 |
| 8974.035 | PMcGl | 1.360.07 | 9331.188 | PMcGl | -0.600.05 |
| 8981.055 | TB | 1.750.02 | 9364.989 | BHl | 0.980.03 |
| 9017.003 | TB | 1.570.02 | 9371.045 | TB | 1.070.02 |
| 9037.950 | TB | 1.510.03 | 9394.925 | PMcGl | 1.070.03 |
| 9044.996 | TB | 1.480.03 | 9424.977 | TB | 0.770.03 |
| 9045.021 | PMcGl | 1.360.04 |
Dates are in the format HJD-2 450 000, and ’:’ indicates an uncertain value. The ID refers to the source of the spectrum: UVES or Xsh for ESO data, TB, BH, PMcG or PC for the amateur data (from their initials, see authors’ list). Symbols n and l are added for the noisier spectra () and lower resolution data ( but ), respectively. Note that the errors on equivalent widths are computed from flux errors: they only reflect the and do not include the normalization errors.
| Date | ID | (Å) | Date | ID | (Å) |
|---|---|---|---|---|---|
| 8570.959 | TB | -8.250.01 | 9116.885 | TB | -3.550.01 |
| 8578.070 | BH | -7.460.03 | 9127.873 | TB | -2.150.03 |
| 8590.038 | BH | -7.090.02 | 9191.842 | UVES | -3.9810.002 |
| 8599.002 | TB | -7.150.01 | 9196.843 | Xsh | -3.8890.013 |
| 8610.154 | PMcGl | -8.940.03 | 9206.834 | UVES | -3.4360.003 |
| 8624.000 | BH | -10.290.02 | 9231.859 | UVES | -2.5020.003 |
| 8641.155 | PMcGl | -7.680.05 | 9234.149 | PMcGl | -2.640.03 |
| 8655.954 | PMcGl | -8.070.08 | 9246.777 | UVES | -1.8640.002 |
| 8668.932 | BH | -7.880.02 | 9298.965 | TB | -2.240.01 |
| 8683.984 | PMcGl | -7.390.02 | 9335.978 | TB | -3.420.01 |
| 8684.995 | TB | -7.300.01 | 9351.943 | TB | -2.310.01 |
| 8685.943 | BH | -7.310.03 | 9364.964 | BHl | -0.960.03 |
| 8693.970 | TB | -7.310.01 | 9368.914 | BH | -0.910.04 |
| 8697.971 | TB | -7.760.02 | 9370.923 | TB | -1.620.01 |
| 8724.949 | PMcGl | -6.850.03 | 9381.914 | BH | -0.620.03 |
| 8728.953 | TBl | -5.990.03 | 9386.933 | BH | -1.050.03 |
| 8865.177 | PMcGl | -5.010.05 | 9394.989 | PMcGl | -0.330.04 |
| 8934.037 | PMcGl | -2.150.04 | 9398.501 | PC | -0.130.04 |
| 8937.978 | TB | -2.420.02 | 9399.534 | PC | -0.360.03 |
| 8948.992 | BH | -2.560.05 | 9401.876 | PMcGl | -0.910.03 |
| 8953.044 | PMcGl | -2.850.03 | 9403.964 | BH | -0.780.03 |
| 8960.996 | BH | -3.410.02 | 9406.467 | PC | -1.330.02 |
| 8962.024 | TB | -3.420.01 | 9406.977 | TB | -2.000.01 |
| 8972.955 | TB | -3.100.02 | 9407.505 | PC | -1.500.03 |
| 8974.080 | PMcGl | -3.340.03 | 9408.465 | PC | -2.170.02 |
| 8975.994 | TB | -2.920.02 | 9410.462 | PC | -1.920.03 |
| 8984.037 | BH | -3.680.03 | 9421.462 | PC | -4.080.03 |
| 8995.951 | BH | -2.920.03 | 9422.959 | TB | -4.620.01 |
| 8998.034 | TB | -2.700.02 | 9424.973 | BHl | -4.050.02 |
| 9003.996 | TB | -2.460.02 | 9426.474 | PC | -3.760.03 |
| 9015.943 | TB | -1.610.02 | 9428.909 | BHl | -3.660.01 |
| 9018.024 | BH | -1.350.04 | 9429.473 | PC | -4.060.03 |
| 9029.970 | BH | -2.110.03 | 9435.442 | PC | -4.390.03 |
| 9031.971 | TB | -2.190.02 | 9437.976 | TB | -4.550.01 |
| 9044.996 | BH | -3.280.02 | 9441.447 | PC | -4.070.02 |
| 9045.074 | PMcGl | -3.260.02 | 9445.908 | BH | -3.420.03 |
| 9062.973 | BH | -3.330.04 | 9446.994 | TB | -3.810.02 |
| 9066.997 | TB | -3.090.02 | 9456.907 | BH | -2.990.04 |
| 9071.891 | BHl | -2.460.03 | 9459.969 | TB | -3.490.02 |
| 9074.983 | TB | -2.800.02 | 9466.915 | TB | -2.990.02 |
| 9106.910 | BHn | -1.560.06 | 9481.916 | TB | -1.970.02 |
| 9111.496 | UVES | -2.3120.002 | 9591.165 | PMcG | -1.500.02 |
| 9112.914 | BHn | -3.320.07 |
Contemporaneous photometry was recorded by ASAS-SN333https://asas-sn.osu.edu/ for both stars. The targets are however brighter than the saturation limit of ASAS-SN. In such cases, a correction procedure using the bleed trails is implemented, but it is far from perfect and notably requires the targets to be isolated (ASAS-SN has a PSF of 15″ FWHM). For HD 119682, which lies in a crowded area, the data points are unrealistically spread over several magnitudes and the lightcurve is unusable. For V767 Cen, the situation appears better, although a dispersion of mag is present (which cannot hide long-term trends if present, see e.g. a similar situation for Aqr in Nazé et al. 2019). Only g-band data cover the dates of our monitoring. A few outliers (having values deviating from the median by 3 times the median absolute deviations) were filtered out.
2.2 X-ray observations
Both our targets were observed with XMM-Newton. The first observation of HD 119682 was taken in August 2001 in full frame mode and with a thick filter to avoid contamination by UV/optical photons (40 ks, Rev. 315, ObsID=0087940201, PI Hughes). HD 119682 here appears off-axis as the observation was concerned with a nearby supernova remnant. The star was re-observed on-axis in March 2009 (54 ks, Rev. 1692, ObsID=0551000201, PI Motch), this time with a medium filter. Finally, we triggered our TOO program to monitor the X-ray emission of HD 119682 as its disk was disappearing, leading to four additional observations taken with the medium filter and in Large window mode (PI Rauw; 10 ks in August 2019 on Rev. 3610, ObsID=0840310901; 20 ks in January 2020 on Rev. 3684, OBsID=0840311001; 10 ks in July 2020 for Rev. 3775, ObsID=0840311101 and March 2021 for Rev. 3890, ObsID=0840310801).
XMM-Newton also observed V767 Cen during 7 ks in January 2007 (Rev. 1306, ObsID=0402121801, PI Favata) using a thick filter and the large window mode. Following the observation of a disk flaring (see below), we requested a TOO observation which was taken in July 2021 with the same characteristics as in the first pointing (Rev. 3967, ObsID=0891800801, PI Nazé).
All XMM-Newton data were processed with the Science Analysis Software (SAS) v19.1.0 using calibration files available in June 2021 and following the recommendations of the XMM-Newton team444SAS threads, see
http://xmm.esac.esa.int/sas/current/documentation/threads/ . The European Photon Imaging Camera (EPIC) observations were first processed with the pipeline and then filtered to keep only the best-quality data (pattern 0–12 for MOS and 0–4 for pn). To assess whether contamination by background proton flares were present, we built global light curves for energies above 10 keV and discarded time intervals corresponding to flares. Only the older two datasets and that of July 2020 were affected by such flares for HD 119682 while there was no flare for V767 Cen data. Source detection was then performed to assess the crowding in the fields-of-view. This allowed us to carefully choose extraction regions. The source regions were circles centered on the Simbad positions of the targets and with radii of 30″ in general while background regions were chosen from nearby circles devoid of sources and generally 50″ in radius. Background-corrected lightcurves were calculated for energy bands of 0.5–10. keV, 0.5–2. keV, and 2.–10. keV. For HD 119682, bins of 100 s and 1 ks were used, whereas shorter bins of 50 s and 500 s could be used for V767 Cen to get the same lightcurve quality since its X-ray flux is larger. The lightcurves were corrected for vignetting, off-axis angle, and bad pixels, and bins exposed during less than half nominal bin length were eliminated. For spectra, dedicated calibration matrices were built and a grouping was then applied to obtain an oversampling factor of maximum five and a minimum signal-to-noise ratio of 3.
For HD 119682, a few Chandra observations were also available. These grating observations were taken in December 2008 (ObsID=8929 and 10834–6, PI Rakowski), totalling nearly 150 ks altogether. Individual zeroth order spectra as well as combined (order +1 and –1) grating spectra were extracted for HEG and MEG. The reduction of these observations was presented in Nazé & Motch (2018) and no further processing was applied for this paper. As mentioned in Nazé & Motch (2018), additional Chandra observations of HD 119682 were taken with ACIS-I and suffer from pile-up hence could not be used.
For V767 Cen, we further obtained an X-ray monitoring with the Neil Gehrels Swift observatory (ObsID=00014422001–8) during the second semester of 2021 and early 2022. The X-ray telescope (XRT) was used in Windowed Timing mode because V767 Cen, with its =6.1, is too bright in the optical and UV ranges for the other observation mode. Since we were mostly interested in flux variations, exposures were of 2–3 ks duration, allowing for a few hundred counts to be collected for the source. Note that exposures 00014422003–4, taken four days apart, were combined to reach the required signal-to-noise. Individual count rates and spectra were obtained with the Swift on-line tool555https://www.swift.ac.uk/user_objects/. Note that V767 Cen is at the limit for WT observations: the background has a similar count rate as the source and the centroiding is difficult. Some slight systematic errors cannot be totally excluded but the consistency of the obtained data advocates for a limited impact on our results.

Spectra were then fitted in Xspec v12.11.1 using absorbed optically thin thermal emission models with solar abundances from Asplund et al. (2009). For XMM-Newton, all EPIC spectra (pn, MOS1, MOS2) were fitted simultaneously; for Chandra, zeroth order spectra were fitted for individual exposures while a fit to the HEG and MEG grating spectra combining both orders and all exposures was also made. The chosen models were as in Nazé & Motch (2018). Results are provided in Table 3 - slight differences with those reported in Nazé & Motch (2018) for the same exposures come from the improved atomic parameters of the fitting tool. For V767 Cen, a single temperature fit could a priori provide sufficient results for Swift spectra. Nevertheless, two-temperature fits were also tried to ease the comparison with XMM-Newton results. As the Swift data have lower quality, especially at low energies, the temperatures were fixed to those found with XMM-Newton, which show little changes between the two observations. However, even with fixed temperatures, the strength of the low temperature component could not be constrained. We therefore further fixed the ratio between the normalization factors of the two thermal components to the value observed with XMM-Newton in 2021.
| ID | I | /dof | ||||||||
|---|---|---|---|---|---|---|---|---|---|---|
| ( cm-2) | (keV) | ( cm-5) | (tot, erg cm-2 s-1) | |||||||
| HD 119682 | ||||||||||
| 0315 | x | 2149.849 | 0.2 | 0.0200.008 | 7.80.4 | 11.80.13 | 518.71/468 | 1.900.02 | 2.09 | 2.240.05 |
| 8929 | c | 4817.692 | 0.2 | 0.000.02 | 10.32.2 | 11.30.39 | 49.52/56 | 1.900.12 | 2.10 | 2.440.27 |
| 10835 | c | 4820.076 | 0.2 | 0.00 (fixed) | 9.41.9 | 8.450.33 | 49.68/45 | 1.410.08 | 1.55 | 2.350.22 |
| 10834 | c | 4821.515 | 0.2 | 0.000.03 | 12.52.7 | 8.580.24 | 106.86/89 | 1.470.07 | 1.60 | 2.610.19 |
| 10836 | c | 4822.342 | 0.2 | 0.060.07 | 12.96.0 | 10.20.60 | 39.87/51 | 1.700.12 | 1.84 | 2.910.33 |
| comb. | c | 4820.201 | 0.2 | 0.130.13 | 12.58.2 | 12.00.66 | 128.98/444 | 1.970.12 | 2.12 | 3.210.38 |
| 1692 | x | 4897.283 | 0.2 | 0.0090.008 | 8.10.5 | 6.970.09 | 467.69/448 | 1.130.02 | 1.25 | 2.240.05 |
| 3610 | x | 8721.890 | 0.2 | 0.0000.007 | 8.30.8 | 6.740.11 | 283.72/268 | 1.100.03 | 1.22 | 2.230.10 |
| 3684 | x | 8870.137 | 0.2 | 0.0000.005 | 8.30.5 | 6.940.09 | 396.86/363 | 1.130.02 | 1.26 | 2.220.07 |
| 3775 | x | 9050.958 | 0.2 | 0.00 (fixed) | 7.80.7 | 5.860.10 | 270.94/265 | 0.950.03 | 1.05 | 2.170.09 |
| 3890 | x | 9279.849 | 0.2 | 0.0000.008 | 8.81.1 | 4.880.10 | 265.48/234 | 0.810.03 | 0.89 | 2.290.11 |
| V767 Cen | ||||||||||
| 1306 | x | 4126.327 | 0.043 | 0.0650.013 | 0.270.03 | 1.260.37 | 494.27/443 | 3.090.05 | 3.18 | 1.970.06 |
| 6.480.33 | 18.50.28 | |||||||||
| 3967 | x | 9434.160 | 0.043 | 0.0800.012 | 0.280.03 | 1.600.39 | 560.49/451 | 3.280.05 | 3.38 | 1.890.06 |
| 6.020.37 | 20.00.30 | |||||||||
| 00014422001 | s | 9409.837 | 0.043 | 0.210.09 | 0.28&6.02 (fixed) | 25.32.5 | 56.46/51 | 3.850.32 | 3.93 | 2.370.32 |
| 00014422002 | s | 9428.756 | 0.043 | 0.100.10 | 0.28&6.02 (fixed) | 24.53.3 | 30.19/34 | 3.970.41 | 4.08 | 1.960.35 |
| 00014422003+4 | s | 9446.647 | 0.043 | 0.000.10 | 0.28&6.02 (fixed) | 16.62.4 | 37.16/36 | 2.880.43 | 2.98 | 1.610.39 |
| 00014422005 | s | 9465.858 | 0.043 | 0.090.10 | 0.28&6.02 (fixed) | 23.73.0 | 36.50/38 | 3.880.36 | 3.99 | 1.910.31 |
| 00014422006 | s | 9486.837 | 0.043 | 0.000.08 | 0.28&6.02 (fixed) | 20.92.6 | 50.01/48 | 3.620.40 | 3.76 | 1.620.34 |
| 00014422007 | s | 9561.986 | 0.043 | 0.000.11 | 0.28&6.02 (fixed) | 14.92.4 | 51.76/39 | 2.590.36 | 2.68 | 1.630.33 |
| 00014422008 | s | 9583.002 | 0.043 | 0.000.07 | 0.28&6.02 (fixed) | 16.62.1 | 35.38/32 | 2.880.38 | 2.99 | 1.620.35 |
| Aqr | ||||||||||
| 00010659001-39 | s | 8344.345 | 0.036 | 0.530.06 | 27.69.4 | 105.54.6 | 396.03/436 | 16.00.4 | 16.1 | 6.100.24 |
Fitted models were of the form tbabsphabsapec, with the first absorption fixed to the interstellar value. ID refers to the revolution number (for XMM-Newton) or ObsID (for Chandra; “comb” indicates the fitting of the fully combined (all obs, both orders) Chandra HEG and MEG grating spectra. Column I identifies the facility used (x for XMM-Newton, c for Chandra, s for Swift). The hardness ratios are defined by , with the flux after correction for interstellar absorption and soft and hard energy bands being defined as 0.5–2.0 keV and 2.0–10.0 keV, respectively (the total band being 0.5–10.0 keV). Errors correspond to 1 uncertainties; they correspond to the larger value if the error bar is asymmetric. For Swift spectra of V767 Cen, the normalization factor of the 0.28 keV component is fixed to 0.08 times that of the 6.02 keV component, as in XMM-Newton data of Rev. 3967, and only the normalization of that hottest component is provided here.
3 Results


3.1 HD 119682
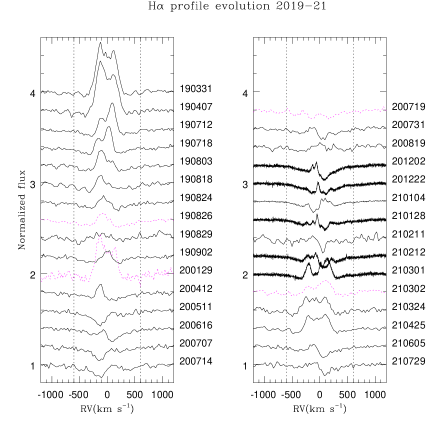
When the optical monitoring began in 2019, the H line of HD 119682 displayed a double-peaked emission, with no trace of absorption. The equivalent width was moderate (–4.3 Å, a slightly lower value than in an older - May 2017 - spectrum). Over the course of the year, the emission steadily decreased, with the underlying absorption more and more clearly detectable. A moderate emission suddenly re-appeared in January 2020 ( Å), but disappeared soon afterwards. The H line then remained in absorption, although a small emission did shortly re-appear in December 2020 and March-April 2021 (Fig. 1). Thus, during the monitoring, the disk did not undergo a monotonic disappearance. Rather, the behaviour appears somewhat erratic, with an overall disappearance trend superimposed on temporary disk reinforcements, probably corresponding to small mass ejection events. The complex emission line profile, with changing width and even multiple peaks as revealed by ESO spectra, also points towards a complicated disk geometry at those times: the ejected material does not seem to form a single blob slowly and smoothly mixing with the disk.
The H line profile was very different when the various XMM-Newton observations were taken (see magenta profiles in Fig. 1). In August 2019, the absorption was dominant and the emission weak. In January 2020, the emission was moderate while, in July 2020, there was no trace of emission. Finally, in March 2021, the emission was intermediate between the first two cases. There is unfortunately no information on the shape of the H line profile at the time of the older XMM-Newton or Chandra observations.
During each X-ray observation, short-term flux variations can be spotted in the lightcurves, as are common in Cas stars (e.g. Smith et al., 2012). It should however be noted that the count rate does not allow to make lightcurves with extremely short time bins (e.g. 1 s) thought to be typical of the “shot”/flaring emission of Cas stars hence such timescales remain unexplored for HD 119682. The Appendix shows these XMM-Newton lightcurves. It reveals that the hardness of the emission, estimated from the ratio of hard (2–10 keV) to soft (0.5–2 keV) count rates, does not seem to change in a significant way over the whole XMM-Newton dataset. With a Pearson correlation coefficient of only 0.33, the hardness also does not appear significantly correlated to the strength of the X-ray emission, estimated from the full band (0.5–10 keV) count rate. Finally, it may be noted that the dispersion of the lightcurve points remains similar if one considers a single exposure or the whole dataset, despite different values of the average count rate.
Table 3 provides the results of spectral fits. We can see that there is some systematic difference between XMM-Newton and Chandra results. This is in part due to the stellar variations, but also to remaining cross-calibration problems: even for a stable object, it is quite common to not get exactly the same modelling results. Note that the comparison between the combined grating data and the individual 0th order spectra shows a good agreement, indicating little effects of pile-up which could potentially still affect the latter data.
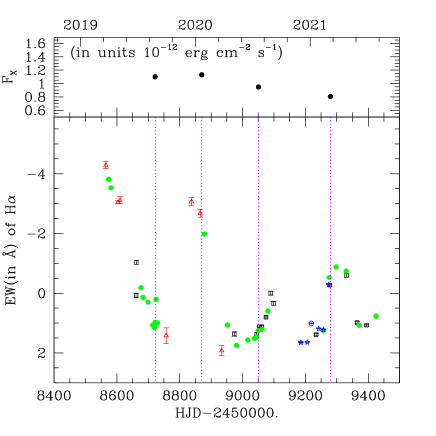
The X-ray flux was about erg cm-2 s-1 at the time of the oldest observations, but it then decreased by a factor of two in more recent years. Focusing on our four monitoring observations, the star did not appear at its lowest flux when the H emission was the lowest (absorption only, July 2020) nor did it appear brighter in January 2020 or March 2021 when a small surge in disk emission occurred. Rather, there seems to be a slow, monotonic flux decline (30%) over the entire monitoring interval. Furthermore, restricting to comparing XMM-Newton spectra to avoid any cross-calibration problems, we see that the ratio between hard and soft fluxes (after correction for interstellar absorption) remained stable at all times, while the temperature and absorption also agree within errors. Clearly, the Cas characteristics did not disappear, nor did they change of relative strength, even though the flux changed and the disk evolved. Figure 2 graphically displays this evolution of flux and hardness ratios over time. The top panel of the same figure compares the fluxes to the H line strength: it confirms the lack of correlation between X-ray parameters and the H line.
3.2 V767 Cen
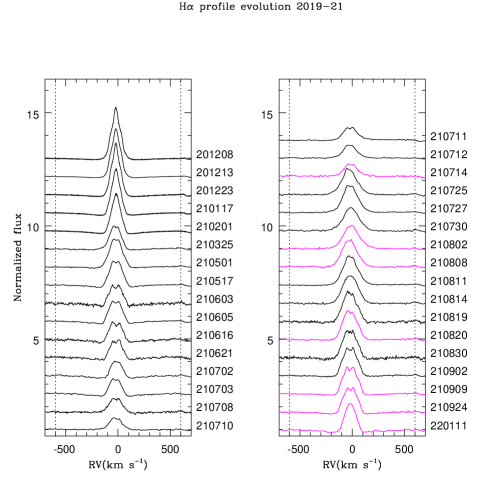
At the start of the monitoring in March 2019, the star displayed a rather strong emission, with the line amplitude nearly reaching four times the continuum level (Figs. 3 and 4, Å). The line profile had a single peak, although with prominent shoulders (i.e. the line had a winebottle shape). The emission slowly decreased in April, then went shortly back to its initial level in May, before resuming its decrease. After this downward trend, the emission appeared to stabilize the next year. Only small variations were seen around an average equivalent width of –3 Å. At that time, the line profile reached an amplitude of only 1–1.5 times the continuum level. Furthermore, the shoulders seemed to have disappeared while the broad stellar absorption started to appear in the high-velocity wings of the profile. The high-resolution ESO spectrum taken in September 2020 shows that the single peak seen in amateur data is actually made of two very close subpeaks. In December 2020, the high-resolution ESO data revealed that the emission became narrower but of larger amplitude ( Å, amplitude twice the continuum level, with clear hints of the photospheric absorption outside the emission range). The emission gradually decreased over the next months, down to Å, showing that the disk re-building was only temporary. In parallel, the separation between peaks in the double-peaked H line profile changed from 18.5 km s-1 in early December 2020 to 52 km s-1 at the beginning of February 2021. Using Eq. 2 of Zamanov et al. (2019), this translates into a size change for the emission region by a factor of 8 in just two months. Such a variation in peak separation is typical of Be disks as a larger disk reaches lower orbital velocities at its periphery than a small disk closer to the star (Hummel & Vrancken, 1995; Zamanov et al., 2019).
The emission then stabilized in March–May 2021, to finally resume its slow decrease in June. The absorption wings were clearly visible from mid-May to early July. While one would have expected the emission to slowly disappear, the absorption wings suddenly filled up. This suggests an input of fresh material close to the star, where velocities are large. In such a case, it is expected that the material will gradually spread out over the whole disk: indeed, the core of the emission soon became broader and stronger, reaching one time the continuum level at the end of July (compared to an amplitude of one-half in mid-July). After this sudden event, the emission traced by the H line resumed its decrease.
Contrary to HD 119682, the H line was never largely dominated by absorption in our observations of V767 Cen, a clear emission being visible in all spectra, even at lowest . Both stars however display irregular decreases, often interrupted by short flaring episodes. Since the July 2021 flaring led to an equivalent width increase never seen before in our monitoring, we decided to trigger X-ray observations to follow the reaction to the reinforcement of the disk, rather than to its disappearance as in HD 119682. Swift was the fastest to react, with the first exposure taken less than a week after the event, while XMM-Newton data were taken a month later.
Comparing first the highest quality data, it is obvious that the 2007 and 2021 XMM-Newton spectra display very similar properties (absorption, temperatures, overall luminosity, hardness ratio, see Table 3). Although the disk state in 2007 is not known, it would be quite a coincidence for it to be the exact same one as in 2021. In addition, each XMM-Newton lightcurve displays short-term flux variations, as found for HD 119682 and other Cas stars, but no hardness variations (see Appendix). Again, there seems to be no correlation between the overall count rate and the hardness in these lightcurves. Finally, while the disk emission was much lower in 2021 than at the beginning of the optical monitoring in 2019, the Cas character remained clear.
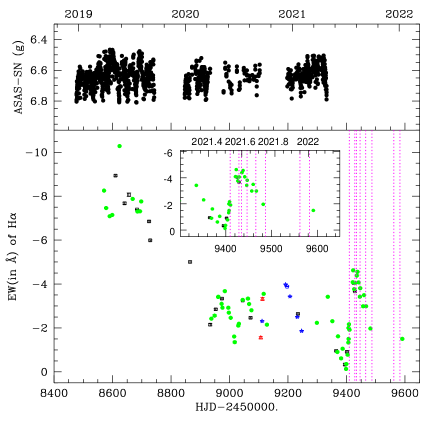
The Swift data allow to examine the behaviour of the star in 2021 over a longer timescale, albeit with lower quality data. V767 Cen appears slightly brighter in the second exposure and slightly fainter in the last ones, but the changes remain within 2: again, the star seems to display a rather similar X-ray emission at all times. These results are shown in Fig. 5, which also graphically demonstrates the absence of correlation between X-ray flux and strength of the H line.
Finally, ASAS-SN provided photometry over a long timescale666V767 Cen was also observed by TESS during our monitoring campaign and these observations are reported in Nazé et al. (2020). Significant variations of about 0.2 mag were recorded by TESS over its few weeks’ observing window and they are confirmed by ASAS-SN data. (see top panel of Fig. 4). Despite their noise, those data clearly show that the broad-band photometry remains rather stable while the H line strongly changes.
4 Discussion
4.1 Observed changes in Cas analogs
Amongst Cas analogs, only three stars had previously been followed through a transition of their disk. The Oe star HD 45314, the hottest Cas analog known so far, was monitored extensively in the optical range (Rauw et al., 2018). X-ray observations were obtained as the star displayed very different disk states, as traced by the H line: strong emission (equivalent width close to –23Å), shell phase, and very small emission (equivalent width of –7.9Å). Changes in -band photometry were also detected, indicating that even the inner parts of the disk were affected by the variation. Between the first and last observations, the X-ray flux was reduced by an order of magnitude and the hardness of the spectrum markedly decreased too ( changed from 4.3 to 1.8, see Nazé & Motch 2018). The Cas character was thus disappearing, suggesting a direct link between the disk and the generation of X-rays (Rauw et al., 2018).
In contrast, the monitoring of Aqr drew a different picture (Nazé et al., 2019). X-ray data were here also taken in two very different situations: as the disk had nearly completely disappeared (H equivalent width of –1.7Å) and as the emission associated to the disk was strong (equivalent width of –23Å, with a disk size five times larger). Here too, simultaneous variations in broad-band photometry were recorded. The first X-ray observation was a single XMM-Newton snapshot but the second observing campaign corresponds to a set of short exposures taken by Swift over 250 d (i.e. three orbital cycles). There was no obvious relation between the X-ray parameters derived from individual Swift exposures and the orbital phase or between them and the disk fluctuations of Aqr as traced by H line strength (Nazé et al., 2019). To readdress this issue, we now combine the Swift exposures with the on-line tool777https://www.swift.ac.uk/user_objects/ to get a single, higher-quality spectrum. We fit it in the same way as done for the XMM-Newton spectrum in Nazé & Motch (2018), see Table 3 for results. While the short Swift exposures show individual fluxes varying by a factor of a few, as usual for the short-term intrinsic variations of Cas stars (Nazé et al., 2019), the flux of the combined Swift dataset appears to be 50% higher than in the XMM-Newton data. This change is due to the increase of the hard X-ray flux, leading to a variation of the hardness ratio from 3.6 to 6.1. However, it is important to stress that the hard component was very clear and strong at all times. The Cas character thus never disappeared for Aqr.
The third Cas star that has been simultaneously monitored at optical and X-ray wavelengths is Cas itself. Motch et al. (2015) reported a good correlation, without any time lag, between averages over optical observing seasons of X-ray fluxes measured by RXTE and of disk brightnesses as traced by -band magnitudes. Moreover, variations with timescales near 70 d were found in both wavelength ranges. Recently, Rauw et al. (in prep) reported on a set of XMM-Newton observations taken during an eruption event (with H equivalent width transitioning from –45Å to nearly –55Å and then back to the initial value). They compared the high-energy emission then observed to that recorded in older XMM-Newton observations when the disk emission was significantly lower (H equivalent width ranging from –27 to –35Å). Both flux and hardness variations are observed in the X-ray range. Besides the usual short-term “flaring” activity, the mean flux of each XMM-Newton observation varied by a factor of two. The hardness ratio was similar in six out of the ten observations () and three more observations displayed values rather close to that, despite the different strength of the H line at these nine dates. However, the X-ray spectrum clearly was hardest () and faintest at the time of the maximum emission. This variation stems from the soft X-rays (the soft flux changed by a factor of 3–4), most probably because of a larger absorption. Such characteristics are reminiscent of the localized absorbing events reported by Hamaguchi et al. (2016) and Smith & Lopes de Oliveira (2019), of which this event would then be an extreme case. Indeed, the next exposure, taken only a month later when the H emission was still very strong, did not display those features. It can nevertheless not be totally excluded that the observed change is a direct high-energy reaction to the disk event. In any case, there was no obvious correlation between the H emission and the X-ray properties during this event or at previous epochs of XMM-Newton observations. Finally, it may be noted that no significant change in -band photometry was detected during this recent emission event.
HD 119682 and V767 Cen add to this picture of constrasting behaviours. The X-ray flux of HD 119682 displayed long-term variations by a factor of two, but the hardness of the emission remains stable ( in all XMM-Newton data). In particular, the Cas characteristics were still present when the optical spectrum showed no trace of emission (H equivalent width of 1.3Å). For V767 Cen, the disk never disappeared entirely: when it seemed on the edge of doing so (at an H equivalent width of Å), the H emission suddenly increased. At X-ray wavelengths, however, the spectral properties show little change, both in flux and hardness.
In summary, three disk disappearances (or near-disappearances) were monitored, for HD 45314 (O9pe), Aqr (B1Ve), and HD 119682 (B0Ve). In all cases, a lower X-ray flux than observed before was measured at these times. However, the amplitude of the flux change wildly varied (an order of magnitude for HD 45314, about a factor of two for the other two). The hardness variations are even more different: HD 45314 had such a low hard X-ray emission that it formally lost its Cas character, the hardness of Aqr decreased but the star still fulfilled the criteria to remain a Cas analog, and HD 119682 kept the hardness measured before. This suggests the existence of a link, but a loose one, between the H emission of the disk and X-ray emissions.
In parallel, two disk “flarings” were monitored, for Cas and V767 Cen. They were qualitatively very different, as the disk of Cas was already strong when it became stronger while that of V767 Cen was on the edge of disappearance when a disk re-building was detected. However, apart from a single XMM-Newton exposure of Cas, there was no large change of X-ray properties recorded in both stars. It is important to note that, for both stars, broad-band photometry showed no specific trace of flaring at the time of the recorded events (see above for V767 Cen, and see Rauw et al. in prep for Cas).
4.2 The case of Be-XRBs
What do these monitoring results tell us on the generation of X-rays in Cas stars? To shed light on this issue, a comparison with the usual behaviour of Be stars in X-ray binaries (XRBs) should be done. In such systems, the X-ray variability is often classified in two categories. Type I outbursts occur at specific orbital phases, when accretion is enhanced at periastron passages, while type II outbursts are rather linked to major disk changes, often after some reaction delay (e.g. Grundstrom et al., 2007; Camero-Arranz et al., 2012; Lutovinov et al., 2012; Alfonso-Garzón et al., 2017). Most systems remain X-ray quiet when the Be disk is small or has disappeared (Negueruela et al., 2001) although a few systems have undergone type II outbursts even in such conditions (Monageng et al., 2017).
The X-ray observations of Cas analogs have not revealed any outburst up to now, hence their closer analogs amongst X-ray binaries may be the low-eccentricity systems such as X Per. From a long monitoring of this system, Zamanov et al. (2019) found a direct correlation, without time lag, between the X-ray flux and the equivalent width of the H line. However, this occurred only when the emission was very strong, i.e. for a large disk. At lower emission levels, the situation was clearly different, with the -band photometry varying first, then the (H), and at last the X-ray flux, after years of delay. This can be understood recalling that the accretion material comes from the outer parts of the disk: if the disk is small, it will take some time for such an inner variation to change the accreting conditions near the companion while any variation at the periphery of a large disk, hence closer to the companion, will have a direct impact on the accretion flow.
4.3 Constraints on the Cas phenomenon
The Cas monitorings provide two important clues. First, the Cas character remained for Aqr, HD 119682, and V767 Cen even when the H emission was very weak. Of course, the current H data does not enable us to conclude that the disk had entirely disappeared, even in the case of HD 119682. Indeed, though H is certainly a powerful diagnostics for the presence of a circumstellar disk, the line forms over a rather wide radial extent and is much less sensitive to the innermost and outermost parts of the disk. However, it is certain that the disk size was much reduced at these times. In fact, the size of the disk can be evaluated from the peak separation in double-peaked profiles using (Huang, 1972; Hummel & Vrancken, 1995; Zamanov et al., 2019). The projected rotational velocities are 100 and 200 km s-1 for V767 Cen and HD 119682, respectively (Zorec et al., 2016). The peak separation were measured each time the profile appeared double-peaked and this yielded disk sizes of a few for HD 119682 and 10–30 for V767 Cen. Comparable values were found for HD 45314 (Rauw et al., 2018) and Aqr (Nazé et al., 2019). The disk sizes can also be evaluated from the s (see Eq. (3) in Zamanov et al., 2019) but the application of the formula can be debated for such small values (the largest measured here is around 10Å). However, Reig et al. (2016) also found that the disk sizes must be small for such low . In our cases, the disks are thus smaller than usually found in active states of Be-XRBs (see also Fig. 5 of Zamanov et al., 2019). In any case, any compact companion would need to be very close for significant accretion (hence significant hard X-ray emission) to occur: if Å then d, see Coe & Kirk (2015). For a Be star mass of 12 M⊙ and a Oe star mass of 20 M⊙, a neutron star mass of 2 M⊙, and a d, the velocity amplitudes would be larger than 15–20 km s-1, which is not detected for HD 119682, V767 Cen, or HD 45314 (Rauw et al., 2018; Nazé et al., 2021). For Aqr, the known orbital period is 84 d, with a disk much smaller than the orbital separation (Nazé et al., 2019, and references therein). The current data thus seem to disfavour scenarios involving accreting companions.
Second, the X-ray emission seems to react differently depending on the extent of the disk changes. Indeed, optical photometry and spectroscopy probe different zones of the disk: the stellar photometry is more sensitive to the densest and innermost parts of the disk, while the H line rather probes the disk over a larger region, up to its periphery. In Cas, HD 45314 and Aqr, variations of the X-ray emission were spotted when both broad-band photometry and H line profile changed. In contrast, the recent “events” in Cas and V767 Cen were detected through H measurements but both X-ray properties and optical broad-band photometry remained unaffected. All this may be a hint that the hard X-ray emission that characterizes the Cas phenomenon is born in the inner disks of the Be stars, rather than at their periphery.
The observed optical and X-ray behaviours of Cas analogs therefore reveal that the Cas character may remain even if the disk size is much reduced and that changes in X-rays are usually seen only if broad-band photometric variations occurred. This is difficult to reconcile with a crucial role of distant companions, and seems to bring support to the magnetic star-disk interactions where X-rays are generated closer to the Be star (Robinson et al., 2002). The differences observed between Cas analogs could then result from a range of reasons such as varying inclinations, stellar rotation, and stellar temperatures. For example, the hotter Oe star HD 45314 should have a stronger wind and a faster disk disappearance (Kee et al., 2016). In contrast, the disk of the cooler Be stars would take more time to disperse, hence re-building events would have time to occur and a full disk disappearance may be more difficult to get. With the inner parts of the disk still in place, the Cas character would then still be observable. Nevertheless, no full modelling of the star-disk interaction is available yet, hence it is difficult to exactly quantify its adequacy. Future modelling should explore the specific impact of geometry and stellar properties.
5 Summary and conclusion
The H line in Be stars is considered as one of the main probes of their disks. We have monitored this line for two Cas analogs, HD 119682 and V767 Cen, for several years. Both stars displayed decreasing line strengths, although interrupted by several short re-building events. The discovery of this behaviour triggered X-ray observations, to assess the impact of the disk changes on the peculiar high-energy emission of those stars.
For HD 119682, the H line was fully in absorption in mid-July 2020. In parallel, the X-ray flux slightly decreased between August 2019 and March 2021, with no change in hardness. The flux level was comparable to that recorded a decade before in a previous X-ray exposure. The Cas character remained clear at all epochs.
V767 Cen was monitored during a disk re-building event and no significant change in X-ray flux or hardness was detected. In parallel, ASAS-SN photometry in the visible range also appeared to remain stable.
The limited reaction to large H variations and the presence of the Cas character even with a weak H line, coupled to a stable photometry, seems to disfavour scenarios involving an X-ray source located far out in the disk, close to a companion, and rather hints at an X-ray generation closer to the Be star.
These results brought important clues regarding the Cas phenomenon, but of course much remains to be done. In particular, the optical and X-ray monitorings should continue, to exclude large time delays and/or to analyse the X-ray behaviour during long (and complete) disk disappearances. Also, while the disk clearly plays some role in the appearance of the Cas phenomenon (since all Cas are Be stars), it remains to be clarified why most Be stars are not Cas in character.
Acknowledgements
We thank Dr N. Schartel for granting us a DDT observation of V767 Cen, and the Swift team for their help. We also thank Myron Smith for his comments and our useful discussions. Y.N. and G.R. acknowledge support from the Fonds National de la Recherche Scientifique (Belgium), the European Space Agency (ESA) and the Belgian Federal Science Policy Office (BELSPO) in the framework of the PRODEX Programme (contracts linked to XMM-Newton and Gaia). ADS and CDS were used for preparing this document.
Data availability
The ESO, Swift, Chandra, and XMM-Newton data used in this article are available in their respective public archives, while the Australian optical amateur spectra are available in the public BeSS database (http://basebe.obspm.fr/basebe/). The Brazilian amateur data are available upon reasonable request.
References
- Alfonso-Garzón et al. (2017) Alfonso-Garzón, J., Fabregat, J., Reig, P., et al. 2017, A&A, 607, A52. doi:10.1051/0004-6361/201630211
- Asplund et al. (2009) Asplund, M., Grevesse, N., Sauval, A.J., & Scott, P. 2009, ARA&A, 47, 481
- Camero-Arranz et al. (2012) Camero-Arranz, A., Finger, M. H., Wilson-Hodge, C. A., et al. 2012, ApJ, 754, 20. doi:10.1088/0004-637X/754/1/20
- Coe & Kirk (2015) Coe, M. J. & Kirk, J. 2015, MNRAS, 452, 969. doi:10.1093/mnras/stv1283
- Feldmeier et al. (1997) Feldmeier, A., Puls, J., & Pauldrach, A. W. A. 1997, A&A, 322, 878
- Grundstrom et al. (2007) Grundstrom, E. D., Boyajian, T. S., Finch, C., et al. 2007, ApJ, 660, 1398. doi:10.1086/514325
- Hamaguchi et al. (2016) Hamaguchi, K., Oskinova, L., Russell, C. M. P., et al. 2016, ApJ, 832, 140. doi:10.3847/0004-637X/832/2/140
- Huang (1972) Huang, S.-S. 1972, ApJ, 171, 549. doi:10.1086/151309
- Hummel & Vrancken (1995) Hummel, W. & Vrancken, M. 1995, A&A, 302, 751
- Kee et al. (2016) Kee, N. D., Owocki, S., & Sundqvist, J. O. 2016, MNRAS, 458, 2323. doi:10.1093/mnras/stw471
- Langer et al. (2020) Langer, N., Baade, D., Bodensteiner, J., et al. 2020, A&A, 633, A40. doi:10.1051/0004-6361/201936736
- Lutovinov et al. (2012) Lutovinov, A., Tsygankov, S., & Chernyakova, M. 2012, MNRAS, 423, 1978. doi:10.1111/j.1365-2966.2012.21036.x
- Monageng et al. (2017) Monageng, I. M., McBride, V. A., Coe, M. J., et al. 2017, MNRAS, 464, 572. doi:10.1093/mnras/stw2354
- Motch et al. (2015) Motch, C., Lopes de Oliveira, R., & Smith, M. A. 2015, ApJ, 806, 177
- Murakami et al. (1986) Murakami, T., Koyama, K., Inoue, H., & Agrawal, P. C. 1986, ApJ, 310, L31
- Nazé & Motch (2018) Nazé, Y., & Motch, C. 2018, A&A, 619, A148
- Nazé et al. (2019) Nazé, Y., Rauw, G., & Smith, M. 2019, A&A, 632, A23. doi:10.1051/0004-6361/201936307
- Nazé et al. (2020) Nazé, Y., Rauw, G., & Pigulski, A. 2020, MNRAS, 498, 3171. doi:10.1093/mnras/staa2553
- Nazé et al. (2021) Nazé, Y., et al. 2021, MNRAS, in press (arxiv:2111.09579)
- Negueruela et al. (2001) Negueruela, I., Okazaki, A. T., Fabregat, J., et al. 2001, A&A, 369, 117. doi:10.1051/0004-6361:20010077
- Postnov et al. (2017) Postnov, K., Oskinova, L., & Torrejón, J. M. 2017, MNRAS, 465, L119
- Rakowski et al. (2006) Rakowski, C. E., Schulz, N. S., Wolk, S. J., et al. 2006, ApJ, 649, L111. doi:10.1086/508350
- Rauw & Nazé (2016) Rauw, G. & Nazé, Y. 2016, Advances in Space Research, 58, 761. doi:10.1016/j.asr.2015.09.026
- Rauw et al. (2018) Rauw, G., Nazé, Y., Smith, M. A., et al. 2018, A&A, 615, A44. doi:10.1051/0004-6361/201731782
- Reig et al. (2016) Reig, P., Nersesian, A., Zezas, A., et al. 2016, A&A, 590, A122. doi:10.1051/0004-6361/201628271
- Robinson et al. (2002) Robinson, R. D., Smith, M. A., & Henry, G. W. 2002, ApJ, 575, 435. doi:10.1086/341141
- Safi-Harb et al. (2007) Safi-Harb, S., Ribó, M., Butt, Y., et al. 2007, ApJ, 659, 407. doi:10.1086/512055
- Smith et al. (2012) Smith, M. A., Lopes de Oliveira, R., & Motch, C. 2012, ApJ, 755, 64. doi:10.1088/0004-637X/755/1/64
- Smith et al. (2016) Smith, M. A., Lopes de Oliveira, R., & Motch, C. 2016, Advances in Space Research, 58, 782
- Smith & Lopes de Oliveira (2019) Smith, M. A. & Lopes de Oliveira, R. 2019, MNRAS, 488, 5048. doi:10.1093/mnras/stz2049
- ud-Doula & Nazé (2016) ud-Doula, A. & Nazé, Y. 2016, Advances in Space Research, 58, 680. doi:10.1016/j.asr.2015.09.025
- Zamanov et al. (2019) Zamanov, R., Stoyanov, K. A., Wolter, U., et al. 2019, A&A, 622, A173. doi:10.1051/0004-6361/201834697
- Zorec et al. (2016) Zorec, J., Frémat, Y., Domiciano de Souza, A., et al. 2016, A&A, 595, A132. doi:10.1051/0004-6361/201628760
Appendix A X-ray lightcurves