Extreme Variation in Star Formation Efficiency Across a Compact, Starbursting Disk Galaxy
Abstract
We report on the internal distribution of star formation efficiency in IRAS 08339+6517 (hereafter IRAS08), using 200 pc resolution CO(2-1) observations from NOEMA. The molecular gas depletion time changes by 2 orders-of-magnitude from disk-like values in the outer parts to less than 108 yr inside the half-light radius. This translates to a star formation efficiency per free-fall time that also changes by 2 orders-of-magnitude, reaching 50-100%, different than local spiral galaxies and typical assumption of constant, low star formation efficiencies. Our target is a compact, massive disk galaxy that has SFR 10 above the main-sequence; Toomre and high gas velocity dispersion ( km s-1). We find that IRAS08 is similar to other rotating, starburst galaxies from the literature in the resolved relation. By combining resolved literature studies we find that distance from the main-sequence is a strong indicator of the Kennicutt-Schmidt powerlaw slope, with slopes of for starbursts from 100-104 M⊙ pc-2. Our target is consistent with a scenario in which violent disk instabilities drive rapid inflows of gas. It has low values of Toomre-, and also at all radii the inflow timescale of the gas is less than the depletion time, which is consistent with the flat metallicity gradients in IRAS08. We consider these results in light of popular star formation theories, in general observations of IRAS08 find the most tension with theories in which star formation efficiency is a constant. Our results argue for the need of high spatial resolution CO observations are a larger number of similar targets.
Subject headings:
galaxies: evolution — galaxies: star formation — galaxies: starburst —galaxies: individual(IRAS08339+6517 (catalog ))1. Introduction
The connection between gas and star formation rate in galaxies, either measured as the depletion time or the star formation efficiency, provides direct test to star formation theories and is a direct input to models of galaxy evolution (for review Kennicutt & Evans, 2012; Tacconi et al., 2020; Hodge & da Cunha, 2020). The last decade has had a wealth of such studies in large disk galaxies of the local Universe (e.g. Bigiel et al., 2008; Leroy et al., 2008; Rahman et al., 2012; Leroy et al., 2013; Fisher et al., 2013; Utomo et al., 2017; Leroy et al., 2017). Local Universe studies find that in the main bodies of disks (R) the ratio of molecular gas to star formation rate (SFR) surface density, the so-called depletion time, is consistently found to be 1-2 Gyr with statistically significant scatter at the 0.3 dex level. This behavior extends into atomic gas dominated regions of galaxies (Schruba et al., 2011). Utomo et al. (2017) reports a trend toward lower in the central 10% of the galaxy disk in 14 of 54 galaxies from the CARMA-EDGE survey, yet this variation is rarely larger than a factor of . In general the picture of star formation in the disks of is for the most part a regular process, with variation in molecular gas depletion time typically no greater than the 0.3 dex level.
We know much less about the resolved relationship between gas and SFR surface density in starbursting systems, which are typically found in either advanced stage mergers or turbulent disks of the Universe. Pioneering observations have been made of gas mostly in the brightest star-bursting systems at (e.g. Genzel et al., 2013; Hodge et al., 2015; Swinbank et al., 2011; Chen et al., 2017; Tadaki et al., 2018; Sharon et al., 2019). Unlike like with local spirals, the combined data set of these individual target studies does not show a simple single power-law in the 1 kpc resolved relationship between and , nor is always found to be constant inside disks (e.g. Hodge et al., 2015; Tadaki et al., 2018). The few observations we have imply a far more complex picture at the peak of cosmic star formation. Recently, kiloparsec-scale resolved observations of advanced stage mergers have found a range molecular gas depletion times that are typically shorter than in local spirals (Saito et al., 2015, 2016; Bemis & Wilson, 2019; Wilson et al., 2019), and the relationship between and is steeper than unity. However, as a class it is critical to consider the diversity of merger stages when considering its gas and star-formation content (Sanders & Mirabel, 1996; Combes et al., 1994; Larson et al., 2016). Espada et al. (2018) finds that for wide separation merging systems this relationship can be shallower than in local spirals, and the depletion time can be longer toward galaxy centers.
In the local Universe recent technical advances now make it possible to measure the star formation efficiency per free-fall time,
| (1) |
at spatial scales of 100 pc in nearby galaxies (Leroy et al., 2015; Hirota et al., 2018; Utomo et al., 2018). When isolating the star forming regions it is typically safe to assume that the gas mass surface density, , can be approximated by the molecular gas mass surface density, and therefore later in this work we will use as an approximation of the star forming gas. The star formation efficiency per free-fall time takes the three-dimensional shape of the cloud through the estimation of the free-fall time,
| (2) |
Where is the volume density of the region being measured. Utomo et al. (2018) measures in local spirals at pc resolution with a method that is similar to what we use. They find a typical %. Detailed studies of nearby spiral galaxies M 51 (Leroy et al., 2017) and M 83 (Hirota et al., 2018) find low values, consistent with Utomo et al. (2018). Yet, those studies also show there may be systematic variation in the values of at the 0.3 dex level, suggesting a completely universal value may not be a correct assumption.
The amount of variation of both from galaxy-to-galaxy and within galaxies is important to star formation models. A number of theories make the explicit assumption that star formation proceeds at a constant, “low” efficiency with % (Krumholz et al., 2012; Salim et al., 2015). Other theories that do not explicitly assume this find very little variation in simulations (Shetty & Ostriker, 2012; Kim et al., 2013). If varies significantly in different types of galaxies, this would limit the applicability to those theories. Some theory and simulation predict that in very active regions, with very dense clouds, the efficiency can reach 10-30% (Murray et al., 2010; Faucher-Giguère et al., 2013; Grudić et al., 2019).
In this paper we present a map of CO(2-1) with 200 pc resolution in a starbursting face-on galaxy, IRAS08339+6517. The galaxy exhibits many properties in stellar populations, structure and kinematics that are similar to compact, turbulent disks more commonly found at . We measure the internal distribution of and , as well as the 1 kpc resolved star-formation law, and consider these results in light of star formation models.
2. Methods
2.1. CO Observations and Molecular Gas Mass
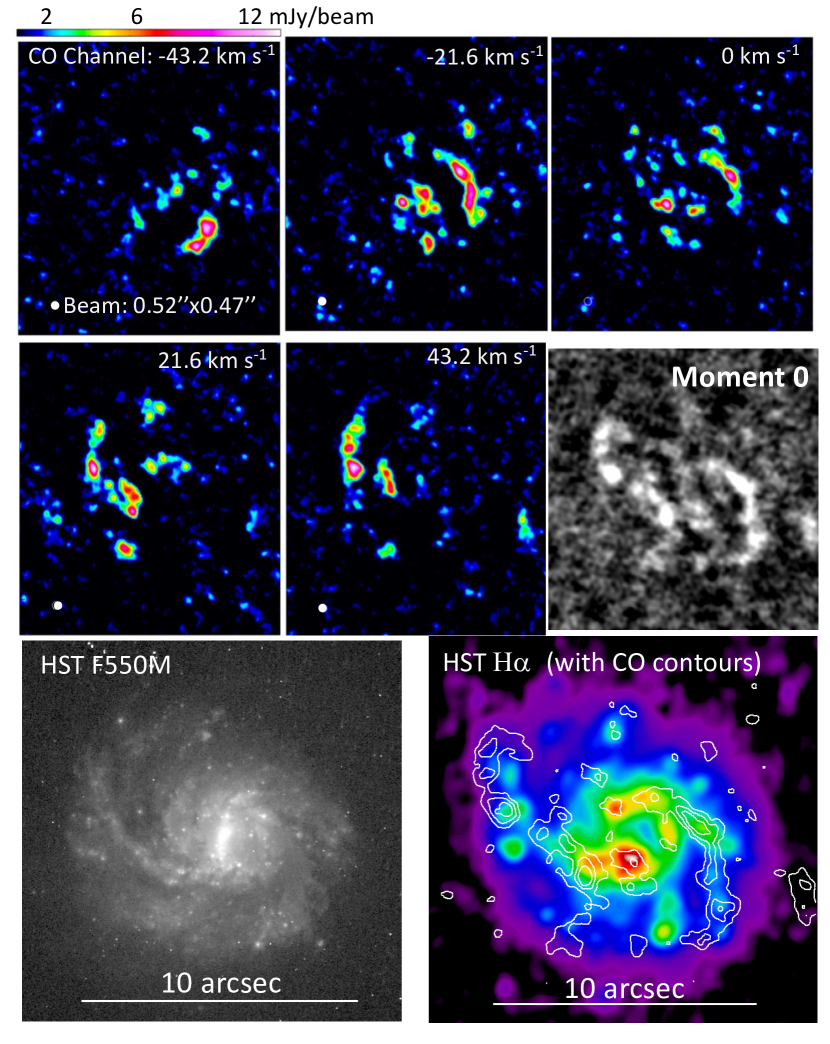
We obtained CO(2-1) observations (Fig. 1) with the NOrthern Extended Millimeter Array (NOEMA). All observations use the new PolyFiX correlator tuned to sky frequency of 226.215 GHz in USB with a channel width of 2.7 km s-1 utilizing all 9 antennas. IRAS08 was observed for 13 hours in A configuration on 18-Feb-2018, and on 01-Apr-2018 for 5.5 hr in C-configuration. By including the C-configuration data, and also considering the relative compactness of our source, we are likely not missing a significant amount of low-spatial frequency data, and are rather more strongly affected by point source sensitivity. The maximum recoverable scale of the C-configuration data is 6 arcseconds, which corresponds to 2.5 kpc. We can compare this to the half-light radius of the starlight, which is kpc, or roughly 2.5 arcseconds. We should therefore recover twice the half-light radius of the stars.
Observations were calibrated using GILDAS routines in CLIC, and then cleaned with the MAPPING pipeline routine during an on-site visit to IRAM. We achieve a point source sensitivity of 1.4 mJy beam-1 in 20 km s-1 of bandwidth, and beam size of arcsec2 ( pc2).
In this paper we consider two scenarios for CO-to-H2 conversion. First, we use the standard Milky Way conversion of M⊙ (K km s-1 pc-2)-1 and a line ratio of =CO(2-1)/CO(1-0) = 0.7 (). The metallicity (0.7 Z⊙, López-Sánchez et al., 2006) and morphology (Fig. 1) both suggest a Milky Way like conversion factor. Second, the large IR flux ratio, (Wiklind, 1989) suggests a value of M⊙ (K km s-1 pc-2)-1 (Magnelli et al., 2012). We find a total molecular gas mass of 2.1 M⊙, using the Milky Way CO-H2 conversion factor. This is similar to the total flux estimated from single dish observations by Wiklind (1989), and we are thus not likely missing significant amounts of flux.
Using the kinematics from Cannon et al. (2004) observations of HI gas we can estimate the total mass of the system. There is, however, an added source of uncertainty in that the disk is relatively face-on, which makes estimating the circular velocity uncertain by the inclination angle. Moreover, the large radius HI gas is interacting with a companinion (described below) and is likely not a good indicator of the total mass. Nonetheless, we can determine if derived mass from CO strongly disagrees with this, as a sanity check on our measurement. The velocity of the HI does cleanly assymptote to a flat curve, but rather turns around at 15 kpc due to the interaction. It is not clear what appropriate to assume. We opt for a value closer to the galaxy of kpc, though we note that total mass depends strongly on , and even slightly larger values give significantly larger total masses. We assume an inclination angle of 20o based on the average of the F550M isophotes. Using the HI kinematics derived in López-Sánchez et al. (2006) and a galaxy size of kpc, based on the star light. This gives a total mass of M⊙. The total stellar mass is M⊙ (described below). Cannon et al. (2004) finds that the HI mass associated to the galaxy of IRAS08 is M⊙. Therefore, our derived molecular gas mass of 2.1 M⊙ is roughly consistent with kinematic observations.
We note that even the bimodal assumption of as either Milky Way value or star burst may be an over-simplification for high galaxies. These galaxies may possibly have an that varies with local mass surface density (Narayanan et al., 2011; Bolatto et al., 2013a). In the text, we will consider the impact of this on our results.
We measure the resolved properties of the CO(2-1) map using the moments of the data cube. These are measured on the 2.7 km s-1 spectral resolution data cube, and the spaxels are binned to 0.51 arcsec, matching the circularised FWHM. We use an interpolation intended to conserve flux when regridding. We check this by measuring the flux in an identical circular region 6 arcsec in radius. We find the flux is the same to 99%. Using the CASA task immoments we determine the integrated intensity, velocity and velocity dispersion of the CO(2-1) line in each resolution element. To calculate the velocity moments we only include data with , and in a region of the spectrum that is restricted to contain the emission line of the galaxy.
2.2. Resolved Star Formation Rate
To measure the star formation (SFR) in IRAS08 we use H image produced from Hubble Space Telescope observations (Östlin et al., 2009), convolved to the beam of our CO observations. Continuum subtraction was performed by modelling the stellar continuum with multi-band photometry (Hayes et al., 2009). The measurement uncertainty of H flux for individual clumps is less than 1% in all cases.
We determine the extinction by stellar population fits using the CYGALE (Boquien et al., 2018) fitting code to HST/ACS image filters SBC F140LP , HRC F220W, HRC F330W, WFC F435W, and WFC F550M. We measure, and correct for, the extinction in individual regions that are set to match the resolution of the CO(2-1) map. Averaged over the whole galaxy our fits recover A mag, which similar to previous results using line ratios (Leitherer et al., 2002; López-Sánchez et al., 2006; Östlin et al., 2009). To correct the H+[NII] narrow-band images to H, we use the median [NII]/H ratio from the longslit data in López-Sánchez et al. (2006), which is [NII]/H%. This is consistent with expectations for a moderately low metallicity galaxy (Kewley et al., 2019).
To convert the ionized gas flux to SFR we use the calibration (Hao et al., 2011) , where is the extinction corrected luminosity of H gas in units of ergs s-1, which assumes a Kroupa IMF.
A particular concern in deriving resolved star formation rates of both LIRG and UV bright galaxies is the possible presence of AGNs in the central parts of the galaxy. There have been a number of works that have analysed the optical and UV spectra of IRAS08, which we can use to motivate our interpretation of the H flux as coming from star formation. Otí-Floranes et al. (2014) carries out extensive modelling of the X-ray, UV and optical data from the center of IRAS08, and finds it consistent with a super-star cluster with age 4-5 Myr. Similar, López-Sánchez et al. (2006) does not find elevated, nonthermal line ratios in the galaxy center with respect to the rest of the galaxy. Similarly, in out KCWI data (described below) we do not see a significant change in line ratios, for example [OIII]/H, in the galaxy center that would suggest the driving mechanism of the emission line is changing. We find that [OIII]/H in the galaxy center is similar to that of the outer disk, at the 0.1-0.2 dex level. Future observations that can compare directly [OIII]/H to [NII]/H would be definitive, see Kewley et al. (2019) for recent review. Nonetheless, at present there is not any evidence to suggest a prominent AGN in the center of IRAS08.
2.3. Metallicity Measurement
In this paper we will use the metallicity profile as a signature of possible gas inflows (Kewley et al., 2010). To calculate the metallicity in IRAS08 we use [OII], [OIII] and H observations take from the Keck Cosmic Web Imager (Morrissey et al., 2018). The galaxy was observed for 20 minutes, using the BM grating in Large Field mode with two central wavelength settings of 405 & 480 nm. Data was reduced with standard KCWI pipeline methods111https://github.com/Keck-DataReductionPipelines/KCWI_DRP/ using in-frame sky subtraction. Before the sky subtraction step, we masked out all galaxy continuum and emission features for accurate sky estimates. Field-of-view of the Large slicer is 33”20.4”. KCWI is seeing limited and spaxels have a dimensions of 0.71.35 arcsec2 (279600 pc2).
The metallicity was derived in each spaxel using the so-called R23 method, as described in Kobulnicky & Kewley (2004). The metallicity of IRAS08 is near the branching point of the R23-metallicity calibration. We therefore take an iterative approach to solving for metallicity. We start by assuming that each spaxel is on the “upper branch” () and solve for the metallicity. If the derived metallicity is less than 8.5, we then recalculate that spaxel on the lower branch. This is carried on for a 3 iterations. We then re-do the procedure starting on the lower branch. We find that the absolute value of the metallicity changes by dex depending on the branch choice, but the gradient of the metallicity across the disk is the same whether we start on the upper or lower branch. We restrict our analysis to the gradient of metallicity, and only make direct, quantitative comparison to other measurements using the same emission lines, as different metallicity indicators may yield different gradients.
3. Properties of IRAS08339+6517
IRAS08339+6517 (hereafter IRAS08) is a face-on galaxy with redshift of , which translates to a luminosity distance of 83 Mpc. The galaxy is known to be UV-bright, compact, and have young stellar populations (Leitherer et al., 2002; López-Sánchez et al., 2006; Overzier et al., 2008). The global mass-weighted age of IRAS08 is quite young compared to local spirals with published age estimates varying between 10-50 Myr (Leitherer et al., 2002; López-Sánchez et al., 2006). In this section we discuss the resolved properties of the gas morphology and kinematic state of IRAS08, with emphasis on how IRAS08 is an outlier for local galaxies, and often is more similar to galaxies at . We also discuss the interaction that IRAS08 is experiencing with a distant, smaller companion galaxy.
The basic properties described in this section are summarized in Table 1.
3.1. Total Mass, Size and SFR
Using the optical colors from López-Sánchez et al. (2006), and assuming a Kroupa IMF, we estimate a K-band mass-to-light ratio of 0.3-0.4, depending on the model assumptions (Bell, 2003; Zibetti et al., 2009). Using the K-band magnitude of 11.88 mag and log()0.35, the total stellar mass of IRAS08 to be 1.1 Msun.
The size of the galaxy is determined by measuring the surface photometry of the F550M ACS/WFC image, which is roughly V-band. We use the same software and technique as developed in Fisher & Drory (2008). We find that the half-light radius of IRAS08 is 2.54 arcseconds, which translates almost exactly to 1.0 kpc. This makes IRAS08 a 2-3 outlier toward smaller sizes (more compact) than what is expected from the relationship measured on galaxies (Mosleh et al., 2013). We can also compare the size of IRAS08 to local Universe galaxies of similar IR brightness. Arribas et al. (2012) finds that LIRGS in general have a median H half-light radius of 2 kpc. They show that the largest LIRGs are pre-coalescence systems, like IRAS08, the median H half-light radius of pre-coalescence LIRGs is closer to kpc. IRAS08 is thus more compact than the median LIRG, especially those that are pre-coalescence.
| Total Stellar Mass | 1.1 M⊙ |
|---|---|
| Total SFR | 12.1 M⊙ yr-1 |
| Stellar | 1 kpc |
| Molecular Gas Massa | 2.1 M⊙ |
| HI Gas Mass | 1.1109 M⊙ |
| Molecular gas velocity dispersion | 25 km s-1 |
| Molecular gas depletion time | 0.12 Gyr |
| SFR/SFRMS | 12 |
| Toomre | 0.5 |
We estimate the total SFR using the integrated H luminosity of 1.8 erg s-1 and (Östlin et al., 2009). Using the calibration from Hao et al. (2011), assuming a Kroupa IMF, we find SFR=12.1 M⊙ yr-1. Sanders et al. (2003) finds a 25 m flux of 1.13 Jy. We can thus also estimate the total SFR from the combined H and 25 m fluxes using the calibration from Kennicutt et al. (2009), which gives a very similar value of 11.1 M⊙ yr-1. For consistency with resolved SFR measurements we will use the H only value for calculations. The SFR for IRAS08 is 12 times the value of the main-sequence for a similar mass galaxy (Popesso et al., 2019).
The global, galaxy-averaged molecular gas depletion time of Gyr. Tacconi et al. (2018) find a relationship between offset from the main-sequence such that . For and , this translates to a value of 0.33 Gyr. Interestingly, in spite of its many idiosyncrasitic properties, IRAS08 is behaving similar to other star-bursting galaxies (in terms of ).
The molecular gas fraction for IRAS08 is . This gas fraction is in the top 95th percentile of gas rich galaxies in the local Universe, using COLD GASS survey as a benchmark (Saintonge et al., 2011).
3.1.1 Large Gas Velocity Dispersion & Low Toomre Q
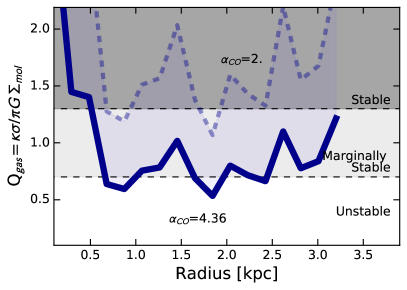
Here we discuss the internal kinematic state of IRAS08. In IRAS08 we find through direct, resolved measurement that the disk is consistent with being marginally stable to unstable (), and has elevated molecular gas velocity dispersion, compared to local spirals, across all radii.
The stability of a self-gravitating disk is characterised by Toomre’s (Toomre, 1964; Binney & Tremaine, 1987), where
| (3) |
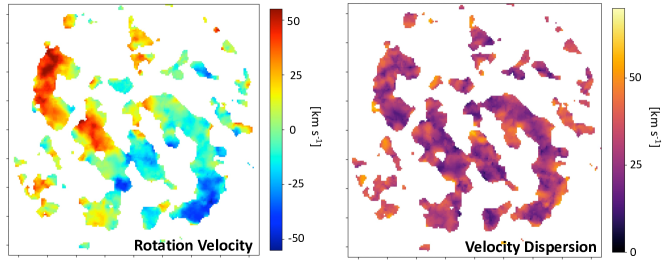
The quantity is the epicyclic frequency. We measure it directly as . We determine the velocity, , by fitting the flat disk model, , to the velocity map, shown in Fig. 2. We assume an inclination of 20o based on the average ellipticity of the isophotes in F550M image. We note that for low inclination galaxies the rotation field is particularly uncertain, and should not be used on its own be a deciding factor in determining the physical state of the galaxy. We take the value only as one aspect of the IRAS08. The velocity dispersion, , is measured from the CO moment map. An infinitely thin disk is considered unstable if . Disks of non-zero thickness, like those with high velocity dispersion, are unstable if (Romeo et al., 2010).
In IRAS08 we find that the median , assuming the Milky Way . In Fig. 4 we show that remains marginally unstable across all radii except the very center of the galaxy, where becomes very large. Though may seem extreme by local Universe standards, we reiterate that for galaxies with a thicker disk, as indicated by high gas velocity dispersion, the critical value of stability using Equation 3 is 0.7. Moreover, this value of is similar to the values of in the DYNAMO galaxies (Fisher et al., 2017a), which have similarly high SFR and gas content. Moreover, it is essentially the same calculation using CO kinematics and surface density as observations of a CO disk at both (Genzel et al., 2013) and (Tadaki et al., 2018), and find a very similar value of . Conversely, Toomre- measured on local spirals produces (Leroy et al., 2008) over a wide-range in radius. For IRAS08, the assumption of lower , motivated by the high dust temperature, still keeps the galaxy in the “stable” regime. It remains lower than values seen in THINGS survey spiral galaxies.
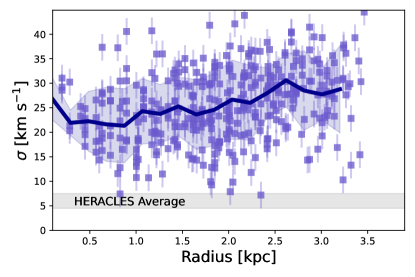
In Fig. 4 we show that the galaxy averaged velocity dispersion in IRAS08 is km s-1 with a root-mean-squared deviation (RMS) of km s-1. The velocity dispersion is taken from the moment map, with the channel width removed in quadrature. This however has a very small effect as the channels are less than 5% of the typical FWHM of the line. Because the galaxy is face-on, well resolved (200 pc), and has a relatively low rotation velocity the velocity gradient across individual spaxels due to rotation is small. Using the velocity model fit to the moment 1 map, we find that in the central resolution element the line dispersion introduced by velocity gradients is km s-1. This is calculated by taking the model fit to the velocity field and resampling it to match our beam size. The velocity field begins with an assumption of infinitely thin emission lines, and when sampled at the beam resolution the width reflects the range of velocities in the beam. Removing this in quadrature would alter the measured by less than 1 km s-1. We, therefore, do not make a correction for beam smearing as it is a small effect, and likely introduces its own systematic uncertainties.
Ianjamasimanana et al. (2012) find that the average CO velocity dispersion of galaxies in the HERACLES sample is 6 km s-1 with a standard deviation of 1.5 km s-1. The velocity dispersion of IRAS08 is 4 what is measured in local spirals, making it a 10 outlier. Work using stacking of CO spectra uncovers a secondary broad component of dispersion with km s-1 (Caldu-Primo et al., 2013). The unstacked velocity dispersion of IRAS08 remains a 3 outlier from the broad component in local spirals.
It is difficult to compare the velocity dispersions to that of LIRGS, as there are not many studies of the resolved gas velocity disperion, especially targeting molecular gas in LIRGS. Also, LIRGs represent a very diverse set of objects when considering morpho-kinematic properties (e.g. Larson et al., 2016), and it is, thus, challenging to make a well-posed comparison. Espada et al. (2018) makes similar resolution maps of two LIRGs with wide-seperation interactions. They found that varies much more in their targets than we find in IRAS08. In their targets the disk has a low dispersion, with km s-1 and the center is higher, 40 km s-1. Zaragoza-Cardiel et al. (2015) studies resolved kinematics in samples of interacting, though not advanced, merging galaxies. They find the intercting systems have a median km s-1. There is, therefore, a range of velocity dispersions in local Universe LIRGs galaxies and it is difficult to make any conclusive statement about the comparison.
3.2. Distant Interaction
There is a plume of HI gas that extends from IRAS08 in the direction of a nearby companion (Cannon et al., 2004). The stellar light of the companion galaxy is quite low compared to IRAS08(1/10-1/20; López-Sánchez et al., 2006) and the separation is 60 kpc. For this separation and mass ratio the merger classifications developed on GOALS sample galaxies (Larson et al., 2016) places IRAS08 in the minor-merger category. We do not observe signs that the interaction in IRAS08 (Cannon et al., 2004; López-Sánchez et al., 2006) is directly altering either the morphology or kinematics of IRAS08 inside the 90% radius of the F550M image. (1) The morphology of starlight (Fig. 1) does not, show signs of significant disturbances (such as in advanced mergers like Antennae galaxies). There is an asymmetry to the spiral arms. We measure the asymmetry value of 0.17-0.2 depending on whether we use the 50% or 90% radius, respectively. Conselice (2014) reviews galaxy morphology and finds asymmetries of 0.150.06 for typical late-type disks, and 0.320.19 for ULIRGs. IRAS08 falls in between the two values. It is on the high side, but within the distribution of late-type disks, and on the low-side of ULIRGS. It is below the range of asymmetries that are quoted as “typical” for starbursts. (2) The stellar light profile is well described as a smooth exponential decay (López-Sánchez et al., 2006). (3) The kinematics inside the radius of the galaxy are well-fit with a rotating disk model (Fig. 1). (4) There is not a significant off-center rise in the velocity dispersion. These are similar criteria as used in studies of galaxies at to classify mergers and rotating galaxies (e.g. Förster Schreiber et al., 2009; Genzel et al., 2011). Based on these observations, it does not appear appropriate to categorize IRAS08 with advanced stage mergers. The main impact of this interaction could be that it provides the disk of IRAS08 with a supply of gas that is of order the gas mass inside the disk M⊙ (Cannon et al., 2004). We note that the plume HI gas could be an outflow from the star burst of IRAS08, however, this would open the question as to why there is not a symmetric flow on the opposite side, as expected from biconical flows. In the Appendix we consider the interaction as possible driver of the properties of IRAS08, though we find it behaves differently than other galaxies with similar interaction parameters.
4. Spatial Variation in molecular gas depletion time
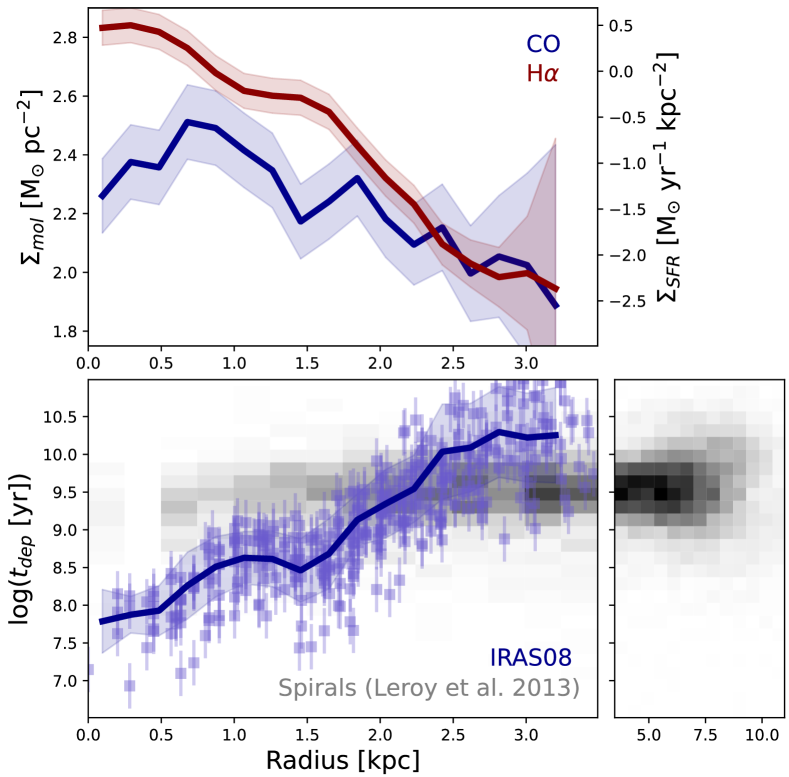
In this section we investigate the spatial variation of . We find that in IRAS08 is of order 1.5-2 dex lower in the galaxy center than the outer parts of the disk. In large samples of spiral galaxies the most extreme variation observed is only of order 0.5 dex (Utomo et al., 2017; Leroy et al., 2013).
In Fig. 5 we show that there is a clear gradient in within IRAS08 that is mush stronger than what is observed in HERACLES disk galaxies (Leroy et al., 2013). We find that increases from less than 0.1 Gyr in the central kiloparsec to greater than 3 Gyr at radii beyond the 80% radius of the star light (2.5 kpc). We measure a total gradient in the depletion time of Gyr kpc-1. The local increase in at kpc by 0.2 dex is associated with an H ring that contains high surface densities of CO. In Fig. 5 spirals are represented by HERACLES galaxies (Leroy et al., 2013). We measure a gradient in of HERACLES galaxies from 0 to 3 kpc of Gyr kpc-1. From 1-10 kpc the gradient is consistent with 0.
We find in IRAS08 that is more strongly coupled to than to . In the top panel of Fig. 5 we show the radially averaged profiles of and , the constituent components of . The profiles are plotted such that they overlap at large radius. The profile for , is to low order approximation decreasing with radius at all points to the edge of the disk. Conversely, molecular gas shows a peak at 0.8 kpc and decrease in the galaxy center. We measure a correlation coefficient and -value for both and . Of course both are strong correlations as they are circularly dependent, however we find that has a stronger correlation with and , where molecular gas surface density has and .
The mostly likely impact of systematic uncertainties in the measurement of would steepen the gradient of for IRAS08. Bolatto et al. (2013a) argues that for values above 100 M⊙ pc-2 (also see Sandstrom et al., 2013; Narayanan et al., 2011). This would lead to increasingly lower values of than what is shown in Fig. 5 at radii 2.5 kpc, and thus even lower values of . We can also consider missing low-spatial frequency emission from interferometic data. Though our NOEMA C-configuration observations likely assuage this, there could be an extremely flat distribution of CO gas that is filtered out by the interferometric observations. One would expect the low surface brightness extended emission to become more prominent at lower , i.e. larger radius, and thus this effect would also likely steepen the gradient of in IRAS08. The decrease in in the very center of the galaxy, from the ring at kpc inward, could be due to the presence of an AGN increasing the H flux. However, as we have discussed in the § 2.2, there is not strong evidence for non-thermal emission from the currently observed emission lines. Moreover, the rise in H flux in Fig. 5 covers an area that is larger than a single resolution element. Future, spatially resolved observations of the [NII]/H ratio, combined with our current KCWI data would allow us to definitively determine what is driving the emission in each resolution element of IRAS08. Also, in comparison to the global trend in , the central part of the gradient is only a very small change. Overall, our estimates of the gradient in err toward conservative estimates with respect to the systematic uncertainties.
We find that degrading the resolution acts to soften the gradient of in IRAS08. We convolved the IRAS08 data cube to 800 pc resolution (4 beams). This resolution is chosen to be more similar to the resolution of the HERACLES data, while still being sufficient to sample the small size of IRAS08. We find across the same radial range Gyr kpc-1. This is still nearly an order-of-magnitude steeper than what is observed in HERACLES disks, and the central 800 pc has in the range 60-140 Myr. Utomo et al. (2017) shows with a sample of spiral galaxies in the CARMA-EDGE that similarly the most common scenario is that profiles are flat. They measure the ratio of inside 1 kpc to the average of the rest of the disk, . The most common value is unity. The most extreme targets have . If we measure the same quantity in IRAS08 we find , implying a much steeper decline toward the galaxy center.
The radial gradient of in IRAS08 is therefore in the range of 7-20 larger than in a typical local Universe disk galaxy from the HERACLES survey, and reaches depletion times that are 30 lower in the galaxy center than in the region surrounding the 90% radius of the optical light.
5. Star Formation efficiency per free fall time in IRAS08
5.1. Estimating free-fall time
In IRAS08 we find values of vary across the disk. The central values are 3 Myr and largest are 12 Myr. The central values skew to lower values than observed in local spirals (Utomo et al., 2018), but outer parts are similar. We discuss below that the systematic uncertainties here are of order 0.2 dex, and is enough to affect the comparison with local spirals.
As defined in Equation 2, . Measuring the volume density at or near the scale of clouds introduces a significant source of uncertainty. We follow the common approach to let , where is the scale height. If the gravitational potential is balanced by the kinetic energy then one can estimate that , and thus . Since IRAS08 is near to face-on, we can safely assume that .
One must, however, account for all sources of pressure support, such as magnetic fields and cosmic rays. Multiple prescriptions for this exist in the literature. To generate an estimate of the systematic uncertainty, we consider three recent calculations of the scale-height, and hence density. That of Krumholz et al. (2018), their Equation 22, such that , and that of Wilson et al. (2019), their equation 7. Thirdly, we also consider the simple spherical-cloud assumption in which the galaxy has a constant disk thickness, and in each beam the gas is a sphere of radius pc, similar to other studies of star formation efficiency (e.g. Utomo et al., 2018).
The constant thickness assumption yields an average Myr with a standard deviation of 1.2 Myr. This is a factor of 2 shorter than the free-fall times measured in a similar fashion on local spirals (Utomo et al., 2018). The prescription used in Wilson et al. (2019) yields similar values of , with the constant thickness model on average shorter by a factor of 1.5-2. The method of Krumholz et al. (2018) gives larger values of , that are typically 3 what we estimate with the constant thickness model.
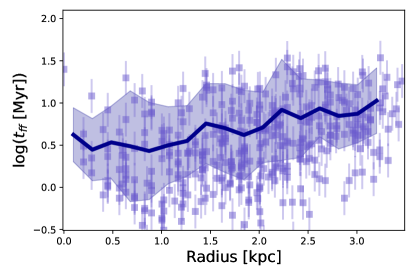
Those methods that estimate the scale-height with and both show an increase in by a factor of 3 from the center of IRAS08 to the outskirts, whereas the circular cloud model finds an increase of roughly . To study we adopt as described in Wilson et al. (2019) as this formulation is specifically derived for star-bursting environments, like IRAS08.
This prescription for disk thickness is
| (4) |
(adopted from Equation 7 in Wilson et al., 2019). The factor of 0.2 in front takes into account sources of pressure support from magnetic and cosmic ray sources, as described in Kim & Ostriker (2015). It has been scaled from the value in Wilson et al., 2019 for the fraction of gas-to-total mass in IRAS08. It also considers non-local sources of gravity, as in the vertical component of the three-dimensional gravitational acceleration toward the inner part of the galaxy. It is here that we assume the higher surface density environment, which is appropriate for IRAS08. For a full description of their derivation see Wilson et al. (2019).
Since the free-fall time varies as , even in the most extreme limit, this particular assumption could not account for more than a 20% change in the free-fall time. In Fig. 6 we show the radial profile of , which scales inversely with the scale-height. This quantity is discussed in detail in Leroy et al. (2017) in a study of nearby spiral galaxy, M 51. As we show in the figure, IRAS08 has significantly lower values of than what is found in M 51, typically at the order of magnitude level. This implies that under similar assumptions about the calculation of , IRAS08 has a thicker disk.
We can use the result in Fig. 6 to estimate the variation in the disk thickness of IRAS08. There is considerable point-to-point scatter, but the radial averages are fairly flat. The average value of decreases by 0.4 dex from the highest value at 0.6 kpc to the region around (2 kpc).
We remind the reader that the variation the free-fall timescale is related to the square root of , , which means that the changes in scale height of order only impact and by 0.15 dex. Combining this with alternatives to the adopted prescription, we estimate that choices for deriving in IRAS08 generates a systematic uncertainty of order 0.2 dex on .
In Fig. 8 we show that increases from 3-5 Myr in the galaxy center to values of order 10-15 Myr at the 90% radius, roughly a factor of increase. Note the low values of at 1 kpc and 2 kpc are associated to peaks, likely clumps of CO gas.
5.2. Distribution of in IRAS08
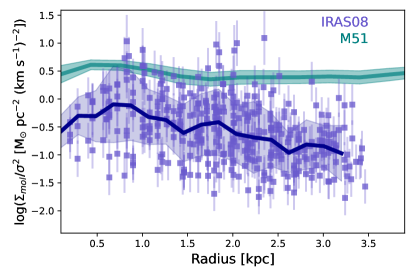
In Fig. 8 we compare the radial distribution of to local spiral galaxies (M 83 Hirota et al., 2018 & M 51 Leroy et al., 2017). We find in IRAS08 that there is a very strong correlation of galactic radius with . At large radii in IRAS08 is similar to what is found in local spirals, . Inside kpc the profile of shows a strong decrease of with radius, that is not matched in either local spiral. The full range of variation of in M 51 and M 83 is at the 0.3 dex level, where IRAS08 experiences a difference of roughly 2 orders-of-magnitude from the center to the outer disk.
We note the caveat that our study and that of Hirota et al. (2018) (M 83) use H to trace SFR, while Leroy et al. (2017) (M 51) uses total IR luminosity. This may introduce a bias in derived values. Different tracers reflect different time-scales of star formation, though this is very unlikely to account for the multiple order of magnitude difference that we observe (for review Kennicutt & Evans, 2012). CO-to-H2 conversion is another important systematic uncertainty. Using a starburst would have the effect of making a significant fraction of lines-of-sight in the central 50% of the galaxy reach . Alternatively, could vary with local surface density, as described in the results on . In IRAS08 this would yield act to steepen the correlation in both and , with disk-like efficiency at large radius and extreme efficiencies of order in the central few kpc. Our constant Milky Way assumption is therefore a conservative estimate of the value and gradient of in IRAS08.
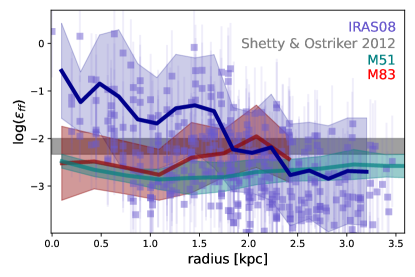
Very high are rare in the local Universe, and are more similar to those observed in super-star clusters (SSCs) in local galaxies (Turner et al., 2015). There are only a handful of observations capable of measuring the efficiency in SSCs. The center of NGC 253 offers a rich starbust environment in which Leroy et al. (2018) observes an overall efficiency of star formation of 50% in SSCs and an efficiency per free-fall time that is similar to the central kiloparsec of IRAS08 (when using a Milky Way ), %. Similar results are found in the SSC Mrk 71A (Oey et al., 2017). Indeed, Otí-Floranes et al. (2014) carries out a multiwavelength study of IRAS08, and finds that the center is consistent with containing SSC.
Recently, Utomo et al. (2018) measured at a similar resolution to ours in a sample of local spiral galaxies from PHANGs. They do not study the radial variation of , but do provide mean and RMS values. The key difference between measured in IRAS08 to that of the local spirals in Utomo et al. (2018) is that IRAS08 has a much larger RMS, and that that spread is skewed to higher . The RMS of is 0.76 dex in IRAS08 compared to 0.25 dex in the disks from PHANGS.
Using a standard, unweighted, median yields a , similar to Utomo et al. (2018). An unweighted average implicitly weights the average to the larger radius regions, where there are more lines-of-sight. An average that is weighted by SFR yields and weighting by CO flux yields .
The weighted averages imply that, like , higher in IRAS08 is more strongly correlated with than with . We find that the Spearman rank correlation coefficient of with is stronger () than with (). We note that the strong correlation of with is also different from what is observed in M 51 and M 83. There is not a statistically significant correlation of with (.
6. The scaling relationship at kiloparsec resolution
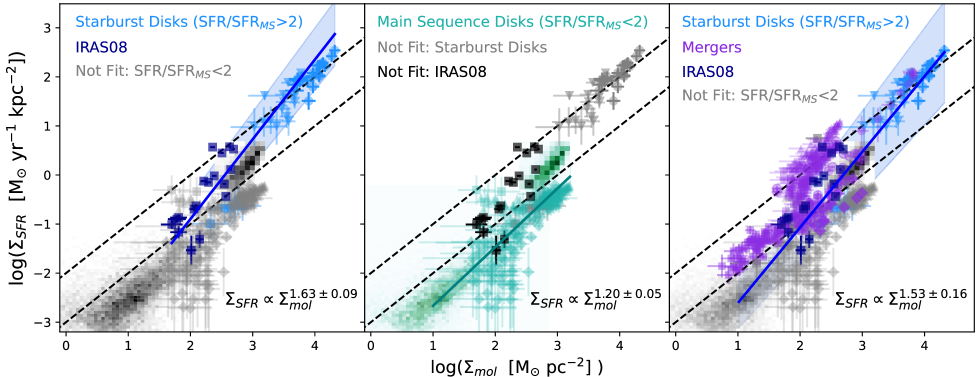
To place IRAS08 into context with other and high star forming galaxies we use the relationship between SFR surface density and gas mass surface density at roughly kiloparsec scale resolution. We highlight 2 results from IRAS08. First, it further illustrates that there is not a simple cut-off at M⊙ pc-2 separating all starburst from non-starburst galaxies in this parameter space; the separation is more complex. Secondly, despites its highly variable , IRAS08 is not an outlier, implying that variable could be common in starburst galaxies.
This relationship is typically characterised by a power-law where
| (5) |
where and are fitted parameters (Kennicutt, 1998a; Kennicutt & Evans, 2012). The power-law slope, in Equation 5, has been interpreted as a constraint on physical models of star formation (e.g. Ostriker et al., 2010; Krumholz et al., 2018; Elmegreen, 2018; Semenov et al., 2019), and is therefore of particular interest. There is a large amount of literature on this correlation across a range of surface brightness, for recent reviews see Tacconi et al. (2020) and also Hodge & da Cunha (2020).
To compare IRAS08 to measurements of for galaxies in the literature we must degrade the resolution of our data cube to a similar resolution (800 pc) and remeasure the integrated intensity map. We note the well-known biases of of how spatial scale affects relationship are described in literature (e.g. Calzetti, 2012; Leroy et al., 2013; Kruijssen & Longmore, 2014). The comparison sample includes the following galaxies: local disks from the HERACLES project (Leroy et al., 2013); local Universe wide-seperation interacting galaxies NGC 232 and NGC 3110 (Espada et al., 2010); local Universe advanced merging galaxies VV 114 (Saito et al., 2015), NGC 1614 (Saito et al., 2016) and the Antenna System (Bemis & Wilson, 2019); rotating galaxies EGS 13011166 (z1.5; Genzel et al., 2013), GN20 (; Hodge et al., 2015), AzTEC-1 (; Tadaki et al., 2018), SHIZELS-19 (; Molina et al., 2019), SDSS J0901+1814 (; Sharon et al., 2019) and systems that are more consistent with being merging galaxies HATLAS J084933 (; Gómez et al., 2018), ALESS67.1 (; Chen et al., 2017). Due to the biases in sampling size discussed above, we refrain from plotting measurements of entire galaxies, and also refrain from plotting measurements less that 0.4 kpc.
To measure the powerlaw relationship between star formation and molecular gas mass surface density we carry out Monte Carlo fit of the data sets to Equation 5 using Ordinary Distance Regression in the Python package scipy. We weight the data so that each galaxy has equal impact on the fit. Data points are also weighted by the measurement uncertainty. For each fit, we run 1000 realizations in which the data points are shifted randomly within 0.3 in both SFR and gas mass to account for systematic uncertainties. Increasing the size of the range in which we shift points, within reasonable limits, only has a minor impact on the derived powerlaw. The reported powerlaw slope and scale factor are the median values from the iterations, and the uncertainty is the 1 scatter around this value. We test our method first by fitting the HERACLES data only in the range 10-100 M⊙ pc-2, and we recover a powerlaw of , which is very similar to values measured in Leroy et al. (2013). Results of fits are shown in Fig. 9 and tabulated in Table 2.
For the fits in Fig. 9, we group galaxies together based on coarse galaxy properties including: morpho-kinematic state (i.e. disks versus mergers) and distance to the star forming main-sequence. We use the redshift evolution of the main-sequence as defined in Whitaker et al. (2012). We define the distance from the main-sequence as the ratio of the observed star-formation rate to the main-sequence star formation rates (). When multiple estimates of star formation rate were available we opt for those made from ionized gas for consistency.
We find for main-sequence galaxies. This is marginally steeper than what is found for fits to HERACLES disks alone (), but similar to the steep slope found by Genzel et al. (2013) for the main-sequence galaxy. Galaxies identified as having starbursts show powerlaws with . We find that separating star-bursting galaxies between those suspected of being mergers and those that are not mergers has very little impact on the power-law slope derived from fitting Equation 9. IRAS08 is in general agreement with the star-bursting sequence. It has a range M⊙ pc-2 that overlaps with both the starbursting and non-starbursting sequence. On its own it has a steeper power-law (). We note that because IRAS08 is compact (R kpc), when resampled to lower resolution there are only a few independent data points, and thus the fit to only IRAS08 has significant uncertainty. Moreover, we reiterate from Section 4 that the lower resolution averages soften the gradient in . We do not find it useful to study higher spatial resolution relationship of for two reasons. First, our purpose of studying the relationship is for comparison to other galaxies, and it is well established that such comparisons must be carried out on a comparable spatial scale (Leroy et al., 2013). Secondly, it is clear from Fig. 5 that there is considerable scatter of individual beams. Fits using standard methods, as we use here, are heavily dominated by uncertainty.
We find that there is not a simple threshold in behavior at a single , as suggested previously in the literature (Bigiel et al., 2008). IRAS08 has a similar range of and both EGS 13011166 and SHIZELS-19 but has a significantly steeper slope than both. The key parameter that distinguishes galaxies on the two tracks, is distance from the main-sequence. Similar arguments are discussed in Tacconi et al. (2020) describing global depletion times. We argue on its own should not be used to discriminate between the two sequences in the relationship.
| Category | log() | |
|---|---|---|
| MS disks only | -4.140.27 | 1.630.09 |
| MS All | -4.150.38 | 1.530.16 |
| MS disks only | -3.850.12 | 1.200.04 |
In spite of its large high variability in in IRAS08, Fig. 8, the galaxy is not a significant outlier from other starbursting systems. It is in fact less extreme in and , by an order-of-magnitude, than AzTEC-1 (Tadaki et al., 2018) and GN20 (Hodge et al., 2015), and has similar gas and SFR surface densities as galaxies, e.g SDSS J0901+1814 (Sharon et al., 2019). This implies that such extreme values of could be wide-spread in starbursting galaxies of the distant Universe. Given its similarity to other star-bursting galaxies in the subsequent section we consider the implications of the results in Figs. 8 and 9 on star formation models in the literature.
7. Discussion
7.1. Implications for Galaxy-Scale Star Formation Theories
The combined results in Fig. 8 and Fig. 9 allow for a direct comparison to a number of theories for how star formation evolves in galaxies. We note that the extreme nature of star formation in IRAS08 does not preclude comparison to these theories, as almost all explicitely discuss the relevancy for star-burst regime (e.g. Shetty & Ostriker, 2012; Krumholz et al., 2018; Faucher-Giguère et al., 2013; Elmegreen, 2018).
There is a clear tension between our results in Fig. 8 and those theories that assume or derive a constant star formation efficiency per free fall-time (e.g. Krumholz et al., 2012; Salim et al., 2015; Elmegreen, 2018). In such theories , and that is constant, but varies. In IRAS08 we find that the opposite is true. We find very little variation across the disk in (of the order of a factor of a few), but a variation in of a factor of 50. Moreover, recent observations (Fisher et al., 2019) have established that on galaxy scales there is an inverse relationship of , which is opposite the prediction of constant star formation efficiency models.
Elmegreen (2018) reviews how different physical regimes may lead to different powerlaws in the Kennicutt-Schmidt diagram. They show that for a disk
| (6) |
While we do see that in starburst galaxies , in order for Equation 6 to hold for IRAS08 the change in would need to be canceled by a greater change in . Under the assumption that variation in the scale height of a disk is traced by , we would need a factor of 200 to cancel the change in . We find however, in Fig. 6 that the ratio only changes by a factor of 2 across the disk. This implies that is relatively constant, while systematically increases with by orders-of-magnitude. This formulation, therefore, appears inconsistent with observations of star formation in IRAS08.
A third class of models predict that star formation is regulated by feedback from newly formed stars (e.g. Ostriker et al., 2010; Shetty & Ostriker, 2012; Kim et al., 2013; Faucher-Giguère et al., 2013). Shetty & Ostriker (2012) specifically investigates the regime of maximally starbursting disks, and is therefore applicable to our observations, they argue that
| (7) |
The quantity , is the momentum input into the ISM from supernova per mass of new stars formed, sometimes referred to as the “feedback efficiency” (Kim et al., 2013). For comparison to IRAS08 this prediction has the advantage of not simultaneously depending on both and . As we show in Fig. 8, the simulations of Shetty & Ostriker (2012), which incorporate these concepts, find that, even at high , the maximum is 1%, and thus a factor of 50 too low to describe the variability in IRAS08.
In order for Equation 7 to match the observations in Fig. 9 would have to increase with (or ), at roughly , but for starburst galaxies only. The feedback efficiency is typically derived, or adopted, as a constant in star formation theories (e.g. Ostriker et al., 2010; Faucher-Giguère et al., 2013; Krumholz et al., 2018).
Fisher et al. (2019) shows that constant feedback efficiency models have trouble describing the global relationships for both and gravitational pressure (also see Sun et al., 2020; Girard et al., 2021). If the value of were to increase with either or , as described above, this would alleviate the discrepancies at high with both the correlations of and versus hydrostatic pressure.
Though debate still exist (Kim et al., 2017), some simulation work finds a significant increase in is possible in regions of higher star formation rate surface density, due to the effect of clustered supernova driving more efficient feedback (Gentry et al., 2017, 2018; Martizzi, 2020). Moreover, simulations of outflows in starbursting systems like M82 or galaxies find that constant feedback efficiency models are not capable of reproducing the high velocity winds, whereas clustered supernova are (Fielding et al., 2018). We note that similarly in IRAS08 Chisholm et al. (2015) observes very high velocity winds, km s-1, using UV absorption lines. IRAS08 in fact has among the most rapid outflows in their sample of 48 local Universe galaxies. The clumps we observe in IRAS08 seem like an ideal location for the effects of clustered supernova. Such a change could also act to increase the observed as more efficient feedback would decrease .
Alternative to varying the feedback efficiency others argue that star formation is regulated by a combination of feedback and dynamical disk stability (Faucher-Giguère et al., 2013; Krumholz et al., 2018). In these theories the relationship depends on both and Toomre , such that
| (8) |
To first approximation, this is consistent with a picture of galaxy evolution in which main-sequence galaxies have high values of and starburst galaxies, which may be experiencing a violent disk instability, have low values of . This would then explain why there are multiple sequences in Fig. 9 at large , and is consistent with what we observe in Fig. 4 for IRAS08, as well as AzTEC-1 (Tadaki et al., 2018). We note that testing the dependance on high- galaxies is more difficult than it seems, as systematic uncertainties can have very large effects on both how the velocity dispersion is measured and the molecular gas is estimated (Girard et al., 2021). We note that Girard et al. (2021) shows that when SFR is compared to molecular gas velocity disperions, instead of ionized gas, the mixed feedback-transport model from Krumholz et al. (2018) does not agree with data.
Faucher-Giguère et al. (2013) creates a similar feedback-regulated model of star-formation, which incorporates dynamical regulation of the disk, such that and in their model is free to vary. They find a range of at all M⊙ pc-2. They also make predictions for global properties like , and . The predict a disk averaged as high as 30% for a galaxy with properties like IRAS08. Though it is not clear from their model if there is a systematic variation of like we see in IRAS08.
Similar to these gravitationally based prescriptions, there is a long known result (Kennicutt, 1998b) that for total gas mass in galaxies normalising the gas mass by the orbital time-scale creates a linear correlation that galaxies obey well, such that , where the orbital timescale is defined as . This amounts to stating that galaxies convert a constant fraction of gas into stars per orbit. In IRAS08 both and become larger with radius, causing a positive correlation. The change in , however, is insufficient to account for the two orders-of-magnitude change in . We find that in the central kiloparsec in IRAS08 Myr, rising to Myr in the outer disk, an increase of a factor of 5.
We summarise how our results compare to star formation:
Constant Star Formation Efficiency Models:
Our observations of IRAS08 are inconsistent with theories in which the star formation efficiency is held constant (Krumholz et al., 2012; Salim et al., 2015). Constant star formation efficiency models also fail to recover the observed relationship of (Fisher et al., 2019).
Feedback Regulated Models: Models in which star formation is regulated only by the balance of feedback with local gravity (Shetty & Ostriker, 2012, e.g.), excluding large scale galactic flows, could explain the properties of galaxies like IRAS08 only if more freedom is given to both star formation efficiency, and especially if the efficiency of feedback is allowed to be higher in higher SFR surface density regions, perhaps due to supernova clustering.
Mixed Feedback+Toomre Regulation: Models in which feedback effects are mixed with disk self-regulation via Toomre instabilities appear most consistent with our observations (Faucher-Giguère et al., 2013; Krumholz et al., 2018). Such models have a built-in explanation for the multiple sequences in the relationship. Moreover, the model of Faucher-Giguère et al. (2013) does allow for larger disk averaged . Though these models do not, as yet, give testable predictions for the systematic variation in and within IRAS08, and the correlation of SFR- for molecular gas velocity dispersions does not match the data in samples of both low- and high-z galaxies (Girard et al., 2021).
It is important to emphasize that our findings are based on only one galaxy. The stark differences from what we observe and commonly accepted theories of star formation seem to strongly argue for more observations of resolved maps of molecular gas in high disk galaxies. Whether that be directly at or with analogue samples such as DYNAMO (Fisher et al., 2017b), it is now needed to determine if strong gradients in are common in this mode of star formation.
7.2. Possible dynamical drivers of gradient
If we assume that the gas flow which was responsible for the variation in and is quasi-stable on a similar timescale as (100-500 Myr) we can expect that evidence for such an inflow may still present in the galaxy. It is particularly interesting to consider the similarity between IRAS08 and blue-compact galaxies at , which are thought to experience very rapid inflows as an important component of galaxy evolution (Dekel & Burkert, 2014; Tacchella et al., 2016).
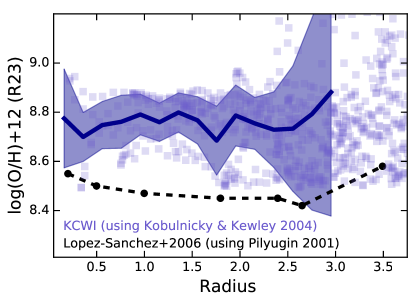
We first look for independent evidence of inflow using the metallicity profile. Flat metallicity gradients are frequently interpreted as indicators of gas inflows within galaxies (Kewley et al., 2010; Jones et al., 2013). The reason is straightforward. The higher density of star formation in the galaxy center (Fig. 5) should pollute the ISM faster, and therefore in order to maintain a flat metallicity profile the center must be replenished with less metal rich gas.
The metallicity profile, shown in Fig. 11, is consistent with an inflow of gas toward the galaxy center. The blue points indicate our measurements using the R23 method from Kobulnicky & Kewley (2004) with KCWI data, and the black points show the measurement from López-Sánchez et al. (2006), which uses the Pilyugin & Thuan (2005) calibration for the same emisison lines. There are very well known offsets between the metallicity of different calibrations (for review see Kewley et al., 2019). The gradient of our measurement and López-Sánchez et al. (2006) is similarly flat across the disk. A typical, massive spiral galaxy has a metallicity gradient, using the R23 method, of order -0.4 dex in log(O/H), see Ho et al. (2015) and reviewed in Bresolin (2017). For an exponential disk is roughly equivalent to the 90% radius. We measure a 90% radius of star light, using HST F550M image, of 3 kpc. Across this range the metallicity profile of IRAS08 shows no decrease at all, consistent with inflow scenarios.
We consider 3 possible mechanisms for gas inflows: galaxy wide “violent” disk instability, a distant interaction with a neighboring galaxy, and the bar in the galaxy center.
7.2.1 Violent Disk Instability as inflow driver
Typically, violent disk instabilities as drivers of inflow are connected to the phenomena of “wet compaction” in galaxies. In this scenario rapid inflows of gas quickly build bulges in starbursting disks (see discussion in Zolotov et al., 2015). Observations and simulations of high- galaxies associate the phenomenon of compactions with blue compact galaxies. As described above, IRAS08 has historically been treated as a rare local analogue of luminous blue-compact galaxies in the distant Universe López-Sánchez et al. (2006); Östlin et al. (2009). We have also measured a low Toomre Q in IRAS08. We therefore consider the possibility that a similar phenomena is dominating the inflow of gas in IRAS08.
Zolotov et al. (2015), and also recently Dekel et al. (2020), describe the properties of simulated galaxies experiencing these phenomena. The critical properties are high specific SFR (SFR/Mstar) and high stellar mass surface density in the central kiloparsec. In IRAS08 we observe a specific SFR in the central kiloparsec of 1.1 Gyr-1 and a stellar mass surface density of M⊙ kpc-2. These values place IRAS08 within the range of values for galaxies experiencing compaction in the simulations analysed by Zolotov et al. (2015). In Fig. 5 we show that in IRAS08 the molecular gas surface brightness peaks at a radius of 0.5-0.7 kpc, and then declines at larger radius. Dekel et al. (2020) finds that such gas profiles are similar to pre-compaction or early-compaction galaxies. We note that there are no observations of blue-compact galaxies at with sub-kpc resolution, like our observations of IRAS08, it is therefore not possible to determine if such rings are common or not in blue compact galaxies thought to experience compaction.
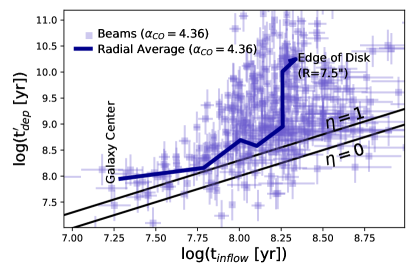
Dekel & Burkert (2014) argue that wide-scale violent disk instabilities naturally drive inflows of gas, and make a testable predicitions for the internal distribution of . They develop a formalism in which the inflow timescale can be estimated from the assumption that (1) the kinematics are that of marginally stable/unstable disk, and (2) that energy gained from inflow is equal to the energy dissipated via turbulence. These assumption yield an inflow timescale, of
| (9) |
If the galaxy kinematics are dominated by the violent disk instability then the inflow timescale is predicted to always be greater than the depletion time of the gas, . Here we use a modified definition of gas depletion time, as
| (10) |
where is the outflow mass-loading factor. If then gas will convert to stars before it reaches the galaxy center. The inflow timescale, as described in Equation 9, is only relevant to galaxies experiencing a violent disk instability.
The condition that , therefore, gives us a testable condition for consistency with the wet-compaction scenario for IRAS08. A system in which the gas inflow is driven by torques due to merging or accretion would not need to obey the condition (where is derived from Equation 9) to maintain inward gas movement.
We note that using Equation 9 to estimate the inflow timescale makes an explicit assumption that the galaxy wide disk instability is driving the gas flow. In IRAS08 there is clearly a bar, and there is a significant amount of literature on the impact of bars, and associated resonances impacting gas inflows (see reviews Kormendy & Kennicutt, 2004; Athanassoula, 2005). We will consider bars later as a driver of the gas inflow.
In Fig. 1 the molecular gas is preferentially located in spiral arms, this may imply that the assumptions of linear Toomre instabilites are not applicable. Under this case the formulation of in Equation 9 may not be correct. We can make approximate estimates of the impact of the nonlinearity, on the formulation of . The presence of large clumps of gas with masses of order 107 M⊙ implies that some instability must have recently existed. One possibility is that our measurements of which focus on clumps under-estimate the value of the disk gas. Simulations of clumpy galaxies in the non-linear regime find that can be as high as Inoue et al. (2016). Under very simplistic assumptions, this would have the effect of increasing by a factor of 3. Alternatively, the fact that that the molecular gas favours the spiral arms may imply that a the clumps are in response to a spiral arm instability, as described in Inoue & Yoshida (2018). They show that many of the results of Toomre theory, have only minor corrections to clumpy spiral arm instabilties.
In Fig. 11 we compare the molecular gas depletion time to the inflow timescale determined at each CO beam in IRAS08. The straight lines indicate the lines of equality for typical assumptions on the mass-loading factor of outflowing gas from star bursting regions (e.g. Bolatto et al., 2013a; Veilleux et al., 2020). We show that while decreases as a function of radius within IRAS08, very few of the measured beams have . We also averaged both and in radial bins of 0.8 kpc. In Fig. 11 we show that the two timescales decrease in such a way that the is never less than the depletion time. This galaxy therefore satisfies the condition in Dekel & Burkert (2014) for gas driven inflows by violent disk instabilities.
The result in Fig. 11 does not absolutely mean that the gas inflow in IRAS08 is driven by disk instabilities. Indeed as we have stated above the fact that the gas is preferentially in spirals may imply that the disk may be in the non-linear phase of an instability.
However, we take this with the low Toomre Q (Fig. 4), high gas velocity dispersion, compact size and large clumps of star formation as holistically fitting a picture that is outlined in theoretical and simulation work describing galaxies in which the Toomre instability drives the internal dynamics of those galaxies. Moreover, the location of the ring is consistent with expectations from Toomre instability theory (e.g. Genzel et al., 2014). The ring is located at a radius of 1 kpc, which is colocated with the rise in Toomre Q at the same radius (Fig. 4). This is expected in a system in which the galaxy wide instability is driving the flow of gas (Genzel et al., 2014; Dekel & Burkert, 2014).
What Fig. 11 adds is a connection of the gradient in and directly to the disk instability. Blue-compact disks, that are similar in many properties to IRAS08, are thought to be a critical phase in galaxy evolution (Tacchella et al., 2016). Our results suggest that the extreme inflows could sustain extremely high star formation efficiencies, and thus build bulges 20-50 faster than current prescriptions based on lower assumptions of than we observe in the center of IRAS08.
7.2.2 Outflow as a driver of low depletion times
Removal of gas via star formation driven winds could lead to an observed decrease in the ratio of SFR to . The interpretation of depletion time as the currently observed emission line flux of ionized gas (star formation rate) to the current flux from CO (molecular gas) makes an implicit assumption that the mass of molecular gas is similar to the historic mass, which formed the present population of stars. However, star formation driven winds could reduce the mass of molecular gas in the environment of more extreme star formation. In this case the observed depletion time reflects both the loss of cold gas due to star formation and the loss of cold gas due to outflows, as described in Equation 10.
In IRAS08 we observed a lower depletion time in the galaxy center compared to the outer parts. If the mass-loading factor (rate of mass outflow divided by SFR) is higher in the galaxy center than the outskirts, then in principle this could steepen the observed gradient in depletion time and . The mass-loading factor in the galaxy center would need to be of order higher in the center for this to completely explain the gradient in . Chisholm et al. (2017) observes very fast winds in the central kiloparsec of IRAS08 ( km s-1), which would be fast enough to escape the disk easily, but the mass-loading factor is of order . This is not sufficient to account for the difference from a disk-value of Gyr. There is little published work on internal gradients of the mass-loading factor. In simulations, Kim et al. (2020) finds that mass-loading factors are lower for shorter depletion times, which is opposite of the trend needed to explain our results. Our team is using the KCWI data described in this work to measure outflows of ionized gas. Reichardt Chu et al. submitted finds that there is not strong variation of the mass-outflow rate with , which would imply that there is likewise not a strong variation with . As discussed above, there is a strong correlation of shorter depletion times with higher . Moreover, they find mass-loading factors of ionised gas that are similar to UV absorption lines, of order unity , which is not sufficient to explain the low in IRAS08. We intend a future paper directly comparing the outflow kinematics to the molecular gas depletion time and gas-mass fraction with the aim of testing models of feedback and star formation regulation.
7.2.3 Bars or Mergers as inflow driver
IRAS08 does not behave similarly in its value nor gradient of to what is observed in either barred disks or merging galaxies (with similar impact parameters and mass-ratios). The comparison of the depletion time of IRAS08 to galaxies with bars and mergers is described in more detail in the Appendix. Here we summarize the results.
Merging Galaxies: Using molecular gas data from the GOALS sample of merging galaxies (Larson et al., 2016) we find that similar wide-separation interacting galaxies do not show low global . Typically the very low global depletion times are only observed in advanced stages of merging. We also consider the internal gradient in molecular gas depletion times of wide separation mergers. Espada et al. (2018) studies resolved within interacting galaxies with quite similar mass ratios and impact parameters as IRAS08. Espada et al. (2018) finds that there is much less variation in in the interacting galaxies, than we see in IRAS08, and is shorter at the edge of the galaxy, which is the opposite of IRAS08. Wide-separation, interactions certainly drive gas inward, but this does not necessarily translate to more efficient star formation in the galaxy center. We also use the data from Espada et al. (2018) to show that in these merging galaxies the depletion times are not consistent with predictions from disk instability theory (Equation 9), and thus satisfying a null hypothesis.
Barred Disks: For bars there is not observational evidence that bars lead to low central . Bars are well known to correlate with high central densities of molecular gas (Sheth et al., 2005; Jogee et al., 2005; Fisher et al., 2013), which are understood theoretically (e.g. Athanassoula, 1992; Kormendy & Kennicutt, 2004). However, there is not a well known trend with barred disks have significantly lower in the galaxy center, especially not more than a 0.2 dex level (Utomo et al., 2017). In IRAS08 there is a central decrease in gas mass surface density (Fig. 5), which is the opposite of observed gas density profiles in barred disks. Moreover, the bar in IRAS08 is on the small side of typical bars, and the gradient in begins well outside the bar radius.
It is very important to state the caveat that none of these phenomenon (instabilities, mergers, bars) are mutually exclusive. Simulations now establish that minor-merger style interactions frequently drive the violent disk instabilities (Zolotov et al., 2015). Moreover, rest-frame B-band surveys find that 20-30% of galaxies at are barred (Jogee et al., 2004). We note that it is well known that blue-optical surveys significantly underestimate the frequency of bars (Eskridge et al., 2002). It would thus imply that significantly more that 30% of galaxies are barred. Indeed, recent studies of observations find bars, spirals and rings are common features in galaxies at (Hodge et al., 2019), and that the historic absence of observations of such features may have been heavily biased by resolution and sensitivity (Yuan et al., 2017).
7.3. Comparing IRAS08 to galaxies
The observations of IRAS08 we describe in §3 and §5 correspond to a star-forming compact rotating galaxy, with a high gas dispersion velocity indicative of a thick disk of very high molecular surface density with low enough Toomre Q to suggest large scale instabilities. This scenario is very similar to the properties of galaxies at (reviewed in Glazebrook, 2013; Tacconi et al., 2020). Other studies have reached similar conclusions (Leitherer et al., 2002; López-Sánchez et al., 2006; Östlin et al., 2009). The SFR and stellar mass of IRAS08 correspond to those of a main-sequence galaxy at . This is also true for the compactness of its 500 nm half-light radius.
A characteristic feature of galaxies (both main-sequence and bursting) at is the well known “clumpy” star forming regions (e.g. Elmegreen & Elmegreen, 2005; Genzel et al., 2011; Guo et al., 2015). Fisher et al. (2017b) includes IRAS08 in an analysis of local Universe clumpy galaxies from the DYNAMO sample. The IRAS08 clumps are as bright as 18% of the total light in H and several are brighter than 12%. This galaxy therefore easily passes quantitative literature definitions of “clumpy” galaxies (e.g. Guo et al., 2015; Fisher et al., 2017b). This similarity to galaxies, not only in kinematic state (i.e. low-Q and high ) but also characteristics of star-forming complexes, suggests that such conditions in a galaxy may facilitate high and/or variable . Moreover, these observations also suggests a connection between this kinematic state and rapid inflows. Given that these same conditions are very common at , when most star formation in the Universe occurred (Madau & Dickinson, 2014; Förster Schreiber & Wuyts, 2020) this motivates more study in this area.
Our results strongly argue for the need for more observations of more turbulent, disk galaxies in which molecular gas and star formation rates can be resolved to scales of 100 pc. This can only currently be achieved with either local Universe analog samples, like DYNAMO, or lensed galaxies at (e.g. Dessauges-Zavadsky et al., 2019). Results from such projects would directly inform models of galaxy evolution and possibly make a significant step forward in understanding how bulges form in the early Universe.
8. Summary
Our main result is a two order-of-magnitude variation in the molecular gas depletion time and across a massive blue-compact disk galaxy. We discuss the implications of this for both models of star formation and the evolution of similar blue-compact disks at . We find that in the central 50% of the galaxy typical values are larger than 10%, with extreme values as high as 100%. This variation is much larger than the variation of , which accounts for a variable disk thickness. The values and radial variation of and are very atypical when compared to other disk galaxies in the local Universe (Leroy et al., 2013, 2017; Utomo et al., 2017, 2018; Hirota et al., 2018).
IRAS08 is, however, similar in many properties to the turbulent, compact starbusting disk galaxies of the distant Universe. While highly resolved observations of distant galaxies remain elusive, we can interpret our high spatial resolution observations or IRAS08 as possibly indicating that more efficienct star formation is a common feature of galaxy evoution. We show, in Fig. 9, that this similarity also translates to a consistency in the resolved Kennicutt-Schmidt relationship between and . We find that the relationship between being above the main-sequence and having a steeper power-law slope is the same at as at . This is generically consistent with results showing that galaxies above the main-sequence have short (Tacconi et al., 2018, 2020), with which our target is also consistent. Our results suggest that the steeper powerlaw may be driven by a higher at the cloud scale, as suggested in theory developed in Faucher-Giguère et al. (2013). Recent observations of molecular clouds in lensed galaxies do suggest higher pressure clouds than what is observed in local spirals (e.g. Dessauges-Zavadsky et al., 2019), which may indicate differences in the conversion to stars.
As we have discussed in Section 6, it is hard to reconcile these observations with models assuming constant . Models that do well at describing properties of local spiral galaxies (e.g. Ostriker et al., 2010; Krumholz et al., 2012; Salim et al., 2015) cannot match the observations of IRAS08, or other star-bursting disk galaxies. Theories in which is variable (e.g. Faucher-Giguère et al., 2013) are more consistent.
We note that for comparing to theory, there is some degeneracy between a truly variable and a variable feedback-efficiency. If the feedback is more effective at removing molecular gas this could lead to an increase in the observed . Fisher et al. (2019) argues that if the feedback efficiency (, in Equation 6, were larger in higher disk galaxies this could reconcile a number of galaxy properties with locally tested equilibrium star formation theories (e.g. Ostriker et al., 2010; Kim et al., 2013). In IRAS08 it is not clear that outflows alone can explain the gradient in . Chisholm et al. (2015) measures very strong winds ( km s-1) in the center of IRAS08. The mass loading factor, however, in the center of the galaxy would need to be of order to account for the entire decrease below the typical disk value. Chisholm et al. (2017) finds, based on UV-absorption lines, mass-loading factor of 5% in IRAS08 in photoionized gas. This is for photoionized gas. The relationship between mass-loading factors of different phases is not well-understood, and could be larger in molecular gas, as suggested by Bolatto et al. (2013b). A detailed study of the resolved outflows in IRAS08 is current in progress (Reichardt-Chu in prep).
We find that the internal properties of IRAS08 are most consistent with a gas inflow being driven by a galaxy wide, violent disk instability (as described in Dekel et al., 2009; Dekel & Burkert, 2014). Not only does IRAS08 exhibit many of the properties similar to those in this theory (e.g. clumpy, high gas velocity dispersion, compact), but we show for the first time, in Fig. 11, a direct consistency with the prediction from Dekel & Burkert (2014) that in unstable disks the inflow timescale must always be less than in order for an inflow to be maintained. If we interpret IRAS08 as a central burst driven by a violent disk instability, then this galaxy has implications for observations of compaction at high-. As we show in Fig. 5, in IRAS08 there is no central pile-up of molecular gas, rather it is exhausted through star-formation on very rapid timescales. Our results imply that high- blue nugget galaxies could convert their gas very quickly, and make a high-concentration of molecular gas absent.
We can also consider these extremely rapid growth scenarios in light of red-nuggets at (Glazebrook et al., 2017), and the formation of early-type galaxies. The /Fe abundances of early type galaxies can only be reconciled with their IMFs if they have extremely short formation timescales, in the 10’s of Myr (Martín-Navarro, 2016). The very short and high we observed in the galaxy center of IRAS08, is approaching those short times. These are thus not inconsistent with the compact size and short dynamical times of high-z red nuggets, and may provide an avenue to explain the -enhancement of such galaxies (Kriek et al., 2016).
Ultimately, IRAS08 is only one galaxy. Observations of more galaxies, and observations with alternate methods of measuring star formation efficiency (e.g. Onus et al., 2018), are needed to further confirm this scenario. Moreover, studies that combine both resolved measurements of with metrics of the feedback, such as outflow kinematics, are needed. Such comparison could determine if the variation in is due to a true change in star formation efficiency or if feedback is more efficiently removing gas in those regions. We note that to observe sufficiently small spatial scales to measure the at high will require either observations of rare local galaxies like ours or lensed galaxies at larger redshift.
References
- Armus et al. (2009) Armus, L., Mazzarella, J. M., Evans, A. S., et al. 2009, PASP, 121, 559
- Arribas et al. (2012) Arribas, S., Colina, L., Alonso-Herrero, A., et al. 2012, A&A, 541, A20
- Athanassoula (1992) Athanassoula, E. 1992, 259, 345
- Athanassoula (2005) —. 2005, 358, 1477
- Bell (2003) Bell, E. F. 2003, 586, 794
- Bemis & Wilson (2019) Bemis, A., & Wilson, C. D. 2019, AJ, 157, 131
- Bigiel et al. (2008) Bigiel, F., Leroy, A., Walter, F., et al. 2008, 136, 2846
- Binney & Tremaine (1987) Binney, J., & Tremaine, S. 1987, Galactic Dynamics
- Bolatto et al. (2013a) Bolatto, A. D., Wolfire, M., & Leroy, A. K. 2013a, ARA&A, 51, 207
- Bolatto et al. (2013b) Bolatto, A. D., Warren, S. R., Leroy, A. K., et al. 2013b, Nature, 499, 450
- Boquien et al. (2018) Boquien, M., Burgarella, D., Roehlly, Y., et al. 2018, arXiv e-prints, arXiv:1811.03094
- Bresolin (2017) Bresolin, F. 2017, Astrophysics and Space Science Library, Vol. 434, Metallicities in the Outer Regions of Spiral Galaxies, ed. J. H. Knapen, J. C. Lee, & A. Gil de Paz, 145
- Caldu-Primo et al. (2013) Caldu-Primo, A., Schruba, A., Walter, F., et al. 2013, AJ, 146, 150
- Calzetti (2012) Calzetti, D. 2012, ArXiv e-prints, arXiv:1208.2997 [astro-ph.CO]
- Cannon et al. (2004) Cannon, J. M., Skillman, E. D., Kunth, D., et al. 2004, ApJ, 608, 768
- Chen et al. (2017) Chen, C.-C., Hodge, J. A., Smail, I., et al. 2017, ApJ, 846, 108
- Chisholm et al. (2017) Chisholm, J., Tremonti, C. A., Leitherer, C., & Chen, Y. 2017, MNRAS, 469, 4831
- Chisholm et al. (2015) Chisholm, J., Tremonti, C. A., Leitherer, C., et al. 2015, ApJ, 811, 149
- Combes et al. (1994) Combes, F., Prugniel, P., Rampazzo, R., & Sulentic, J. W. 1994, A&A, 281, 725
- Conselice (2014) Conselice, C. J. 2014, ARA&A, 52, 291
- Cox et al. (2008) Cox, T. J., Jonsson, P., Somerville, R. S., Primack, J. R., & Dekel, A. 2008, 384, 386
- Dekel & Burkert (2014) Dekel, A., & Burkert, A. 2014, MNRAS, 438, 1870
- Dekel et al. (2009) Dekel, A., Birnboim, Y., Engel, G., et al. 2009, Nature, 457, 451
- Dekel et al. (2020) Dekel, A., Lapiner, S., Ginzburg, O., et al. 2020, arXiv e-prints, arXiv:2003.08984
- Dessauges-Zavadsky et al. (2019) Dessauges-Zavadsky, M., Richard, J., Combes, F., et al. 2019, Nature Astronomy, 3, 1115
- Ellison et al. (2008) Ellison, S. L., Patton, D. R., Simard, L., & McConnachie, A. W. 2008, AJ, 135, 1877
- Elmegreen (2018) Elmegreen, B. G. 2018, ApJ, 854, 16
- Elmegreen & Elmegreen (2005) Elmegreen, B. G., & Elmegreen, D. M. 2005, ApJ, 627, 632
- Erwin et al. (2005) Erwin, P., Beckman, J. E., & Pohlen, M. 2005, 626, L81
- Eskridge et al. (2002) Eskridge, P. B., Frogel, J. A., Pogge, R. W., et al. 2002, 143, 73
- Espada et al. (2010) Espada, D., Martin, S., Hsieh, P.-Y., et al. 2010, in Galaxies and their Masks, ed. D. L. Block, K. C. Freeman, & I. Puerari, 97
- Espada et al. (2018) Espada, D., Martin, S., Verley, S., et al. 2018, ApJ, 866, 77
- Faucher-Giguère et al. (2013) Faucher-Giguère, C.-A., Quataert, E., & Hopkins, P. F. 2013, MNRAS, 433, 1970
- Fielding et al. (2018) Fielding, D., Quataert, E., & Martizzi, D. 2018, MNRAS, 481, 3325
- Fisher et al. (2013) Fisher, D. B., Bolatto, A., Drory, N., et al. 2013, 764, 174
- Fisher et al. (2019) Fisher, D. B., Bolatto, A. D., White, H., et al. 2019, ApJ, 870, 46
- Fisher & Drory (2008) Fisher, D. B., & Drory, N. 2008, 136, 773
- Fisher et al. (2017a) Fisher, D. B., Glazebrook, K., Abraham, R. G., et al. 2017a, ApJ, 839, L5
- Fisher et al. (2017b) Fisher, D. B., Glazebrook, K., Damjanov, I., et al. 2017b, MNRAS, 464, 491
- Förster Schreiber & Wuyts (2020) Förster Schreiber, N. M., & Wuyts, S. 2020, ARA&A, 58, 661
- Förster Schreiber et al. (2009) Förster Schreiber, N. M., Genzel, R., Bouché, N., et al. 2009, ApJ, 706, 1364
- Gentry et al. (2017) Gentry, E. S., Krumholz, M. R., Dekel, A., & Madau, P. 2017, MNRAS, 465, 2471
- Gentry et al. (2018) Gentry, E. S., Krumholz, M. R., Madau, P., & Lupi, A. 2018, ArXiv e-prints, arXiv:1802.06860
- Genzel et al. (2011) Genzel, R., Newman, S., Jones, T., et al. 2011, ApJ, 733, 101
- Genzel et al. (2013) Genzel, R., Tacconi, L. J., Kurk, J., et al. 2013, ApJ, 773, 68
- Genzel et al. (2014) Genzel, R., Förster Schreiber, N. M., Lang, P., et al. 2014, apj, 785, 75
- Girard et al. (2021) Girard, M., Fisher, D. B., Bolatto, A. D., et al. 2021, ApJ, 909, 12
- Glazebrook (2013) Glazebrook, K. 2013, ArXiv e-prints, arXiv:1305.2469 [astro-ph.CO]
- Glazebrook et al. (2017) Glazebrook, K., Schreiber, C., Labbé, I., et al. 2017, Nature, 544, 71
- Gómez et al. (2018) Gómez, J. S., Messias, H., Nagar, N. M., et al. 2018, arXiv e-prints, arXiv:1806.01951
- Grudić et al. (2019) Grudić, M. Y., Hopkins, P. F., Lee, E. J., et al. 2019, MNRAS, 488, 1501
- Guo et al. (2015) Guo, Y., Ferguson, H. C., Bell, E. F., et al. 2015, ApJ, 800, 39
- Hafen et al. (2019) Hafen, Z., Faucher-Giguere, C. A., Angles-Alcazar, D., et al. 2019, arXiv e-prints, arXiv:1910.01123
- Hao et al. (2011) Hao, C.-N., Kennicutt, R. C., Johnson, B. D., et al. 2011, ApJ, 741, 124
- Hayes et al. (2009) Hayes, M., Östlin, G., Mas-Hesse, J. M., & Kunth, D. 2009, AJ, 138, 911
- Hirota et al. (2018) Hirota, A., Egusa, F., Baba, J., et al. 2018, PASJ, 70, 73
- Ho et al. (2015) Ho, I. T., Kudritzki, R.-P., Kewley, L. J., et al. 2015, MNRAS, 448, 2030
- Hodge & da Cunha (2020) Hodge, J. A., & da Cunha, E. 2020, arXiv e-prints, arXiv:2004.00934
- Hodge et al. (2015) Hodge, J. A., Riechers, D., Decarli, R., et al. 2015, ApJ, 798, L18
- Hodge et al. (2019) Hodge, J. A., Smail, I., Walter, F., et al. 2019, ApJ, 876, 130
- Ianjamasimanana et al. (2012) Ianjamasimanana, R., de Blok, W. J. G., Walter, F., & Heald, G. H. 2012, AJ, 144, 96
- Inoue et al. (2016) Inoue, S., Dekel, A., Mandelker, N., et al. 2016, MNRAS, 456, 2052
- Inoue & Yoshida (2018) Inoue, S., & Yoshida, N. 2018, MNRAS, 474, 3466
- Jogee et al. (2005) Jogee, S., Scoville, N., & Kenney, J. D. P. 2005, 630, 837
- Jogee et al. (2004) Jogee, S., Barazza, F. D., Rix, H.-W., et al. 2004, 615, L105
- Jones et al. (2013) Jones, T., Ellis, R. S., Richard, J., & Jullo, E. 2013, ApJ, 765, 48
- Kennicutt (1998a) Kennicutt, R. C. 1998a, 498, 541
- Kennicutt et al. (2009) Kennicutt, R. C., Hao, C., Calzetti, D., et al. 2009, 703, 1672
- Kennicutt (1998b) Kennicutt, Jr., R. C. 1998b, 36, 189
- Kennicutt & Evans (2012) Kennicutt, Jr., R. C., & Evans, II, N. J. 2012, ArXiv e-prints, arXiv:1204.3552 [astro-ph.GA]
- Kewley et al. (2019) Kewley, L. J., Nicholls, D. C., & Sutherland, R. S. 2019, ARA&A, 57, 511
- Kewley et al. (2010) Kewley, L. J., Rupke, D., Zahid, H. J., Geller, M. J., & Barton, E. J. 2010, ApJ, 721, L48
- Kim & Ostriker (2015) Kim, C.-G., & Ostriker, E. C. 2015, ApJ, 815, 67
- Kim et al. (2013) Kim, C.-G., Ostriker, E. C., & Kim, W.-T. 2013, ApJ, 776, 1
- Kim et al. (2017) Kim, C.-G., Ostriker, E. C., & Raileanu, R. 2017, ApJ, 834, 25
- Kim et al. (2020) Kim, C.-G., Ostriker, E. C., Somerville, R. S., et al. 2020, ApJ, 900, 61
- Kobulnicky & Kewley (2004) Kobulnicky, H. A., & Kewley, L. J. 2004, 617, 240
- Kormendy & Kennicutt (2004) Kormendy, J., & Kennicutt, R. C. 2004, 42, 603
- Kriek et al. (2016) Kriek, M., Conroy, C., van Dokkum, P. G., et al. 2016, Nature, 540, 248
- Kruijssen & Longmore (2014) Kruijssen, J. M. D., & Longmore, S. N. 2014, MNRAS, 439, 3239
- Krumholz et al. (2018) Krumholz, M. R., Burkhart, B., Forbes, J. C., & Crocker, R. M. 2018, MNRAS, 477, 2716
- Krumholz et al. (2012) Krumholz, M. R., Dekel, A., & McKee, C. F. 2012, ApJ, 745, 69
- Larson et al. (2016) Larson, K. L., Sanders, D. B., Barnes, J. E., et al. 2016, ApJ, 825, 128
- Leitherer et al. (2002) Leitherer, C., Li, I.-H., Calzetti, D., & Heckman, T. M. 2002, ApJS, 140, 303
- Leroy et al. (2008) Leroy, A. K., Walter, F., Brinks, E., et al. 2008, 136, 2782
- Leroy et al. (2013) Leroy, A. K., Walter, F., Sandstrom, K., et al. 2013, AJ, 146, 19
- Leroy et al. (2015) Leroy, A. K., Bolatto, A. D., Ostriker, E. C., et al. 2015, ApJ, 801, 25
- Leroy et al. (2017) Leroy, A. K., Schinnerer, E., Hughes, A., et al. 2017, ApJ, 846, 71
- Leroy et al. (2018) Leroy, A. K., Bolatto, A. D., Ostriker, E. C., et al. 2018, ApJ, 869, 126
- López-Sánchez et al. (2006) López-Sánchez, Á. R., Esteban, C., & García-Rojas, J. 2006, A& A, 449, 997
- Maciejewski et al. (2002) Maciejewski, W., Teuben, P. J., Sparke, L. S., & Stone, J. M. 2002, MNRAS, 329, 502
- Madau & Dickinson (2014) Madau, P., & Dickinson, M. 2014, ARA&A, 52, 415
- Maeda et al. (2018) Maeda, F., Ohta, K., Fujimoto, Y., Habe, A., & Baba, J. 2018, PASJ, 70, 37
- Magnelli et al. (2012) Magnelli, B., Saintonge, A., Lutz, D., et al. 2012, A&A, 548, A22
- Marinova & Jogee (2007) Marinova, I., & Jogee, S. 2007, ApJ, 659, 1176
- Martín-Navarro (2016) Martín-Navarro, I. 2016, MNRAS, 456, L104
- Martinez-Valpuesta et al. (2006) Martinez-Valpuesta, I., Shlosman, I., & Heller, C. 2006, ApJ, 637, 214
- Martizzi (2020) Martizzi, D. 2020, MNRAS, 492, 79
- Meidt et al. (2015) Meidt, S. E., Hughes, A., Dobbs, C. L., et al. 2015, ApJ, 806, 72
- Molina et al. (2019) Molina, J., Ibar, E., Smail, I., et al. 2019, MNRAS, 487, 4856
- Morrissey et al. (2018) Morrissey, P., Matuszewski, M., Martin, D. C., et al. 2018, ApJ, 864, 93
- Mosleh et al. (2013) Mosleh, M., Williams, R. J., & Franx, M. 2013, ApJ, 777, 117
- Murray et al. (2010) Murray, N., Quataert, E., & Thompson, T. A. 2010, ApJ, 709, 191
- Narayanan et al. (2011) Narayanan, D., Krumholz, M., Ostriker, E. C., & Hernquist, L. 2011, 418, 664
- Oey et al. (2017) Oey, M. S., Herrera, C. N., Silich, S., et al. 2017, ApJ, 849, L1
- Onus et al. (2018) Onus, A., Krumholz, M. R., & Federrath, C. 2018, MNRAS, 479, 1702
- Östlin et al. (2009) Östlin, G., Hayes, M., Kunth, D., et al. 2009, AJ, 138, 923
- Ostriker et al. (2010) Ostriker, E. C., McKee, C. F., & Leroy, A. K. 2010, 721, 975
- Otí-Floranes et al. (2014) Otí-Floranes, H., Mas-Hesse, J. M., Jiménez-Bailón, E., et al. 2014, A&A, 566, A38
- Overzier et al. (2008) Overzier, R. A., Heckman, T. M., Kauffmann, G., et al. 2008, 677, 37
- Pilyugin & Thuan (2005) Pilyugin, L. S., & Thuan, T. X. 2005, 631, 231
- Popesso et al. (2019) Popesso, P., Concas, A., Morselli, L., et al. 2019, MNRAS, 483, 3213
- Rahman et al. (2012) Rahman, N., Bolatto, A. D., Xue, R., et al. 2012, 745, 183
- Regan et al. (1997) Regan, M. W., Vogel, S. N., & Teuben, P. J. 1997, 482, L143
- Renaud et al. (2019) Renaud, F., Bournaud, F., Agertz, O., et al. 2019, A&A, 625, A65
- Romeo et al. (2010) Romeo, A. B., Burkert, A., & Agertz, O. 2010, MNRAS, 407, 1223
- Saintonge et al. (2011) Saintonge, A., Kauffmann, G., Kramer, C., et al. 2011, MNRAS, 415, 32
- Saito et al. (2015) Saito, T., Iono, D., Yun, M. S., et al. 2015, ApJ, 803, 60
- Saito et al. (2016) Saito, T., Iono, D., Xu, C. K., et al. 2016, PASJ, 68, 20
- Salim et al. (2015) Salim, D. M., Federrath, C., & Kewley, L. J. 2015, ApJ, 806, L36
- Sanders et al. (2003) Sanders, D. B., Mazzarella, J. M., Kim, D. C., Surace, J. A., & Soifer, B. T. 2003, AJ, 126, 1607
- Sanders & Mirabel (1996) Sanders, D. B., & Mirabel, I. F. 1996, ARA&A, 34, 749
- Sandstrom et al. (2013) Sandstrom, K. M., Leroy, A. K., Walter, F., et al. 2013, 777, 5
- Schruba et al. (2011) Schruba, A., Leroy, A. K., Walter, F., et al. 2011, AJ, 142, 37
- Semenov et al. (2019) Semenov, V. A., Kravtsov, A. V., & Gnedin, N. Y. 2019, ApJ, 870, 79
- Sharon et al. (2019) Sharon, C. E., Tagore, A. S., Baker, A. J., et al. 2019, ApJ, 879, 52
- Sheth et al. (2005) Sheth, K., Vogel, S. N., Regan, M. W., Thornley, M. D., & Teuben, P. J. 2005, 632, 217
- Shetty & Ostriker (2012) Shetty, R., & Ostriker, E. C. 2012, ApJ, 754, 2
- Simkin et al. (1980) Simkin, S. M., Su, H. J., & Schwarz, M. P. 1980, 237, 404
- Sun et al. (2020) Sun, J., Leroy, A. K., Ostriker, E. C., et al. 2020, ApJ, 892, 148
- Swinbank et al. (2011) Swinbank, A. M., Papadopoulos, P. P., Cox, P., et al. 2011, ApJ, 742, 11
- Tacchella et al. (2016) Tacchella, S., Dekel, A., Carollo, C. M., et al. 2016, MNRAS, 457, 2790
- Tacconi et al. (2020) Tacconi, L. J., Genzel, R., & Sternberg, A. 2020, arXiv e-prints, arXiv:2003.06245
- Tacconi et al. (2018) Tacconi, L. J., Genzel, R., Saintonge, A., et al. 2018, ApJ, 853, 179
- Tadaki et al. (2018) Tadaki, K., Iono, D., Yun, M. S., et al. 2018, Nature, 560, 613
- Toomre (1964) Toomre, A. 1964, ApJ, 139, 1217
- Turner et al. (2015) Turner, J. L., Beck, S. C., Benford, D. J., et al. 2015, Nature, 519, 331
- Utomo et al. (2017) Utomo, D., Bolatto, A. D., Wong, T., et al. 2017, ApJ, 849, 26
- Utomo et al. (2018) Utomo, D., Sun, J., Leroy, A. K., et al. 2018, ApJ, 861, L18
- Veilleux et al. (2020) Veilleux, S., Maiolino, R., Bolatto, A. D., & Aalto, S. 2020, A&A Rev., 28, 2
- Whitaker et al. (2012) Whitaker, K. E., van Dokkum, P. G., Brammer, G., & Franx, M. 2012, 754, L29
- Wiklind (1989) Wiklind, T. 1989, A& A, 219, L11
- Wilson et al. (2019) Wilson, C. D., Elmegreen, B. G., Bemis, A., & Brunetti, N. 2019, arXiv e-prints, arXiv:1907.05432
- Yuan et al. (2017) Yuan, T., Richard, J., Gupta, A., et al. 2017, The Astrophysical Journal, 850, 61
- Zaragoza-Cardiel et al. (2015) Zaragoza-Cardiel, J., Beckman, J. E., Font, J., et al. 2015, MNRAS, 451, 1307
- Zibetti et al. (2009) Zibetti, S., Charlot, S., & Rix, H.-W. 2009, MNRAS, 400, 1181
- Zolotov et al. (2015) Zolotov, A., Dekel, A., Mandelker, N., et al. 2015, MNRAS, 450, 2327
Appendix A Wide Separation Interaction & Possible Galactic Transfer of Gas
IRAS08 is currently experiencing an interaction with a nearby, lower mass companion galaxy at a separation of 60 kpc. In interacting systems there is a complex relationship between mass-ratio, interaction distance, gas content and gas depletion timescale (e.g. Combes et al., 1994; Renaud et al., 2019). Similar to the expectations from the violent disk instability we will compare the properties of the interaction in IRAS08 to those observed in other merging galaxies, to determine if IRAS08 exhbits a natural extension of the behavior that is typical of mergers.
In the GOALS team classification system for mergers (Larson et al., 2016) the IRAS08 system is a “minor merger” due to the mass-ratio. Minor mergers are defined as having a ratio 4:1 of the galaxy to the companion that is likely on the early-stage initial approach. IRAS08 has a ratio of at least 10:1. Observations indicate that even large mass ratio, distant galaxy interactions can increase the SFR of the larger galaxy (Ellison et al., 2008). Simulations suggest that for those large mass ratios (10:1) have only a marginal impact on the structural and kinematic properties of the larger galaxy (Cox et al., 2008).
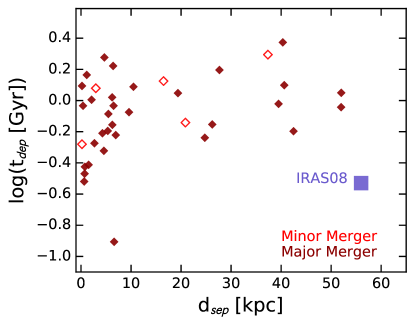
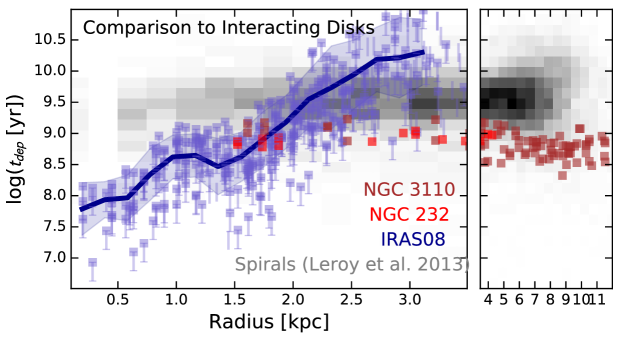
Cannon et al. (2004) show in HI maps that there is a significant reservoir of HI gas extending between the targets. The exact origin of the HI gas is not wholly known. HST/COS observations of IRAS08 show very strong outflows of gas coming out of the center of the galaxy (e.g. Chisholm et al., 2015). Indeed, Cannon et al. (2004) hypothesize that the HI could be related to an outflow. However, based on present observations it is equally likely that the gas has been ejected from the companion, and may represent a transfer of mass from companion to primary galaxy. Hafen et al. (2019) use simulations to argue that this is one of the most common ways for galaxies to exchange gas. More work is needed to characterise the nature of the large radius HI gas. Independent of its origin the HI plume has a mass of M⊙, which is a few percent of the baryonic mass of IRAS08. While by no means a major-merger, this could provide a torquing force to the galaxy. Indeed, in Fig. 1 there is a slight asymmetry to the spiral arms that may indicate an asymmetric gravitational potential.
In Fig. 13 we show that the galaxy averaged for IRAS08 is significantly lower than other merging galaxies from the GOALS sample (Armus et al., 2009). The GOALS sample is significantly well studied in a large number of publications, with a comprehensive set of observations, and therefore is a useful benchmark for properties of merging galaxies. Larson et al. (2016) compares morphological merger classification and separation distance to gas content of interacting galaxies. As we show in Fig. 13, significantly low values of is only observed in interacting galaxies with small separations ( kpc). Even in major-mergers (mass-ratio ) with small separation it is not guaranteed that the depletion time is always decreased in merging systems. When viewed as an interacting galaxy IRAS08 is a significant outlier from the typical behavior of interacting galaxies in the GOALS sample, and does not seem to follow the trends of other interacting galaxies.
Local galaxy M 51 is also experiencing a minor-merger that is far more advanced than IRAS08. The distribution of molecular gas in M 51 is very well studied Leroy et al. (2013); Meidt et al. (2015); Leroy et al. (2017), and as we show in Fig. 8 it does not have the same trend of with radius as in IRAS08.
In Fig. 13 we show that the radial profile of in two similarly wide-separation interacting galaxies (Espada et al., 2018) do not exhibit the same gradient as IRAS08. The two galaxies studied by Espada et al. (2018) are well matched in gas fraction, SFR, total stellar mass, and merger impact parameters to IRAS08, and therefore provide a well controlled comparison. NGC 3110 has a separation of 40 kpc as mass ratio of 14:1, making it a very early stage minor-merger, like IRAS08. NGC 232 also has a wide-seperation of 50 kpc, but with a much more significant mass-ratio of 4:5 with its companion. Both galaxies are massive, M M⊙ and star forming M⊙ yr-1. Neither galaxy shows the same strong decline in toward the galaxy center. Indeed, both NGC 3110 and NGC 232 show a mild increase in in the galaxy center. Other significant differences exists between these two interacting systems and IRAS08. Both NGC 3110 and NGC 232 have very strong gradients in molecular gas velocity dispersion, and both have a disk averaged surface density that is much lower, M⊙ pc-2. Whereas IRAS08 has a nearly constant , Fig. 4, and the surface density at the edge of the disk of order 100 M⊙ pc-2. Espada et al. (2018) shows that the molecular gas surface density in both NGC 232 & NGC 3110 is high in the center, and provide arguments that this is driven by the interaction. However, in NGC 232 and NGC 3110 this does not translate to a lower in the galaxy center.
We can also find that NGC 232 and NGC 3110 do not satisfy predictions of the violent disk instability model. Espada et al. (2018) used numerical simulations to established that the gas flows in NGC 232 and NGC 3110 are most likely due to the interaction from the host. These systems therefore offer a good test to determine of the violent disk instability model. If these galaxies have low and low then this would weaken the case that these metrics are meaningful for IRAS08. We consider the disk and central values for these galaxies using data from Espada et al. (2018) as inputs into Equations 3 & 4 of this paper. At large radius, in the disk, we find & 1.75 for NGC 232 and NGC 3110, respectively. We also find inflow timescales of 7 Gyr and 12 Gyr. In both cases the Toomre parameter suggests the disk is stable and . This is not consistent with violent disk instabilities as drivers of the gas inflow in NGC 232 and NGC 3110. Even in the galaxy center the value for Toomre Q remains high; for both targets . To be clear, this does not mean that IRAS08 is necessarily driven by the instability. It is however a useful to see that and do not result in “false positive” results when we have independent evidence that a gas flow is not driven by an instability.
If the gas flow in IRAS08 is driven by its interaction, then this interaction would be different from other interactions observed in the local Universe. IRAS08 has a molecular gas depletion time that is as short as what is observed in advanced stage mergers (Wilson et al., 2019; Bemis & Wilson, 2019), yet has completely different morphology and kinematics from those systems. Moreover, the strong gradient in is not observed in other wide-separation interacting systems (Espada et al., 2018).
Appendix B Stellar Bar
The F550M image of IRAS08 shows a stellar bar (Fig. 1) in the center of this galaxy. Simulations clearly establish that bars can impact the distribution of gas in galaxies (e.g. Athanassoula, 1992; Simkin et al., 1980). Here we consider the possibility that this bar may contribute to the radial change in and .
The exact impact of bars on gaseous disks is somewhat complex. Along bars star formation tends to be suppressed. This is thought to be due to strong shocks (Athanassoula, 1992), which increase the velocity dispersion of the molecular gas (Maeda et al., 2018). The gas then concentrates in the galaxy centers. Indeed, observations of barred galaxies show preferentially higher molecular gas mass surface densities than non-barred galaxies (Sheth et al., 2005; Jogee et al., 2005; Fisher et al., 2013). However, observations do not show strong evidence for a significant change in the inside of bars (Fisher et al., 2013). Indeed, the majority of disk galaxies in the HERACLES survey (Leroy et al., 2013) are barred systems, as it draws from the general population of star forming disk galaxies. It is this sample that we use for comparison of the radial gradient in (Fig. 5). If barred galaxies showed a significant decrease in in the central kiloparsec this would be dected in Fig. 5, but we see only a slight change toward the center.
It is important to point out that there are substantial differences between the properties of galaxies in most simulations of barred galaxies and in IRAS08 (e.g. Athanassoula, 1992; Regan et al., 1997; Maciejewski et al., 2002). The overall gas velocity dispersion and total gas fraction in IRAS08 are significantly larger than in simulations set to match the Milky Way. Moreover, the bar in IRAS08 is only 2 larger that than the Toomre length derived for this galaxy, which gives an expected size of molecular clouds. Whereas in more typical local barred galaxies the characteristic giant molecular cloud size is 10-100 smaller than the bar. It is not clear how this might affect the interaction between bars and gas. For example, Maciejewski et al. (2002) find that small-scale bars do not produce shocks in galaxy centers, a similar phenomenon could occur in IRAS08. To our knowledge there are no simulations of the impact of bars in a gas medium that has a high velocity dispersion.
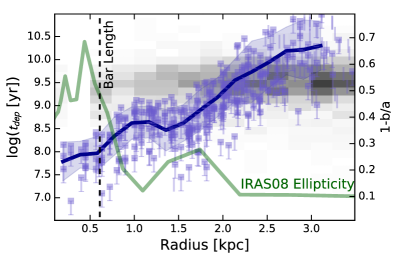
In Fig. 14 we compare the ellipticity of the star-light to the molecular gas depletion time, both as function of radius within the galaxy. There is debate in the literature about exactly where to place the bar length (see discussion in Erwin et al., 2005; Marinova & Jogee, 2007). We use the ellipticity profile of IRAS08 to identify the bar, and choose the bar length as the radius beyond which the ellipticity decrease by 15% from the peak value. Numerical simulations find that this radius is in good agreement with bar lengths as defined by orbital analysis (Martinez-Valpuesta et al., 2006). Moreover, when overlaying this ellipse on the F550M image we find that this radius corresponds to the point at which the bar meets the ring of gas. Fig. 14 shows that the decrease in begins far beyond the radius of the bar.
We note that the ring just beyond the bar, identified as a minimum in the ellipticity profile, is colocated with a relative increase in and a decrease in . Typically, in nearby spiral galaxies rings are associated with more efficient star formation than in the surrounding disk (e.g. Kormendy & Kennicutt, 2004). Rings are found to be very common in disk galaxies at (Genzel et al., 2014), and 4 of 10 galaxies in the DYNAMO sample of gas-rich, clumpy disks show evidence of rings (Fisher et al., 2017b). If rings behave differently in gas-rich galaxies than in local spirals this may be an interesting avenue for further research.
In general, there is not strong evidence that bars lead to enhanced star formation efficiencies in their centers. In IRAS08 the general trend of decreasing begins at radii 3-4 the bar radius, also suggesting this may be a galaxy wide phenomena rather than the bar.
Empirically speaking it is very difficult to determine if the presence of the bar should impact our treatment of IRAS08 as a similar phenomenon as unstable disk galaxies. First, the bar length in IRAS08 is kpc. If IRAS08 were observed at the same resolution as a galaxy with HST this bar would be covered by only 1-2 resolution elements. It would thus not be so straightforward to identify the bar. Moreover, bars are far more easy to identify in redder wavelengths (Eskridge et al., 2002), and observations of restframe V-band light have significantly lower signal-to-noise at , it is conceivable that systematic uncertainties in observations lead to a lower frequency of observed bars at . Finally, bars, rings and spiral structure in local Universe disks are known to be related phenomena (for review Kormendy & Kennicutt, 2004). Sprials and rings are by no means absent from the high- universe. Spiral galaxies have been observed at (Yuan et al., 2017), and recent work with ALMA identifies central concentrations of elongated structures in galaxies at (Hodge et al., 2019). Inoue et al. (2016) argues that massive star forming clumps in many galaxies at may be intrinsically linked to spirals. As noted above, rings are likewise very common at . In short, we will not know if small scale bars (R1 kpc) are common at until the advent of next-generation adaptive optics instruments such as VLT-MAVIS, ELT-MICADO, or TMT-NFIRAOS come on-line in the later part of the next decade.
In summary though bars are well known to drive high molecular gas mass surface density in galaxy centers, the evidence from samples of barred galaxies is that they do not lead to significant changes to the gradient of . Moreover, in IRAS08 the bar is quite small, whereas the gradient in and is a phenomenon that covers the entire disk. At a finer detail, the bar in IRAS08 is probably playing some role in gas redistribution in the central kpc, however, it does not seem to be the main-driver of the full gradient in .