The present-day globular cluster kinematics of lenticular galaxies from the E-MOSAICS simulations and their relation to the galaxy assembly histories
Abstract
We study the present-day rotational velocity () and velocity dispersion () profiles of the globular cluster (GC) systems in a sample of lenticular (S0) galaxies from the E-MOSAICS galaxy formation simulations. We find that of the galaxies have GCs that are rotating along the photometric major axis of the galaxy (aligned), while the remaining of the galaxies do not (misaligned). This is generally consistent with the observations from the SLUGGS survey. For the aligned galaxies, classified as peaked and outwardly decreasing (), flat () and increasing () based on the profiles out to large radii, we do not find any clear correlation between these present-day profiles of the GCs and the past merger histories of the S0 galaxies, unlike in previous simulations of galaxy stars. For just over half of the misaligned galaxies, we find that the GC misalignment is the result of a major merger within the last so that the ex-situ GCs are misaligned by an angle between (co-rotation) to (counter-rotation) with respect to the in-situ GCs, depending on the orbital configuration of the merging galaxies. For the remaining misaligned galaxies, we suggest that the in-situ metal-poor GCs, formed at early times, have undergone more frequent kinematic perturbations than the in-situ metal-rich GCs. We also find that the GCs accreted early and the in-situ GCs are predominantly located within virial radii () from the centre of galaxies in 3D phase-space diagrams.
keywords:
galaxies: elliptical and lenticular, cD – galaxies: formation – galaxies: kinematics and dynamics – galaxies: star clusters: general1 Introduction
Lenticular (S0) galaxies are characterized by a bulge surrounded by a smooth disk with very little or no ongoing star-formation. The fraction of lenticular galaxies is found to increase within the high density environments of rich galaxy clusters at the expense of spiral galaxies (Dressler, 1980; Dressler et al., 1997; Fasano et al., 2000). For this reason, understanding how S0 galaxies form is important for constraining which physical processes play a dominant role in the transformation and quenching of galaxies in different environments.
Focusing on the kinematic properties of galaxies, previous studies have found that S0 galaxies in the field and small galaxy groups are more pressure-supported than S0 galaxies in clusters (Coccato et al., 2020; Deeley et al., 2020). Additionally, S0 galaxies in the field and small galaxy groups also showed more frequently misaligned stellar and gas kinematics than cluster S0s (Deeley et al., 2020). These results suggest that cluster S0 galaxies are consistent with spiral progenitors, i.e. faded spirals, that had their star formation quenched and their spiral arm structure suppressed as a result of the interaction with the environment, e.g. ram-pressure stripping, tidal interactions, starvation (Gunn & Gott, 1972; Larson et al., 1980; Bekki, 2009; Bekki & Couch, 2011; Merluzzi et al., 2016). On the other hand, S0 galaxies in the field and small galaxy groups are likely the result of more complex formation histories that involved multiple mergers and accretion events (e.g. Tapia et al. 2017; Eliche-Moral et al. 2018; Dolfi et al. 2020, 2021).
Previous works have used simulations to study the formation of S0 galaxies through mergers and investigate how mergers influence their kinematic properties. Results showed that both major (mass-ratio 1:4) and minor (1:10 mass-ratio 1:4) mergers can produce S0 galaxies (Bournaud et al., 2005; Wu et al., 2014; Naab et al., 2014; Tapia et al., 2017; Eliche-Moral et al., 2018; Schulze et al., 2020) and, specifically, major mergers are expected to spin up the rotation of the stars out to large radii, while minor mergers are expected to decrease it (Naab et al., 2014; Wu et al., 2014; Schulze et al., 2020).
The commonly proposed two-phase formation scenario for massive early-type galaxies (ETGs) suggests that the galaxies had an early () in-situ formation during which they formed most of their stellar mass, followed by the late () accretion of dwarf galaxies in mini mergers (mass-ratio 1:10) onto their outskirts (Oser et al., 2010; Damjanov et al., 2014; Zolotov et al., 2015; Rodriguez-Gomez et al., 2016). These late mini mergers are expected to decrease the rotation of the stars at large radii, where the galaxy transitions from a fast-rotating disk to a slowly rotating spheroidal component (Arnold et al., 2011, 2014; Guérou et al., 2016; Bellstedt et al., 2017; Dolfi et al., 2020).
These results suggest that it is important to investigate the full kinematic behaviour of the galaxies from the inner regions out to the outskirts, in order to identify the presence of transitions that can help us to constrain the galaxy specific merger and accretion histories.
In a more recent work, Schulze et al. (2020) investigated the kinematic profiles of stars out to effective radii () of a sample of ETGs with from the Magneticum simulations. From the ratio of the rotation velocity to velocity dispersion profiles (), they identified three distinct kinematic profile shapes: a peaked and outwardly decreasing (peaked, hereafter), an increasing, and a flat profile out to that were likely the result of the different merger histories of the galaxies. Specifically, they suggested that galaxies with peaked profiles had an assembly history characterized by the late accretion of dwarf galaxies in minor and mini mergers that were disrupted beyond , enhancing the random motion of the galaxy outskirts without disrupting its central disk-like kinematics. The galaxies with flat and increasing profiles were more likely to have experienced a late (i.e. ) major merger event. This event was likely more gas-rich for galaxies with increasing profiles, leading to the re-formation of a disk component and the rising of the rotational velocity of the stars out to large radii. On the other hand, the late major merger event did not contribute to a significant gas fraction in the galaxies with flat profiles and likely disrupted the central disk-like kinematics of the galaxy. Therefore, we expect that the present-day stellar profiles of ETGs can be used to constrain their past assembly history.
In Dolfi et al. (2021), we studied the kinematic properties of a selected sample of S0 galaxies from the SAGES Legacy Unifying Globulars and GalaxieS (SLUGGS; Brodie et al. 2014) survey extending out to -. To reach out to , we combined the stellar kinematics (Arnold et al., 2014; Foster et al., 2016) with those of the globular clusters (GCs; Forbes et al. 2017a) and planetary nebulae (PNe; Pulsoni et al. 2018), which can be more easily probe out to large radii due to their brightness. Both the GCs and PNe are expected to trace the underlying stellar population of the ETGs. In fact, the PNe are stars with initial masses that have evolved past the main sequence towards the red giant phase and should, thus, trace the kinematics of the stars out to large radii (e.g. Romanowsky 2006; Buzzoni et al. 2006). On the other hand, the GCs typically display a colour bimodality that reflects the two distinct sub-populations: the red, metal-rich and blue, metal-poor GCs. These two GC sub-populations are not necessarily equal to the in-situ and ex-situ (accreted) GCs, respectively (Forbes et al., 2018; Kruijssen et al., 2019a), however they are expected to trace the galaxy kinematics differently (Trujillo-Gomez et al., 2021). The red, metal-rich GCs are expected to trace the kinematics of the bulge and spheroid in ETGs, since they largely formed in-situ at roughly the same time as the bulk of the host galaxy stars. The blue, metal-poor GCs are expected to trace the kinematics of the stellar halo of the galaxy, since they likely formed at earlier times than the red, metal-rich GCs or were later accreted onto the galaxy (Forbes, 1997; Strader et al., 2005; Brodie & Strader, 2006). In a recent work, using the E-MOSAICS simulations, Reina-Campos et al. (2021) found that the metal-poor GCs typically have more extended and shallower surface density profiles than the metal-rich GCs, suggesting an accreted origin for a significant fraction of the former. The surface density profile of the metal-poor GCs is also found to correlate with the slope of the dark matter halo density profile, therefore suggesting that the GC sub-populations are excellent probes for studying the outskirts of the galaxies. Additionally, simulations have also shown that major mergers are expected to spin up the rotation of the GC population at large radii, as opposed to minor mergers that are expected to decrease it (Bekki et al., 2005).
From the study in Dolfi et al. (2021), we found that of the galaxies had consistent stellar, GCs and PNe kinematics with their rotation occurring along the photometric major-axis of the galaxy (aligned galaxies). In the remaining galaxies, the PNe and GCs were rotating along a kinematic axis misaligned with respect to that of the stars, which was consistent with the photometric major-axis of the galaxy (misaligned galaxies). These results seem to suggest distinct assembly histories for the aligned and misaligned galaxies, with the latter having likely undergone more recent and multiple accretion events. Among the aligned galaxies, we also found that galaxies show a peaked profile, while the remaining galaxies show a flat profile. Therefore, the comparison with the simulations of Schulze et al. (2020) would suggest an assembly from late minor and mini mergers for the peaked galaxies, while the flat galaxies were likely involved in a merger with higher mass-ratio.
However, these results assume that both GCs and PNe are tracing the kinematics of the underlying stellar population out to large radii. We find that this seems to be the case for the aligned galaxies, but not for the remaining misaligned galaxies that show twists in the kinematic position angle as a function of the galactocentric radius (see figure 3 in Dolfi et al. 2021).
In light of this, the aim of this paper is to use the E-MOSAICS111MOdelling Star cluster population Assembly In Cosmological Simulations within EAGLE (https://www.astro.ljmu.ac.uk/~astjpfef/e-mosaics/) simulations (Pfeffer et al., 2018; Kruijssen et al., 2019a) to study the present-day kinematic properties of the GC systems of the S0 galaxies to understand how they are related to the past formation histories of the S0 galaxies. In a recent work, Deeley et al. (2021) have found that more than half (i.e. ) of the S0 galaxies from the IllustrisTNG simulations have formed through significant merger events, while the remaining have formed through gas stripping events as a result of the infall onto a galaxy group or cluster. Therefore, as one of the most dominant S0 formation pathways, it is important to further understand how the different merger events affect the present-day kinematic properties of S0 galaxies out to large galactocentric radii and, specifically, the kinematic properties of the GC systems that have been studied. We also aim to further investigate the evolution of the aligned and misaligned galaxies to understand what physical processes are responsible for the present-day GC misalignment that we see in the observations from the SLUGGS survey (Dolfi et al., 2021).
The structure of the paper is as follows. In Sec. 2, we describe the E-MOSAICS simulations. In Sec. 3, we describe the selection criteria of the simulated S0 galaxy sample as well as of the GC systems of each galaxy. In Sec. 4, we describe the kinematic analysis and results of the GC systems of our selected S0 galaxies and we also investigate the kinematics of the metal-rich and metal-poor GCs separately for a sub-sample of the galaxies. In Sec. 5, we study whether there exists a correlation between the location of the GC systems of the galaxies on the 3D phase-space diagrams and their accretion time onto the galaxy. In Sec. 6, we discuss the assembly histories of our simulated galaxies by investigating the relation between the profiles of the GCs with the merger histories of the galaxies derived from the E-MOSAICS simulations. In Sec. 7, we summarize our results and conclusions.
2 The E-MOSAICS simulations
E-MOSAICS is a suite of models designed to study the formation and evolution of star clusters and of their host galaxies (Pfeffer et al., 2018). E-MOSAICS is obtained from a combination of the MOSAICS (Kruijssen & Lamers, 2008; Kruijssen & Mieske, 2009; Kruijssen et al., 2011; Pfeffer et al., 2018) semi-analytic model for the star cluster formation and evolution, and the suite of cosmological, hydrodynamical simulations from EAGLE (Schaye et al., 2015; Crain et al., 2015) for the formation and evolution of galaxies in a standard cold dark matter (CDM) Universe.
EAGLE is run using a modified version of the N-Body Tree-PM smoothed particle hydrodynamics (SPH) code, GADGET3 (Springel et al., 2005), which includes modifications to the SPH code, time stepping scheme and sub-grid physics models implemented in the simulations. Some of the main relevant physical processes that are implemented in the simulations within these sub-grid models include radiative cooling, reionization, star formation, stellar mass loss and metal enrichment, feedback from star formation and active galactic nuclei, black hole growth from gas accretion and mergers. The efficiency of the sub-grid models for feedback are calibrated in order to reproduce certain observables. Specifically, the efficiency from the AGN feedback is calibrated to ensure that the simulations are reproducing the observed present-day relation between the central black hole mass and galaxy stellar mass. On the other hand, the efficiency from stellar feedback is calibrated to reproduce the observed present-day galaxy stellar mass to halo mass relation (Schaye et al., 2015).
MOSAICS is a semi-analytic model for the formation and evolution of star clusters that is incorporated into the EAGLE simulations of galaxy formation as a sub-grid model (Kruijssen et al., 2011). Within this model star clusters are not simulated as individual particles, but they are formed as a sub-grid component of a star particle that is produced as a result of a gravitationally unstable gas particle in the simulations. Therefore, a fraction of the mass of the newborn star particle (which is set by the cluster formation efficiency; Bastian 2008) is used to generate a sub-grid population of star clusters, of which the initial properties are derived from the properties of the local gas and star particle at the moment of their formation (Kruijssen, 2012; Reina-Campos & Kruijssen, 2017). Subsequently to their formation, star clusters evolve and undergo mass-loss as a result of stellar evolution, modelled following the implementation for the star particles in EAGLE (Wiersma et al., 2009), two-body relaxation (Lamers et al., 2005) and tidal shocks from the interstellar medium. Dynamical friction is also another important process which may be responsible for the mass-loss and disruption of star clusters and it is included in post-processing in E-MOSAICS (Pfeffer et al., 2018). The timescales of dynamical friction are calculated for each star cluster according to the definition by Lacey & Cole (1993) and star clusters are assumed to be completely disrupted by dynamical friction if their ages exceed the timescale for dynamical friction. Dynamical friction is most effective in the disruption of the most massive star clusters and at small galactocentric radii.
The present-day (i.e. ) stellar masses of the star clusters formed within the simulations can range between (Pfeffer et al., 2018). However, the lowest mass star clusters with are immediately removed after their formation. On the other hand, the star clusters with are typically disrupted due to tidal shocks over the course of a Hubble time, while the high-mass star clusters (i.e. ) are removed by dynamical friction. The globular cluster mass function in E-MOSAICS is found to agree well with that of observed galaxies at the high-mass end (i.e. ). However, the simulations overproduce the number of star clusters with . Indeed, star clusters with are overestimated by a factor of -, while star clusters with are overestimated by a factor of - in E-MOSAICS (Pfeffer et al., 2018). This issue may be traced to the fact that EAGLE does not incorporate an explicit model of the cold interstellar medium (ISM) and, as a result, low-mass star clusters are not efficiently disrupted through tidal shocks from the interactions with the ISM.
The inefficiency of the simulations at disrupting star clusters, due to the lack of an explicit cold ISM model in EAGLE, is also responsible for the excess of metal-rich GCs in E-MOSAICS. Specifically, the simulations overproduce the number of metal-rich GCs by a factor of in the metallicity range and by a factor of in the metallicity range (Kruijssen et al., 2019a). However, Kruijssen et al. (2019a) found that the overproduction of the metal-rich GCs in the metallicity range in the simulations does not have a statistically significant impact on the derived properties and correlations describing the formation and evolution of the galaxies.
In Sec. 3.2, we will discuss the adopted selection criteria to minimize the impact of the overproduction of the low-mass star clusters in our kinematic results.
Overall, the E-MOSAICS simulations are found to be able to reproduce most of the key observed properties of both young and old star cluster populations in their host galaxies. For this reason, they have been used in previous works to reconstruct the merger and accretion history of the Milky Way by comparing the age, metallicity and orbital properties of the observed GCs with those from the simulations (e.g. Kruijssen et al. 2019b; Pfeffer et al. 2020; Kruijssen et al. 2020; Trujillo-Gomez et al. 2021).
In addition to the initial suite of zoom-in simulations of Milky Way-mass galaxies, the cosmological volume of the E-MOSAICS simulations spans (Crain et al., in prep.; first reported in section 2.2 of Bastian et al. 2020) and the simulations have an initial gas particle mass of , thus they can resolve galaxies with with more than stellar particles. However, E-MOSAICS includes very few massive galaxies with that are mainly ellipticals (Correa et al., 2017). At the same time, the largest galaxy cluster included in the simulations has halo mass , i.e. Fornax cluster-like, meaning that E-MOSAICS does not probe the dense environments of rich galaxy clusters, e.g. Coma cluster-like. Therefore, E-MOSAICS is limited to the low-density environments of the field and galaxy groups.
GalaxyID = 4315753
3 The Data
3.1 The S0 galaxy sample
From the simulations, we initially select galaxies with total stellar masses . This lower limit on the total galaxy stellar mass is chosen to match the stellar mass distribution of the observed early-type galaxies (ETGs) from the SLUGGS survey (Brodie et al., 2014; Forbes et al., 2017b).
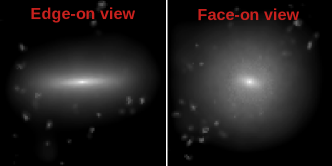
We produce mock SDSS -band images of the edge-on and face-on view of each galaxy, colour-coded by the surface brightness calculated for each stellar particle using the fsps stellar population model (Conroy et al., 2009; Conroy & Gunn, 2010). The images are modified to enhance the spiral arms so that we could more easily identify the S0 galaxies for our final sample. Therefore, following Trayford et al. (2017), young stars (i.e. old) are re-sampled from the star-forming gas particles at higher resolution (i.e. ), assuming a constant star-formation rate, in order to better trace the spiral structure of galaxies. The synthetic images were generated using SPHviewer (Benitez-Llambay, 2015).
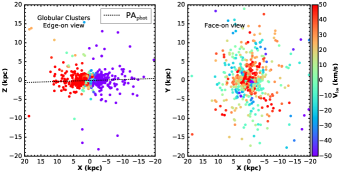
From the visual inspection of the edge-on and face-on images, which was performed by one of the authors of this paper (WJC), we identify S0 galaxies. The S0 galaxies are selected based on the identification of a disk component and absence of the spiral arms from the edge-on and face-on view images. However, despite the best effort to identify a representative sample of S0 galaxies, we note that there may still be few mis-classified S0s in our sample that may be prolate ellipticals. Fig. 1 shows the edge-on and face-on view of one example S0 galaxy from the E-MOSAICS simulations, which is included in our final sample. We also show the corresponding edge-on and face-on spatial distributions of the GC system of the galaxy colour-coded by the line-of-sight velocity after applying the selection criteria described in Sec. 3.2.1-3.2.4. We note the presence of luminous clumps around the galaxy in Fig. 1. However, these very disperse clumps are not necessarily a sign of spiral arm structure, but they are a result of the smoothing adopted to enhance the youngest stars with respect to the old stars.
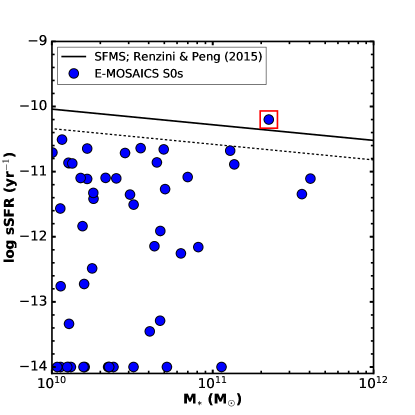
Next, we consider the specific star formation rate (sSFR) of the visually selected S0 galaxies and we include in our final sample only those galaxies with sSFR more than below the star-forming main sequence (SFMS). This constraint should ensure that we are reliably selecting a population of quenched galaxies, if the scatter of the SFMS is , as found in previous studies (e.g. Speagle et al. 2014). Fig. 2 shows the distribution of our S0 galaxies from the E-MOSAICS simulations on the sSFR- plane (blue dots), with the best-fit line of the location of the SFMS (solid black line) from Renzini & Peng (2015). We note that in the EAGLE simulations the for the SFMS at (see figure 5 in Furlong et al. 2015), which is consistent with the value obtained from the SFMS relation of Renzini & Peng (2015) for the same stellar mass, as shown in Fig. 2. We find that only one galaxy fails to satisfy our selection criteria based on the sSFR, as it lies above the SFMS (red square in Fig. 2). Therefore, we exclude this galaxy from our final sample. We note that there are galaxies in the simulations with very low star-formation rates (SFR) that are practically equal to zero. In Fig. 2, we plot these galaxies with a fixed . After the sSFR cut, we obtain a final sample of S0 galaxies, with quenched star-formation, from the E-MOSAICS simulations.
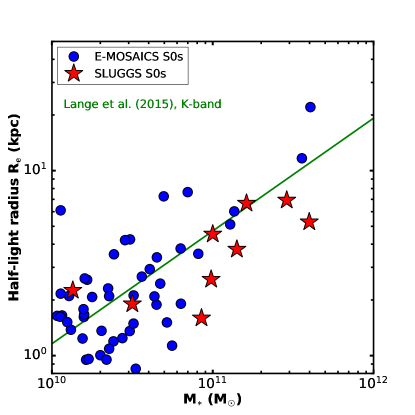
In Fig. 3, we show the distribution of our final sample of simulated S0 galaxies in the half-light radius ()-stellar mass () plane (blue dots). Here, we assume that mass follows light in the simulations and, therefore, that the 2D half-mass radius of our E-MOSAICS S0 galaxies is equal to the 2D half-light radius, . For comparison, we also show the nine S0 galaxies (red stars), observed from the SLUGGS survey (Brodie et al., 2014), that we have studied in our previous works (Dolfi et al., 2020, 2021). For the observed galaxies, the circularized radius () and the total stellar mass () are taken from Forbes et al. (2017b). The solid line represents the - single power-law relation of ETGs from Lange et al. (2015), which is obtained using the best-fitting parameters in the -band for the ETGs with (see table B2 in Lange et al. 2015).
In Fig. 3, we note that there is quite a bit of scatter of both our simulated and observed S0 galaxies around the -band single power-relation of ETGs with from Lange et al. (2015). Additionally, there is also one simulated S0 with characterized by very large . In Lange et al. (2015), the authors do not report the scatter of the observed data around the - single power-relation of ETGs. However, we note that the ETGs from Lange et al. (2015) show an overall similar scatter around the corresponding -band single power-law relation, with ETGs having ranging between - at and between - at . At , some ETGs also show half-light radii as large as . This scatter in the - plane of ETGs slightly depends on the imaging band from which the of the galaxies was calculated, being the largest in the -band (Lange et al., 2015). In a recent work, de Graaff et al. (2021) produced mock -band images of galaxies in the EAGLE simulations to compare the mass-size relation of simulated and observed galaxies. They found that using the -band sizes measured for the simulated galaxies improves the agreement between the simulated and observed mass-size relation of quiescent and star-forming galaxies. Therefore, we conclude that our simulated and observed S0 galaxies are, overall, consistent with the - relation from Lange et al. (2015) in Fig. 3.
Fig. 3 also shows that our simulated S0 galaxies cover overall a similar stellar mass range as our observed S0 galaxies from the SLUGGS survey. However, we note a bias of the S0 galaxies from the SLUGGS survey to higher stellar masses (i.e. ) than the S0 galaxies from the E-MOSAICS simulations. This is due to the fact that the EAGLE simulations do not contain many high-mass galaxies with and that the majority of these massive galaxies in EAGLE are ellipticals (Correa et al., 2017). Finally, due to the limited volume of the E-MOSAICS simulations, the majority of the simulated galaxies are located in low-density environments (i.e. field and galaxy groups; see Sec.2), similarly to the observed S0 galaxies from the SLUGGS survey. Therefore, the consistency between the environment of the S0 galaxies from the SLUGGS survey and E-MOSAICS simulations allow us to make comparisons between our simulated and observed S0 galaxy sample, when investigating how their kinematic properties relate to the merger histories of the galaxies. Additionally, in the next Sec. 4.1, we will consider the high-mass (i.e. ) S0 galaxy sub-sample in the simulations for the comparison with the SLUGGS survey.
3.2 The GC systems of the S0 galaxies in the E-MOSAICS simulations
3.2.1 GC selection: stellar mass cut
For each of the S0 galaxies from the E-MOSAICS simulations in the previous Sec. 3.1, we select all of their star clusters that are gravitationally bound to the host galaxy and have stellar masses at . This stellar mass cut ensures that our kinematic results will not be influenced by the overabundant population of the low-mass (i.e. ) star clusters that were not destroyed from the interaction with the cold ISM (see Sec. 2). The same stellar mass cut (i.e. ) was also used by Kruijssen et al. (2019a), as they found that the GC mass function of their sample of simulated galaxies was consistent with that of the Milky Way after removing the lower mass GCs.
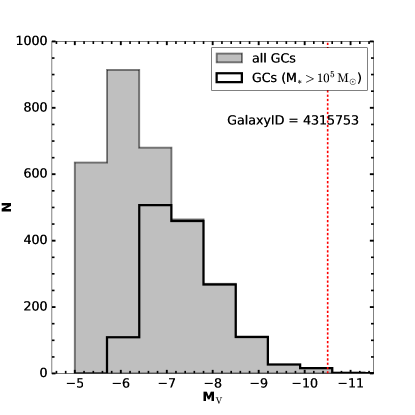
3.2.2 GC selection: magnitude cut
Fig. 4 shows the -band GC luminosity function of one S0 galaxy from our selected sample, as an example. The grey histogram shows the -band GC luminosity function prior to applying any stellar mass cut to the GC system, while the black histogram is obtained after removing the low-mass GCs with . We notice that the -band GC luminosity function resembles more the shape of a Gaussian with a luminosity peak at when selecting only the GCs with for typically all the GC systems of the S0 galaxies in our sample. This is more consistent with the -band GC luminosity function of observed galaxies, which is characterized by a Gaussian-like shape with luminosity peak typically located at (e.g. Forbes et al. 2018). The non Gaussian-like shape with prominent peak below of the GC systems of our S0 galaxies seems likely to be the result of the overabundant population of the low-mass () star clusters that are not being efficiently disrupted in the simulations (see Sec. 2), as shown in Fig. 4 prior to applying any GC stellar mass cut. For this reason, we exclude these low-mass star clusters in order to avoid significant contamination from these objects. The red vertical dashed line shows the -band magnitude of the brightest GC that is included in the system (i.e. ). This luminosity limit is chosen to include up to the -band magnitude of -Centauri (), which is the most luminous GC of the Milky Way, consistent with the observations of the GC systems from the SLUGGS survey (Pota et al., 2013).
3.2.3 GC selection: age cut
Since, in this work, we are mainly interested in studying the kinematic properties of the GCs (i.e. old star clusters), we then select only those star clusters with ages above in each galaxy. In the Milky Way, an age cut above would only exclude three of its GCs, as the bulk of its GCs are older than (see figure 1 in Forbes 2020). While galaxies may have a larger spread in the ages of their GCs with some being old (see NGC 3377 in Usher et al. 2019), the bulk of the GCs has typically old ages () in the remaining galaxies (Usher et al., 2019). Overall, we find that the fraction of the star clusters with ages below accounts for of the total GC population in of our simulated S0 galaxies. Therefore, the majority of our galaxies are dominated by an old GC population which is the main focus of this work.
3.2.4 GC selection: metallicity cut
Following Kruijssen et al. (2019a), we remove the most metal-poor GCs with . Specifically, Kruijssen et al. (2019a) restricted the analysis to the GC metallicity range to mimic the metallicity distributions spanned by the observed GCs of the Milky Way and M31, while reducing the contamination from the overproduced metal-rich GCs (see Sec. 2). In this work, the adopted low metallicity cut is also observationally motivated. In fact, previous spectroscopy analyses have measured the metallicity of the GCs of the observed ETGs from the SLUGGS survey and found that all the GCs had metallicity (Pastorello et al., 2015; Usher et al., 2019). Additionally, we find that the metal-poor GCs with are very low in numbers accounting for less than of the total GC population in each one of our simulated S0 galaxies, in accordance with the results discussed in the previous works of Pfeffer et al. (2018); Kruijssen et al. (2019a). In fact, previous works also predict the existence of a metallicity floor at as a result of the galaxy mass-metallicity relation, below which high-redshift low-mass galaxies could not form GCs that were massive enough (i.e. ) to survive until the present-day (Beasley et al., 2019; Kruijssen et al., 2019b). Additionally, these low-mass galaxies are also not resolved in the E-MOSAICS simulations, since they are expected to have stellar mass at (Kruijssen et al., 2019b), which is the particle resolution of the simulations. For this reason, metal-poor stars with are not reliable as they are not modelled in the simulations. However, these results do not rule out the existence of GCs with metallicity , as suggested by the discovery of a very metal-poor GC with in M31 (Larsen et al., 2020). Therefore, while GCs with may likely exist in the local Universe, they are expected to be rare and low in numbers as seen in the simulations. For this reason, their removal should not significantly influence the results in this work.
On the other hand, we do not apply any cut to the overproduced GC population in the metallicity range , since our tests show that the inclusion of this GC population does not significantly impact the kinematic properties of the GC systems of our simulated S0 galaxies. Additionally, recent results have found that the high metallicity GCs are not overproduced in massive galaxies (i.e. ), but mainly in galaxies with stellar masses between (Pfeffer et al., in prep.). Overall, the metallicity range of the GC systems of our sample of selected S0 galaxies from the E-MOSAICS simulations is consistent with the metallicity measured for the GC systems of the observed ETGs from the SLUGGS survey (e.g. Pastorello et al. 2015; Usher et al. 2019), which we have studied in our previous work (Dolfi et al., 2021).
3.2.5 GC selection: surface density cut
We find that a very small fraction of our S0 galaxies are characterized by very extended GC systems that reach out to galactocentric radii as large as -. Most of these galaxies also show evidence of shells or tidal tails from the visual inspection of their images with Mpc-scale field-of-views (FoV), suggesting that they may have recently experienced interactions. Therefore, we apply an observationally motivated cut to the surface density profile of the GC systems of our S0 galaxies, in order to avoid contamination from potential outliers GCs that may belong to the outer regions of the satellite galaxies orbiting around the central galaxy. Pota et al. (2013) found that the surface density profiles of the red and blue GCs of the ETGs from the SLUGGS survey reach levels as low as , corresponding to . After we apply the same density cut to the GC surface density profiles of all our simulated S0 galaxies, the GC systems extend out to galactocentric radii ranging between -. This is overall consistent with the radial extension of the observed S0 galaxies from the SLUGGS survey, with the most extended galaxy reaching out to
Aligned galaxies
![[Uncaptioned image]](/html/2202.00020/assets/x9.png)
![[Uncaptioned image]](/html/2202.00020/assets/x10.png)
![[Uncaptioned image]](/html/2202.00020/assets/x11.png)
Misaligned galaxies
4 Kinematic Analysis and Results
In this section, we calculate the 1D kinematic profiles of the GC systems of our selected sample of S0 galaxies from the E-MOSAICS simulations after applying the GC selection criteria described in Sec. 3.2. Here, all the galaxies are rotated such that the angular momentum vector of the stars aligns with the -axis (i.e. the disk lies on the -plane). We carry out the kinematic analysis focusing on the edge-on projection of the galaxy. We note that the viewing angle may have an influence for the comparison with the observations from the SLUGGS survey that are characterized by random viewing angles as well as for the comparison with other simulations.
To calculate the 1D kinematic profiles of the GC systems of our simulated S0 galaxies, we use the kinemetry222http://davor.krajnovic.org/idl/ method developed by Krajnović et al. (2011). Within this method, we bin our data in elliptical annuli centered on the galaxy and we recover the best-fitting moments of the line-of-sight-velocity-distribution (LOSVD) along each annulus. The best-fitting LOSVD moments are calculated by performing a least-square minimization between the disk model, described by equations 3 and 4 shown in Dolfi et al. (2020), and our kinematic data. The details of the application of this method to sparse and non-homogeneous kinematic datasets are given in Proctor et al. (2009); Bellstedt et al. (2017); Dolfi et al. (2020), while the details describing the -minimization are given in Foster et al. (2011, 2016).
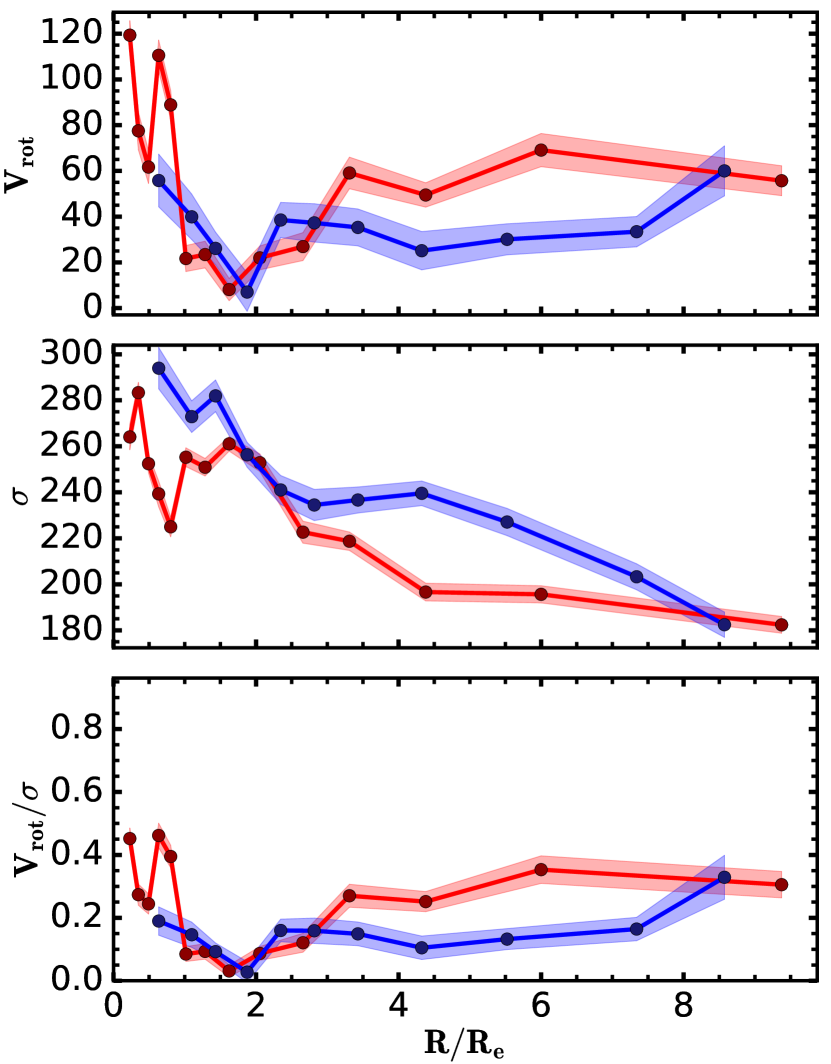
As previously done in Dolfi et al. (2020, 2021), we calculate the first two moments of the LOSVD of the GC systems of our S0 galaxies, i.e. rotation velocity () and velocity dispersion () profiles, from which we derive the corresponding profiles. The velocity dispersion of the GCs is calculated by performing a nearest neighbour binning, as described in our previous work (Dolfi et al., 2020). We also fit for both the kinematic position angle () and kinematic axial-ratio (), where they are well constrained and do not excessively vary as a function of the galactocentric radius. If this is not the case, then we fix the to the photometric position angle ()333 is estimated from the edge-on view of the images of the S0 galaxies shown in Fig. 1. It is measured from North towards East for consistency with the . of the galaxy and we fix the to the mean value obtained from the unconstrained fit. The errors on the and profiles are calculated by running kinemetry on bootstrapped samples obtained by sampling with replacement the original dataset. On the other hand, the errors on the and profiles are the standard errors of the mean, calculated from the standard deviation of the velocity and velocity dispersion measurements of the data points in each elliptical annulus divided by the square root of the number of points in each bin.
4.1 1D kinematic profiles of the GC systems of the S0 galaxies in the E-MOSAICS simulations
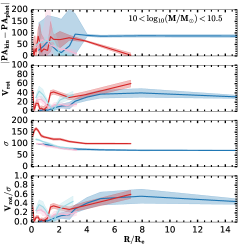
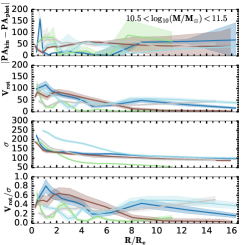
Fig. 6 shows the 1D kinematic profiles of the GC systems of our selected sample of S0 galaxies from the E-MOSAICS simulations. Since the colour-magnitude diagrams of the GC systems do not show evidence of any colour bimodality, as it was the case for the S0 galaxies from the SLUGGS survey (Pota et al., 2013), we do not split here between the red and blue GC sub-populations. However, in the next Sec. 4.2, we will investigate whether the metal-rich and metal-poor GC sub-populations show different kinematic behaviours by adopting the same fixed metallicity cut at for all the GC systems of our S0 galaxies.
We classify the galaxies as aligned (Sec. 4.1.1) if the GCs are rotating along the photometric major axis () of the galaxy within the errors. Otherwise, we classify the galaxies as misaligned (Sec. 4.1.2).
Finally, we divide both aligned and misaligned galaxies into two stellar mass bins: low-mass and high-mass . The high stellar mass bin is consistent with the stellar mass range covered by all the observed S0 galaxies from the SLUGGS survey that we have studied in Dolfi et al. (2021), with the exception of one very low-mass S0 (i.e. NGC 7457).
4.1.1 Aligned galaxies
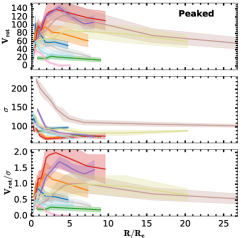
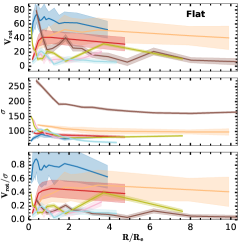
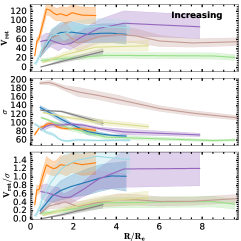
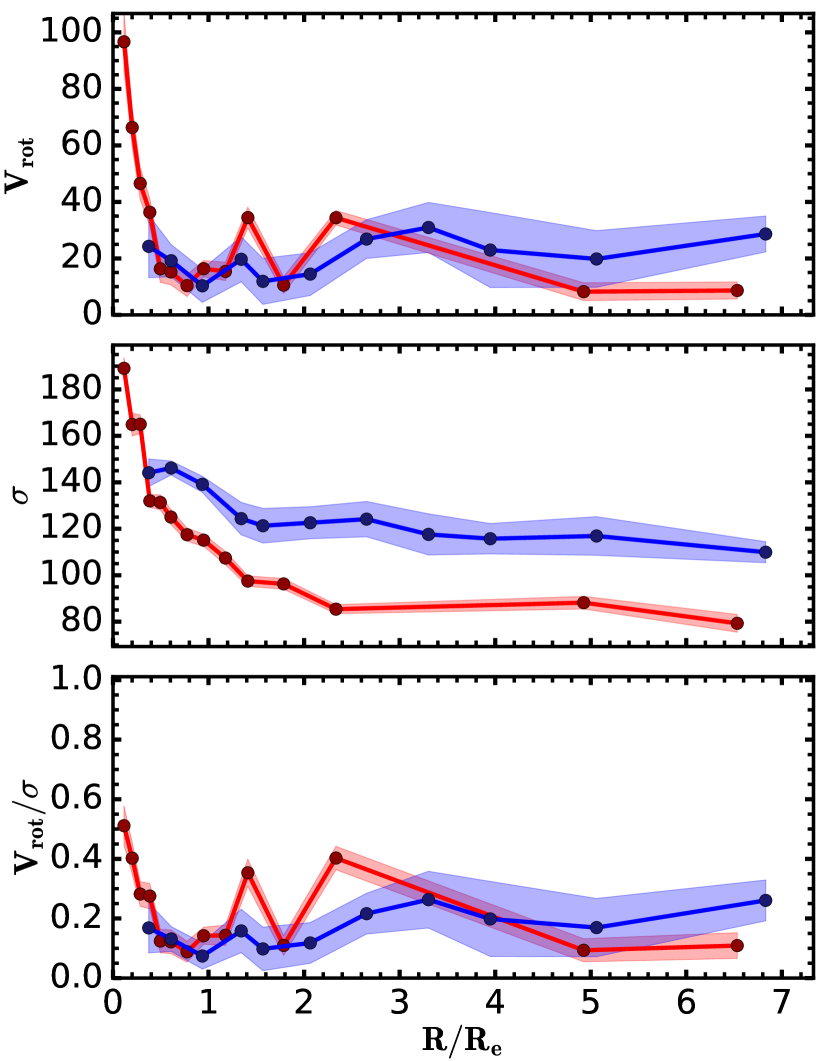
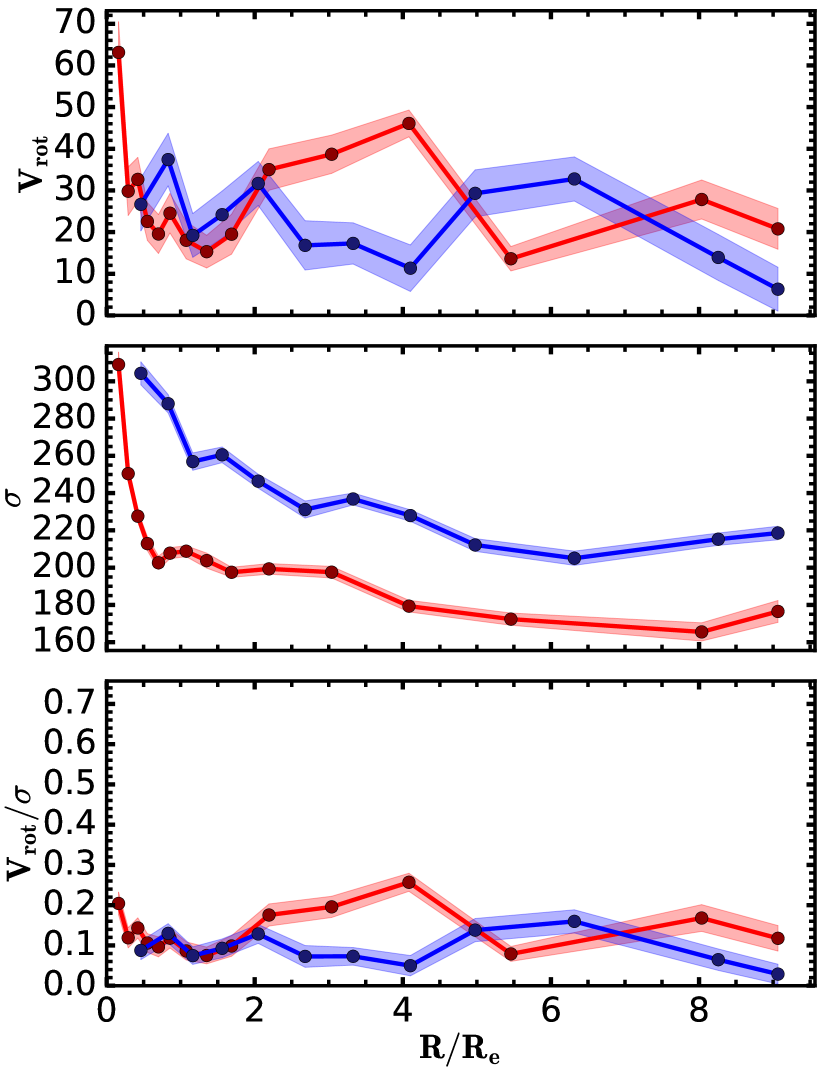
Following the simulations from Schulze et al. (2020), we classify the profiles of the GCs of the aligned galaxies (see Fig. 6, top) as peaked, flat or increasing based on the gradient calculated between the outer and inner regions of the GC profiles. Specifically, we calculate the gradient (i.e. ) as the difference between the mean value of the in the outer (i.e. ) and inner (i.e ) radial bins. We classify the galaxy as peaked, flat or increasing if the gradient is , or , respectively, as defined by Schulze et al. (2020).
However, we note here that the stellar profiles of Schulze et al. (2020) do not extend beyond . On the other hand, the profiles of the GC systems of our simulated S0s also typically extend out to , with galaxies also reaching beyond . Additionally, the peaked profiles of the GC systems of our S0 galaxies can have rotational velocities that reach their peak value at larger radii (i.e. beyond ) than found by Schulze et al. (2020) for their peaked galaxies. Indeed, some of our S0 galaxies show profiles peaking at (or beyond) and decreasing outwardly, so they would be classified as increasing according to the definition by Schulze et al. (2020) out to . Therefore, for these galaxies whose profiles extend beyond , we also look at their kinematic behaviour at larger radii in order to properly classify them into one of the three categories from Schulze et al. (2020).
Fig. 6 (top) shows the aligned galaxies ( of total) split into the peaked, flat and increasing profile shapes from the top to the bottom panels, respectively. Each sub-figure of Fig. 6 (top) shows the 1D , and profiles of GC systems of the S0 galaxies in the low (; left column) and high (; right column) stellar mass bins.
We find that that the peaked, flat and increasing profile shapes occur in similar numbers, i.e. , and , respectively, in the low stellar mass bin, while the peaked profile shape is the dominant one in the high stellar mass bin. In fact, galaxies show a peaked profile shape as opposed to the flat and increasing profile shapes that contain only galaxies each at the high stellar masses. We also investigated the kinematics of the GC systems of the central and satellite galaxies. However, we did not see any clear differences, unlike previous works that found that S0 galaxies in clusters are typically more rotationally supported than S0 galaxies in the field (Deeley et al., 2020; Coccato et al., 2020). We suggest that the lack of clear differences between the central and satellite galaxies in this work may be due to the fact that the E-MOSAICS simulations do not include the highest density environments of clusters, but they are limited to the field and group environments (i.e. Fornax cluster-like), as mentioned in Sec. 2.
The comparison with Schulze et al. (2020) simulations suggests that low-mass S0 galaxies (Fig. 6, left-hand side) can form through a range of different merger and accretion histories. Specifically, galaxies with peaked profiles are expected to have typically formed through late (i.e. ) mini mergers that mainly influence the kinematic properties of the outer regions of the galaxies without destroying their central disk-like kinematics. On the other hand, galaxies with flat profiles are more likely to have experienced a late major merger that destroyed the central disk-like kinematics of the galaxies. This major merger may have also occurred in the form of multiple minor mergers, as a single major merger event is typically expected to spin up the rotation of the GCs at large radii (Bekki et al., 2005). Finally, galaxies with increasing profiles are suspected to have likely formed through a late gas-rich major merger that may have re-formed the central kinematically cold disk component of the galaxies, thus enhancing the rotation of the GCs out large radii (Bekki et al., 2005). Using the E-MOSAICS simulations, Trujillo-Gomez et al. (2021) also found that a late major merger is likely to produce more eccentric spatial distributions of the metal-rich GCs compared to those of the metal-poor GCs (i.e. increasing profiles). On the other hand, galaxies characterized by a larger spread in GC eccentricities (low profiles) are likely to have assembled of their mass at earlier times (Trujillo-Gomez et al., 2021), consistent with the assembly history predicted for the peaked galaxies (i.e. two-phase formation scenario)
On the other hand, the high-mass S0 galaxies (Fig. 6, right-hand side) seem to be mostly dominated by a formation history from late mini mergers, as shown by the larger number of the peaked galaxies than the flat and increasing galaxies in the high stellar mass bin.
In Dolfi et al. (2021), we have studied the kinematic profiles of an observed sample of selected S0 galaxies from the SLUGGS survey extending out to by combining the kinematic of the stars, GCs and planetary nebulae (PNe). As mentioned above, the out of the S0s from the SLUGGS survey cover similar stellar masses to the high-mass S0s from the simulations, i.e. . From the observations, we find that out of S0 galaxies () have GCs and PNe with consistent kinematics with respect to the underlying stars that rotate along the of the galaxies (and, thus, are referred to as aligned galaxies)
Overall, the kinematic results of the GCs of these aligned galaxies from the SLUGGS survey seem to be consistent with those of the simulated S0 galaxy sample from E-MOSAICS. Specifically, in the range of stellar masses in common between the observations and simulations (i.e. ), we find that galaxies with peaked profiles dominate with a fraction in the simulations and fraction in the observations. These are followed by the galaxies with flat profiles that occur with a fraction in the simulations and fraction in the observations. We do not find evidence of any increasing profile shapes in the observations, but this could simply be a result of sample selection effects or low number statistics. However, according to the simulations, galaxies with increasing profile shapes should occur with similar frequencies as the galaxies with flat profile shapes, i.e. .
Peaked galaxies
Increasing galaxies
Flat galaxies
Misaligned galaxies
Finally, across the entire stellar mass range covered by the simulated S0 galaxies (i.e. ), we find that the peaked profile shape is still the dominant one among the aligned galaxies with fraction as compared to the flat and increasing galaxies that are found to occur with a and fraction, respectively.
4.1.2 Misaligned galaxies
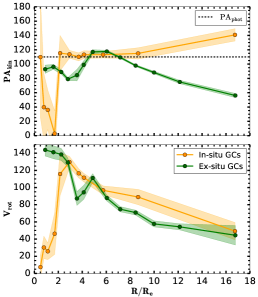
Fig. 6 (bottom) shows the 1D kinematic profiles of the GCs of the misaligned galaxies split into the low (; left column) and high (; right column) stellar mass bins, as for the aligned galaxies. Each sub-figure of Fig. 6 (bottom) also shows the 1D , and profiles of GC systems as for the aligned galaxies, but this time we are also plotting the absolute difference between the of the GCs and the of the S0 galaxy to show the degree of misalignment of the GCs from the of the galaxy.
As we see in Fig. 6 (bottom), the GC systems of the misaligned galaxies are rotating along an axis different from the of the galaxy. Additionally, the profile also show variations as a function of the galactocentric radius, with several galaxies being characterized by a second peak at large radii. This suggests that the misaligned galaxies are characterized by a more complex assembly history that could likely be the result of multiple merger events occurring up to the most recent times in the formation history of the galaxies. Such an assembly history may have contributed to a significant fraction of the ex-situ GCs that have still not acquired the overall underlying rotation of the galaxy.
In Dolfi et al. (2021), we found that out of the S0 galaxies () from the SLUGGS survey showed kinematic misalignment and twists in the rotation of the GCs and PNe with respect to the underlying stars as a function of radius. Specifically, we found that one galaxy (i.e. NGC 4649) was characterized by a similar "double-peaked" profile as we see for most of the misaligned simulated S0s. Therefore, these "double-peaked" galaxies may be the results of a late major merger event, that spun up the rotation of the GCs at large radii (Bekki et al., 2005). On the other hand, the remaining two misaligned galaxies from the SLUGGS survey could be the result of multiple, late minor and mini mergers that decreased the rotation of the GCs out to large radii.
In Sec. 6, we aim at investigating the presence of differences between the past merger histories of the aligned and misaligned galaxies to understand what physical processes are driving the GC misalignment in our S0 galaxies.
4.2 Kinematics of the metal-rich and metal-poor GC sub-populations
The colour-magnitude diagrams of the GC systems of our simulated S0 galaxies do not show evidence of any clear colour bimodality. For this reason, in Sec. 4.1, we did not adopt any colour cut to separate between the red and blue GC sub-populations. However, it is not clear whether this may be an issue of the simulations that are unable to reproduce the commonly observed colour-bimodality of the GC systems of observed galaxies.
In this section, we investigate whether the metal-rich and metal-poor GC sub-populations show any differences in their kinematic behaviours by adopting a fixed metallicity split at , which is the same for all the GC systems of our simulated S0 galaxies. This metallicity value is consistent with that adopted for the ETGs from the SLUGGS survey to separate between the two GC sub-populations (e.g. Usher et al. 2019). We note here that the issue of the overproduction of the metal-rich GCs with in the simulations could influence the comparison with the observations, specifically for the low-mass galaxies with , which are found to be the most affected (see Sec. 3.2.4).
In order to ensure that each simulated S0 galaxy has a large enough sample of metal-rich and metal-poor GCs for reliably deriving the corresponding 1D kinematic profiles, we only consider here the galaxies with a total number of metal-rich and metal-poor GCs greater than . This threshold is selected based on the comparison with the GC systems of the observed S0 galaxies from the SLUGGS survey, whose GC sub-populations contain more than objects (see table 1 in Dolfi et al. 2021).
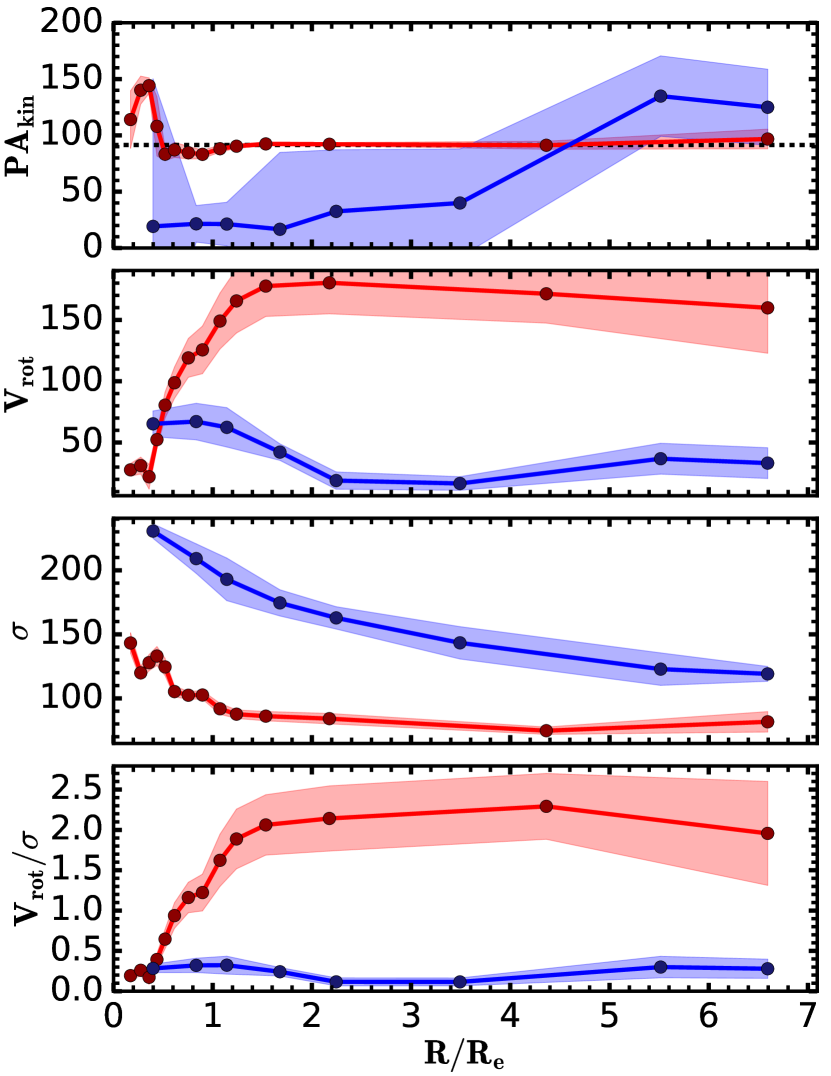
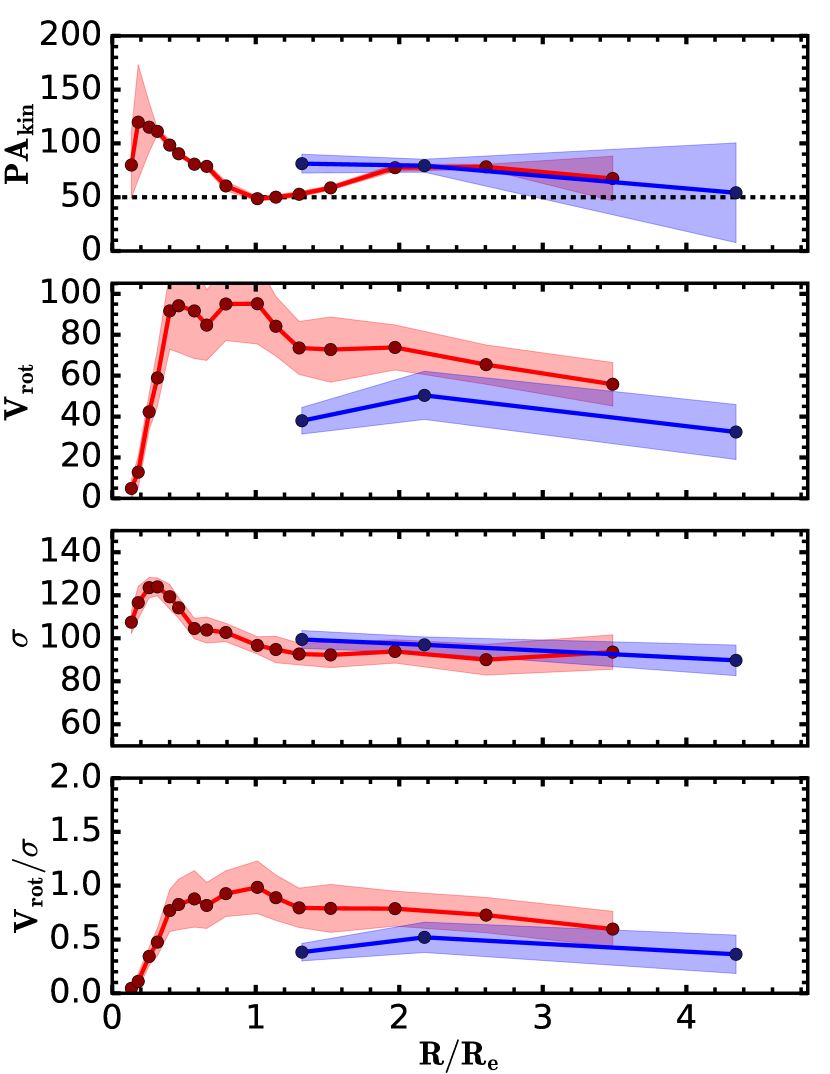
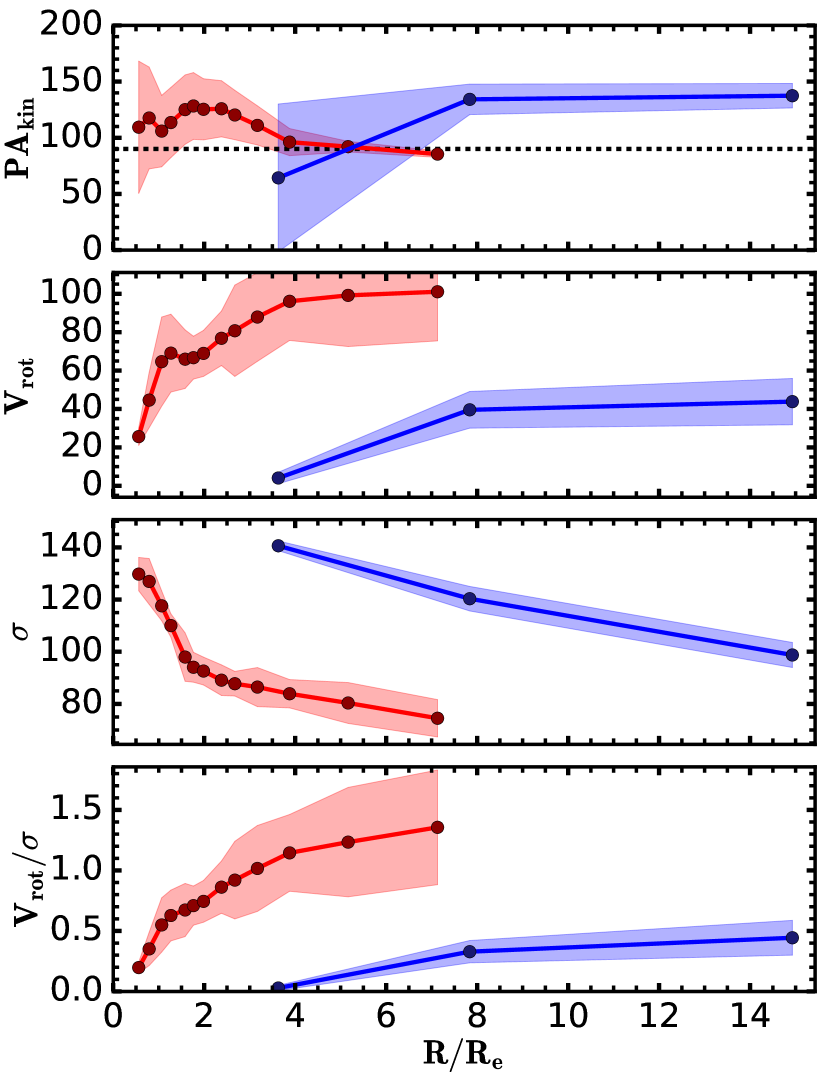
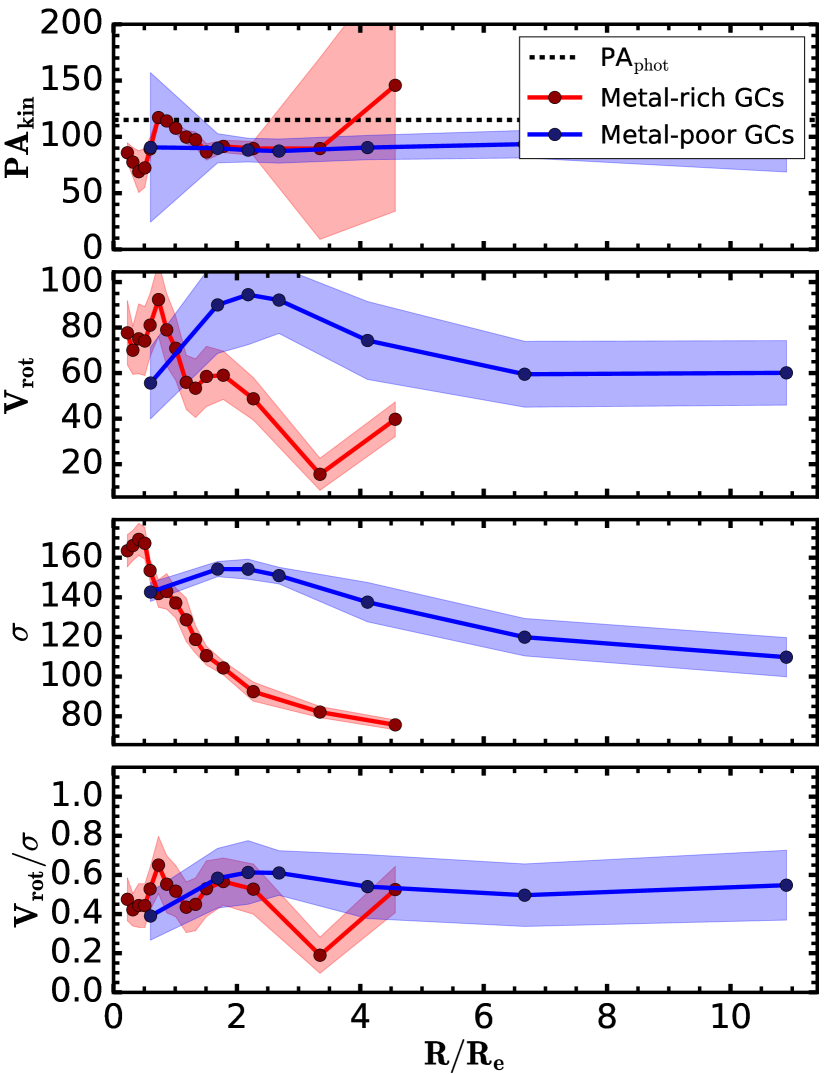
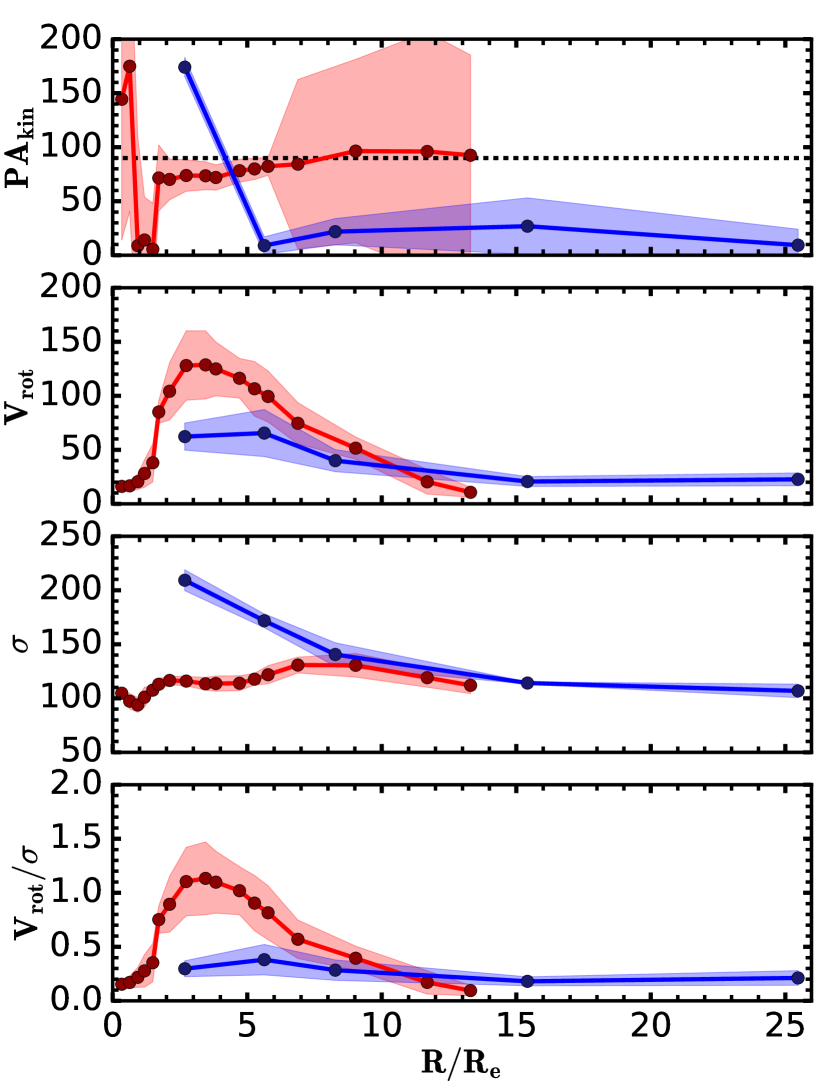
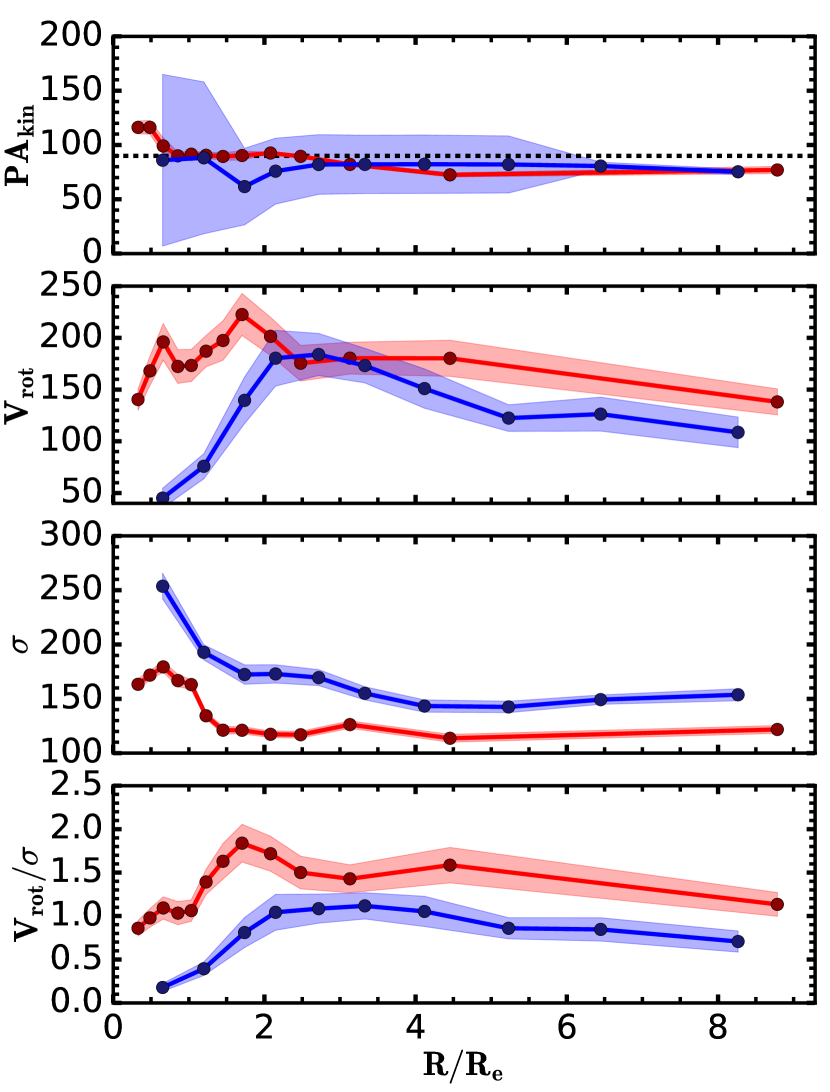
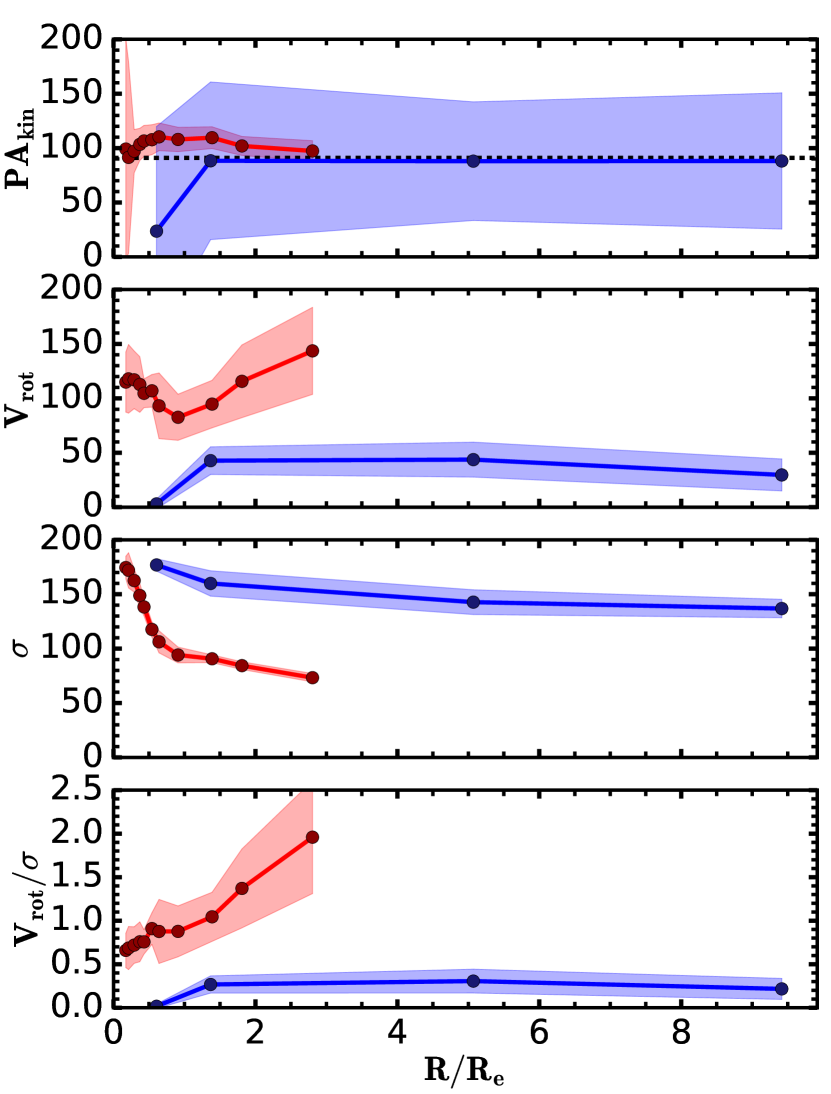
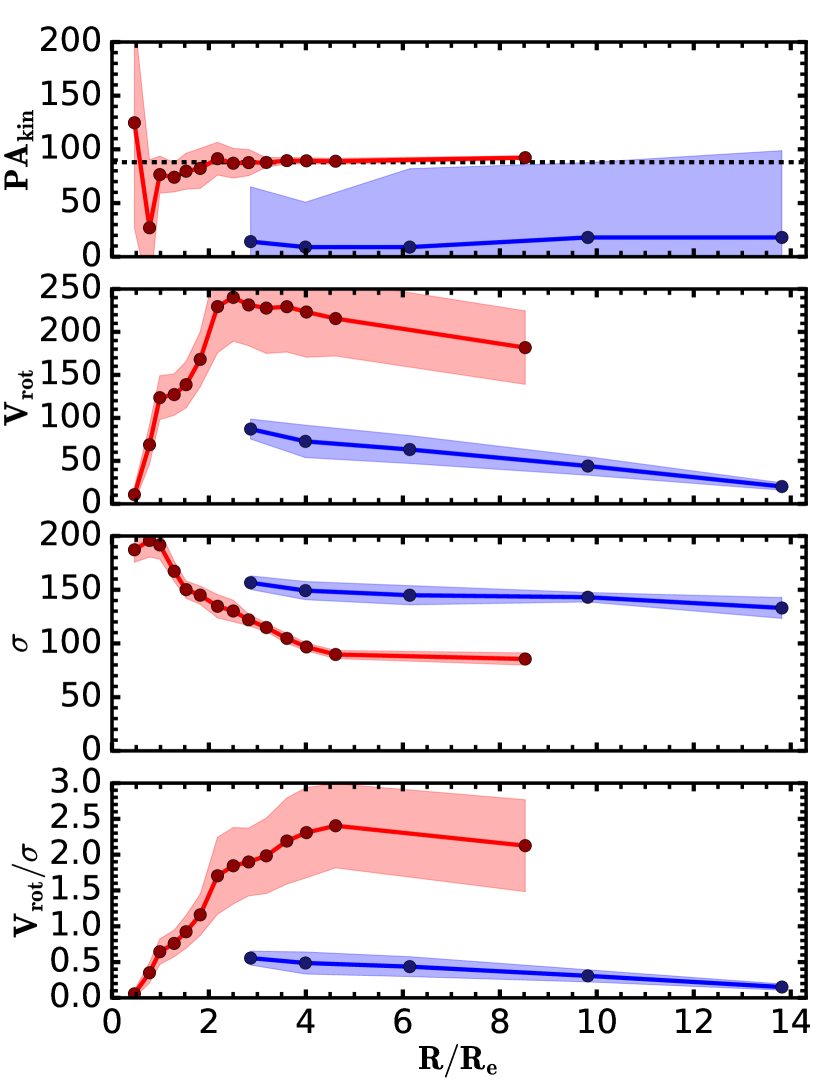
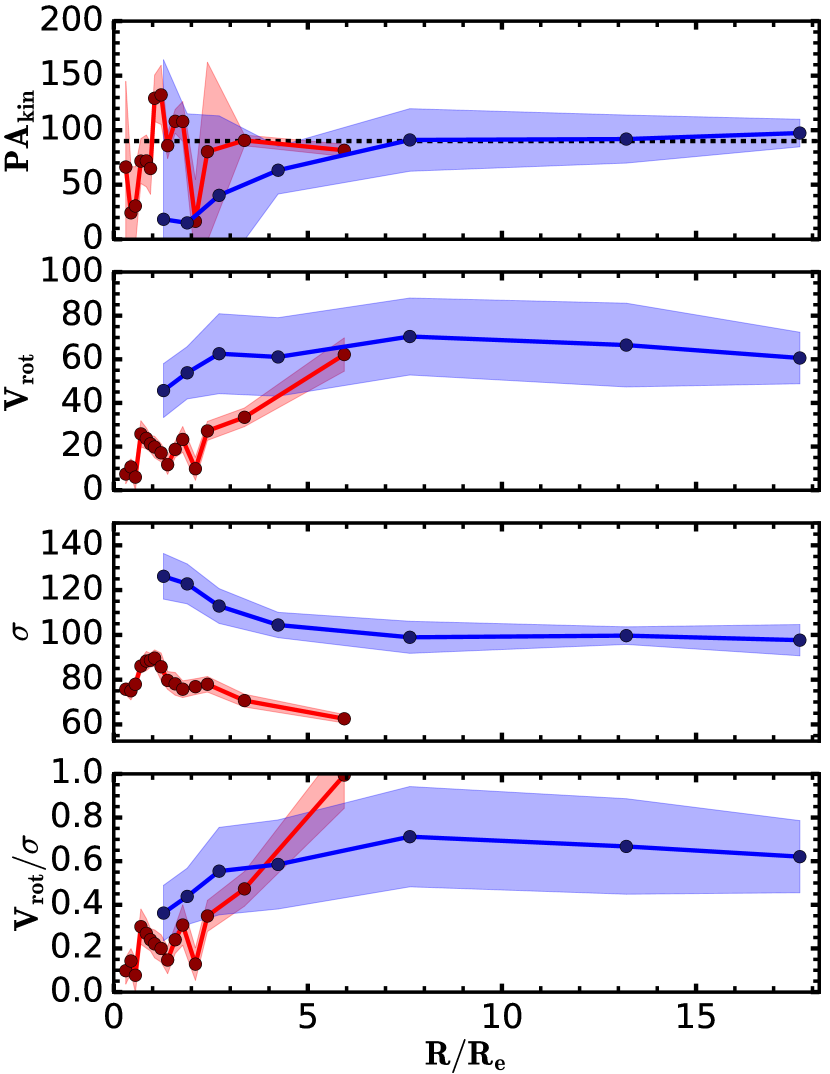
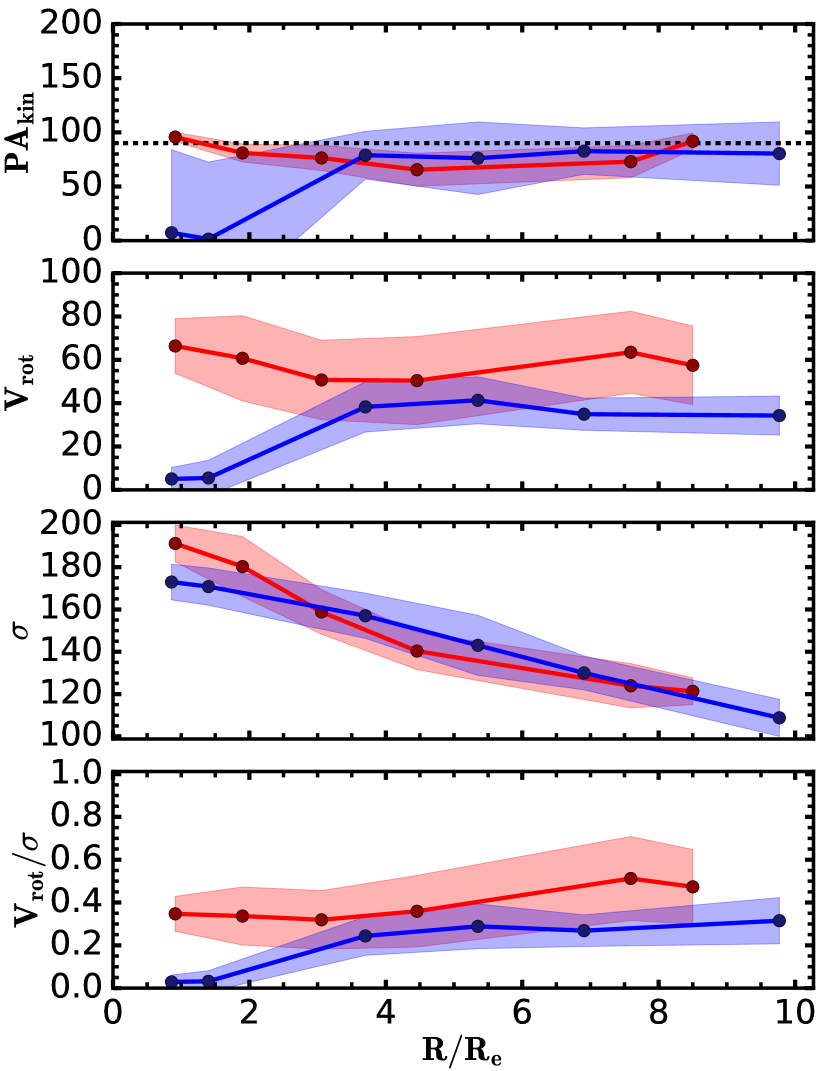
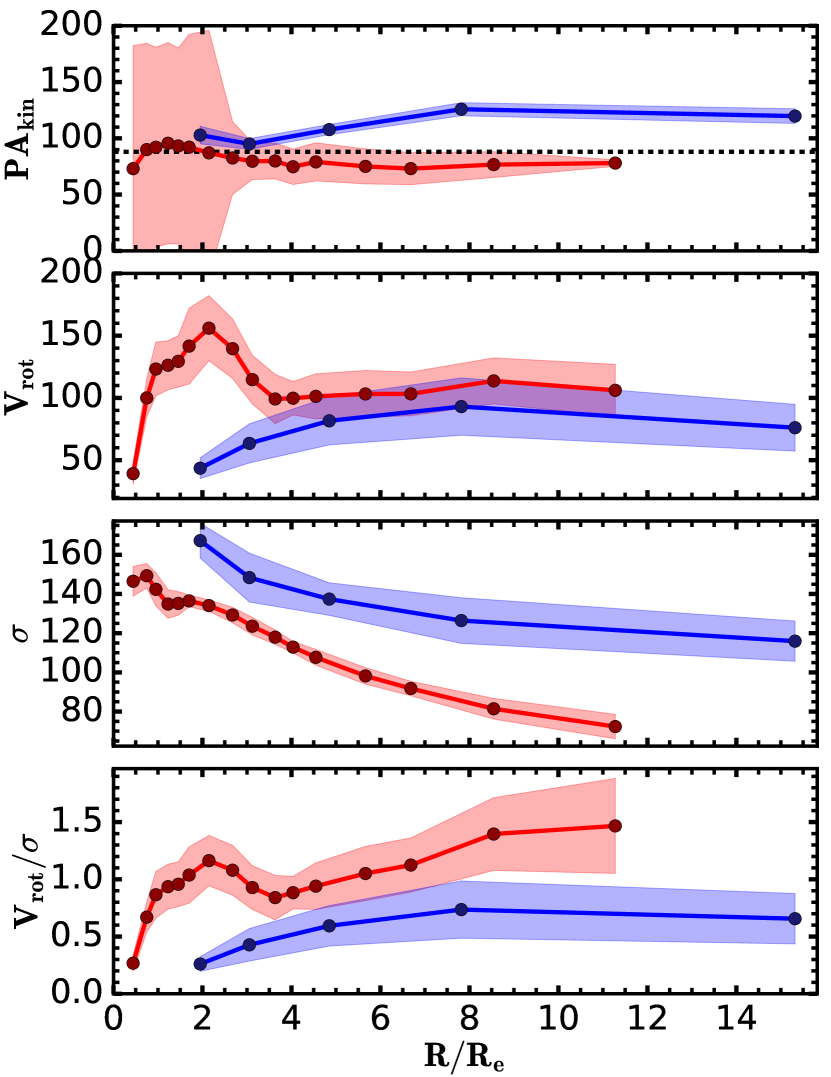
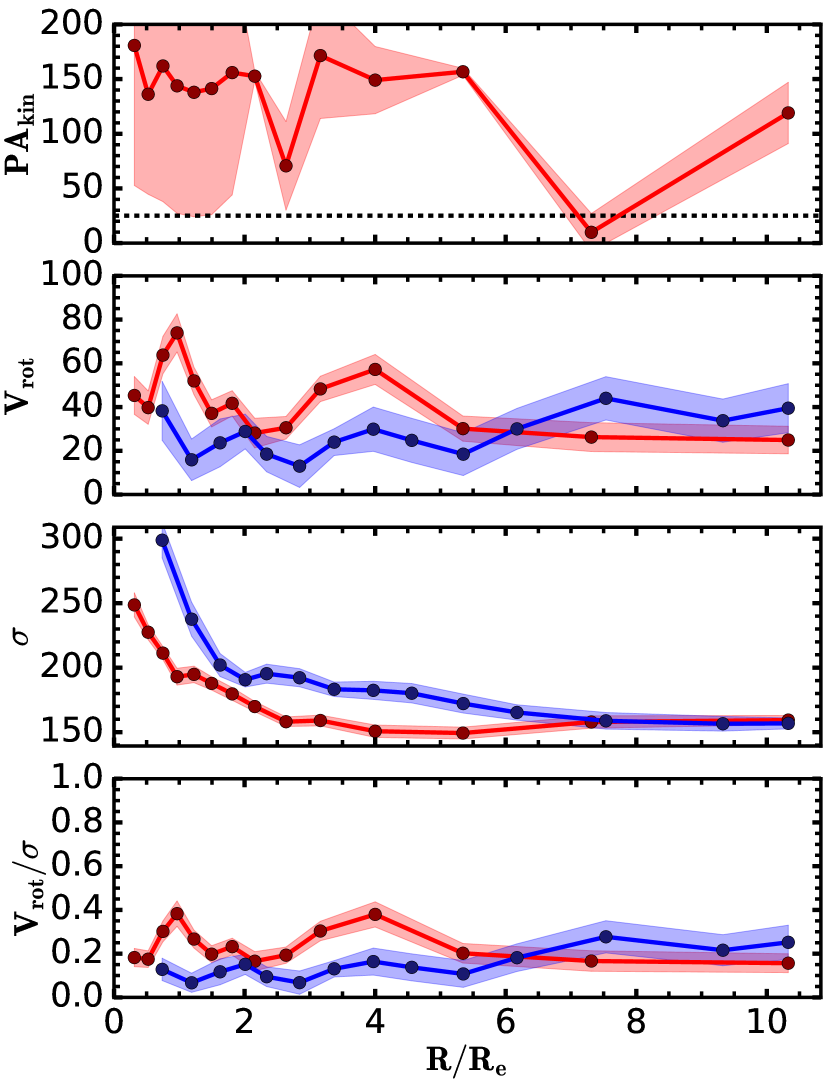
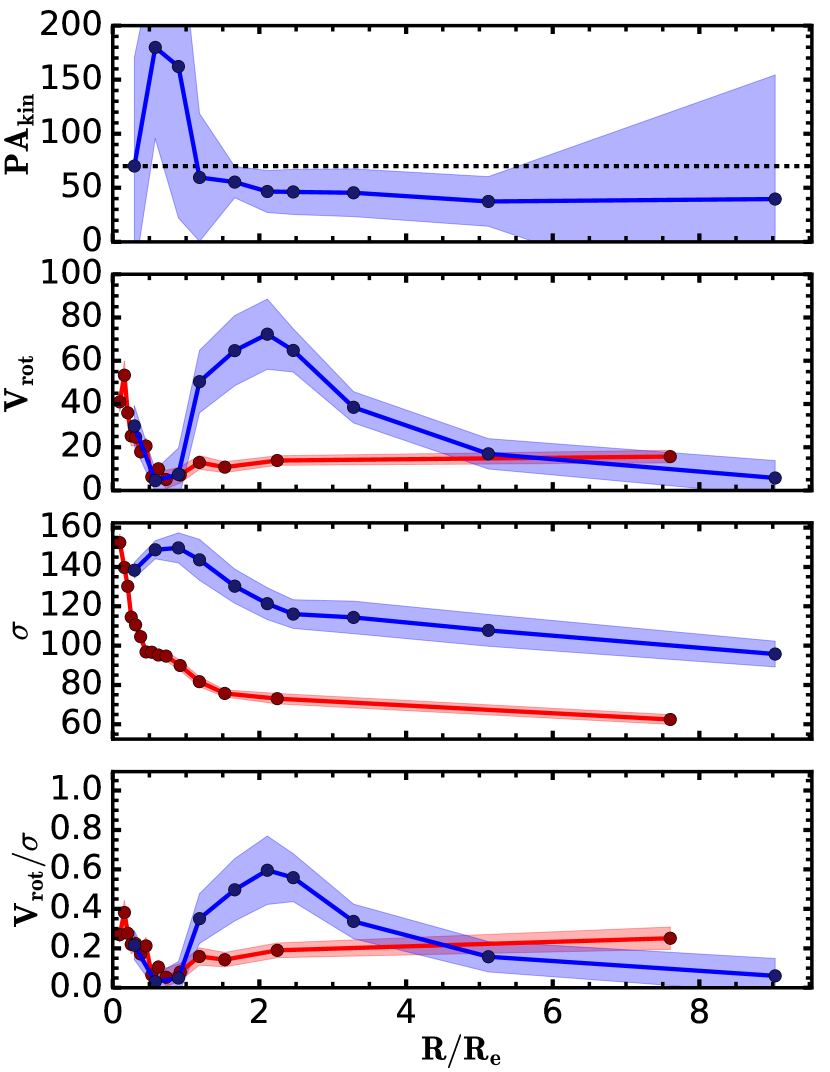
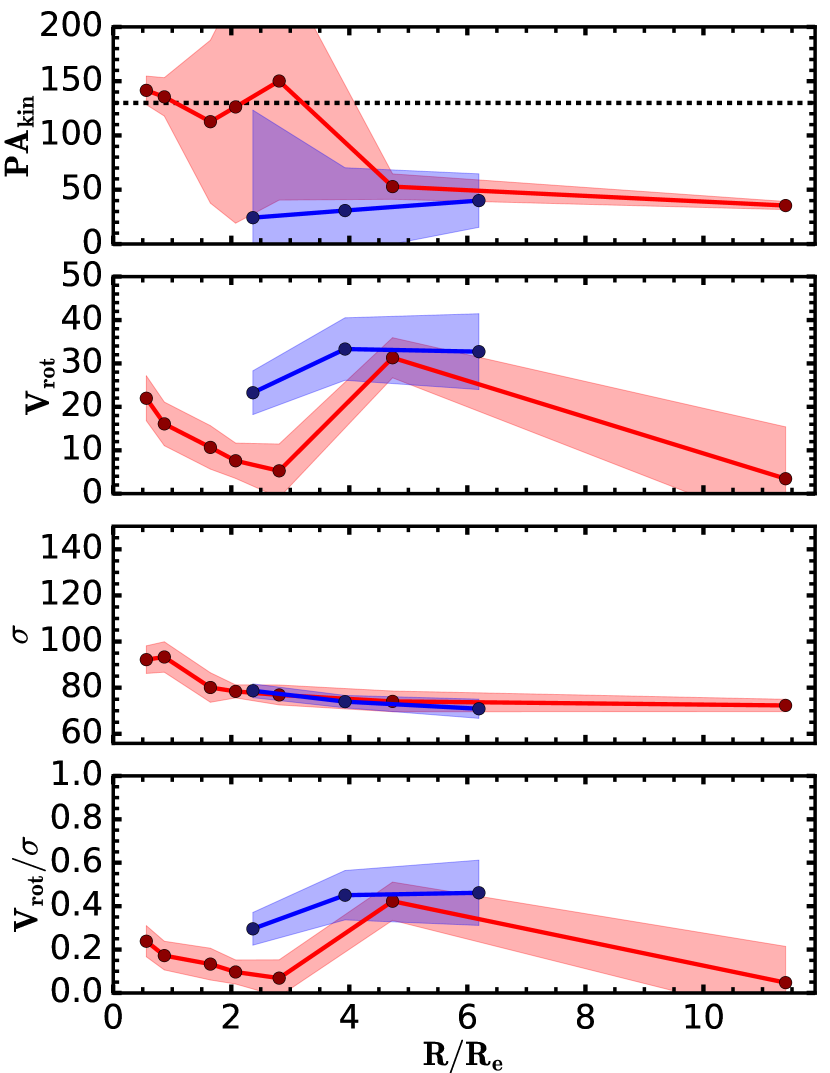
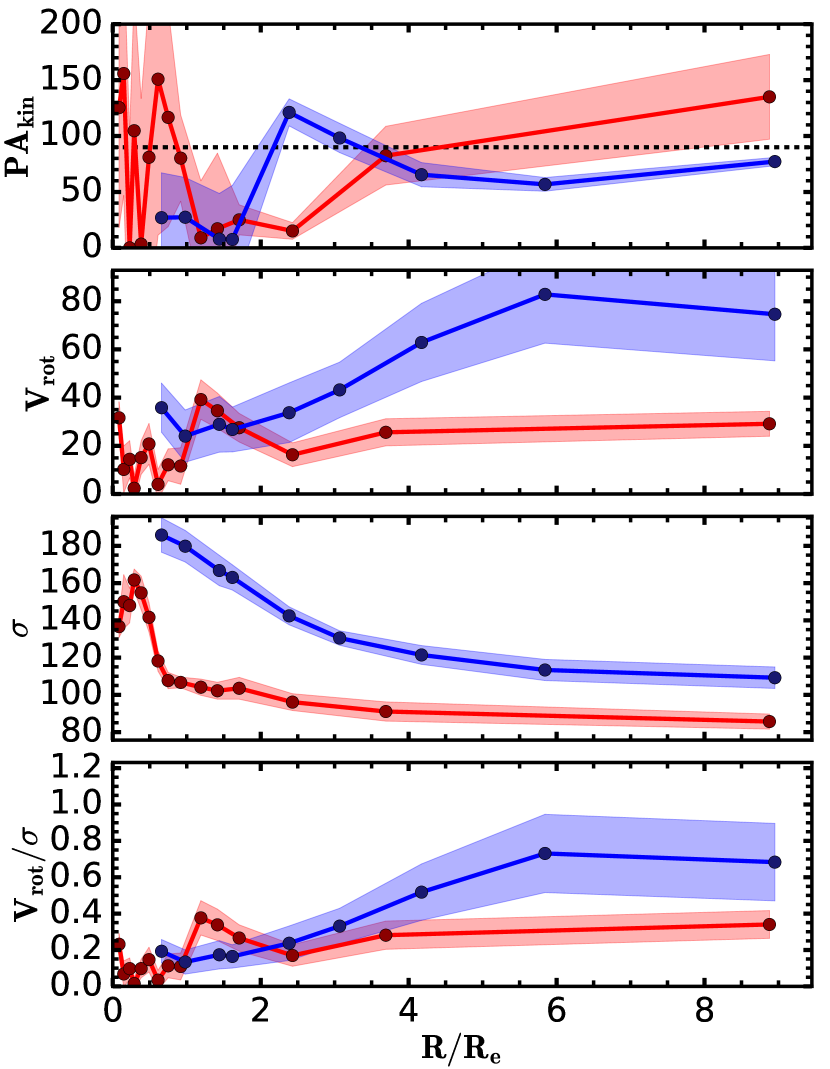
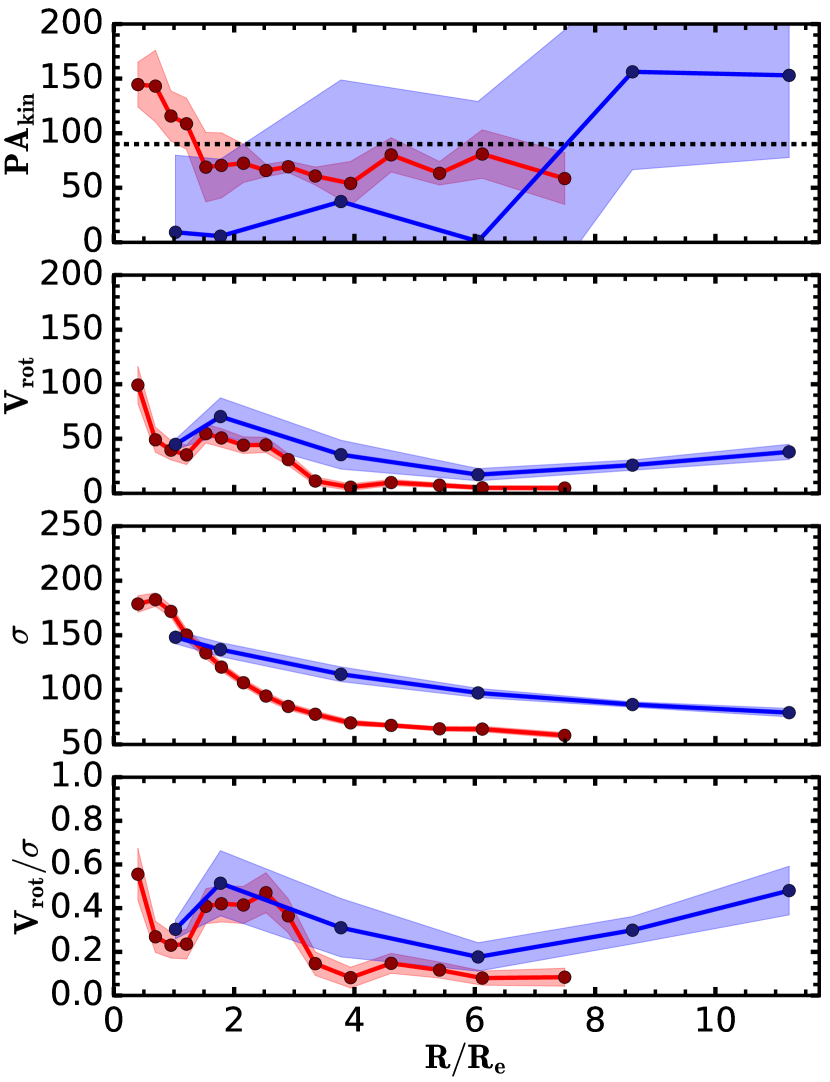
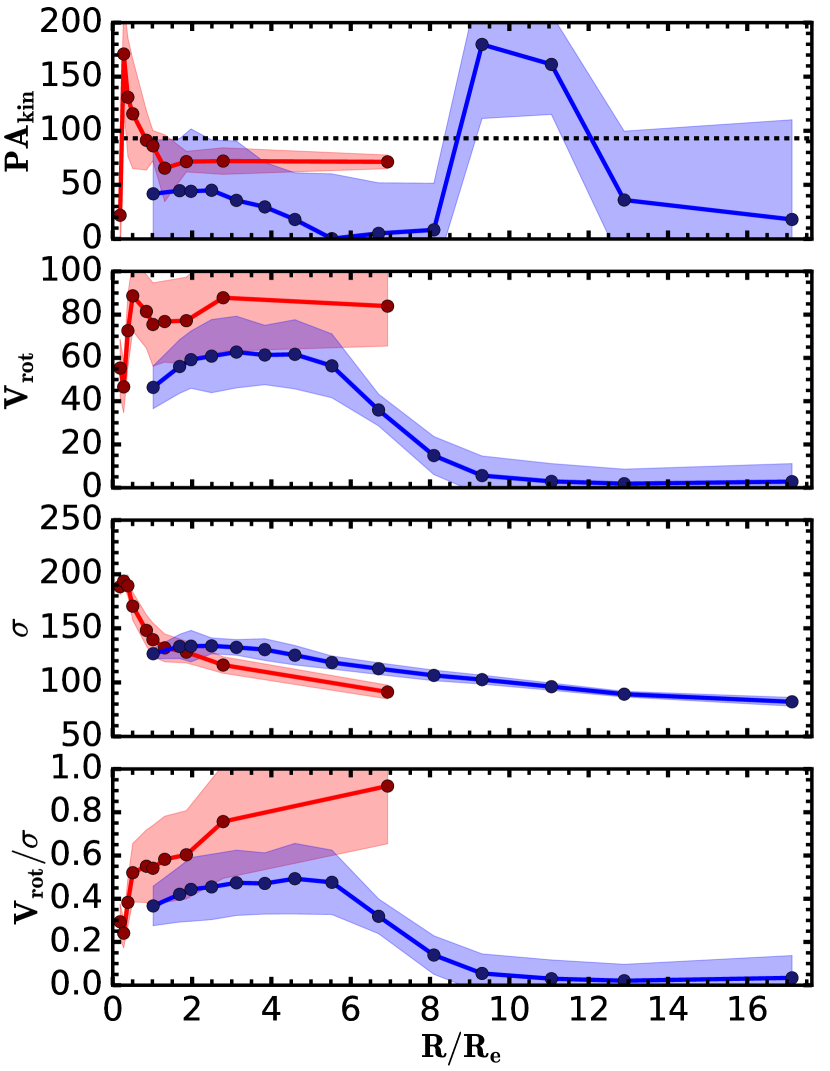
Following the classification in Sec. 4.1, we differentiate between aligned and misaligned galaxies. For the aligned galaxies, we show the kinematics of the metal-rich and metal-poor GCs by separating between the galaxies previously classified as peaked, flat or increasing. Fig. 7-10 show the 1D kinematic profiles of the metal-rich and metal-poor GCs for the S0 galaxies, as selected above. Each sub-figure shows the (where fitted), , and profiles from the top to the bottom panel for the metal-rich (red line) and metal-poor (blue line) GCs of each galaxy.
From the 1D kinematic profiles, we see that the metal-rich GCs are rotating along the of the galaxy within the errors in out of the peaked galaxies (see Fig. 7) as well as in all of the increasing galaxies (see Fig. 8). Additionally, in the increasing galaxies, the rotation of the metal-poor GCs is, overall, consistent with the metal-rich GCs along the of the galaxy. On the other hand, the metal-poor GCs show little rotation compared to the metal-rich GCs in of the peaked galaxies (see Fig. 7(a), 7(c), 7(e), 7(g), 7(h), 7(i), 7(k)) and, in two of these galaxies, their rotation is not consistent with the of the galaxy (see Fig. 7(e), 7(h)). In one of the peaked galaxies, for which the is not well constrained, the 2D kinematic maps do not show evidence of clear rotation for either the metal-rich and metal-poor GCs (see Fig. 7(j)).
These results may suggest different origins for the metal-rich and metal-poor GCs. In fact, the peaked galaxies with metal-poor GCs characterized by low rotation suggest that this may be the result of an accretion history involving multiple low-mass (i.e. minor and mini) mergers from random directions, which would be consistent with the expected formation scenario of the peaked galaxies proposed by Schulze et al. (2020). On the other hand, the peaked (see Fig. 7(b), 7(d), 7(f)) and increasing galaxies, with metal-rich and metal-poor GCs showing consistent rotation may have experienced fewer accretion events that preserved the overall rotation of the galaxy and of its GC sub-populations.
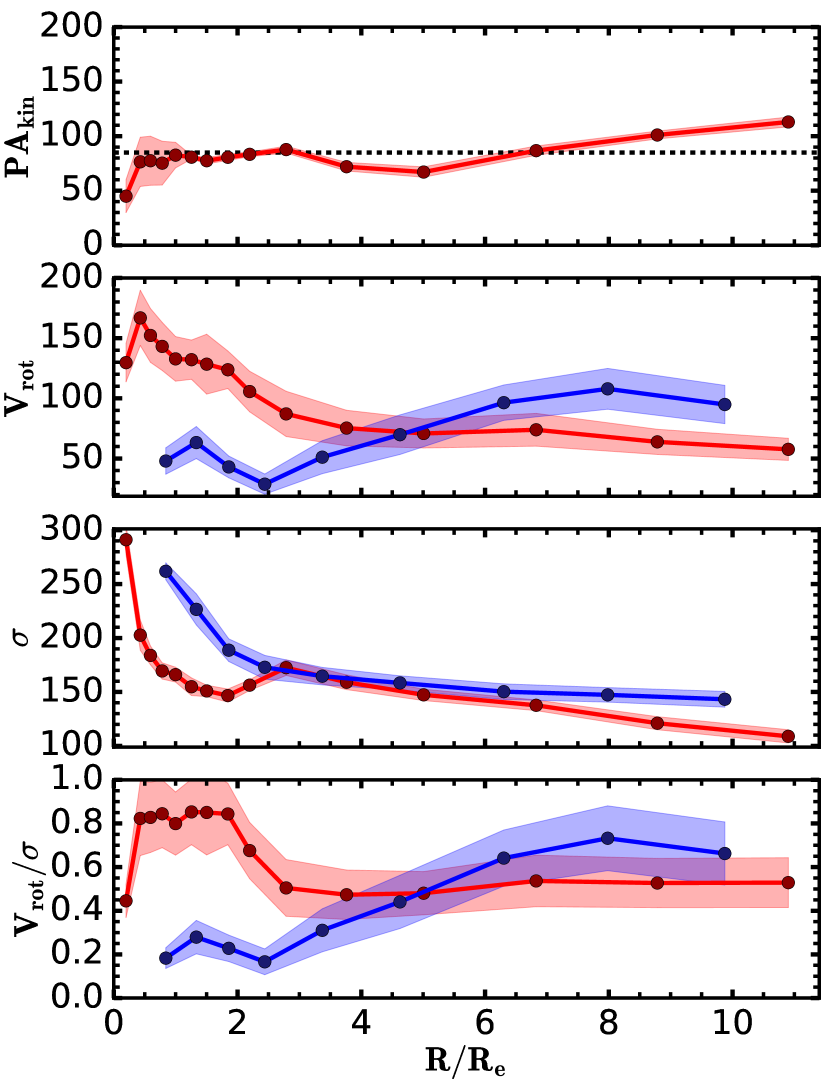
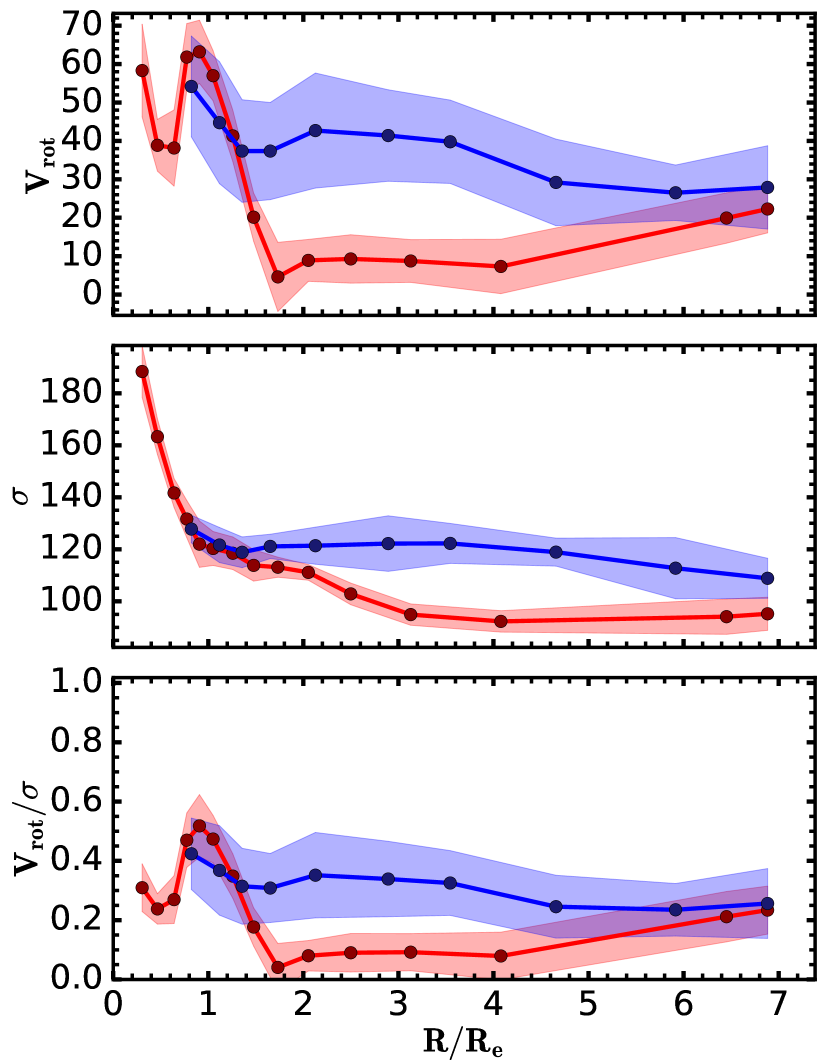
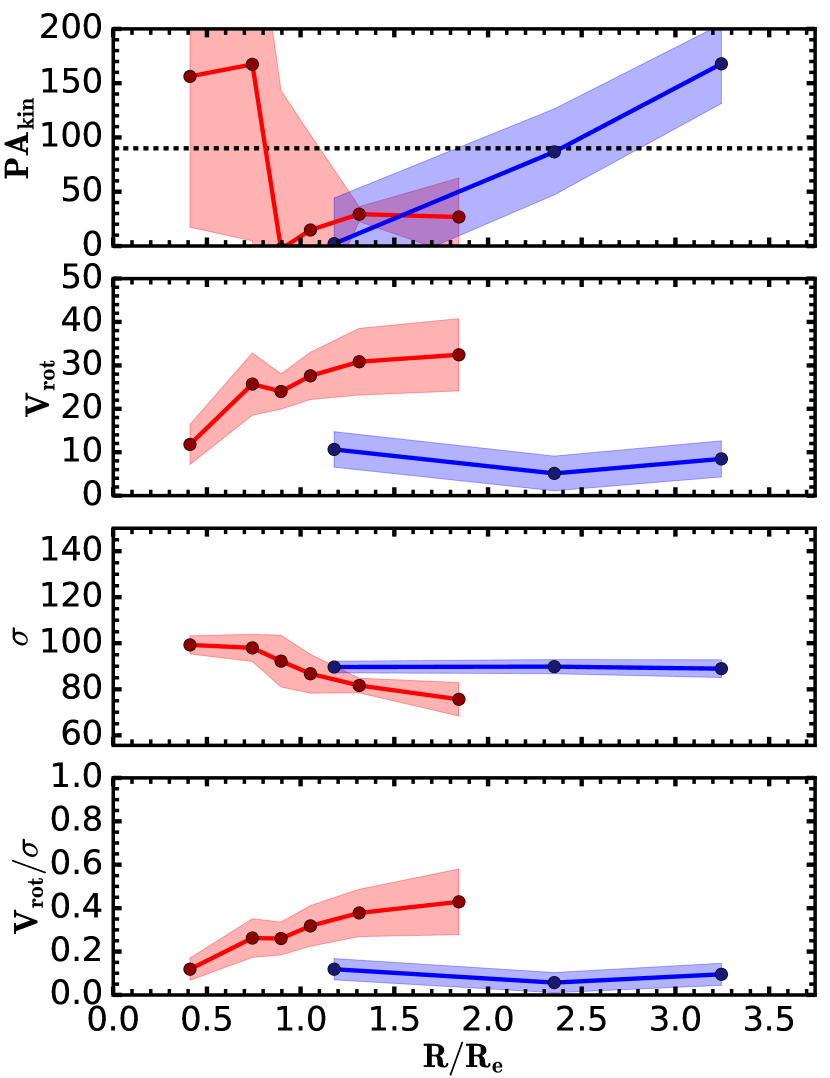
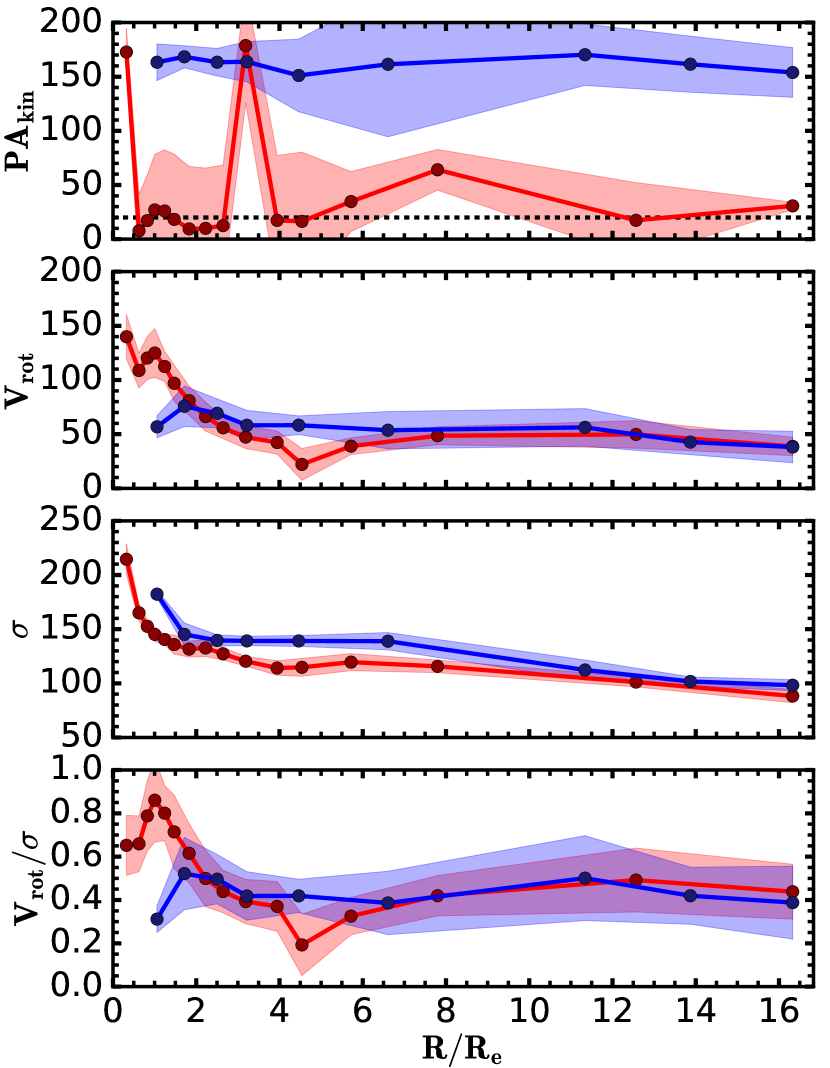
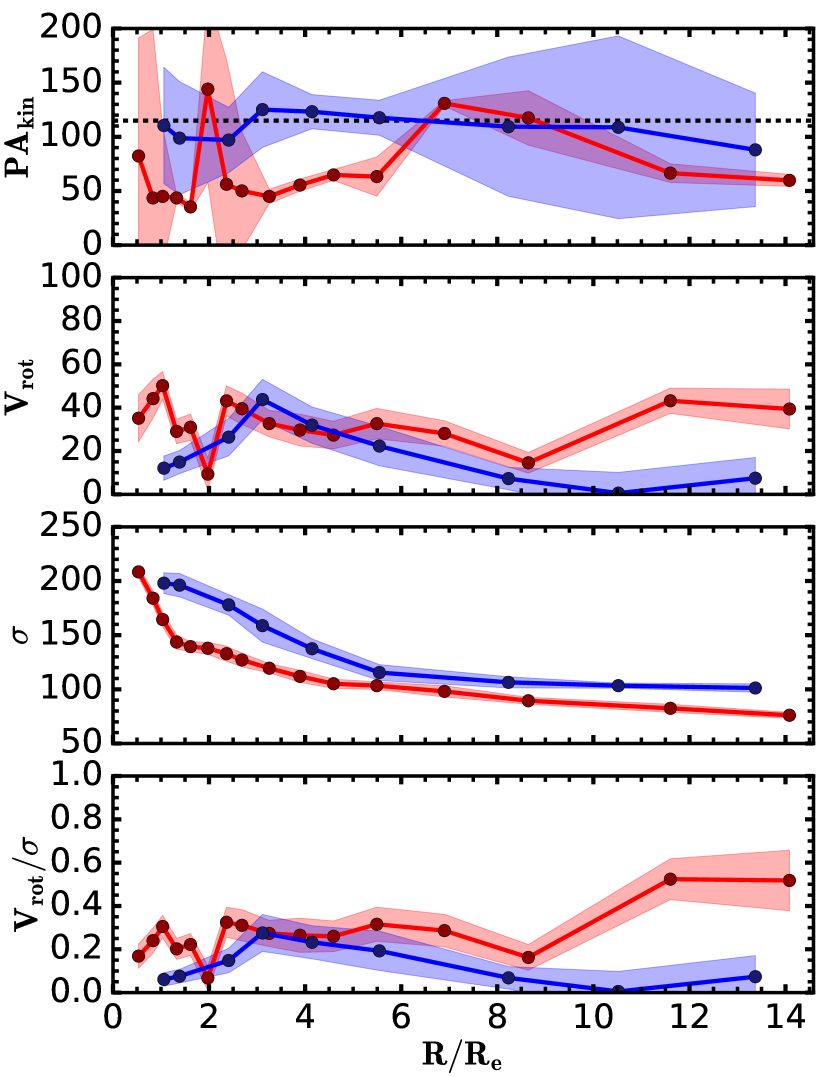
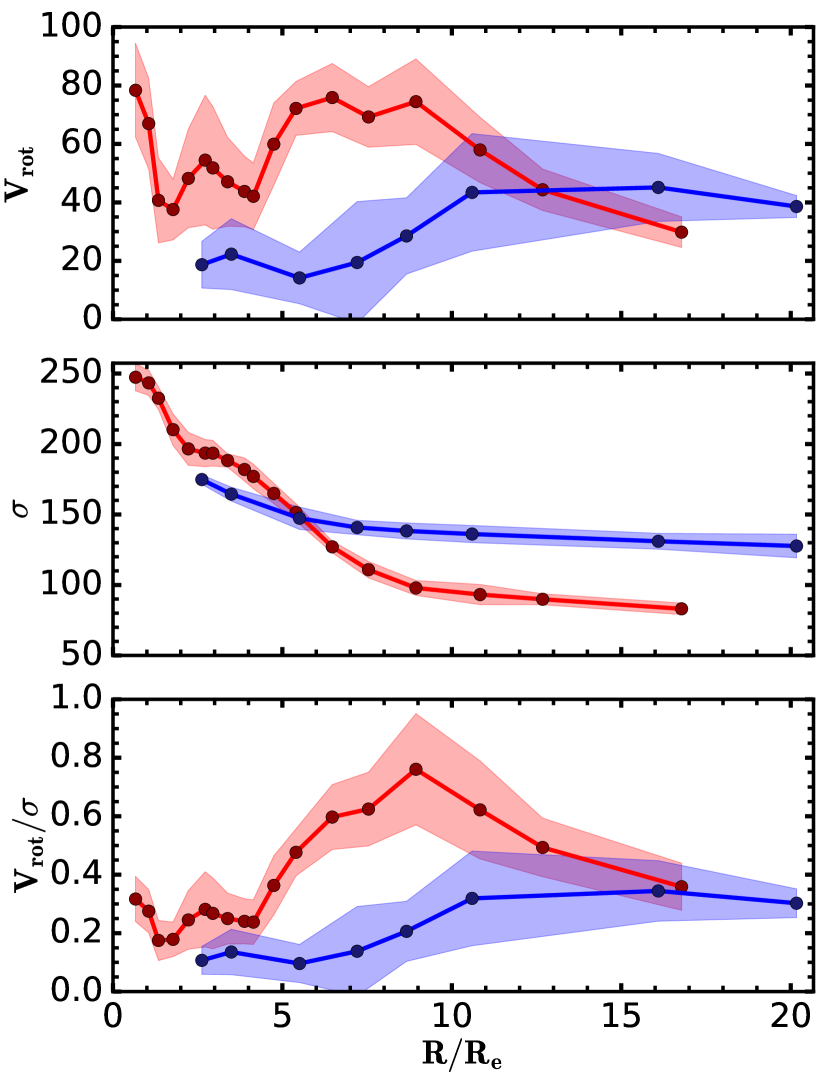
In Fig. 9, the flat galaxies have metal-rich and metal-poor GCs showing typically low rotation at all radii, i.e. , as compared to the peaked galaxies. One galaxy (see Fig. 9(c)) also shows misaligned metal-rich GC kinematics with respect to the of the galaxy. Overall, this would seem to suggest a more violent and complex accretion history, possibly from a late major merger, for these galaxies that enhanced the random motion of the GC sub-populations out to large radii.
Finally, in Fig. 10, the misaligned galaxies show mixed behaviours in the kinematics of their metal-rich and metal-poor GCs. In fact, in of the misaligned galaxies, the rotation of the metal-rich GCs is, overall, aligned with the of the galaxy, while the metal-poor GCs are not (see Fig. 10(a), 10(d), 10(e), 10(f)), similar to the peaked galaxies described above. On the other hand, misaligned galaxies are more similar to the flat galaxies, as they show misaligned kinematics in both the metal-rich and metal-poor GC sub-populations that are characterized by less well behaved kinematic profiles with several transitions as a function of radius (see Fig. 10(b), 10(g)). Of the remaining misaligned galaxies, one (see Fig. 10(h)) is characterized by low rotation in both the metal-rich and metal-poor GCs with unconstrained , while the other (see Fig. 10(c)) shows low rotation in the metal-poor GCs.
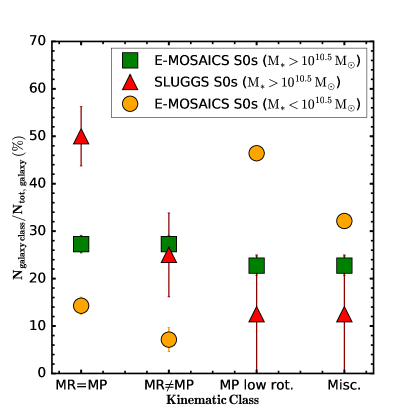
In Fig. 7-10, we have only selected those galaxies with a large enough sample of metal-rich and metal-poor GCs to calculate the 1D kinematic profiles. Here, we investigate the kinematics of the metal-rich and metal-poor GCs of all S0 galaxies based on the 2D line-of-sight velocity maps (edge-on projection) to include in the analysis also those galaxies with less than GCs in one or both of the GC sub-populations. In Fig. 11, we summarize the fraction of the galaxies showing the following four different kinematic behaviours in their GC sub-populations as follows:
MR=MP: the metal-rich (MR) and metal-poor (MP) GCs are rotating along a similar axis (), which is consistent with the photometric major axis of the galaxy ();
MRMP: the metal-rich GCs are rotating along an axis consistent with the photometric major axis of the galaxy (), while the metal poor GCs are misaligned;
MP low rotation: the metal-rich GCs are rotating along an axis consistent with the photometric major axis of the galaxy (), while the metal-poor GCs have little or no rotation;
Miscellaneous: the metal-rich and metal-poor GCs are both misaligned from the photometric major axis of the galaxy () or have little rotation.
For the comparison between the simulations and observations, in Fig. 11, we also show the distribution of the out of the S0 galaxies from the SLUGGS survey characterized by high-mass (i.e. ), which we studied in Dolfi et al. (2021).
We find that the high-mass () simulated S0 galaxies are distributed with similar fractions in each of the four kinematic classes. On the other hand, the low-mass () simulated S0 galaxies are more frequently characterized by metal-poor GCs with low rotation velocity (MP low rotation ), suggesting that these galaxies have mainly experienced isotropic accretion events from low-mass dwarf galaxies that mostly contributed to few metal-poor GCs with low rotation.
For the high-mass S0 galaxies, we find that the simulations predict a fraction of galaxies with misaligned metal-poor and metal-rich GC kinematics (MRMP ) that is consistent with the observations. On the other hand, the simulations underestimate the fraction of galaxies with aligned metal-rich and metal-poor GC kinematics (MR=MP ) with respect to the observations (MR=MP ). This discrepancy may be a result of sample selection effects as some of our simulated galaxies show signs of interaction from the Mpc-scale FoV images, while the observed galaxies from the SLUGGS survey are mainly undisturbed. Alternatively, it could be a result of viewing angle effects, as we are studying the edge-on view of the galaxies (see Sec. 6). Finally, we find an overall good agreement between the fraction of the simulated and observed S0 galaxies in the remaining two kinematic classes (MP low rotation and Miscellaneous) within the errors. Here, the discrepancy could also be the result of sample selection and viewing angle effects, as previously mentioned. Alternatively, it could also be due to differences in the splitting between the GC sub-populations that is colour-based in the observations and metallicity-based in the simulations.
5 Phase-space diagrams of the GC systems
The aim of this section is to understand whether the location of the GC systems of the individual galaxies on the 3D phase-space diagrams correlates with their accretion times onto the galaxies. The results could subsequently be applied to the GC systems of observed galaxies for which we do not have explicit information about their in-situ or ex-situ origins as in the simulations.
In their study of simulated clusters, Rhee et al. (2017) separated the galaxies into three different accretion classes based on their accretion time onto the cluster: ancient infallers with , intermediate infallers with , recent infallers with and first infallers that have just fallen onto the cluster. They found that the ancient and recent infallers were mainly located within one virial radius from the centre of the cluster (i.e. ) and that the recent infallers had higher orbital velocities than the ancient infallers. On the other hand, the intermediate and first infallers were mainly located between -, with the intermediate infallers being characterized by lower orbital velocities than the first infallers.
Focusing on only the ex-situ GC population of the sample of S0 galaxies, which are defined by the E-MOSAICS simulations, we do not apply any surface density cut here, unlike in Sec. 3.2.5. Therefore, the spatial distributions of the GC systems will be more extended. Following Rhee et al. (2017), we separate the ex-situ GCs based on the time they were accreted onto the host galaxy as defined by the simulations: ancient infallers (), intermediate infallers () and recent infallers (), and we produce the 3D phase-space diagrams of each one of these accreted GC classes. The 3D phase-space diagrams are produced by plotting the 3D velocity () as a function of the 3D galactocentric radius () of each GC. We normalize the and of each GC by the velocity dispersion of the GC system, , and virial radius of the galaxy, , respectively, to which the GC belongs. For the central galaxies, is measured at . However, for the satellite galaxies, is not defined and can only be measured for the group as a whole. For this reason, for the satellite galaxies, we use the measured when the galaxy was last a central of its own group prior to becoming a satellite. The velocity dispersion, , is calculated from the line-of-sight velocity dispersion along the -, - and -axes estimated as the standard deviation of the corresponding GC line-of-sight velocities.
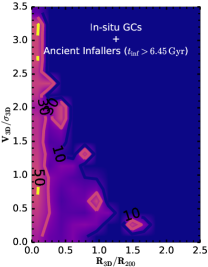
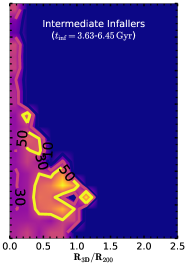
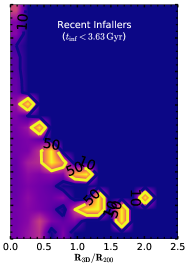
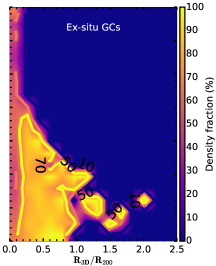
Fig. 12 shows the 3D phase-space diagrams of the in-situ GCs and ex-situ GCs, split into the ancient, intermediate and recent infaller GCs, of all our S0 galaxies from the left to the right panel, respectively. In the leftmost panel, we show together the in-situ GCs and the ancient infaller GCs normalized by the total number of GCs and the total number of ex-situ GCs of all our S0 galaxies, respectively. The rightmost panel shows together the ex-situ GCs normalized by the total number of GCs of all our S0 galaxies. The intermediate and recent infaller GCs are normalized the total number of ex-situ GCs of all our S0 galaxies, as for the ancient infaller GCs.
First of all, we see that the in-situ and ex-situ GCs, which are split into ancient, intermediate and recent infallers GCs, show similar spatial distributions extending out to -. However, the majority of the in-situ and ex-situ GCs are contained within , with only a total of GC systems among all our S0 galaxies extending beyond .
Secondly, we see a trend that the GCs that were accreted more recently () are more likely found at larger radii (see also Kruijssen et al. 2020; Pfeffer et al. 2020). In fact, of the ex-situ GCs located within are ancient infallers (). The in-situ GCs are also concentrated within , where they overlap with the ancient infaller GCs. On the other hand, only of the ex-situ GCs within are intermediate infallers () and are recent infallers (). The intermediate infallers are more numerous between - for with fraction, while of the recent infallers are found beyond for or within for .
Overall, we see that the fraction of the in-situ and ancient infaller GCs sharply drops beyond as opposed to the ex-situ GCs, whose fraction increases to out to . Additionally, we note that the in-situ GCs are also characterized by larger velocities on average than the ex-situ GCs within . This may be due to the nature of the in-situ GCs, which are mainly metal-rich in a fast-rotating disk configuration.
The results from Fig. 12 are overall consistent with those of the galaxies in individual galaxy clusters found by Rhee et al. (2017), suggesting that similar physical processes do apply to both GCs and galaxies accreting onto an individual galaxy or cluster of galaxies, respectively. However, we note that the boundaries between the different accreted classes of the GCs in the galaxies are less sharp than those of the accreted galaxies in galaxy clusters. In fact, as we previously mentioned, the ancient, intermediate and recent GCs have overall similar distributions on the 3D phase-space diagrams. This may likely be a result of the degeneracy between the accretion redshift and the stellar mass of the accreted satellite galaxy. In fact, as shown in figure 2 of Pfeffer et al. (2020), the apocentres of the accreted GCs decrease for increasing satellite stellar masses at fixed redshifts.
In summary, our results suggest that there exists a correlation between the location of the GCs of the individual galaxies on the 3D phase-space diagrams and the time they were accreted onto the galaxy. We also looked at the projected (2D) phase-space diagrams along the three line-of-sights, i.e. , and . We find that, overall, the boundaries delimiting the areas where the different accretion GC classes are mainly located are similar in the 3D and 2D phase-space diagrams. Therefore, the phase-space diagrams could be applied to the GC systems of the observed galaxies and we should expect that the GCs found within ( for ) have likely an in-situ origin or they were accreted at early times (more than ago). On the other hand, the GCs found beyond have a higher probability of being ex-situ and accreted more recently (less than ago) onto the galaxy.
6 The assembly history of the simulated S0 galaxies
One of the advantages of the simulations is that they contain information about the detailed merger and accretion histories of the galaxies. For this reason, we now investigate the presence of correlations between the distinct kinematic profiles of the GCs, described in Sec. 4.1, and the corresponding assembly histories of the S0 galaxies. This adds to the previous work using E-MOSAICS, which has revealed correlations between the galaxy assembly history and GC age-metallicity distributions (Kruijssen et al., 2019a) and GC kinematics (Trujillo-Gomez et al., 2021).
Furthermore, in Sec. 4.2, we have seen that the metal-rich and metal-poor GC sub-populations can have misaligned kinematics. Therefore, we aim to understand whether the observed kinematic misalignment in the GC sub-populations of our simulated S0 galaxies is the result of specific merger events.
6.1 The relation between the profiles of the GCs and the accretion history of the S0 galaxies
From the E-MOSAICS simulations, we derive the merger trees of our simulated S0 galaxies. These merger trees include all the accretion events with different mass-ratio (i.e. , where is the satellite galaxy mass and the target galaxy stellar mass) experienced by our target S0 galaxy as a function of redshift.
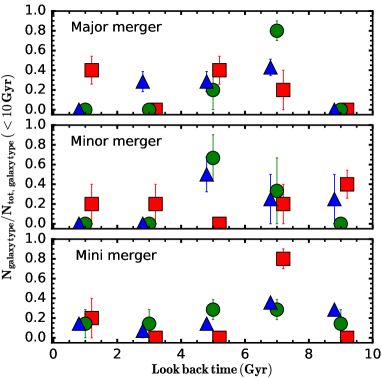
Following Schulze et al. (2020), we classify the merger events into four categories depending on the mass-ratio of the merger: major mergers (mass-ratio1:4), minor mergers (1:10mass-ratio1:4), mini mergers (1:100mass-ratio1:10) and smooth accretion (mass-ratio1:100). We focus here on the mergers that occurred within the last for the comparison with Schulze et al. (2020).
On the left-hand side of Fig. 13, we show the fraction of the peaked, flat and increasing galaxies that experienced their last major, minor and mini merger event within a time interval of for a given look back time in Fig. 13 up to a maximum of , similarly to figure 10 of Schulze et al. (2020). Each panel is normalized by the total number of the galaxies of a given class that experienced their last major, minor and mini merger within the last , such that the sum data points of a given type is equal to one in each panel. However, overall, we do not see any clear trend between the merger histories of the different galaxy types as a function of redshift, as it was previously found by Schulze et al. (2020). In fact, Schulze et al. (2020) found that of the peaked galaxies had no major mergers and that, if a major merger occurred, it was most probably more than ago. On the other hand, they found that only and of the flat and increasing galaxies experienced no major mergers, respectively, while the remaining ones more likely experienced at least a major merger between - ago. Finally, Schulze et al. (2020) found that all galaxies experienced typically between - mini mergers with a probability increasing towards low redshifts.
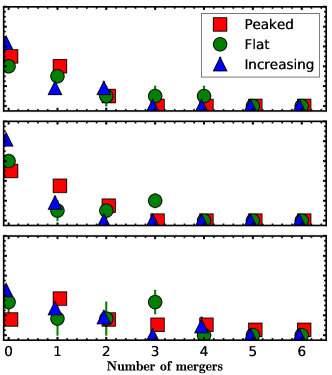
On the right-hand side of Fig. 13, we show the fraction of the peaked, flat and increasing galaxies that experienced a total number of major, minor and mini mergers in the last from the top to the bottom panel, respectively. We see that the majority of the galaxies are likely to have experienced either zero or one major merger. A small fraction of the galaxies (-) may have also experienced two major mergers, however the peaked and increasing galaxies are unlikely to have experienced more than two. On the other hand, a small fraction of the flat galaxies may have experienced up to four major mergers. Almost all of the increasing galaxies () did not experience any minor merger, while roughly half of the peaked and flat galaxies may have experienced up to two or three minor mergers, respectively. Approximately of the peaked galaxies have had at least one mini merger and a similar fraction of the flat galaxies have had at least three. On the other hand, half of the increasing galaxies have had no mini mergers, while the remaining half is likely to have experienced between one and two mini mergers. These results show that the peaked, flat and increasing galaxies are overall similar in terms of the number of the different types of mergers that they experienced in the last . An exception is represented by the frequency of minor mergers that are more typical for the peaked and flat than the increasing ones.
The discrepancy with the results found by Schulze et al. (2020) may be due to several possible reasons. It could be a result of low sample statistics as we only have galaxies compared to the of Schulze et al. (2020). Additionally, the fact that we are also only selecting S0 galaxies in this work could add a certain bias. Secondly, it could be due to the fact that we are studying the profiles of the GCs, while Schulze et al. (2020) looked at the stellar profiles. Additionally, our profiles extend beyond , while those from Schulze et al. (2020) were limited to . Finally, it could be a result of differences between the EAGLE and Magneticum simulations.
To test whether our results may partly depend on the radial extension of the profiles, we perform an alternative classification of the profiles restricted to . However, the results in Fig. 13 do not change significantly and we still do not see the trends found by Schulze et al. (2020) for the major and mini mergers specifically.
The results in Fig. 13 could possibly suggest that the distinct present-day kinematic profiles are not the result of the specific different merger histories of the S0 galaxies. Other factors, such as the orbital configuration of the merging galaxies, may be playing a more dominant role. A possible follow-up project could involve investigating the kinematic properties of the GC systems back in time to understand whether and how the different physical processes (e.g. mergers) influence the GC kinematics in our galaxies during their evolution and increase the sample size beyond galaxies.
6.2 The origin of the GC misalignment in S0 galaxies
In Sec. 4.1, we classified out of the simulated S0 galaxies as misaligned, since their GCs were rotating along a different compared to the of the galaxy.
In this section, we aim to investigate what is the cause of the misalignment in these galaxies and, specifically, whether it is a result of the specific merger histories of the misaligned galaxies with respect to the other aligned galaxies. For each one of the misaligned galaxies, we identify those accretion events that each contributed to a significant fraction of the present-day GC population (i.e. ) and we study the kinematic properties of these accreted GCs, with the main focus being their 2D velocity map and 1D and profiles.
Galaxy with a significant accretion event
GalaxyID = 4362302
Galaxy with no significant accretion event
GalaxyID = 6451189
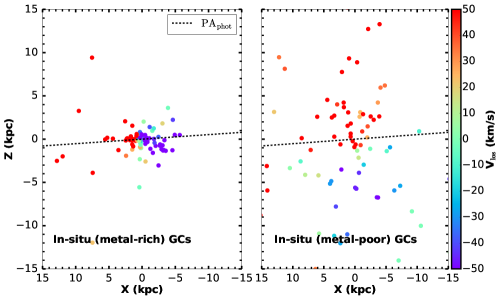
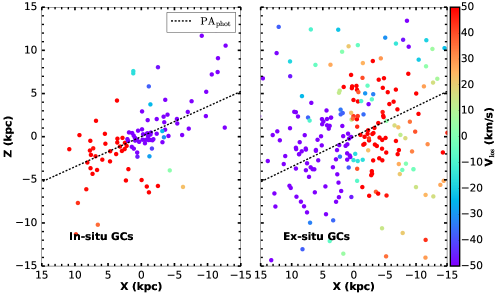
We find that of the misaligned galaxies () have experienced a major merger event within the last that contributed between - of the total present-day GC population. Three of these galaxies have also experienced a minor merger event between - ago that contributed between - of the GC population. The ex-situ GCs are largely metal-rich (i.e. ) in these galaxies and they show different rotation properties with respect to the in-situ GCs. In fact, while the in-situ GCs show typically strong rotation, which is overall well aligned with the of the galaxy, the ex-situ GCs show rotation which can be misaligned by angles varying between (where is co-rotating and is counter-rotating) with respect to that of the in-situ GCs. In Fig. 15, we show the edge-on projection of one of these galaxies (i.e. GalaxyID ) as an example, which experienced a major merger ago that contributed to of the total present-day GC population with of these ex-situ GCs being metal-rich. We see that the ex-situ GCs are counter-rotating with respect to the in-situ GCs in this galaxy.
We also find that few of the aligned galaxies in Sec. 4.1 (e.g. GalaxyID ) have accreted a significant fraction of the ex-situ metal-rich GCs from a major merger (i.e. ), but these ex-situ metal-rich GCs are co-rotating with the in-situ metal-rich GCs. These aligned galaxies have experienced the major merger event between - ago, similarly to the misaligned galaxies. Therefore, we suggest that the misalignment between the in-situ and ex-situ metal-rich GCs in these galaxies is not necessarily connected to the time of occurrence of the major merger, but it, possibly, depends on other properties of the mergers, such as the orbital configuration of the merging galaxies. In this scenario, the misalignment between the in-situ and ex-situ GCs could then be the result of the change of the axis of accretion from the cosmic web during the galaxy formation process, such that the spin axis of the accreted GCs was aligned differently with respect to the spin axis of the host galaxy.
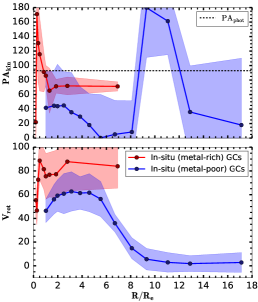
The remaining of the misaligned galaxies () did not experience any significant accretion events and, thus, they have low ex-situ GC fractions (i.e. of the total present-day GC population). The ex-situ GCs, which are mostly metal-poor in these galaxies, do not show evidence of any clear rotation. For this reason, we investigate the 2D velocity maps and the 1D and profiles of the in-situ metal-rich and in-situ metal-poor GCs in these galaxies. In two of these galaxies, we find that the rotation of the in-situ metal-rich GCs is, overall, aligned with the of the galaxy, while the in-situ metal-poor GCs are rotating along a kinematic axis offset by with respect to the of the galaxy. In other two galaxies, the in-situ metal-poor GCs do not show evidence of any net rotation, while the in-situ metal-rich GCs show rotation that oscillates around the of the galaxy, but it is overall consistent within the large errors. In Fig. 15, we show one of these galaxies (i.e. GalaxyID ) as an example, whose in-situ metal-poor GCs are misaligned by with respect to the in-situ metal-rich GCs.
From the 2D kinematic maps of all S0 galaxies, we find that the majority of the galaxies have the in-situ GCs co-rotating with the stars about the photometric major-axis of the galaxy (i.e. ). On the other hand, a small fraction of the galaxies have in-situ GCs that are not co-rotating with the stars (i.e. ) or that do not show evidence of any net rotation (i.e. ). Additionally, we find that of the S0 galaxies have the in-situ metal-poor GCs that are rotating about an axis different from that of the in-situ metal-rich GCs, which is overall consistent with the photometric major axis of the galaxy (e.g. GalaxyID and in Fig. 7).
We do not find any clear differences in the merger histories of the galaxies with misaligned in-situ metal-rich and in-situ metal-poor GC kinematics. Therefore, these results suggest that the misalignment of the in-situ GC sub-populations is not related to the specific merger histories of the galaxies.
The in-situ metal-poor GCs likely formed at early times, i.e. , in the turbulent and high-pressure disks of low-mass gas-rich galaxies. Prior to their formation, the in-situ metal-poor GCs suffered kinematic perturbations from merger events (more frequent at high redshifts) that redistributed these GCs in the host galaxy halo where they survived until the present-day (Kruijssen, 2015; Keller et al., 2020). The in-situ metal-rich GCs likely formed more recently after the host galaxy built up more of its stellar mass. For this reason, the in-situ metal-rich GCs are less likely to have suffered kinematic perturbations from merger events (less frequent and with smaller masses) and are generally co-rotating with the host galaxy stars.
We find that the in-situ metal-rich GCs are typically characterized by a more centrally concentrated and flattened spatial distribution than the in-situ metal-poor GCs, and they are rotating consistent with the stars about an axis consistent with the photometric major axis of the galaxy in a disk-like configuration (i.e. ), as commonly found in the observations (e.g. Brodie & Strader 2006; Forbes 1997; Pota et al. 2013; Dolfi et al. 2020, 2021; Arnold et al. 2011). On the other hand, the in-situ metal-poor GCs typically have a more extended spatial distribution.
This in-situ GC formation scenario could also explain the misalignment of the in-situ metal-rich GCs seen in of the galaxies if the merger events had a large enough mass-ratio to perturb the orbits of these GCs and the subsequent star formation produced a stellar disk that was aligned differently from these previously formed in-situ metal-rich GCs.
Additionally, previous observational works have also found evidence of ETGs showing "kinematically distinct cores" (KDC). These types of galaxies are generally not very common (i.e. identified in ATLAS3D by Krajnović et al. 2011), but some previous works have shown that the stars and GC sub-populations in these galaxies may have distinct and misaligned rotation (e.g. Blom et al. 2012), suggesting different origins. Therefore, the distinct rotational properties of the in-situ metal-rich and in-situ metal-poor GCs could also have their origins in a similar decoupling event that leads to KDCs.
7 Summary and conclusions
In this work, we have studied the kinematic profiles of the GCs in a selected sample of S0 galaxies from the E-MOSAICS simulations (Pfeffer et al., 2018; Kruijssen et al., 2019a), with the aim of finding the link between the present-day kinematic properties and the past merger histories of the S0 galaxies in low-density environments (i.e. field and small galaxy groups).
From the 2D kinematic maps and 1D kinematic profiles of the GCs (see Sec. 4.1), we find that of the galaxies have GCs that are rotating about an axis that is consistent with the photometric major axis of the galaxy (aligned), while the remaining of the galaxies do not (misaligned), in general agreement with the observations from the SLUGGS survey (Dolfi et al., 2021)
Among the aligned galaxies, we find that , and show a peaked, flat and increasing profile, respectively (see Sec. 4.1). From the comparison of these three distinct profiles with the past merger histories of the S0 galaxies derived from the E-MOSAICS simulations (see Sec. 6.1), we do not find evidence of any clear correlation between the present-day profile shape and the past merger histories of the galaxies, unlike in the Magneticum simulations of the stellar profiles by Schulze et al. (2020). A future work could investigate the kinematic properties of the GC systems back in time to understand whether and how the different physical processes can influence the GC kinematics in our galaxies during their evolution and increase the sample size beyond galaxies.
Among the misaligned galaxies, we find that (see Sec. 6.2):
-
•
of the galaxies experienced at least one major merger event that contributed between - of the total present-day GC population. In these galaxies, a large fraction of the ex-situ GCs are metal-rich and they are rotating about an axis that is different from that of the in-situ metal-rich GCs (which is consistent with the photometric major axis of the galaxy). The misalignment angle between the ex-situ and in-situ metal-rich GCs can vary between (co-rotation) to (counter-rotation), while the metal-poor GCs do not show evidence of any clear rotation in these galaxies (see Fig. 15; top panel).
-
•
of the galaxies did not experience any major merger event and have low ex-situ GC fraction (i.e. ). In these galaxies, the ex-situ GCs are predominantly metal-poor with no evidence of any clear rotation. In two of these galaxies, the in-situ metal-poor GCs are rotating about an axis offset by from that of the in-situ metal-rich GCs (which is consistent with the photometric major axis of the galaxy).
For the total sample, from the 2D kinematic maps, we find that the majority of the galaxies (i.e. ) have the in-situ GCs that are co-rotating with the stars about an axis that is consistent with the photometric major axis of the galaxy, as commonly found in the observations (e.g. Forbes 1997; Brodie & Strader 2006; Arnold et al. 2011; Pota et al. 2013; Dolfi et al. 2020, 2021). A minority of the galaxies (i.e. ) have the in-situ GCs that are rotating about an axis that is different from the photometric major axis of the galaxy, while the remaining of the galaxies have the in-situ GCs that do not show evidence of any net rotation. Finally, for the total sample, we find that of the galaxies have the in-situ metal-poor GCs that are rotating about an axis different from that of the in-situ metal-rich GCs. Therefore, we suggest that there are likely two possible origins for the GC misalignment in our S0 galaxies:
-
1.
in-situ GC formation during the evolution of the host galaxy. The in-situ metal-poor GCs formed early () and suffered kinematic perturbations from the frequent merger events, which redistributed these GCs in the host galaxy halo (Kruijssen, 2015; Keller et al., 2020). The in-situ metal-rich GCs are less likely to have suffered kinematic perturbations since they formed more recently when mergers became less frequent and the galaxy built up more of its stellar mass.
-
2.
a major merger event that contributed to a large fraction of the ex-situ metal-rich GCs that can be misaligned by angles varying between (co-rotation) to (counter-rotation) with respect to the in-situ metal-rich GCs (which are rotating consistent with the photometric major axis of the galaxy). The degree of misalignment will depend on the orbital configuration of the merging galaxies.
Finally, we have studied the distribution of the GC systems of our S0 galaxies in 3D phase-space diagrams (see Sec. 5). We find that there is a correlation between the accretion time of the GCs onto the galaxy with its location on the 3D and 2D phase-space diagrams, with the in-situ and ancient infaller GCs (accreted more than ago) being predominantly located within . On the other hand, the GCs that were accreted more recently (less than ago) are most likely found at larger virial radii, i.e. beyond (see Fig. 12). Therefore, in future work, we can use the 2D phase-space diagrams of observed GC systems to assign a probability of the GCs of being in-situ or ancient/recent infallers.
Acknowledgements
We thank the anonymous referee for their very constructive comments and suggestions that helped improving this paper. We thank the E-MOSAICS team for providing access to the data in the simulations used in this paper. DF, WC, KB and AD acknowledge support from the Australian Research Council under Discovery Project 170102344. JP acknowledges support from the Australian Research Council under Discovery Project 200102574. AJR was supported by National Science Foundation grant AST-1616710 and as a Research Corporation for Science Advancement Cottrell Scholar. JMDK gratefully acknowledges funding from the Deutsche Forschungsgemeinschaft (DFG) in the form of an Emmy Noether Research Group (grant number KR4801/1-1), as well as from the European Research Council (ERC) under the European Union’s Horizon 2020 research and innovation programme via the ERC Starting Grant MUSTANG (grant agreement number 714907).
This work used the DiRAC Data Centric system at Durham University, operated by the Institute for Computational Cosmology on behalf of the STFC DiRAC HPC Facility (www.dirac.ac.uk). This equipment was funded by BIS National E-infrastructure capital grant ST/K00042X/1, STFC capital grants ST/H008519/1 and ST/K00087X/1, STFC DiRAC Operations grant ST/K003267/1 and Durham University. DiRAC is part of the National E-Infrastructure. The work also made use of high performance computing facilities at Liverpool John Moores University, partly funded by the Royal Society and LJMU’s Faculty of Engineering and Technology.
Data Availability
The data are available upon request from the E-MOSAICS project (https://www.astro.ljmu.ac.uk/~astjpfef/e-mosaics/).
References
- Arnold et al. (2011) Arnold J. A., Romanowsky A. J., Brodie J. P., Chomiuk L., Spitler L. R., Strader J., Benson A. J., Forbes D. A., 2011, ApJ, 736, L26
- Arnold et al. (2014) Arnold J. A., et al., 2014, ApJ, 791, 80
- Bastian (2008) Bastian N., 2008, MNRAS, 390, 759
- Bastian et al. (2020) Bastian N., Pfeffer J., Kruijssen J. M. D., Crain R. A., Trujillo-Gomez S., Reina-Campos M., 2020, MNRAS, 498, 1050
- Beasley et al. (2019) Beasley M. A., Leaman R., Gallart C., Larsen S. S., Battaglia G., Monelli M., Pedreros M. H., 2019, MNRAS, 487, 1986
- Bekki (2009) Bekki K., 2009, MNRAS, 399, 2221
- Bekki & Couch (2011) Bekki K., Couch W. J., 2011, MNRAS, 415, 1783
- Bekki et al. (2005) Bekki K., Beasley M. A., Brodie J. P., Forbes D. A., 2005, MNRAS, 363, 1211
- Bellstedt et al. (2017) Bellstedt S., Forbes D. A., Foster C., Romanowsky A. J., Brodie J. P., Pastorello N., Alabi A., Villaume A., 2017, MNRAS, 467, 4540
- Benitez-Llambay (2015) Benitez-Llambay A., 2015, Py-Sphviewer: Py-Sphviewer V1.0.0, doi:10.5281/zenodo.21703
- Blom et al. (2012) Blom C., Forbes D. A., Brodie J. P., Foster C., Romanowsky A. J., Spitler L. R., Strader J., 2012, MNRAS, 426, 1959
- Bournaud et al. (2005) Bournaud F., Jog C. J., Combes F., 2005, A&A, 437, 69
- Brodie & Strader (2006) Brodie J. P., Strader J., 2006, ARA&A, 44, 193
- Brodie et al. (2014) Brodie J. P., et al., 2014, ApJ, 796, 52
- Buzzoni et al. (2006) Buzzoni A., Arnaboldi M., Corradi R. L. M., 2006, MNRAS, 368, 877
- Coccato et al. (2020) Coccato L., et al., 2020, MNRAS, 492, 2955
- Conroy & Gunn (2010) Conroy C., Gunn J. E., 2010, ApJ, 712, 833
- Conroy et al. (2009) Conroy C., Gunn J. E., White M., 2009, ApJ, 699, 486
- Correa et al. (2017) Correa C. A., Schaye J., Clauwens B., Bower R. G., Crain R. A., Schaller M., Theuns T., Thob A. C. R., 2017, MNRAS, 472, L45
- Crain et al. (2015) Crain R. A., et al., 2015, MNRAS, 450, 1937
- Damjanov et al. (2014) Damjanov I., Hwang H. S., Geller M. J., Chilingarian I., 2014, ApJ, 793, 39
- Deeley et al. (2020) Deeley S., et al., 2020, MNRAS, 498, 2372
- Deeley et al. (2021) Deeley S., Drinkwater M. J., Sweet S. M., Bekki K., Couch W. J., Forbes D. A., Dolfi A., 2021, MNRAS, 508, 895
- Dolfi et al. (2020) Dolfi A., et al., 2020, MNRAS, 495, 1321
- Dolfi et al. (2021) Dolfi A., Forbes D. A., Couch W. J., Bekki K., Ferré-Mateu A., Romanowsky A. J., Brodie J. P., 2021, MNRAS,
- Dressler (1980) Dressler A., 1980, ApJ, 236, 351
- Dressler et al. (1997) Dressler A., et al., 1997, ApJ, 490, 577
- Eliche-Moral et al. (2018) Eliche-Moral M. C., Rodríguez-Pérez C., Borlaff A., Querejeta M., Tapia T., 2018, A&A, 617, A113
- Fasano et al. (2000) Fasano G., Poggianti B. M., Couch W. J., Bettoni D., Kjærgaard P., Moles M., 2000, ApJ, 542, 673
- Forbes (1997) Forbes D., 1997, arXiv e-prints, pp astro–ph/9711165
- Forbes (2020) Forbes D. A., 2020, MNRAS, 493, 847
- Forbes et al. (2017a) Forbes D. A., et al., 2017a, AJ, 153, 114
- Forbes et al. (2017b) Forbes D. A., Sinpetru L., Savorgnan G., Romanowsky A. J., Usher C., Brodie J., 2017b, MNRAS, 464, 4611
- Forbes et al. (2018) Forbes D. A., et al., 2018, Proceedings of the Royal Society of London Series A, 474, 20170616
- Foster et al. (2011) Foster C., et al., 2011, MNRAS, 415, 3393
- Foster et al. (2016) Foster C., et al., 2016, MNRAS, 457, 147
- Furlong et al. (2015) Furlong M., et al., 2015, MNRAS, 450, 4486
- Guérou et al. (2016) Guérou A., Emsellem E., Krajnović D., McDermid R. M., Contini T., Weilbacher P. M., 2016, A&A, 591, A143
- Gunn & Gott (1972) Gunn J. E., Gott J. Richard I., 1972, ApJ, 176, 1
- Keller et al. (2020) Keller B. W., Kruijssen J. M. D., Pfeffer J., Reina-Campos M., Bastian N., Trujillo-Gomez S., Hughes M. E., Crain R. A., 2020, MNRAS, 495, 4248
- Krajnović et al. (2011) Krajnović D., et al., 2011, MNRAS, 414, 2923
- Kruijssen (2012) Kruijssen J. M. D., 2012, MNRAS, 426, 3008
- Kruijssen (2015) Kruijssen J. M. D., 2015, MNRAS, 454, 1658
- Kruijssen & Lamers (2008) Kruijssen J. M. D., Lamers H. J. G. L. M., 2008, A&A, 490, 151
- Kruijssen & Mieske (2009) Kruijssen J. M. D., Mieske S., 2009, A&A, 500, 785
- Kruijssen et al. (2011) Kruijssen J. M. D., Pelupessy F. I., Lamers H. J. G. L. M., Portegies Zwart S. F., Icke V., 2011, MNRAS, 414, 1339
- Kruijssen et al. (2019a) Kruijssen J. M. D., Pfeffer J. L., Crain R. A., Bastian N., 2019a, MNRAS, 486, 3134
- Kruijssen et al. (2019b) Kruijssen J. M. D., Pfeffer J. L., Reina-Campos M., Crain R. A., Bastian N., 2019b, MNRAS, 486, 3180
- Kruijssen et al. (2020) Kruijssen J. M. D., et al., 2020, MNRAS, 498, 2472
- Lacey & Cole (1993) Lacey C., Cole S., 1993, MNRAS, 262, 627
- Lamers et al. (2005) Lamers H. J. G. L. M., Gieles M., Bastian N., Baumgardt H., Kharchenko N. V., Portegies Zwart S., 2005, A&A, 441, 117
- Lange et al. (2015) Lange R., et al., 2015, MNRAS, 447, 2603
- Larsen et al. (2020) Larsen S. S., Romanowsky A. J., Brodie J. P., Wasserman A., 2020, Science, 370, 970
- Larson et al. (1980) Larson R. B., Tinsley B. M., Caldwell C. N., 1980, ApJ, 237, 692
- Merluzzi et al. (2016) Merluzzi P., Busarello G., Dopita M. A., Haines C. P., Steinhauser D., Bourdin H., Mazzotta P., 2016, MNRAS, 460, 3345
- Naab et al. (2014) Naab T., et al., 2014, MNRAS, 444, 3357
- Oser et al. (2010) Oser L., Ostriker J. P., Naab T., Johansson P. H., Burkert A., 2010, ApJ, 725, 2312
- Pastorello et al. (2015) Pastorello N., et al., 2015, MNRAS, 451, 2625
- Pfeffer et al. (2018) Pfeffer J., Kruijssen J. M. D., Crain R. A., Bastian N., 2018, MNRAS, 475, 4309
- Pfeffer et al. (2020) Pfeffer J. L., Trujillo-Gomez S., Kruijssen J. M. D., Crain R. A., Hughes M. E., Reina-Campos M., Bastian N., 2020, MNRAS, 499, 4863
- Pota et al. (2013) Pota V., et al., 2013, MNRAS, 428, 389
- Proctor et al. (2009) Proctor R. N., Forbes D. A., Romanowsky A. J., Brodie J. P., Strader J., Spolaor M., Mendel J. T., Spitler L., 2009, MNRAS, 398, 91
- Pulsoni et al. (2018) Pulsoni C., et al., 2018, A&A, 618, A94
- Reina-Campos & Kruijssen (2017) Reina-Campos M., Kruijssen J. M. D., 2017, MNRAS, 469, 1282
- Reina-Campos et al. (2021) Reina-Campos M., Trujillo-Gomez S., Deason A. J., Kruijssen J. M. D., Pfeffer J. L., Crain R. A., Bastian N., Hughes M. E., 2021, arXiv e-prints, p. arXiv:2106.07652
- Renzini & Peng (2015) Renzini A., Peng Y.-j., 2015, ApJ, 801, L29
- Rhee et al. (2017) Rhee J., Smith R., Choi H., Yi S. K., Jaffé Y., Candlish G., Sánchez-Jánssen R., 2017, ApJ, 843, 128
- Rodriguez-Gomez et al. (2016) Rodriguez-Gomez V., et al., 2016, MNRAS, 458, 2371
- Romanowsky (2006) Romanowsky A. J., 2006, in Barlow M. J., Méndez R. H., eds, Vol. 234, Planetary Nebulae in our Galaxy and Beyond. pp 341–348 (arXiv:astro-ph/0605275), doi:10.1017/S174392130600319X
- Schaye et al. (2015) Schaye J., et al., 2015, MNRAS, 446, 521
- Schulze et al. (2020) Schulze F., Remus R.-S., Dolag K., Bellstedt S., Burkert A., Forbes D. A., 2020, MNRAS, 493, 3778
- Speagle et al. (2014) Speagle J. S., Steinhardt C. L., Capak P. L., Silverman J. D., 2014, ApJS, 214, 15
- Springel et al. (2005) Springel V., et al., 2005, Nature, 435, 629
- Strader et al. (2005) Strader J., Brodie J. P., Cenarro A. J., Beasley M. A., Forbes D. A., 2005, AJ, 130, 1315
- Tapia et al. (2017) Tapia T., Eliche-Moral M. C., Aceves H., Rodríguez-Pérez C., Borlaff A., Querejeta M., 2017, A&A, 604, A105
- Trayford et al. (2017) Trayford J. W., et al., 2017, MNRAS, 470, 771
- Trujillo-Gomez et al. (2021) Trujillo-Gomez S., Kruijssen J. M. D., Reina-Campos M., Pfeffer J. L., Keller B. W., Crain R. A., Bastian N., Hughes M. E., 2021, MNRAS, 503, 31
- Usher et al. (2019) Usher C., Brodie J. P., Forbes D. A., Romanowsky A. J., Strader J., Pfeffer J., Bastian N., 2019, MNRAS, 490, 491
- Wiersma et al. (2009) Wiersma R. P. C., Schaye J., Theuns T., Dalla Vecchia C., Tornatore L., 2009, MNRAS, 399, 574
- Wu et al. (2014) Wu X., Gerhard O., Naab T., Oser L., Martinez-Valpuesta I., Hilz M., Churazov E., Lyskova N., 2014, MNRAS, 438, 2701
- Zolotov et al. (2015) Zolotov A., et al., 2015, MNRAS, 450, 2327
- de Graaff et al. (2021) de Graaff A., Trayford J., Franx M., Schaller M., Schaye J., van der Wel A., 2021, arXiv e-prints, p. arXiv:2110.02235