Identifying Dementia Subtypes with Electronic Health Records
Abstract.
Dementia is characterized by a decline in memory and thinking that is significant enough to impair function in activities of daily living. Patients seen in dementia specialty clinics are highly heterogeneous with a variety of different symptoms that progress at different rates. In this work, we used an unsupervised data-driven K-Means clustering approach on the component scores of the Clinical Dementia Rating (CDR®) score to identify dementia subtypes and used the gap-statistic to identify the optimal number of clusters. Our goal was to characterize the identified dementia subtypes in terms of their cognitive performance and analyze how patient transitions between subtypes relate to disease progression. Our results indicate both inter-subtype variability, which indicates the variability amongst dementia subtypes for a particular component score even with the same CDR and (ii) intra-subtype variability, which indicates the variation in the 6 component scores within a particular dementia subtype. We observed that dementia subtypes that represented individuals with very mild dementia (CDR 0.5) had widely varying rates of transition to other subtypes. Future work includes testing the generalizability of our proposed pipeline on additional datasets, and using a larger volume of EHR data to estimate probabilistic estimates of the variability between dementia subtypes both in terms of cognitive profile and disease progression.
1. Introduction
Dementia is defined by a decline in memory and thinking that is significant enough to impair function in activities of daily living. Dementia has numerous causes, including reversible causes, such as medication-induced cognitive dysfunction, as well as irreversible causes, such as progressive neuro-degenerative disorders (Ferri et al., 2005). Alzheimer Disease (AD) is the most common cause of dementia in older adults, but many other disorders can cause or contribute to dementia, including cerebrovascular disease and diseases associated with Lewy bodies, tau tangles, or TARDNA-binding protein43 (TDP-43) (Zanetti et al., 2006). Patients present with a variety of different symptoms and progress at different rates, which may be related to the underlying brain pathologies, variation in baseline cognitive ability, genetic background, medical comorbidities, and social determinants of health (Ryan et al., 2018). Hence, patients seen in a dementia clinic are highly heterogeneous and represent many different types of dementia. Better characterizing the clinical heterogeneity of dementia could improve dementia diagnosis and improve the ability of clinicians to provide an appropriate prognosis to patients and their families (Goyal et al., 2018).
Previous studies have used a priori-defined neuropathological categories to identify subtypes within a clinical dementia population (Jack Jr et al., 2015; Lam et al., 2013; Murray et al., 2011). However, these approaches define subtypes of pathologies based on clinical diagnosis, which rely on a ”clinical intuition” instead of unbiased data-driven approaches (Nettiksimmons et al., 2014; Noh et al., 2014). More recently, the increasing availability of Electronic Health Records (EHR) data combined with complex machine learning algorithms have encouraged data-driven approaches to identify patterns in clinical data (Kumar et al., 2021). These new data sources and methods may offer new insights into the underlying heterogeneity of dementia. For example, clustering algorithms can stratify dementia patients into subtypes based on key features recorded in the EHR that can enhance predictive ability compared to analyzing the entire cohort as a single homogeneous group (Vogt and Nagel, 1992).
There has been significant research which uses clustering techniques on EHR data to identify dementia subtypes. In (Xu et al., 2020), hierarchical clustering was applied on clinical data from a multi-speciality urban medical centre to identify multiple sub-phenotypes of Alzheimer Disease and related dementia. Another study applied a representation learning model on Mount Sinai Health system data and identified subtypes with variable degree of dementia symptoms (Landi et al., 2020). Other studies focusing on dementia subtyping used 2 categories of structured clinical data sources as key features : brain atrophy patterns as measured by structural MRI (Varol et al., 2017; Dong et al., 2015; Poulakis et al., 2018; Förstl et al., 1994; Malpas, 2016) and cognitive impairment as measured by performance on cognitive tasks (Scheltens et al., 2017, 2016; Wallin et al., 2011; Price et al., 2015; Davidson et al., 2010). While most of these studies focus on identifying subtypes within a dementia cohort, little research has been done on interpreting the cognitive characteristics of the identified subtypes and how they are related to disease progression.
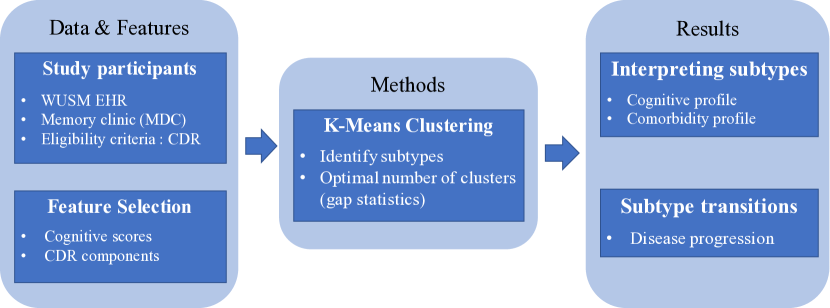
In this work, we use an unsupervised data-driven clustering approach to identify dementia subtypes. Our goal is to analyze if the identified subtypes have a logical relationship to each other based on our clinical understanding and knowledge. In contrary to prior work, our work focuses on both the interpretation of the identified subtypes based on domain knowledge and analyzing how the subtypes play a role in the longitudinal progression trajectory of the disease. Understanding the cognitive profile of the subtypes can lead to effective clinical decision-making and precision diagnostics tailored to each subtype. Our contributions can be summarized as follows (visual representation of the pipeline shown in Figure 1):
-
•
Applying unsupervised clustering techniques on cognitive assessment scores to identify subtypes within a clinical dementia cohort.
-
•
Interpretation of the identified subtypes in terms of their cognitive characteristics.
-
•
analyze transitions between the different subtypes and how they are related to disease progression.
| Feature variables (baseline) | ||||||||||||||
| Age (mean, SD) | 73.2 years (11.9 years) | |||||||||||||
| Female (n, %) | 1038 (57%) | |||||||||||||
|
|
|||||||||||||
|
|
|||||||||||||
|
|
|||||||||||||
|
|
2. Methods
2.1. Data sources and study participants
Clinical data corresponding to office visits were extracted from the Electronic Health Records (EHR) of patients treated between June 2012 and May 2018 at the Memory Diagnostic Centre (MDC) at the Washington University School of Medicine in St. Louis, a large, academic, tertiary-care referral centre. All patients seen in the clinic were presented for evaluation of memory and/or thinking concerns. Patients underwent a comprehensive history, neurological examination, brief cognitive testing, and if indicated, laboratory testing and brain imaging. Patients were evaluated using the well-validated and widely used Clinical Dementia Rating (CDR®) at each visit, a five-point scale to characterize six different domains of cognitive and functional performance: memory, orientation, judgement and problem solving, home and hobbies, community affairs, and personal care (Morris, 1991). For both the CDR global score and component scores, 0 denotes cognitively normal, 0.5 very mild dementia, 1 mild dementia, 2 moderate dementia and 3 severe dementia. Longitudinal data from 1,845 patients with 2,737 visits were eligible for inclusion, where each visit had a CDR score. Table 1 represents the baseline demographic characteristics of the selected cohort. This study was approved by the Washington University in St. Louis Institutional Review Board.
2.2. Feature selection for clustering analysis
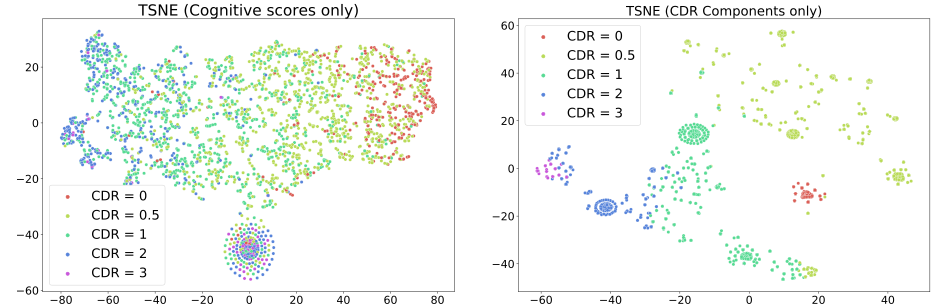
Our initial set of feature variables consisted of cognitive assessment scores, indicating performance on a standardized battery of cognitive tasks to assess the severity of dementia. Compared to expensive and/or invasive procedures like neuroimaging biomarkers, these scores are standard metrics in dementia research and is recorded for all patients in the memory clinic. Next, we performed feature selection to determine the optimal set of features for clustering. We started with two sets of features as follows: (i) Cognitive assessment scores: Boston Naming Test, Mini-Mental State Exam, Short Blessed, Verbal Fluency, Word List Memory Task and Word List Recall, (ii) six components of CDR score: Memory, Orientation, Judgment and Problem Solving, Community Affairs, Home and Hobbies, and Personal Care. The motivation behind choosing the individual CDR component as features compared to the aggregate Global CDR score is the fact that for patients having the same CDR score, the individual components might be different from one another, allowing us a more granular approach of studying the sub-phenotyping of patients.
For each of the categories, we plotted the t-distributed stochastic neighbour embedding (T-SNE) distribution. Figure 2 shows the T-SNE 2-dimensional representations of each of the 2 feature sets across the CDR categories. We can see that using the cognitive scores as features creates a gradient from low to high CDR but did not result in clusters. On the other hand, using the CDR components as features created clusters that were distinct without any significant overlap across the CDR categories. analyzing the degree of overlap of points across the different CDR categories, the six components of CDR were selected as the optimal set of features for clustering. Since each of the selected features are ordinal variables and had a very low missing rate of ¡5%, we followed the strategy in (Zhou and Saghapour, 2021) and imputed the missing values for each feature column using the median value of that feature across all the 2737 visits.
2.3. Clustering method
In this study, we used the K-means clustering algorithm to generate the dementia subtypes. In K-means, the a priori-specified k number of clusters are identified through iteratively minimizing the distance between data points and their assigned cluster means (Likas et al., 2003). We used the t-distributed stochastic neighbour embedding (T-SNE) (Van der Maaten and Hinton, 2008) as a dimensionality reduction method prior to clustering. T-SNE lowers the dimension of the data while representing points in a geometrical space, thus transforming the data into a form where K-means can be applied.
One important issue is that the clustering analysis was performed on all data that was available from a 6-year period between 2012-2018, and some patients had multiple visits during this period. For the clustering step, each visit was assumed independent without any temporality (linkage) between individual visits of the same patient. The temporality information between individual visits was used downstream for analyzing the relationship between different clusters. This approach – including all visits for the clustering analysis as opposed to including the baseline visit of each patient was taken to enable downstream longitudinal analysis and track the symptom progression rate among patients. For example, at any given point in time, a patient exists in a single cluster (dementia subtype), but transitions between different clusters over time. The gap statistics algorithm (Tibshirani et al., 2001) was used for determining the optimal number of clusters (K).
To gain an insight into which patients have a higher probability of progression, patient transitions between different dementia subtypes were analyzed across multiple visits. Patients with only a single visit were censored from our analysis. All the identified subtypes were characterized in terms of their cognitive characteristics. Finally, the differences in progression rate, both within and between Global CDR score categories were measured.
3. Results
3.1. Clustering results
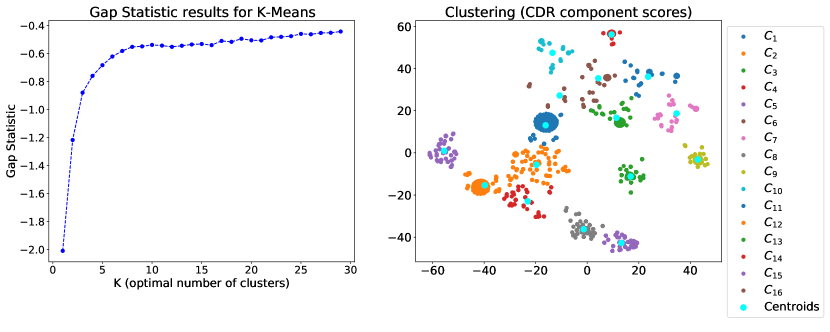
Figure 3 shows the gap statistics (left) and the clustering results (right). The gap statistic is used for determining the number of significant components, which was determined by the largest relative gap jump. From the gap statistic plot, K = 9, 11 and 16 were identified with significant relative gap jump compared to the other values of K (Figure 3). In line with the T-SNE distribution of CDR component scores across the CDR categories in Figure 2, the final K value was selected as 16. Comparing both the T-SNE and the clustering plots in Figure 2 (left) and Figure 3 (right) respectively, we can observe that the points with CDR = 0.5 are quite scattered and multiple clusters have been formed from them. This validates our hypothesis that dementia patients are quite heterogeneous, even within a single Global CDR level.
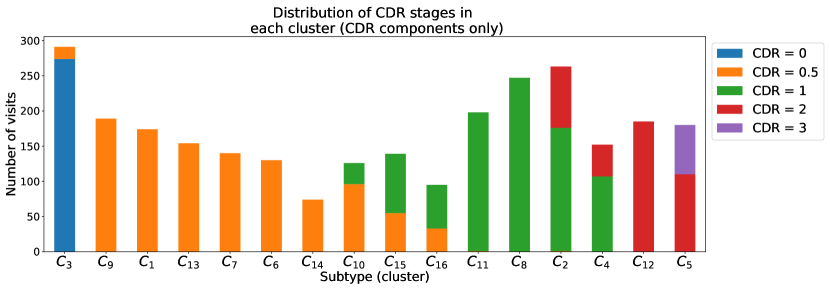
Figure 4 shows the CDR composition of each dementia subtype ordered by increasing CDR score (more severe dementia). Subtypes can either be homogenous, having a unique Global CDR or composite, including two Global CDR scores. We can observe that there is greater variability in early dementia (CDR of 0.5 or 1) leading to more dementia subtypes with a lower CDR score, compared to the more advanced dementia (CDR = 2 and 3). The above finding can also be confirmed from the T-SNE plot in Figure 2, where data points with CDR = 0.5 and 1 are more scattered, potentially forming multiple clusters (dementia subtypes).
3.2. Cognitive profile of identified subgroups
The association between the six CDR components and the dementia subtype allows interpretation of the cognitive profile of the subtypes. Figure 5 shows how each of the six components of CDR score vary across the 16 dementia subtypes. The individual component scores vary from 0-3 (0, 0.5, 1, 2, 3), with 0 indicating normal cognition and 3 indicating maximum impairment). For all the 6 CDR components, there was a natural transition of increasing cognitive impairment from the early (mild) to later (moderate to severe) stages of dementia. In this section, we analyzed 2 types of variability: (i) inter-subtype variability, which indicates the variability amongst dementia subtypes for a particular component score even with the same CDR and (ii) intra-subtype variability which indicates the variation in the 6 component scores within a particular dementia subtype.
3.2.1. Inter-subgroup variability
We evaluated the 6 dementia subtypes that only included patients rated CDR 0.5 (, , , , , ), based on our observation in Figure 2 and 3 that the visits with CDR = 0.5 have the maximum underlying heterogeneity. C6 has a consistent memory score of 1 and has more impaired memory loss compared to the remaining 5 dementia subtypes with a mean memory score of 0.5. Similarly, and have fully healthy orientation while all the visits in have moderate difficulty with their orientation. Compared to the remaining 5 dementia subtypes, have relatively healthy judgement in solving daily activities. Patient visits in and are fully capable of community affairs with well-maintained home and hobbies, compared to the remaining dementia subtypes with relatively impaired performance in these 2 CDR component categories. Unlike the remaining 5 CDR components, personal care had no zero inter-subtype variability with all visits with CDR = 0.5 being fully capable of self-care without any kind of impairment. Dementia subtypes with greater than or equal to mild dementia stages (CDR = 1, 2, 3) had less cognitive variability than subtypes with CDR = 0.5 as observed from Figure 5.
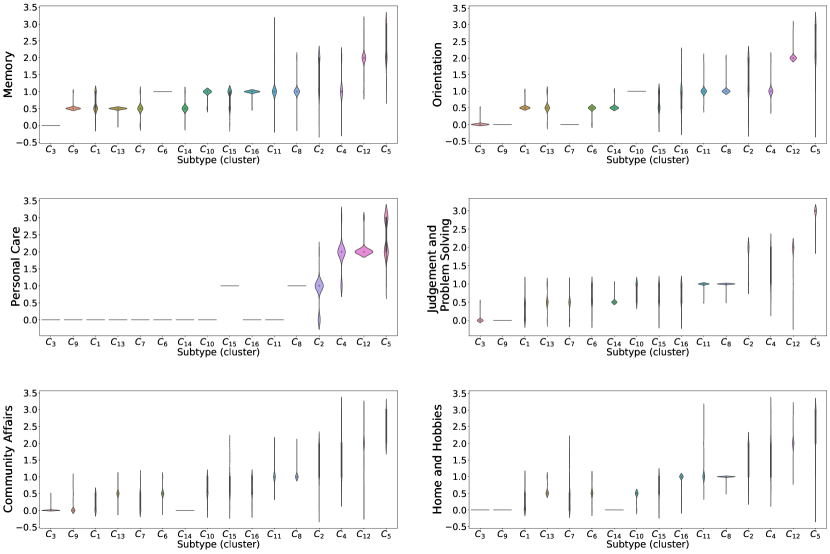
3.2.2. Intra-subgroup variability
Next we examined how visits in the same dementia subtype can have variable CDR component distribution with respect to the 6 components of CDR. For example, patient visits in have mild memory impairment, but are otherwise fully functional in the other domains. Patient visits in have slightly impaired memory, orientation and problem-solving skills, but are otherwise healthy in personal care, community affairs and home and hobbies. Similarly, we can define the cognitive profile of each dementia subtype, which in turn captures the role of each of the 6 CDR components in capturing the heterogeneity within dementia patients. Analyzing the intra-subtype variability of all the dementia subtypes, we can conclude that memory, orientation and home and hobbies have a significant role in capturing the variability within the CDR = 0.5 groups. On the other hand, the personal care scores do not provide any significant insights.
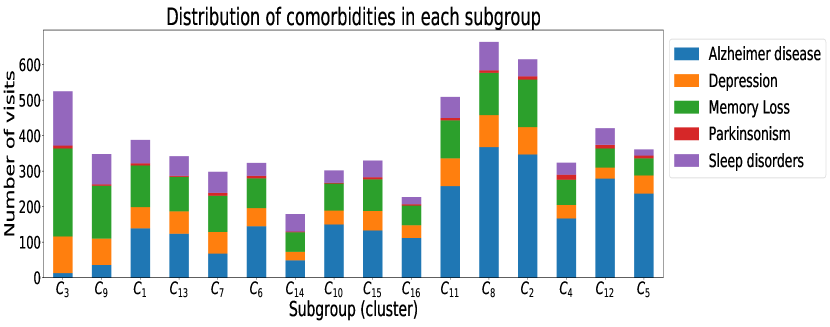
3.3. Comorbidity characteristics of identified subgroups
We also analyzed the comorbidity profile of each of the 16 identified dementia subtypes. We identified the top 5 comorbid conditions of dementia patients in our dataset, which were Alzheimer Disease (AD), Major Depressive Disorder (depression), Memory Loss (not otherwise specified), Parkinson Disease and Obstructive Sleep Apnea (sleep disorder). Figure 6 shows the distribution of visits within each dementia subtype having the above 5 comorbid conditions. One important trend that we can observe is that the proportion of visits having AD is higher in the later stages of dementia (CDR = 1, 2, 3) compared to the early stage groups (CDR = 0.5). This observation shows that AD, the most common form of dementia, is more likely to be diagnosed in patients with more significant cognitive and functional impairment. On the other hand, the visits in early stage dementia subtypes (CDR = 0.5) are mostly characterized by a diagnosis of memory loss, depression and sleep disorders.
3.4. Disease progression through subgroup transitions
We next examined how patients transitioned between the different dementia subtypes over time and how these transitions were related to dementia progression. The units of each subtype are patient visits and a patient can exist in a single subtype at any given point in time, but can transition to the same or different subtype in their next visit. Since there are 16 subtypes and it is difficult to interpret the transitions between every pair of subtypes, we grouped the 16 subtypes into 6 broader categories ordered as shown in Table 2. The subtypes were grouped based on if they represent a unique Global CDR score (homogenous) or two Global CDR (composite) and also in terms of increasing Global CDR from 0 to 3. For example, represents mostly the CDR = 0 visits while has all the subtypes with CDR = 0.5, corresponding the homogenous orange bars in Figure 4.
| Grouping | Subgroups | CDR | CDR Type |
|---|---|---|---|
| 0 / 0.5 | Composite | ||
| , , , , , | 0.5 | Homogenous | |
| , , | 0.5 / 1 | Composite | |
| , | 1 | Homogenous | |
| , | 1 / 2 | Composite | |
| , | 2 /3 | Composite |
Table 3 shows the number of transitions between every pair of dementia subtype groups. For example, the 170 transitions between signifies that there are 170 instances where a particular patient that was in (CDR = 0.5) remained in (CDR = 0.5) at their next visit. The transitions involving definite change in CDR include both progression to higher CDR score (e.g. ) and regression to a lower CDR score (e.g. ). The regressions signify that there are some dementia patients whose cognitive conditions improved in their next visit. While regression is not common, it is important to identify these patients and investigate the reasons for their cognitive improvement. From Table 3, we can observe that 2 patients progressed from and respectively, moving from CDR = 0.5 to CDR = 2, 3 at their next visit and skipping the intermediate CDR = 1 stage, suggesting either rapid progression or a long follow-up interval between visits. On further introspection, we found that the patient moving from had a short follow-up length (interval between successive visits) of 184 days while the patient moving from had a long follow-up length of 679 days. While the former observation indicates chances of actual rapid progression, the latter signifies that the probable reason of CDR jump is long follow-up of that patient.
| Start/End | ||||||
|---|---|---|---|---|---|---|
| 36 | 15 | 1 | 0 | 0 | 1 | |
| 17 | 170 | 47 | 55 | 13 | 1 | |
| 1 | 19 | 44 | 66 | 24 | 10 | |
| 0 | 5 | 10 | 74 | 51 | 20 | |
| 0 | 2 | 4 | 9 | 62 | 45 | |
| 0 | 0 | 0 | 1 | 10 | 79 |
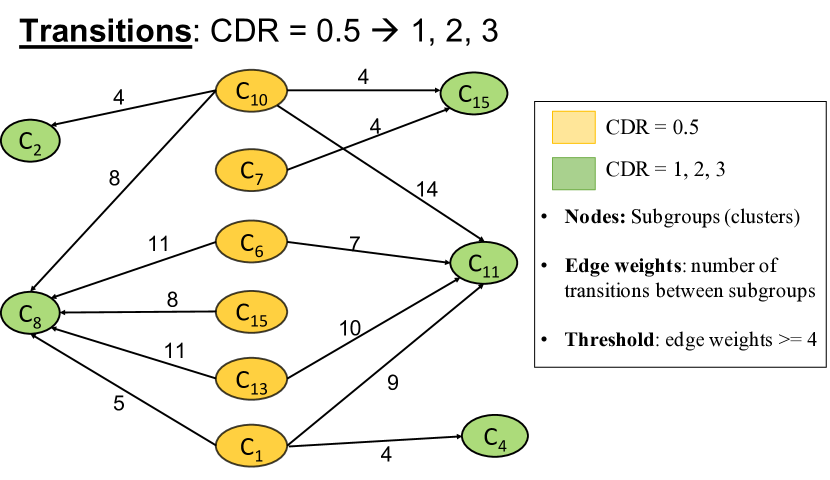
Next, we examine how the dementia subtype group transitions shown above can be related to dementia progression. Figure 7 shows the transitions from CDR = 0.5 to higher CDR score of 1, 2 and 3. Out of all the CDR 0.5 visits, individuals classified into dementia subtype and had the highest progression to CDR = 1 at their next visit. On the contrary, dementia subtypes like rarely progressed to higher CDR stages. This observation validates our hypothesis that individuals rated CDR = 0.5 are highly heterogeneous and have a variable rate of dementia progression.
4. Discussion
The goal of our study was to apply an unsupervised data-driven clustering approach to identify dementia subtypes within a specialty dementia clinic. We extracted outpatient office visits from an EHR, selected the 6 components of CDR as the optimal set of features after a feature selection step, and applied the K-means algorithm to identify 16 dementia subtypes. In contrast to prior work, our work focuses on both the interpretation of the identified subtypes based on their cognitive characteristics and analyzing how the subtypes play a role in the longitudinal progression trajectory of the disease.
4.1. Clustering on individual visits
In this work, the unsupervised clustering analysis was performed with data from individual visits, rather than each patient, which assumed that each visit of the same patient is independent without any longitudinal relations between the consecutive visit. Our goal was to blind ourselves to the temporality (linkages) between visits, and later utilize the temporal aspect to investigate the relationship between the clusters (dementia subtypes). First, dementia often progresses over a decade, whereas our window of EHR data is a maximum of six years. Rigorous analysis of longitudinal data is only possible when information about all the visits of a particular dementia patient is available, and in this dataset, we are evaluating a cross-section of data from patients that encompasses different windows of their clinical care (e.g. some may have been seen in 2006-2014, others from 2016-2022). Since we had EHR data from 2012-2018 only, we decided to perform the clustering at the visit level. This approach also helps in increasing the volume of data available for clustering, since we had only 1845 patients in our dataset who satisfied the eligibility criteria. Since the units of each dementia subtype are individual visits and not patients, a patient can have the first visit in one dementia subtype and the next visit in the same or a different subtype. This approach not only allows us to analyze the relationship between dementia subtypes but also the differential progression trajectory of dementia patients. Although our experimental analyzes have been demonstrated in terms of dementia subtypes, our findings could be made more granular by focusing on the heterogeneity of individual patients. For example, when we say a particular dementia subtype with CDR = 0.5 has a higher chance of progression to CDR = 1, 2, 3 compared to the other subtypes, we can investigate the patients who have visits in that particular subtype and track their remaining visits across all subtypes. We believe that this visit-level approach is more robust and generalizable in terms of investigating heterogeneity and disease progression compared to the patient-level approach of clustering using only the baseline information of each dementia patient.
4.2. Prioritizing early stage dementia subgroups for precision diagnostics
In our analysis, we focused our attention on the visits with CDR = 0.5 to investigate the level of heterogeneity. From our observation in Figures 2-5, we can conclude very mild dementia (CDR = 0.5) is much more heterogeneous than more severe dementia. We defined the cognitive profile of each dementia subtype and examined both the inter-subtype and intra-subtype variability. For example, individuals in the same dementia subtype can have different scores in memory, orientation, judgement and problem solving and community affairs (intra-subtype variability). We also evaluated the variability amongst dementia subtypes in their performance on the individual component tasks for CDR. In Figure 5, we can see that the dementia subtypes with more severe dementia (CDR = 1, 2, 3) have worse performance on CDR component tasks with lower variability. Improved classification of individuals with very mild dementia may enable more accurate diagnosis and prognosis, which may also be helpful in weighing the potential benefits of certain treatments. For example, if a patient is very likely to progress to more severe dementia, a treatment with significant risks may have greater justification.
4.3. Variability in CDR progression
In Table 3, we observed two interesting patterns in terms of CDR progression: (i) regression in CDR global score, signifying that some patients improve and (ii) skipping CDR stages during progression, where a patient can skip a CDR stage during progression (e.g. move directly from CDR = 0.5 to 2 in their next visit). The regression in CDR score could be related to treatment of conditions that can cause or worsen dementia symptoms. For example, dementia specialists often discontinue medications that impair cognition, and patients often improve after these changes are made. Skipping CDR stages during progression could be related to actual rapid progression or a long interval between adjacent visits. Events like a stroke or a fall can significantly worsen the cognitive abilities of a patient, increasing the apparent rate of progression. Changes in the collateral source (caregiver, family member) who accompanies the patient in his/her follow-up visit and informs the clinician of the patient’s condition can affect the CDR. This reflects a potential bias in the clinical rating of dementia.
4.4. Limitations and scope for future work
One of the limitations is the fact that we have tested our approach on a single EHR dataset. As part of future work, we plan to test the generalizability of our pipeline on additional datasets. Another limitation is the relatively small sample size of our dataset which restricts our ability to perform rigorous statistical analyzes on the variable rate of progression of dementia subtypes. The main motivation behind our analysis was to analyze the initial patterns of heterogeneity seen within a dementia cohort and possible solution of parsing the heterogeneity by characterizing the dementia subtypes. Applying this pipeline to a larger EHR dataset can allow us to estimate probabilistic estimates of disease progression, backed by rigorous statistical analysis.
5. Conclusion
In this research, we applied an unsupervised data-driven clustering approach to EHR data from a dementia specialty clinic to identify dementia subtypes based on CDR component scores. Our goal was to characterize the cognitive profile of the dementia subtypes and analyze how the subtypes change over time. We observed that dementia subtypes that represented individuals with very mild dementia (CDR 0.5) had widely varying rates of transition to other subtypes. Future work includes testing the generalizability of our proposed pipeline on additional datasets, and using a larger volume of EHR data to estimate probabilistic estimates of the variability between dementia subtypes both in terms of cognitive profile and disease progression.
References
- (1)
- Davidson et al. (2010) Julie E Davidson, Michael C Irizarry, Bethany C Bray, Sally Wetten, Nicholas Galwey, Rachel Gibson, Michael Borrie, Richard Delisle, Howard H Feldman, Ging-Yuek Hsiung, et al. 2010. An exploration of cognitive subgroups in Alzheimer’s disease. Journal of the International Neuropsychological Society 16, 2 (2010), 233–243.
- Dong et al. (2015) Aoyan Dong, Nicolas Honnorat, Bilwaj Gaonkar, and Christos Davatzikos. 2015. CHIMERA: clustering of heterogeneous disease effects via distribution matching of imaging patterns. IEEE transactions on medical imaging 35, 2 (2015), 612–621.
- Ferri et al. (2005) Cleusa P Ferri, Martin Prince, Carol Brayne, Henry Brodaty, Laura Fratiglioni, Mary Ganguli, Kathleen Hall, Kazuo Hasegawa, Hugh Hendrie, Yueqin Huang, et al. 2005. Global prevalence of dementia: a Delphi consensus study. The lancet 366, 9503 (2005), 2112–2117.
- Förstl et al. (1994) H Förstl, R Levy, A Burns, P Luthert, and N Cairns. 1994. Pathways and patterns of cell loss in verified Alzheimer’s disease: a factor and cluster analysis of clinico-pathological subgroups. Behavioural neurology 7, 3-4 (1994), 175–180.
- Goyal et al. (2018) Devendra Goyal, Donna Tjandra, Raymond Q Migrino, Bruno Giordani, Zeeshan Syed, Jenna Wiens, Alzheimer’s Disease Neuroimaging Initiative, et al. 2018. Characterizing heterogeneity in the progression of Alzheimer’s disease using longitudinal clinical and neuroimaging biomarkers. Alzheimer’s & Dementia: Diagnosis, Assessment & Disease Monitoring 10 (2018), 629–637.
- Jack Jr et al. (2015) Clifford R Jack Jr, Heather J Wiste, Stephen D Weigand, David S Knopman, Michelle M Mielke, Prashanthi Vemuri, Val Lowe, Matthew L Senjem, Jeffrey L Gunter, Denise Reyes, et al. 2015. Different definitions of neurodegeneration produce similar amyloid/neurodegeneration biomarker group findings. Brain 138, 12 (2015), 3747–3759.
- Kumar et al. (2021) Sayantan Kumar, Inez Oh, Suzanne Schindler, Albert M Lai, Philip RO Payne, and Aditi Gupta. 2021. Machine learning for modeling the progression of Alzheimer disease dementia using clinical data: a systematic literature review. JAMIA open 4, 3 (2021), ooab052.
- Lam et al. (2013) Benjamin Lam, Mario Masellis, Morris Freedman, Donald T Stuss, and Sandra E Black. 2013. Clinical, imaging, and pathological heterogeneity of the Alzheimer’s disease syndrome. Alzheimer’s research & therapy 5, 1 (2013), 1–14.
- Landi et al. (2020) Isotta Landi, Benjamin S Glicksberg, Hao-Chih Lee, Sarah Cherng, Giulia Landi, Matteo Danieletto, Joel T Dudley, Cesare Furlanello, and Riccardo Miotto. 2020. Deep representation learning of electronic health records to unlock patient stratification at scale. NPJ digital medicine 3, 1 (2020), 1–11.
- Likas et al. (2003) Aristidis Likas, Nikos Vlassis, and Jakob J Verbeek. 2003. The global k-means clustering algorithm. Pattern recognition 36, 2 (2003), 451–461.
- Malpas (2016) Charles B Malpas. 2016. Structural neuroimaging correlates of cognitive status in older adults: a person-oriented approach. Journal of Clinical Neuroscience 30 (2016), 77–82.
- Morris (1991) John C Morris. 1991. The clinical dementia rating (cdr): Current version and. Young 41 (1991), 1588–1592.
- Murray et al. (2011) Melissa E Murray, Neill R Graff-Radford, Owen A Ross, Ronald C Petersen, Ranjan Duara, and Dennis W Dickson. 2011. Neuropathologically defined subtypes of Alzheimer’s disease with distinct clinical characteristics: a retrospective study. The Lancet Neurology 10, 9 (2011), 785–796.
- Nettiksimmons et al. (2014) Jasmine Nettiksimmons, Charles DeCarli, Susan Landau, Laurel Beckett, Alzheimer’s Disease Neuroimaging Initiative, et al. 2014. Biological heterogeneity in ADNI amnestic mild cognitive impairment. Alzheimer’s & Dementia 10, 5 (2014), 511–521.
- Noh et al. (2014) Young Noh, Seun Jeon, Jong Min Lee, Sang Won Seo, Geon Ha Kim, Hanna Cho, Byoung Seok Ye, Cindy W Yoon, Hee Jin Kim, Juhee Chin, et al. 2014. Anatomical heterogeneity of Alzheimer disease: based on cortical thickness on MRIs. Neurology 83, 21 (2014), 1936–1944.
- Poulakis et al. (2018) Konstantinos Poulakis, Joana B Pereira, Patrizia Mecocci, Bruno Vellas, Magda Tsolaki, Iwona Kłoszewska, Hilkka Soininen, Simon Lovestone, Andrew Simmons, Lars-Olof Wahlund, et al. 2018. Heterogeneous patterns of brain atrophy in Alzheimer’s disease. Neurobiology of aging 65 (2018), 98–108.
- Price et al. (2015) Catherine C Price, Jared J Tanner, Ilona M Schmalfuss, Babette Brumback, Kenneth M Heilman, and David J Libon. 2015. Dissociating statistically-determined Alzheimer’s disease/vascular dementia neuropsychological syndromes using white and gray neuroradiological parameters. Journal of Alzheimer’s Disease 48, 3 (2015), 833–847.
- Ryan et al. (2018) Joanne Ryan, Peter Fransquet, Jo Wrigglesworth, and Paul Lacaze. 2018. Phenotypic heterogeneity in dementia: a challenge for epidemiology and biomarker studies. Frontiers in public health 6 (2018), 181.
- Scheltens et al. (2016) Nienke ME Scheltens, Francisca Galindo-Garre, Yolande AL Pijnenburg, Annelies E van der Vlies, Lieke L Smits, Teddy Koene, Charlotte E Teunissen, Frederik Barkhof, Mike P Wattjes, Philip Scheltens, et al. 2016. The identification of cognitive subtypes in Alzheimer’s disease dementia using latent class analysis. Journal of Neurology, Neurosurgery & Psychiatry 87, 3 (2016), 235–243.
- Scheltens et al. (2017) Nienke ME Scheltens, Betty M Tijms, Teddy Koene, Frederik Barkhof, Charlotte E Teunissen, Steffen Wolfsgruber, Michael Wagner, Johannes Kornhuber, Oliver Peters, Brendan I Cohn-Sheehy, et al. 2017. Cognitive subtypes of probable Alzheimer’s disease robustly identified in four cohorts. Alzheimer’s & Dementia 13, 11 (2017), 1226–1236.
- Tibshirani et al. (2001) Robert Tibshirani, Guenther Walther, and Trevor Hastie. 2001. Estimating the number of clusters in a data set via the gap statistic. Journal of the Royal Statistical Society: Series B (Statistical Methodology) 63, 2 (2001), 411–423.
- Van der Maaten and Hinton (2008) Laurens Van der Maaten and Geoffrey Hinton. 2008. Visualizing data using t-SNE. Journal of machine learning research 9, 11 (2008).
- Varol et al. (2017) Erdem Varol, Aristeidis Sotiras, Christos Davatzikos, Alzheimer’s Disease Neuroimaging Initiative, et al. 2017. HYDRA: Revealing heterogeneity of imaging and genetic patterns through a multiple max-margin discriminative analysis framework. Neuroimage 145 (2017), 346–364.
- Vogt and Nagel (1992) Wolfgang Vogt and Dorothea Nagel. 1992. Cluster analysis in diagnosis. Clinical Chemistry 38, 2 (1992), 182–198.
- Wallin et al. (2011) Åsa K Wallin, Carina Wattmo, and Lennart Minthon. 2011. Galantamine treatment in Alzheimer’s disease: response and long-term outcome in a routine clinical setting. Neuropsychiatric disease and treatment 7 (2011), 565.
- Xu et al. (2020) Jie Xu, Fei Wang, Zhenxing Xu, Prakash Adekkanattu, Pascal Brandt, Guoqian Jiang, Richard C Kiefer, Yuan Luo, Chengsheng Mao, Jennifer A Pacheco, et al. 2020. Data-driven discovery of probable Alzheimer’s disease and related dementia subphenotypes using electronic health records. Learning Health Systems 4, 4 (2020), e10246.
- Zanetti et al. (2006) Mariella Zanetti, Claudia Ballabio, Carlo Abbate, Chiara Cutaia, Carlo Vergani, and Luigi Bergamaschini. 2006. Mild cognitive impairment subtypes and vascular dementia in community-dwelling elderly people: a 3-year follow-up study. Journal of the American Geriatrics Society 54, 4 (2006), 580–586.
- Zhou and Saghapour (2021) Yi-Hui Zhou and Ehsan Saghapour. 2021. ImputEHR: a visualization tool of imputation for the prediction of biomedical data. Frontiers in Genetics 12 (2021).