The Donor of the Black-Hole X-Ray Binary MAXI J1820+070
Abstract
We estimate the parameters of the donor of the accreting black-hole binary MAXI J1820+070. The measured values of the binary period, rotational and radial velocities and constraints on the orbital inclination imply the donor is a subgiant with the mass of and the radius of . We re-analyze the previously obtained optical spectrum from the Gran Telescopio Canarias, and found it yields a strict lower limit on the effective temperature of K. We compile optical and infrared fluxes observed during the quiescence of this system. From the minima and -band fluxes found in Pan-STARSS1 Data Release 2 pre-discovery imaging and for a distance of kpc, reddening of – and , we find K, very close to the above lower limit. For a larger distance, the temperature can be higher, up to about 4500 K (corresponding to a K5 spectral type, preferred by previous studies) at kpc, allowed by the Gaia parallax. We perform evolutionary calculations for the binary system and compare them to the observational constraints. Our model fitting the above temperature and radius constraints at kpc has the mass of , K and solar metallicity. Two alternative models require –3.4 kpc at , K and half solar metallicity, and , K and solar metallicity. These models yield mass transfer rates of /yr, compatible with those based on the estimated accreted mass of g and the time between the 2018 discovery and the 1934 historical outburst.
1 Introduction
The outburst of the transient accreting low-mass X-ray binary (LMXB) MAXI J1820+070 was discovered on 2018-03-06 in the optical range with the -band magnitude of 14.88 (Tucker et al., 2018). It was detected in X-rays six days later (on 2018-03-11; Kawamuro et al. 2018). Given the high observed brightness and long duration of the outburst, it was the subject of a large number of observing campaigns, whose results have led to numerous insights into the nature of this source. Torres et al. (2019, 2020) have unambiguously determined that the accretor is a black hole (BH). However, the donor parameters have remained relatively loosely constrained (see Sections 2.1–2.3). More accurate determinations of the donor radius and temperature are important for modelling the emission of the accretion flow in the quiescent state of this system (Poutanen et al., 2022). Also, the metallicity of MAXI J1820+070 is of importance for calculation of the inner radius of the accretion disk during the outburst. On one hand, Buisson et al. (2019) found the Fe abundance to be higher than solar by a factor of 3–9 and the disk extending close to the innermost stable circular orbit from fitting reflection model spectra to X-ray data in the luminous hard state. On the other, fits by Zdziarski et al. (2021) obtained a fractional Fe abundance of 1.1–1.6 and a truncated disk. However, Fe abundances from spectral fits are subject to significant systematic errors related to the effects of the assumed density of the reflector (García et al., 2018). Therefore, an independent estimate of the abundances of the donor would be highly valuable in constraining the results of X-ray spectroscopy.
In this work, we consider evolutionary models of the binary, with the goal of constraining better the mass and radius of the stellar companion as well as its spectral type and metallicity. In Section 2.1, we review available constraints on the distance and binary parameters, in Section 2.2, we compile available mid-infrared to ultraviolet photometric measurements, which constrain the radius and temperature of the donor, in Section 2.3, we consider its metallicity, in Section 2.4, we estimate the average mass accretion rate, and in Section 3, we perform the evolutionary calculations. Section 4 provides a summary of our results.
2 System parameters

2.1 The distance and binary parameters
MAXI J1820+070 is relatively nearby, with a distance of kpc measured based on a radio parallax (Atri et al., 2020). This agrees well with the current Gaia EDR3 parallax measurement of kpc (Bailer-Jones et al., 2021). Then, Wood et al. (2021) determined kpc based on the proper motion of two moving transient ejecta (Mirabel & Rodríguez, 1994) during the hard-to-soft state transition, assuming the approaching and receding ejecta were identical. The upper limit of kpc corresponds, however, to the minima of both angular velocities and to the bulk Lorentz factor of . The Lorentz factors of the transient ejecta measured in X-ray binaries are generally low, at most a few (Miller-Jones et al., 2006). In the present case, and 3.1 kpc correspond to rather large and 5.1, respectively. Therefore, the measurement by Wood et al. (2021) appears to imply kpc for realistic ejecta Lorentz factors.
The binary orbital period is d (Torres et al., 2019) and the inclination of the binary is constrained at to – (Torres et al., 2020). While the latter is consistent with the inclination of the jet, (Atri et al., 2020; Wood et al., 2021), the jet and binary axes have been estimated to be strongly misaligned (Poutanen et al., 2022), in which case the jet inclination cannot be used to constrain the system masses.
Torres et al. (2020) established the rotational line broadening of the companion of km s-1, which in combination of the radial velocity semi-amplitude ( km s-1) yields (assuming cororation and Roche-lobe filling) the mass ratio of , where and are the masses of the BH and its companion star. These uncertainties are 1-. Torres et al. (2020), following Marsh et al. (1994), obtained 2- limits of and by combining the 1- uncertainties in the measured orbital parameters with the extreme limits for the range of allowed inclinations. On the other hand, here we have performed Monte Carlo simulations assuming Gaussian distributions of and (which give via eq. 4 of Ziółkowski & Zdziarski 2017), , and a flat distribution of within the range given above. This gives us probablilistic estimates of and and the donor radius, []. The results are shown in Figure 1, and they imply , and , where we give the median and the 68% confidence ranges. Since the radii of main-sequence stars can be roughly approximated by , the above range of the donor radius implies that the donor is a moderately evolved star (a subgiant).
The donor average spectrum from observations by the Gran Telescopio Canarias (GTC) during the quiescence after the outburst was found to approximately match those of K3–5 V main-sequence templates (Torres et al., 2020). The effective temperatures of those stars are given by Pecaut & Mamajek (2013) as 4840–4450 K. We have, however, re-analyzed that spectrum and found a strict limit of K based on the lack of molecular bands (TiO and CN) expected at K. This limit approximately corresponds to a K6 stellar type, and we use it in our analyses below.
| Source | Band | m] | Jy] | Jy] | Dates | |
| PS1 | 0.963 | 1.33 | 2011-09-11, 2012-03-30 | |||
| PS1 | 0.868 | 1.40 | 2013-04-24 | |||
| PS1 | 0.755 | 1.55 | 2013-05-31 | |||
| PS1 | 0.622 | 1.77 | 2013-05-31, 2013-06-19 | |||
| PS1 | 0.487 | 2.15 | 2012-06-11, 2013-06-10 | |||
| ZTF | 0.622 | 1.77 | 2021-02-09 | |||
| ZTF | 0.487 | 2.15 | 2020-10-13 |
| Source | Band | m] | [Jy] | Jy] | Date | Reference | ||
|---|---|---|---|---|---|---|---|---|
| WISE | 4.6 | 3631 | 1.02 | 2010-01-14–2010-07-17 | Cutri et al. (2021) | |||
| WISE | 3.35 | 3631 | 1.04 | 2010-01-14–2010-07-17 | Cutri et al. (2021) | |||
| 2MASS | 2.22 | 655 | 1.08 | 1999-07-23 | Cutri et al. (2003) | |||
| 2MASS | 1.60 | 1150 | 1.13 | 1999-07-23 | Cutri et al. (2003) | |||
| 2MASS | 1.26 | 1580 | 1.20 | 1999-07-23 | Cutri et al. (2003) | |||
| GSC2.3.2 | 0.812 | 2681 | 1.46 | 1989–2000 | Lasker et al. (2008) | |||
| USNO-B1.0 | 0.658 | 3247 | 1.71 | 1949–1965 | Monet et al. (2003) | |||
| GSC2.3.2 | 0.658 | 3247 | 1.71 | 1987–1999 | Lasker et al. (2008) | |||
| GTC | 0.623 | 3631 | 1.77 | 2019-06-08–2019-08-07 | Torres et al. (2019, 2020) | |||
| USNO-B1.0 | 0.442 | 4067 | 2.37 | 1949–1965 | Monet et al. (2003) | |||
| GSC2.3.2 | 0.442 | 4067 | 2.37 | 1987–2000 | Lasker et al. (2008) |
| Hz] | |||||||||
|---|---|---|---|---|---|---|---|---|---|
| Jy] | |||||||||
| 5.39 | 7.65 | 4.28 | 2.92 | 2.27 | 1.84 | 1.62 | 1.34 | 1.12 |
2.2 Photometric properties
We have compiled available ultraviolet to mid-infrared measurements of the binary during its quiescence from literature and public databases. These are listed in Tables 1 to 3, which also provide references to the photometric databases that were explored. In order to constrain the spectral distribution of the donor star, the collected fluxes need to be corrected for interstellar extinction. The total reddening through the Galaxy in the direction of the source has been estimated by Schlafly & Finkbeiner (2011) as – and as – by Schlegel et al. (1998). Since the source is located 0.5 kpc above the Galactic disk (see Section 2.3), the extinction toward it is likely to equal the total one in the direction of the target. We can also use the relationship between the extinction in the -band () and the H column density () estimated from fitting X-ray data (Güver & Özel, 2009), . Here is given by . The values of obtained from fitting XMM-Newton (Kajava et al., 2019), NICER (Bharali et al., 2019) and the X-Ray Telescope (Burrows et al., 2000) onboard of Neil Gehrels Swift (Wang et al., 2021) data for MAXI J1820+070 are , , cm-2, respectively. These values correspond (including the uncertainty of the conversion) to the range of ––0.26. To calculate the extinction at other wavelengths, , we used and the fitting formulae of Cardelli et al. (1989). Then, the observed magnitudes, , can be transformed into the the observed, , and unabsorbed, , fluxes, as
| (1) | ||||
| (2) |
where is the flux corresponding to a zero magnitude.
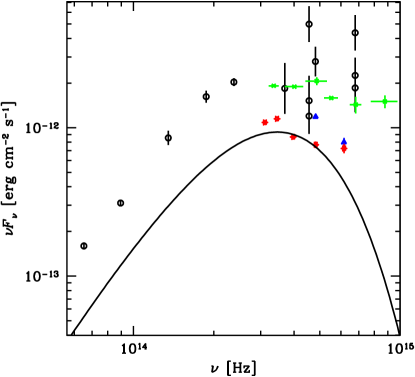
We first consider spectral data from Pan-STARSS1111https://catalogs.mast.stsci.edu/panstarrs/ Data Release 2 (PS1 DR2), which give measurements in the , , , and bands for years previous to the outburst. We have searched for the overall minimum fluxes in each photometric band, using the psfFlux and psfFluxErr values in the Detection Table provided in PS1 DR2. Those fluxes were obtained using an automated pipeline; thus single detections at the faint end may be not real, but arise from a systematic noise (Chambers et al., 2016), and be indistinguishable from real detections. In order to avoid them, we have applied a stringent selection criterion. Namely, we used only double detections from subsequent exposures separated by 0.5 h and with the fluxes differing by 25%. The results are given in Table 1 and plotted in red in Figure 2 after correcting for the extinction assuming –. For comparison, Table 1 also gives the average fluxes from the DR2 stacked images, which are significantly higher than the minimum fluxes in the , and bands.
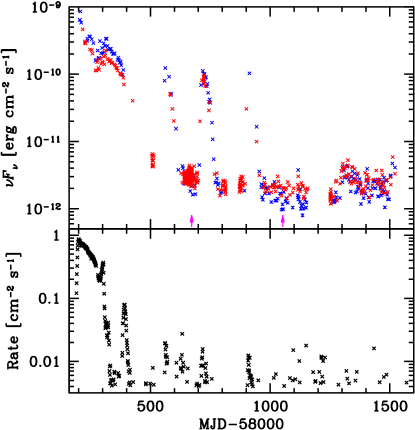
Next, we have obtained the and light curves observed by the Zwicky Transient Facility222https://irsa.ipac.caltech.edu/docs/program_interface/ztf_lightcurve_api.html (ZTF; Bellm et al. 2019), covering the discovery outburst and subsequent decay up to 2021 August. They are shown in Figure 3. We see that several mini-outbursts or reflares occurred after the end of the main outburst event, with the last major reflare in 2020 April. For comparison, we also show the hard X-ray light curve333https://swift.gsfc.nasa.gov/results/transients/weak/MAXIJ1820p070/ from the Burst Alert Facility (Barthelmy et al. 2005; BAT) onboard of Neil Gehrels Swift. We see that the optical reflares have been accompanied by X-ray activity. From the ZTF light curves, we have obtained the weakest fluxes measured in each filter, which are given in Table 1 and are plotted in blue symbols in Figure 2.
Then, we have compiled some other available optical and infrared measurements of MAXI J1820+070 during quiescence. We list them in Table 2 and plot in Figure 2 with black error bars. Table 2 also gives the values of . Most of the fluxes are higher than the minima from PS1. In particular, we analyzed the observations made during the states near quiescence in the band (of the SDSS photometric system) reported in Torres et al. (2019, 2020). After calibrating the photometry of MAXI J1820+070 against the PSF mean magnitude of a non-variable star in the field, the range of those magnitudes is –, and its midpoint is . Finally, we plot the average optical and UV fluxes obtained by Poutanen et al. (2022), see Table 3. The arrows in Figure 3 indicate the middle times of the observations of Torres et al. (2019, 2020) and of Poutanen et al. (2022).
The PS1 DR2 minimum fluxes shown in Figure 2 constrain the stellar contribution, which we approximate as a blackbody, , where is the blackbody intensity and is the effective temperature. The most restrictive measurement is that in the band, for which we take its upper limit (Table 1) and assume –. We have found that the blackbody relationship for this monochromatic flux can be locally approximated as a power law of . The constraint, together with the temperature limit from our analysis of the average spectrum of Torres et al. (2019, 2020), can be written as
| (3) | ||||
| (4) |
where Equation (3) is scaled to the lower limit on the stellar radius, see Section 2.1. Here the constant accounts for the accretion disk being expected to be present at some level during the entire quiescence (see, e.g., the models of Dubus et al. 2001), in which case . On the other hand, the flux measurements may be affected by ellipsoidal variability, whose full amplitude we estimate as 0.2 mag, i.e., less than with respect the average flux. This estimate is based on the ellipsoidal variability of the BH LMXB A0620–00, which has the mass ratio (Marsh et al., 1994) and (Haswell et al., 1993), consistent within the uncertainties with those of MAXI J1820+070. The full amplitude of the ellipsoidal variability of A0620–00 was measured by Marsh et al. (1994) as 0.13 mag. They also performed detailed simulations of this effect for a range of the inclinations, and their table 4 gives the theoretical range of 0.15–0.18 mag at . Given the relative weakness of this effect, we neglect it. We also set . The fiducial distance of 3 kpc and the minimum correspond to K. We plot a blackbody spectrum at K in the solid black curve in Figure 2. This spectrum gives a 26% contribution [at –] to the average flux in the band of Torres et al. (2019, 2020). This is moderately higher than the stellar contribution of 16–21% estimated by them.
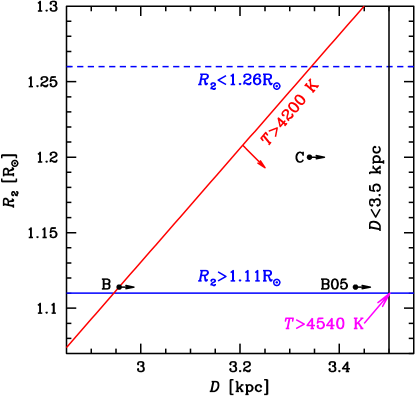
Equations (3–4) for imply a kpc, in agreement with all the constraints on listed in Section 2.1. On the other hand, these equations do not constrain from above. We take here kpc from the Gaia parallax as a tentative conservative upper limit. While the limit of Wood et al. (2021) is stringent at face value, it relies on the two ejecta being exactly symmetric, which may not be the case, and 3.5 kpc is within the uncertainty of the radio parallax, see Section 2.1. We plot the resulting joint constraints on and in Figure 4. At kpc and , we have the maximum K, corresponding to a K5 stellar type. This satisfies the original constraint of Torres et al. (2020). We note that the above constraints favor low donor radii if kpc. At kpc and K, . Note that the above constraints can still be relaxed if there are some systematic error on the minimum PS1 fluxes, present in spite of our strict selection procedure.
2.3 Metallicity
MAXI J1820+070 appears to be a relatively old system and thus may have come from an environment with a subsolar metallicity. Its position in the Cartesian coordinates () centered on the Sun and the velocities calculated from the coordinated proper motion, mas/yr and mas/yr (Gaia EDR3, Gaia Collaboration et al. 2021), the systemic velocity of km/s (Torres et al., 2019) and the adopted distance of kpc, are
| (5) | |||
where are velocities along the same axes, with positive towards the Galactic center, positive in the direction of the Sun motion around the Galaxy, and positive out of the plane of the Galaxy. MAXI J1820+070 is thus located in the thick Galactic disk as indicated by its distance from the Galactic plane, kpc, and a high peculiar velocity, km/s, moving almost parallel to the Galactic plane. The Galactic velocities also locate it among the extended thick-disk population objects in Toomre diagram (e.g. fig. 1 in Feltzing et al. 2003). The Galactocentric distance of MAXI J1820+070 is 5.9 kpc, which locates it in the inner Galactic disk, where the average value of the metallicity is (e.g. Bensby et al. 2011). The subsolar metallicity of the donor is further supported by relatively strong Ca I and Ti I absorption lines compared to Fe I lines in the spectrum presented in fig. 3 of (Torres et al., 2019), similar to other thick disk objects (e.g. Feltzing et al. 2003).
We also note that high peculiar velocities of BH LMXBs are often attributed to a BH natal kick velocity, see, e.g. Atri et al. (2019). That study included MAXI J1820+070 and three other systems with no known (at that time) systemic velocities and accurate distances, using instead a hypothetical kick velocity distribution modelled by Monte Carlo simulations. Based on them, they tentatively preferred the natal kick origin of the peculiar velocity in MAXI J1820+070. Still, they also note that most LMXBs are relatively old systems, and thus may have come from low metallicity environments like globular clusters.
On the other hand, metallicities higher than solar were found in a number of donor stars in LMXBs (see review in Casares et al. 2017). Still, this does not appear to be universal. One example is the binary V934 Her/4U 1700+24 consisting of a red giant accreting on a neutron star. Detailed photospheric abundance analysis for this system resulted in a slightly subsolar metallicity, and (where represents the average of the Mg, Si, and Ca elements), and the versus [Fe/H] relation close to the mean one without any notable peculiarity to this object (Hinkle et al., 2019). Similar -element and Fe abundances were found in many symbiotic giants with white dwarf companions (Gałan et al., 2016, 2017).
2.4 Average mass transfer rate
The bolometric flux of the source varied within only a factor of 2–3 during most of the 2018 discovery outburst, i.e., 200 d, see, e.g., Shidatsu et al. (2019), Fabian et al. (2020), namely within – erg cm-2 s-1. In order to estimate the total fluence of that outburst, we adopt the flux of erg cm-2 s-1 during 200 d. Assuming kpc and the accretion efficiency of , we obtain the accreted mass of g. However, given the uncertainties on the fluence, distance and accretion efficiency, the uncertainty of this mass is probably by a factor of two.
After the 2018 discovery outburst, two historical outbursts in 1898 and 1934 were discovered by examining publicly available photographic plates (Kojiguchi et al., 2019). Based on these data, the typical interval between outbursts of this source was estimated by those authors as 40 yr. This implies that the outburst within 1970–1980 was missed by observers of the period. However, intervals between outbursts of BH LMXBs are often unequal, and it is also possible that there was no outburst since 1934, giving the interval from the previous outburst of 84 yr. If we assume that the mass accreted onto the BH in 2018 equals to that transferred from the donor during the interval since the previous outburst (which theoretical assumption is clearly uncertain), the average mass transfer rate is /yr, with an uncertainty, which we estimate to be by a factor of two. Alternatively, the estimate of would increase to /yr if the actual interval between outbursts was 40 yr.
3 The evolutionary status
We use the Warsaw stellar evolution code of Paczyński (1969, 1970) described in Pamyatnykh et al. (1998) and Ziółkowski (2005). Our version of the code is calibrated to yield the H mass fraction of , the metallicity of (we use here the symbols and in a different meaning than in Section 2.3), and the mixing length parameter of 1.55 for the Sun at the solar age. The method of the evolutionary calculations in this work follow those used in Ziółkowski & Zdziarski (2017, 2018) and Zdziarski et al. (2019). We refer the reader to Zdziarski et al. (2019) for details of the method.
| Model | ||||||
|---|---|---|---|---|---|---|
| A | 0.3 | 1.012 | 0.278 | 4169 | 0.070 | 0.43 |
| A2 | 0.3 | 1.012 | 0.219 | 3924 | 0.290 | 0.155 |
| B05 | 0.4 | 1.114 | 0.452 | 4492 | 0.050 | 1.0 |
| B | 0.4 | 1.114 | 0.347 | 4200 | 0.065 | 0.68 |
| B2 | 0.4 | 1.114 | 0.273 | 3948 | 0.084 | 0.27 |
| C05 | 0.5 | 1.200 | 0.587 | 4621 | 0.042 | 1.3 |
| C | 0.5 | 1.200 | 0.437 | 4289 | 0.060 | 0.91 |
| D | 0.6 | 1.275 | 0.560 | 4430 | 0.051 | 1.1 |
| D2 | 0.6 | 1.275 | 0.414 | 4102 | 0.130 | 0.49 |
| E | 0.7 | 1.343 | 0.749 | 4643 | 0.034 | 1.25 |
| F | 0.8 | 1.404 | 1.019 | 4903 | 0.003 | 1.55 |
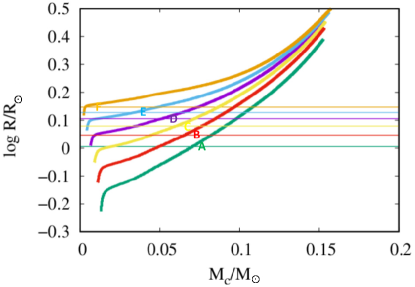
We have first followed the evolution in the core mass–stellar radius plane of partially stripped stars for total masses of , 0.4, 0.5, 0.6, 0.7 and and at the solar metallicity. The results are shown in Figure 5 and Table 4, where these models are denoted by letters A, B, C, D, E and F, respectively. In Figure 5, the evolution proceeds from left to right at the constant . The evolutionary engine lies in the hydrogen burning shell, which adds newly synthesized helium to the core, increasing its mass. The horizontal thin lines with the corresponding colors (from bottom to top) show the radii of the Roche lobe around the donor for the above values of , and . The crossings of the corresponding evolutionary tracks and horizontal lines determine the positions of our donor models. The relatively small core masses of those models confirm that the donor is in an early subgiant phase, with the radius only a factor of about two larger than a main-sequence star of the same mass (as noticed in Section 2.1). Given that the donor metallicity is relatively uncertain (Section 2.3), we also calculated some models for a metallicity of half solar, (B05 and C05), and twice solar, , (A2, B2 and D2), whose results are also given in Table 4. The seen anticorrelation of the metallicity and temperature in our evolutionary models is a well-known effect, resulting from an increase of the opacities with the metallicity, present also in main sequence stars.
The assumed BH mass, , influences only one model parameter, namely the rate of the mass transfer, . However, this effect is rather weak. For models A and F, changing to and , respectively (to keep the mass ratio equal 0.072), would change from 4.3 to /yr, and from 1.55 to /yr, respectively.
We compare now the models of Table 4 with the Monte Carlo constraints obtained in Section 2.1 and other constraints obtained in Sections 2.2, 2.3 and 2.4. As shown based on the fluxes measured before the outburst (Section 2.2), an approximate maximal stellar blackbody contribution at kpc has K and . This closely corresponds to our model B, which support an approximate solar metallicity of the donor. If we still impose the spectral type to be within K5–K3 (which requires kpc), the temperature has to be larger, which approximately corresponds to our model B05 with K. This model has half-solar metallicity, which agrees with the finding of Section 2.3 that MAXI J1820+070 is likely to belong to extended Galactic thick disk population. On the other hand, it is in tension with the X-ray spectral fitting of Zdziarski et al. (2021), which favor the metallicity to be at least solar. Our model C, with and , also satisfies our constraints, yielding K and kpc. These three models are shown in the – parameter space in Figure 4. We see that the constraints shown on Figure 4 allow the metallicity to be only slightly above solar. On the other hand, our models with metallicity twice solar, A2, B2 and D2, have the temperatures of 3924 K–4102 K, which are below our strict lower limit of 4200 K.
The calculated mass-loss rate for model B05 is /yr, which agrees well with that estimated in Section 2.4 of /yr with an uncertainty by a factor of two. For model B, is only slightly lower.
The above agreement implies that the mass loss rate approximately equals the accretion rate averaged over the interval since the previous outburst, , i.e., the mass transfer is conservative. However, this assumption is uncertain, with outflows and not full exhaustion of the disk during outburst being possible. Indeed, mass loss from a disk wind in MAXI J1820+070 was found by Muñoz-Darias et al. (2019). This motivates us to consider also models with non-conservative mass transfer. We note that taking this effect into account does not change the model parameters of the donor. It only increases the model values of . We consider here non-conservative mass transfer for model B05, following the approach of Ziółkowski & Zdziarski (2018). Such transfer is described by two parameters, and . As in Ziółkowski & Zdziarski (2018), we define as the specific angular momentum of the mass leaving the system in units of the specific angular momentum of the donor measured from the center of mass (Verbunt, 1993), with (as discussed, e.g., in Ziółkowski & Zdziarski 2018). The parameter is defined as the fraction of the mass lost by the donor that is accreted onto the accretor (Rappaport et al., 1982), i.e., .
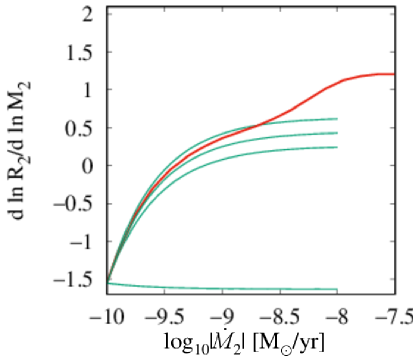
We assume yr-1. The results are shown in Fig. 6. We compare here the rates of the Roche-lobe change for , 1, 1.1 and 1.2 with the rate implied by our evolutionary model as a function of . Apart from the conservative solution (), a non-conservative solution is possible for and . A caveat for it is its relatively large , requiring the outflow to occur far from the BH, around the disk tidal radius (see fig. 1 of Ziółkowski & Zdziarski 2018). Thus, the simplest and most likely solution remains the conservative case.
4 Summary
We have used the 1- deviations for the binary parameters of MAXI J1820+070 and a uniform distribution in for the range of inclinations given in Torres et al. (2020) to calculate the donor star mass and radius. We obtain 68% confidence values of and (as well as for the BH mass).
We have compiled available optical and infrared measurements of MAXI J1820+070 in quiescence, which constrain the spectrum of the donor. The strongest constraint is given by the minimum fluxes from PS1 DR2 in the and bands, which gives the maximum allowed blackbody temperature of K at the lower limit on the donor radius allowed by the binary parameters (), kpc and –. This is at our lower limit of the temperature compatible with the average GTC spectrum of K, and it is less than those implied by the original classification of the stellar type of the donor within the range of K3–5 (Torres et al., 2020). Requiring the latter can be reconciled with our constraints if kpc, yielding K, of a K5 stellar type. The distance of kpc is allowed by the Gaia parallax, but it is larger than those obtained from the radio parallax and the moving ejecta method.
We then considered the source location in the Galaxy and peculiar velocity, which indicate MAXI J1820+070 belongs to the extended thick-disk population. That population is characterized by the metallicity less than solar. We also estimated the fluence during the 2018 outburst. Using the time elapsed since the previous detected outburst of the system, we evaluate the average mass accretion rate (equal to the average transfer rate for conservative accretion) of /yr.
We finally considered a range of stellar evolutionary models that may correspond to MAXI J1820+070. Our model B (see Table 4) approximates the above constraints at the limiting K, the donor mass of and the solar metallicity (which approximately agrees with the X-ray spectral fitting results of Zdziarski et al. 2021) and requires kpc. An alternative at kpc is our model C with K. Another possibility at kpc is our model B05, with K and the metallicity half solar, which, in turn, agrees with the location of the source in the Galaxy. Thus, we cannot unambiguously constrain the donor metallicity. Still, we find models with the metallicity twice solar to be ruled out.
We also considered evolutionary models with non-conservative accretion. However, we have found they require an unrealistically large specific angular momentum of the mass leaving the system.
Acknowledgments
We thank Juri Poutanen for providing us with their average optical-ultraviolet spectrum of MAXI J1820+070, and the referee for valuable suggestions. We acknowledge support from the Polish National Science Centre under the grants 2015/18/A/ST9/00746, 2019/35/B/ST9/03944 and 2017/27/B/ST9/01940. AAZ acknowledges support from the International Space Science Institute (Bern). MAPT and JCV have been supported by the Spanish MINECO under grant AYA2017-83216-P and PID2020-120323GB-I00. MAPT acknowledge support via a Ramón y Cajal Fellowship RYC-2015-17854.
References
- Atri et al. (2019) Atri, P., Miller-Jones, J. C. A., Bahramian, A., et al. 2019, MNRAS, 489, 3116, doi: 10.1093/mnras/stz2335
- Atri et al. (2020) —. 2020, MNRAS, 493, L81, doi: 10.1093/mnrasl/slaa010
- Bailer-Jones et al. (2021) Bailer-Jones, C. A. L., Rybizki, J., Fouesneau, M., Demleitner, M., & Andrae, R. 2021, AJ, 161, 147, doi: 10.3847/1538-3881/abd806
- Barthelmy et al. (2005) Barthelmy, S. D., Barbier, L. M., Cummings, J. R., et al. 2005, Space Sci. Rev., 120, 143, doi: 10.1007/s11214-005-5096-3
- Bellm et al. (2019) Bellm, E. C., Kulkarni, S. R., Graham, M. J., et al. 2019, PASP, 131, 018002, doi: 10.1088/1538-3873/aaecbe
- Bensby et al. (2011) Bensby, T., Alves-Brito, A., Oey, M. S., Yong, D., & Meléndez, J. 2011, ApJ, 735, L46, doi: 10.1088/2041-8205/735/2/L46
- Bharali et al. (2019) Bharali, P., Chauhan, J., & Boruah, K. 2019, MNRAS, 487, 5946, doi: 10.1093/mnras/stz1686
- Buisson et al. (2019) Buisson, D. J. K., Fabian, A. C., Barret, D., et al. 2019, MNRAS, 490, 1350, doi: 10.1093/mnras/stz2681
- Burrows et al. (2000) Burrows, D. N., Hill, J. E., Nousek, J. A., et al. 2000, Proc. SPIE, 4140, 414064, doi: 10.1117/12.409158
- Cardelli et al. (1989) Cardelli, J. A., Clayton, G. C., & Mathis, J. S. 1989, ApJ, 345, 245, doi: 10.1086/167900
- Casares et al. (2017) Casares, J., Jonker, P. G., & Israelian, G. 2017, in X-Ray Binaries, ed. A. W. Alsabti & P. Murdin (Springer), 1499–1526, doi: 10.1007/978-3-319-21846-5_111
- Chambers et al. (2016) Chambers, K. C., Magnier, E. A., Metcalfe, N., et al. 2016, arXiv e-prints, arXiv:1612.05560. https://arxiv.org/abs/1612.05560
- Cutri et al. (2003) Cutri, R. M., Skrutskie, M. F., van Dyk, S., et al. 2003, VizieR Online Data Catalog, II/246
- Cutri et al. (2021) Cutri, R. M., Wright, E. L., Conrow, T., et al. 2021, VizieR Online Data Catalog, II/328
- Dubus et al. (2001) Dubus, G., Hameury, J.-M., & Lasota, J.-P. 2001, A&A, 373, 251, doi: 10.1051/0004-6361:20010632
- Fabian et al. (2020) Fabian, A. C., Buisson, D. J., Kosec, P., et al. 2020, MNRAS, 493, 5389, doi: 10.1093/mnras/staa564
- Feltzing et al. (2003) Feltzing, S., Bensby, T., & Lundström, I. 2003, A&A, 397, L1, doi: 10.1051/0004-6361:20021661
- Gaia Collaboration et al. (2021) Gaia Collaboration, Brown, A. G. A., Vallenari, A., et al. 2021, A&A, 649, A1, doi: 10.1051/0004-6361/202039657
- Gałan et al. (2016) Gałan, C., Mikołajewska, J., Hinkle, K. H., & Joyce, R. R. 2016, MNRAS, 455, 1282, doi: 10.1093/mnras/stv2365
- Gałan et al. (2017) —. 2017, MNRAS, 466, 2194, doi: 10.1093/mnras/stw3266
- García et al. (2018) García, J. A., Kallman, T. R., Bautista, M., et al. 2018, in Astronomical Society of the Pacific Conference Series, Vol. 515, Workshop on Astrophysical Opacities, 282. https://arxiv.org/abs/1805.00581
- Güver & Özel (2009) Güver, T., & Özel, F. 2009, MNRAS, 400, 2050, doi: 10.1111/j.1365-2966.2009.15598.x
- Haswell et al. (1993) Haswell, C. A., Robinson, E. L., Horne, K., Stiening, R. F., & Abbott, T. M. C. 1993, ApJ, 411, 802, doi: 10.1086/172884
- Hinkle et al. (2019) Hinkle, K. H., Fekel, F. C., Joyce, R. R., et al. 2019, ApJ, 872, 43, doi: 10.3847/1538-4357/aafba5
- Kajava et al. (2019) Kajava, J. J. E., Motta, S. E., Sanna, A., et al. 2019, MNRAS, 488, L18, doi: 10.1093/mnrasl/slz089
- Kawamuro et al. (2018) Kawamuro, T., Negoro, H., Yoneyama, T., et al. 2018, Astron. Telegram, 11399, 1
- Kojiguchi et al. (2019) Kojiguchi, N., Kato, T., Isogai, K., & Nogami, D. 2019, The Astronomer’s Telegram, 13066, 1
- Lasker et al. (2008) Lasker, B. M., Lattanzi, M. G., McLean, B. J., et al. 2008, AJ, 136, 735, doi: 10.1088/0004-6256/136/2/735
- Marsh et al. (1994) Marsh, T. R., Robinson, E. L., & Wood, J. H. 1994, MNRAS, 266, 137, doi: 10.1093/mnras/266.1.137
- Miller-Jones et al. (2006) Miller-Jones, J. C. A., Fender, R. P., & Nakar, E. 2006, MNRAS, 367, 1432, doi: 10.1111/j.1365-2966.2006.10092.x
- Mirabel & Rodríguez (1994) Mirabel, I. F., & Rodríguez, L. F. 1994, Nature, 371, 46, doi: 10.1038/371046a0
- Monet et al. (2003) Monet, D. G., Levine, S. E., Canzian, B., et al. 2003, AJ, 125, 984, doi: 10.1086/345888
- Muñoz-Darias et al. (2019) Muñoz-Darias, T., Jiménez-Ibarra, F., Panizo-Espinar, G., et al. 2019, ApJ, 879, L4, doi: 10.3847/2041-8213/ab2768
- Paczyński (1969) Paczyński, B. 1969, Acta Astron., 19, 1
- Paczyński (1970) —. 1970, Acta Astron., 20, 47
- Pamyatnykh et al. (1998) Pamyatnykh, A. A., Dziembowski, W. A., Handler, G., & Pikall, H. 1998, A&A, 333, 141. https://arxiv.org/abs/astro-ph/9801264
- Pecaut & Mamajek (2013) Pecaut, M. J., & Mamajek, E. E. 2013, ApJS, 208, 9, doi: 10.1088/0067-0049/208/1/9
- Poutanen et al. (2022) Poutanen, J., Veledina, A., Berdyugin, A. V., et al. 2022, Science, 375, 874, doi: 10.1126/science.abl4679
- Rappaport et al. (1982) Rappaport, S., Joss, P. C., & Webbink, R. F. 1982, ApJ, 254, 616, doi: 10.1086/159772
- Schlafly & Finkbeiner (2011) Schlafly, E. F., & Finkbeiner, D. P. 2011, ApJ, 737, 103, doi: 10.1088/0004-637X/737/2/103
- Schlegel et al. (1998) Schlegel, D. J., Finkbeiner, D. P., & Davis, M. 1998, ApJ, 500, 525, doi: 10.1086/305772
- Shidatsu et al. (2019) Shidatsu, M., Nakahira, S., Murata, K. L., et al. 2019, ApJ, 874, 183, doi: 10.3847/1538-4357/ab09ff
- Straižys (1992) Straižys, V. 1992, Multicolor stellar photometry (Tucson: Pachart Pub. House)
- Torres et al. (2020) Torres, M. A. P., Casares, J., Jiménez-Ibarra, F., et al. 2020, ApJ, 893, L37, doi: 10.3847/2041-8213/ab863a
- Torres et al. (2019) —. 2019, ApJ, 882, L21, doi: 10.3847/2041-8213/ab39df
- Tucker et al. (2018) Tucker, M. A., Shappee, B. J., Holoien, T. W. S., et al. 2018, ApJ, 867, L9, doi: 10.3847/2041-8213/aae88a
- Verbunt (1993) Verbunt, F. 1993, ARA&A, 31, 93, doi: 10.1146/annurev.aa.31.090193.000521
- Wang et al. (2021) Wang, J., Mastroserio, G., Kara, E., et al. 2021, ApJ, 910, L3, doi: 10.3847/2041-8213/abec79
- Wood et al. (2021) Wood, C. M., Miller-Jones, J. C. A., Homan, J., et al. 2021, MNRAS, 505, 3393, doi: 10.1093/mnras/stab1479
- Zdziarski et al. (2021) Zdziarski, A. A., Dziełak, M. A., De Marco, B., Szanecki, M., & Niedźwiecki, A. 2021, ApJ, 909, L9, doi: 10.3847/2041-8213/abe7ef
- Zdziarski et al. (2019) Zdziarski, A. A., Ziółkowski, J., & Mikołajewska, J. 2019, MNRAS, 488, 1026, doi: 10.1093/mnras/stz1787
- Ziółkowski (2005) Ziółkowski, J. 2005, MNRAS, 358, 851, doi: 10.1111/j.1365-2966.2005.08796.x
- Ziółkowski & Zdziarski (2017) Ziółkowski, J., & Zdziarski, A. A. 2017, MNRAS, 469, 3315, doi: 10.1093/mnras/stx1084
- Ziółkowski & Zdziarski (2018) —. 2018, MNRAS, 480, 1580, doi: 10.1093/mnras/sty1948