NMR study of AgInTe2 at normal and high pressure
Abstract
The ternary semiconductor AgInTe2 is a thermoelectric material with chalcopyrite-type structure that transforms reversibly into a rocksalt-type structure under high pressure. Nuclear magnetic resonance (NMR) is considered to provide unique insight into material properties on interatomic length scales, especially in the context of structural phase transitions. Here, 115In and 125Te NMR is used to study AgInTe2 for ambient conditions and pressures up to . Magnetic field dependent and magic angle spinning (MAS) experiments of 125Te prove strongly enhanced internuclear couplings, as well as a distribution of isotropic chemical shifts suggesting a certain degree of cation disorder. The indirect nuclear coupling is smaller for 115In, as well as the chemical shift distribution in agreement with the crystal structure. The 115In NMR is further governed by a small quadrupolar interaction () and shows an orders of magnitude faster nuclear relaxation in comparison to that of 125Te. At a pressure of about , the 115In quadrupole interaction increases sharply to about , indicating a phase transition to a structure with a well defined, though non-cubic local symmetry, while the 115In shift suggests no significant changes of the electronic structure. The NMR signal is lost above about (at least up to about ). However, upon releasing the pressure a signal is recovered that points to the reported metastable ambient pressure phase with a high degree of disorder.
1 Introduction
The ternary chalcogenide AgInTe2 is of particular interest as a stoichiometric thermoelectric material for its ability to form solid solutions, e.g. AgInxSb1-xTe2,1 with a wide range of energy band gaps and lattice parameters.2, 3, 4 AgInTe2 is also known to undergo a structural phase transition from its 4-fold coordinated chalcopyrite-type crystal structure (, cf. Fig. 3a inset) at ambient conditions to a 6-fold coordinated NaCl-type structure (or possibly a slightly distorted varient thereof) with cation disorder between and .5, 6, 7, 8 Upon decompression, it has been reported to form a metastable sphalerite-type structure with cation disorder.6
Nuclear magnetic resonance (NMR) studies of this type of material are not known, although, they should provide insight into properties of the various phases from a local probe’s perspective. NMR studies of related compounds such as InP date back several years focusing on chemical properties like bonding character9, 10, 11 and nuclear exchange interactions 12, 13, 14, 15, 16, 17, 18 but do not include AgInTe2.
We became interested in this material because of the intriguing behavior under pressure, given our recent endeavor into high pressure NMR studies of solids with anvil cells that currently allow studies under up to about 10 GPa (100 kbar) of pressure.19, 20, 21 In order to obtain a high sensitivity with the associated small sample that fits the pressure cell, we use radio-frequency (RF) mircrocoils inside the pressurized region (for a description of the setup see also Fig. S2 of the Supplementary Information (SI)). In fact, a first application with AgInTe2 appeared to show an insulator-to-metal transition22 that we wanted to revisit.
Here we report on a more comprehensive 115In and 125Te NMR study of AgInTe2 at ambient and high pressure. With field dependent, MAS, and high pressure NMR we characterize both, chemical properties of the ambient condition phase as well as the structural phase transitions upon pressurization and subsequent pressure relief.
2 Methods
AgInTe2 was prepared by melting stoichiometric amounts of elements Ag (, Premion), In (), and Te (puriss., both from VEB Spurenmetalle Freiberg) in a sealed silica ampule under dry Ar atmosphere. After fusing the starting materials at , the ampule was quickly cooled in air, followed by annealing at . The ingots obtained showed gray metallic luster. For the NMR experiments a fine powder was used.
A powder X-ray diffraction pattern (cf. Fig. S1 in SI) of a representative part of the sample fixed on a specimen holder with Mylar foil was recorded using a Huber G670 Guinier diffractometer with fixed imaging-plate detector and automatic read-out system (Cu-Kα1 radiation, Ge(111) monochromator, ). It showed no impurity, and homogeneity was also confirmed by a Rietveld fit based on a chalcopyrite-type structure model.
NMR experiments were carried out at static magnetic fields of , , , , and , as well as with a variable field magnet of up to , using commercial Bruker or Tecmag NMR consoles. Home-built, cryogenic (5 to ), as well as commercial MAS probes (Bruker) with rotors were employed. The sample container and the radio frequency (RF) coil were individually optimized for the experiment to allow best excitation conditions and filling factors, except for MAS applications.
We investigated mainly the 115In nucleus, and obtained some results for 125Te. Single pulse excitation was used to measure the free induction decay (FID) for sufficiently narrow resonance lines or MAS experiments. Spin echo pulse sequences () were employed to measure broad spectra selectively, as well as transverse relaxation () with different pulse lengths and at different RF power levels. Solid echoes () were employed to excite broad spectra non-selectively. Saturation (FID/spin echo) and inversion (FID/spin echo) recovery pulse sequences were used to measure the spin-lattice relaxation ().
For 115In, the shift is referenced with respect to In(NO3)3, while for 125Te, the shift is referenced to Te(CH3)2 (determined by the secondary reference method and metallic copper23).
High Pressure Experiments:
Home-built titanium body anvil cells 19, 24 were used for high pressure experiments up to () of pressure (the signal was lost at higher pressure). RF microcoils with diameters between m and m using insulated silver wire (Goodfellow Cambridge Ltd) with a diameter of 25 m (5 m insulation) were placed inside the sample chamber (cf. SI). Small amounts of the powder sample were placed within the coil region together with ruby chips for pressure monitoring (optical R1 and R2 line luminescence after laser excitation 25). Typical quality factors (Q) of such cells range between 10 to 30 which corresponds to bandwidths of about 3.5 to for a 115In resonance frequency close to at .
3 Results
3.1 Ambient pressure
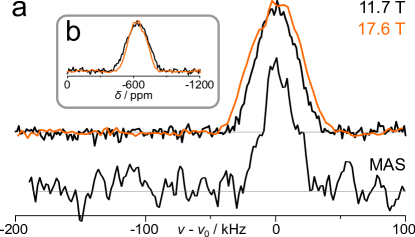
We show 125Te NMR spectra (spin 1/2, , abundance of about 7%) in Fig. 1. The observed chemical shift of points to Te2-,26 but we note a significant linewidth of about ( at ), which does not narrow under sample spinning. Furthermore, the resonance must have a significant field-independent contribution as the linewidth slightly decreases on the ppm scale by going to higher field, cf. Fig. 1b. The spin echo decay is rather fast and Gaussian at the beginning, with an approximate s (Fig. S3 in SI), while the spin-lattice relaxation time is found to be about .
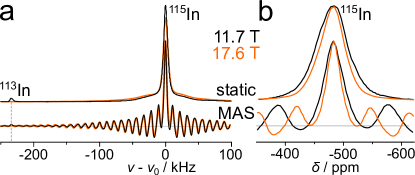
The 115In NMR spectra (spin 9/2, , abundance of about 95%) are shown in Fig. 2. The narrow, symmetric peak shows a chemical shift of about with a linewidth of only ( at ). The slight deviation of the local symmetry from a perfect cubic environment (cf. inset of Fig. 3a) results in a small quadrupole interaction leading to a narrow central transition and a broad resonance given by the orientation dependent satellite transitions of the powder. Such a satellite distribution is known to average very well under MAS as found in the experiment. The spin echo decay is about s, though, not a single exponential, and the spin-lattice relaxation is about a factor of faster () than that of Te, again pointing to the importance of quadrupole interaction for the 115In nucleus ().
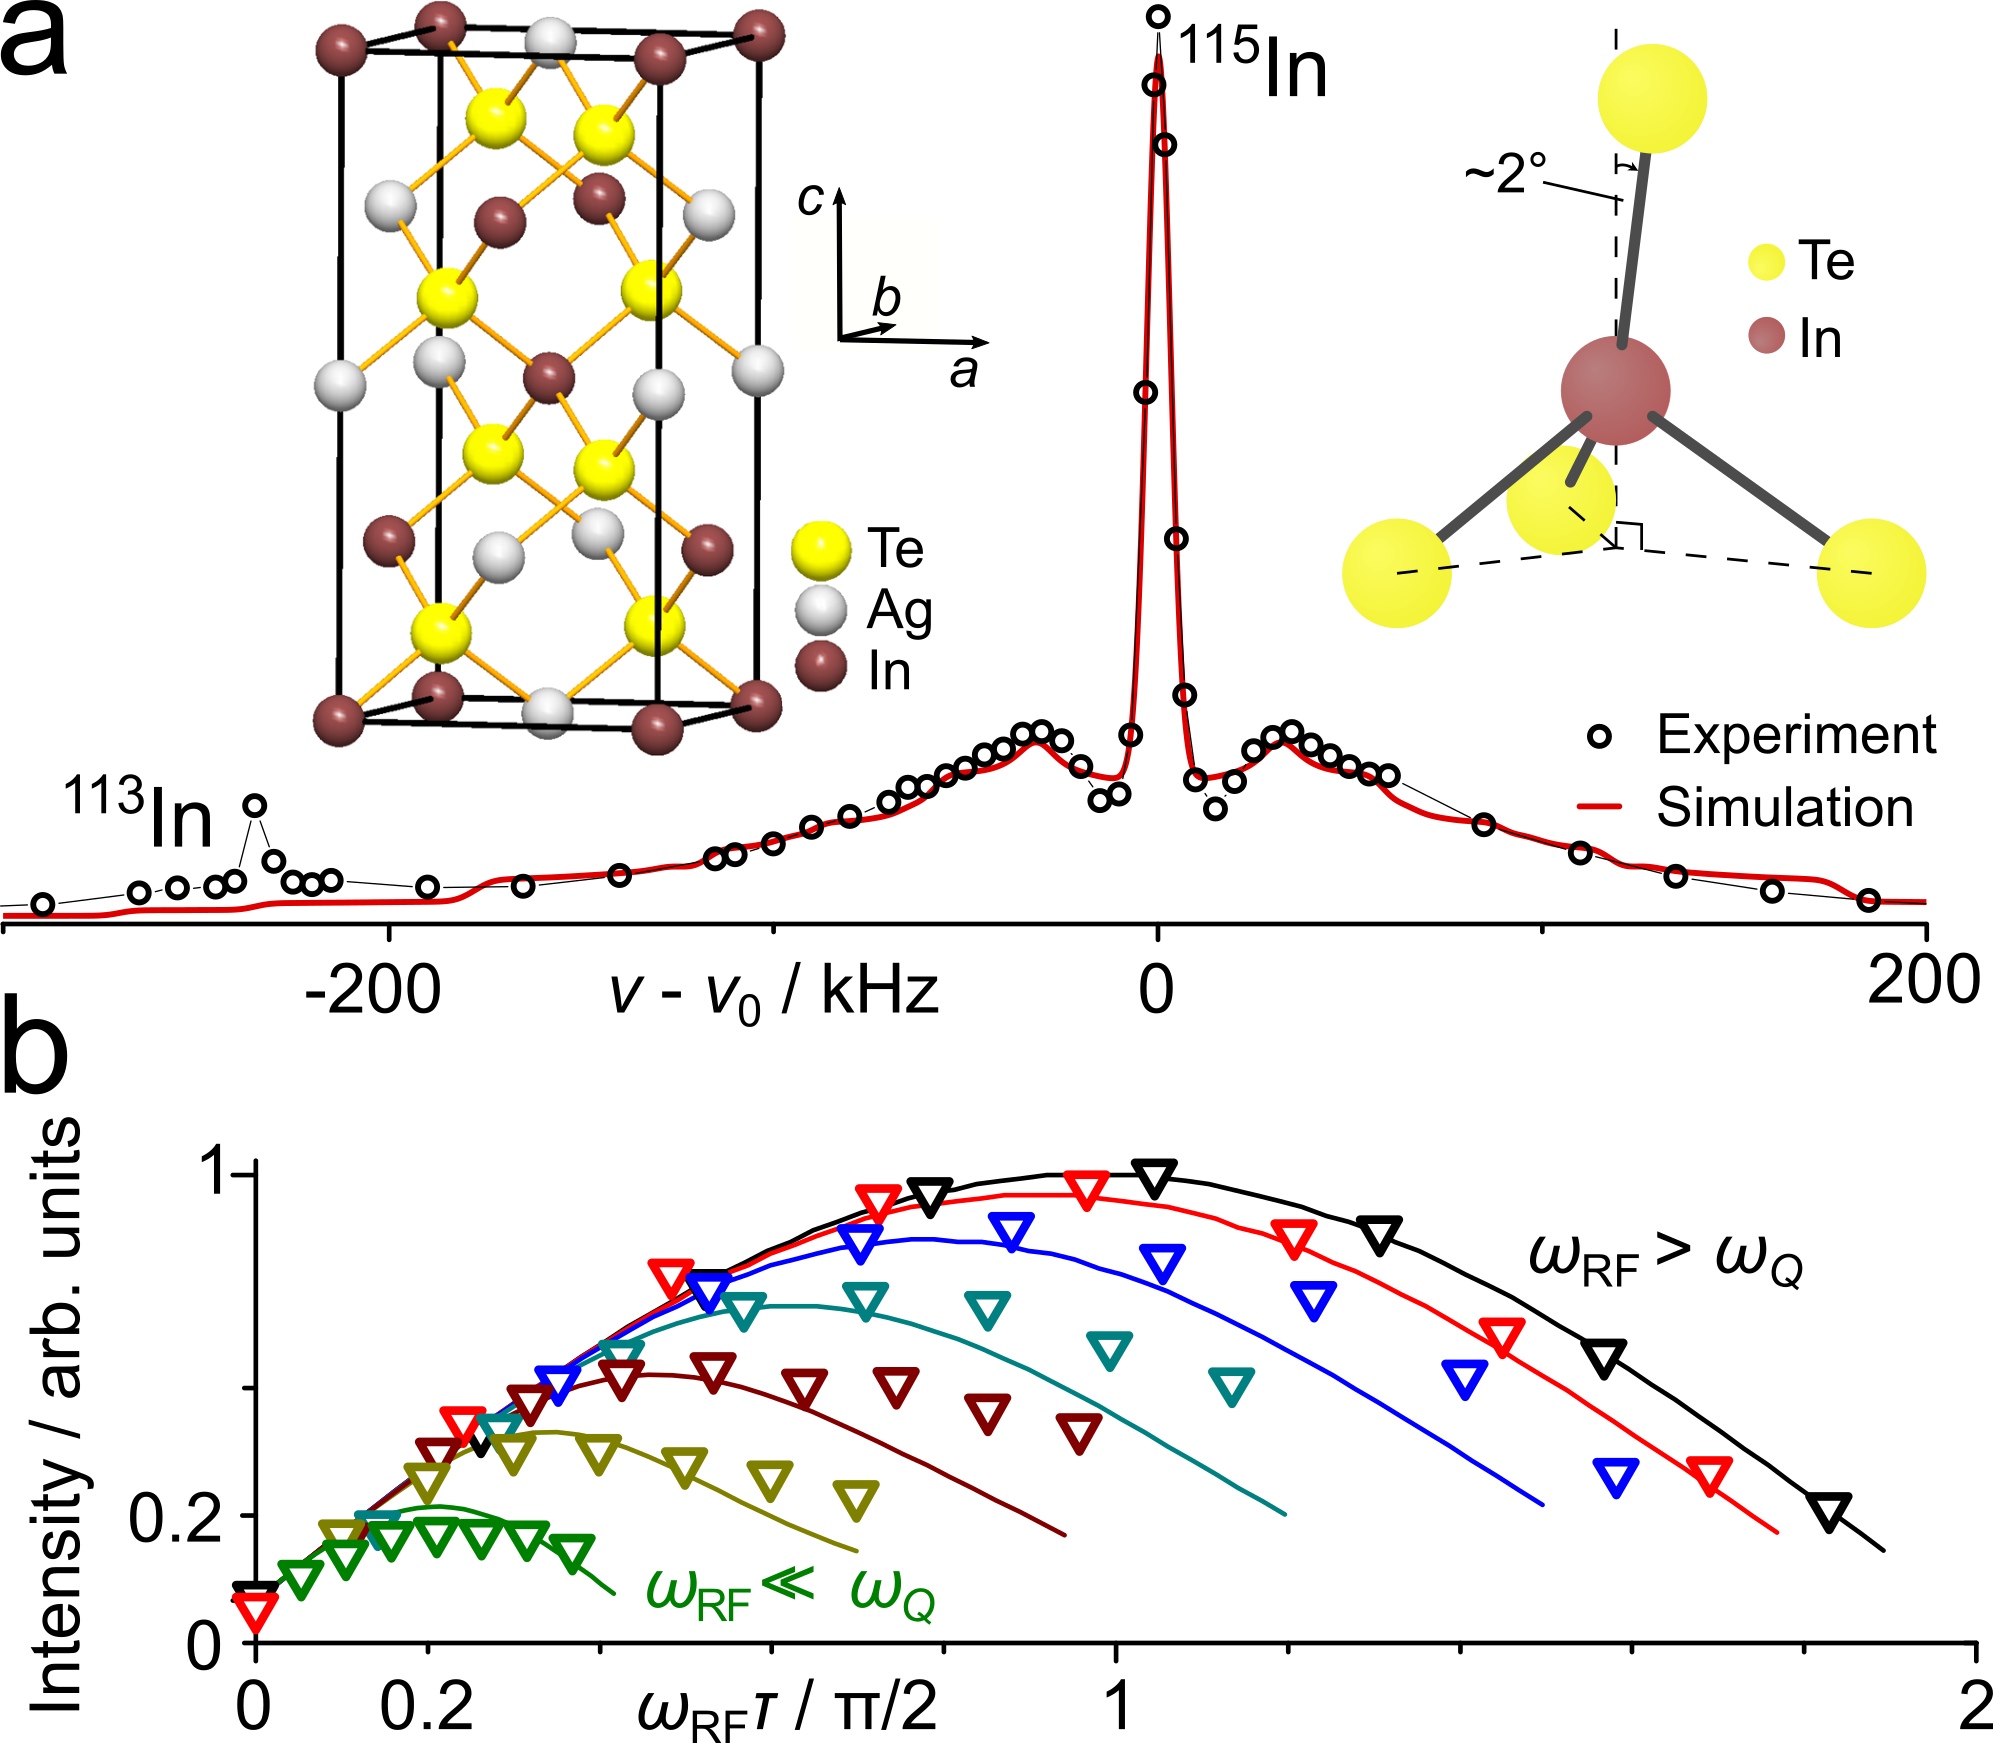
In order to better resolve the 115In NMR signal, we recorded the total spectrum with frequency stepped, selective spin echoes, as well as broad band quadrupole echoes.27 For the spin echoes we used a probe with a high Q, and long pulses (low power) were employed to ensure selective excitation. A typical spectrum is shown in Fig. 3a. While the broad peak is much better visible, it does not show singularities typical for powder spectra. Nevertheless, the shape of the broad line with a quite separate and narrow central transition points to a quadrupole tensor with some asymmetry. We can fit the total spectrum with a quadrupole first-order spectrum with , , and an additional broadening of . Nutation experiments measured of the central transition with a low-Q probe reveal that the broad line is indeed caused by the estimated quadrupole interaction.
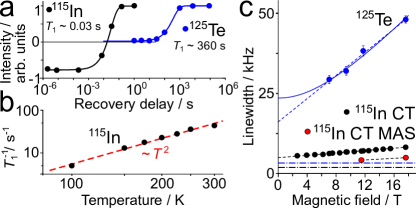
Finally, we show in Fig. 4 the results of 115In and 125Te relaxation measurements, including a temperature dependence of the 115In spin-lattice relaxation rate that verifies the interaction with phonons to be the main cause. Also shown are the field dependences of the linewidths of 115In and 125Te to determine possible field-independent contributions. The results are discussed below.
3.2 Elevated pressure
As described under Methods, NMR anvil cells with RF microcoils were used for these experiments. The very small coil volume and the inherently low Q of the coils warrant high time resolution, but also limit the signal-to-noise. Therefore, we only report on the 115In resonance, mostly recorded after non-selective quadrupole echo excitation.27 The results are summarized in Fig. 5.
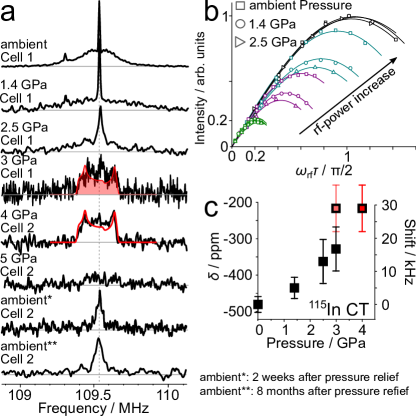
At ambient pressure (Fig. 5a) we obtain within error the same spectrum as in Fig. 3a. The change of shape of the broad foot as the pressure increases to and is due to an increase in the quadrupole frequency, which is proven with the nutation experiments shown in panel (b). At , the narrow signal is nearly lost, and replaced by a second-order central line quadrupole powder pattern (red shaded area), while some portion of the nuclear spins seem still to be subject to a smaller quadrupole interaction as they form the rather narrow peak in the middle of the spectrum. At , the second-order quadrupole spectrum is much better resolved. A fit with a and is shown (the same as used for the red shaded area in the spectrum). Unfortunately, above we lost the NMR signal. Then we released the pressure and measured again at ambient condition to find the spectra (solid echo FT) shown at the bottom in panel (a) (acquired about two weeks (∗) and eight months (∗∗) after decompression). We find a resonance line at the ambient pressure shift but with a much larger linewidth of about .
The chemical shift of the central transition as a function of pressure shows a significant increase (from to about ), but not such a sudden change as for the quadrupole interaction.
4 Discussion
4.1 Ambient pressure
The rather long 125Te (spin-1/2) spin-lattice relaxation time, , is perhaps expected for this semiconducting material with a sizable bandgap and shows that magnetic excitations are largely absent. The negative shift is expected for a Te2- ion, but the large 125Te NMR linewidth () points to disorder in the Te environment. A certain degree of disorder in the Ag and In distribution, which cannot be elucidated in a straightforward way by X-ray crystallography due to the lacking scattering contrast, is a likely explanation. For example, if Te has 3 In and 1 Ag as nearest neighbors (instead of 2 In and 2 Ag), the tetrahedral environment will be more strongly distorted, which likely affects more the isotropic shift. Four In or 4 Ag neighbors would result in different isotropic shifts. Therefore, such disorder, if abundant, should contribute to the linewidth. And since we detect roughly all 125Te nuclei, this would explain the observed shift variation and the rather Gaussian lineshape that does not narrow under MAS. For a more quantitative study, compounds with Ag3In and AgIn3 environments for Te would be desirable, as well as first principle calculations. The spin echo decay of 125Te is Gaussian at the beginning and is likely to be given by the 125Te - 125Te homonuclear interaction. The strong field independent linewidth (up to about , cf. Fig. 4c) points to a large internuclear coupling (-coupling) predominately between 125Te nulcei and their 115In neighbors, which can also contribute to the linewidth under MAS. Such enhanced internuclear interactions involving heavy element nuclei have also been reported for related semiconductors.12, 13, 14, 16, 15, 17, 18
The nuclear relaxation of 115In is about 4 orders of magnitude faster than that of 125Te. Since of the gyromagnetic ratios () cannot account for such a difference in , this points to a strong quadrupolar mechanism. The 115In temperature dependence shown in Fig. 3b (quadratic in temperature above half of the Debye temperature, 29) documents that Raman processes involving all phonons cause the observed behavior.30, 31 It might even be possible to relate the relaxation rate to the actual density of states of the phonons if one could compare with corresponding data on different systems. The observed quadrupole splitting due to the slightly distorted tetrahedral environment is not well resolved and the linewidths vary slightly between the frequency stepped spin echo data and the Fourier transform of quadrupole echoes (with long pulse delays to suppress the influence of Solomon echoes27). Also, one notices the absence of any singularities often found with powder patterns. This points to distributions of the tensor components of the electric field gradient, but given the mentioned uncertainties we did not attempt to pursue particular fits. We estimate a quadrupole frequency of about with an asymmetry parameter .
The 115In NMR line at about has a linewidth of about that narrows under MAS to about (). As Fig. 4c shows, the field dependent contributions to the 115In linewidth are much smaller than for 125Te. This is expected since all 115In neighbors are Te atoms, so that a somewhat random occupation of the cation sites is less important. Due to the low abundance of 125Te, the local field at 115In is mostly given by other In nuclei in the second shell (Ag has low- nuclei and does not contribute significantly). Therefore, the indirect coupling that contributes to the field independent linewidth (about ) is expected to be much weaker at 115In, as well. The spin echo decays can be found in the SI.
4.2 Pressure dependence
The dependence of the quadrupole coupling on pressure is interesting. After a moderate change of the quadrupole splitting up to about , a sudden increase at follows. Importantly, this phase has a rather well-defined second-order quadrupole pattern, pointing to a more or less well ordered structure. Certainly, this finding disagrees with a cubic NaCl structure that was discussed in the literature, because cation disorder (second coordination sphere) is not expected to yield such a strong and well defined deformation of the local charge distribution. Rather, our data point at a crystal structure with a non-cubic In environment. Based on the diffraction of synchrotron radiation of AgInTe2 for pressures up to , Bovornratanaraks et al. (2010) come to a similar conclusion.7 While they observe slight changes of the reflection patterns for low pressures and a gradual replacement of the ambient structure by the high pressure phase around to (in good agreement with our quadrupole data), the authors question the consensus of a NaCl-type high pressure structure in favor of a cation-disordered phase, although XRD data remain ambiguous. Here, NMR provides additional evidence from a local perspective for such a crystal structure with non-cubic 115In environment. Aided by first principles calculations, the quadrupole frequency and the asymmetry parameter as obtained from the second-order quadrupole fit may by used to assess the local In environment of the high pressure phase in greater detail. Finally, the rather moderate changes of the chemical shift of about by going form the chalcopyrite-type to the high pressure structure do not support significant changes in the electronic structure and thus, the occurrence of a metallic phase.
Unfortunately, we lost the signal above . With various pressure cells we searched for signal in a broad range of frequencies up to about since we expected a metallic phase.22 Measurements after pressure relief, however, prove a proper functioning of the anvil cells and the loss of signal must therefore have physical reasons. What caused the disappearance of the signal cannot be said with certainty as these measurements are difficult and time consuming. Possible reasons are further broadening of the NMR signal or an increase in relaxation time.
After we released the pressure from one of the cells, we obtained a spectrum governed by a single, rather narrow peak at the ambient pressure resonance frequency (cf. Fig. 5 (a), bottom spectrum), which has not noticeably changed after about 8 months under ambient conditions (the better signal-to-noise ratio of the second measurement is due to a greater number of averaged scans). The broadening of this resonance line (), however, is much larger in comparison to the initial linewidth for ambient pressure and the spectra may thus represent the metastable phase with zincblende-type structure (AgInTe2-III) and randomly distributed cations.5, 6
The high pressure NMR data prove that the various stages of the phase transitions in a material like AgInTe2 under the application of external pressure can clearly be distinguished, and using an optimized high pressure setup in combination with first principles calculations, structural as well as electronic properties could be studied with local resolution and high accuracy.
5 Conclusions
We investigated the 115In and 125Te NMR of powdered AgInTe2 at ambient and 115In NMR at high pressures. The 125Te linewidth, studied for various fields and under MAS, suggests strongly enhanced internuclear interactions, as well as a distribution of isotropic shifts, yielding a large field independent linewidth and weak narrowing under MAS. Both features hold for the 115In nuclei, though less pronounced, in agreement with a more symmetric local In environment. The internuclear coupling very likely causes the rather rapid and complex transverse relaxation phenomenology observed for both nuclei. Furthermore, 115In nuclei are subject to a small quadrupole interaction of about and feature a quadrupolar spin-lattice relaxation orders of magnitude faster compared to that of 125Te nuclei. With increasing pressure, the quadrupole interaction increases moderately at the beginning, but sharply around to about . This indicates a phase transition to a rather well ordered structure with lowered local symmetry, in agreement with literature data. The shift increases almost continuously from about to in the same pressure range, implying no significant electronic changes. Above about , the NMR signal is lost and could not be found up to about . Upon decompression, however, we recovered a resonance line with the same shift but a much bigger linewidth as the initial ambient spectrum. The line broadening may be due to the reported6 metastable sphalerite-type structure with random cation distribution.
6 Supporting Information
7 Powder X-ray diffraction and Rietveld refinement
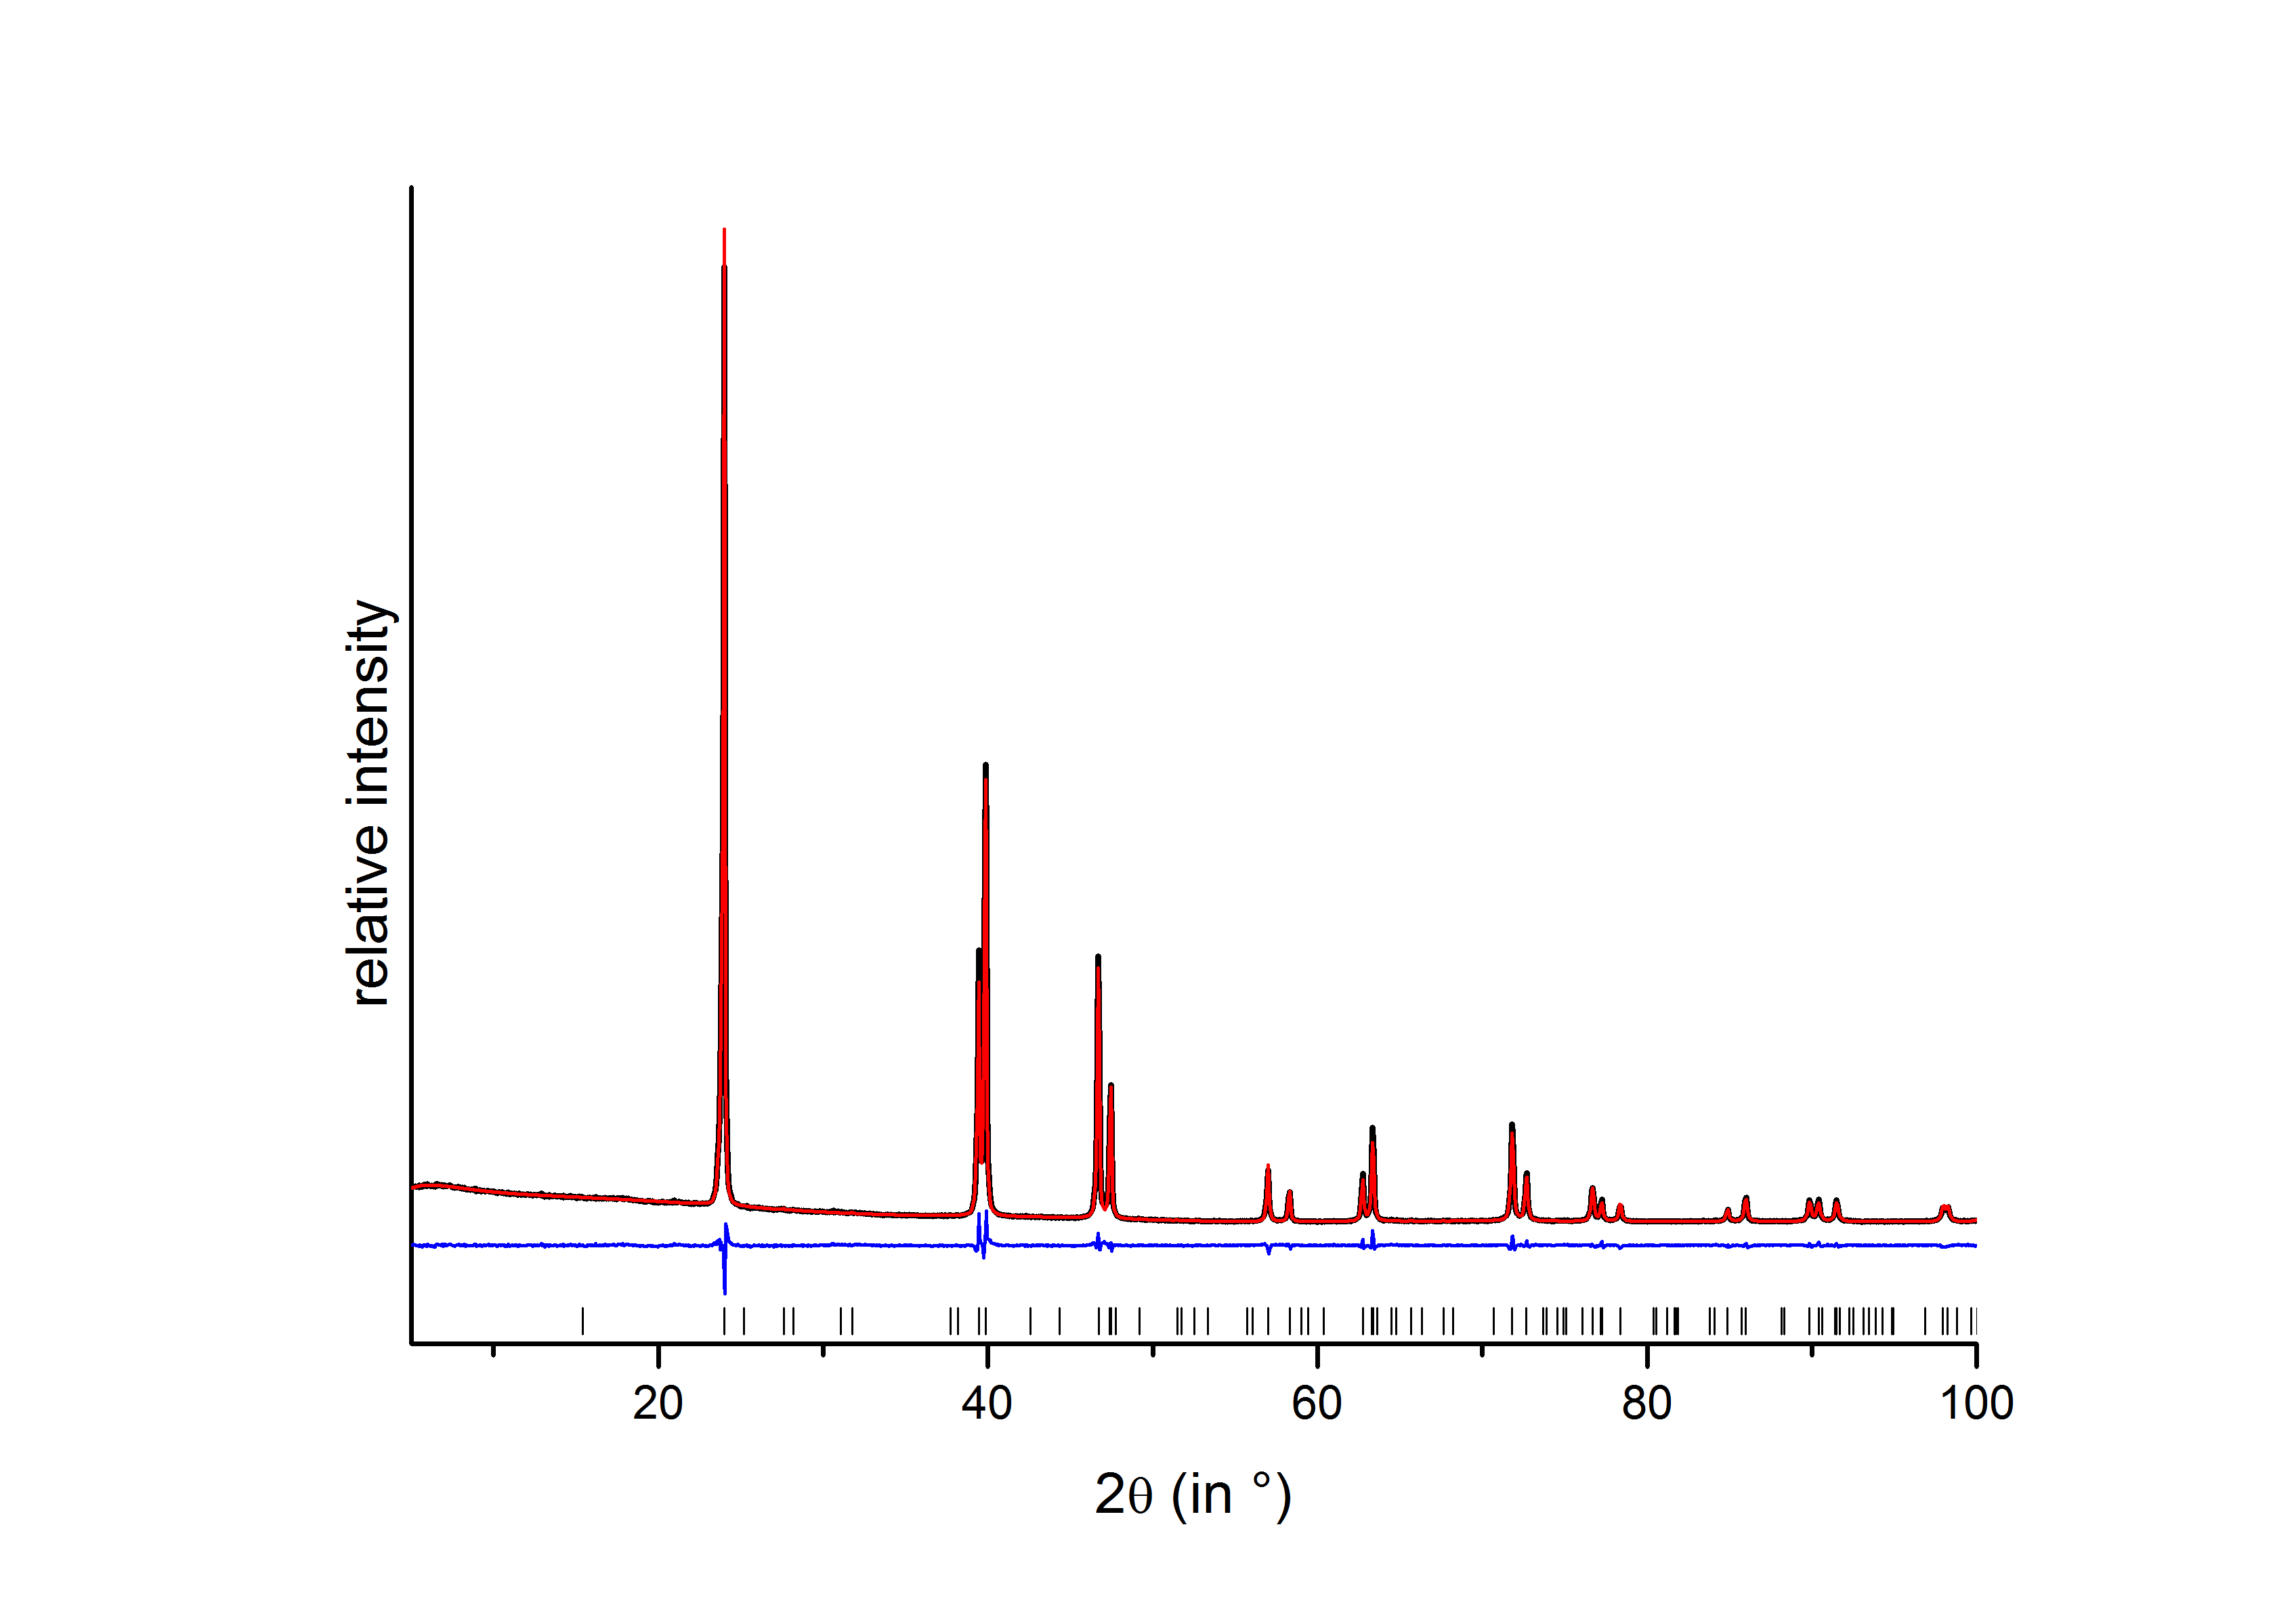
A Huber G670 Guinier camera equipped with a fixed imaging-plate and an automatic read-out system (CuKα1 radiation, Ge(111) monochromator, Å) was used to record the powder X-ray diffraction patterns of the investigated sample to quantify sample homogeneity and lattice parameters. To fix representative parts of the powdered sample on a specimen holder with Mylar foil, hair-fixing spray was used.
Using Topas Academic software, Rietveld and Pawley fits were carried out. The reflection profiles were described with a direct convolution approach and fundamental parameters. The emission profile was described using a Pseudo-Voigt function.
| Rp | Rwp | R | RBragg | |
| 0.0177 | 0.0277 | 0.0834 | 0.0169 | 1.232 |
| ∗background subtracted | ||||
8 High-pressure NMR setup
a 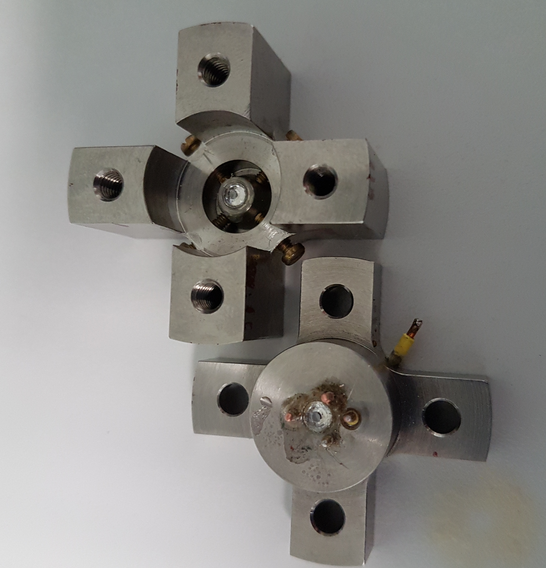 b
b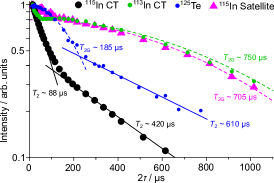
9 Transverse relaxation measurements
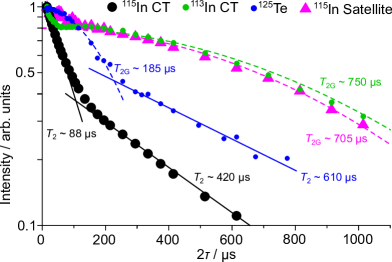
In Fig.8, we present the spin echo decays observed for both In nuclei and Te. The decay of the selectively excited central transition for 115In is very fast ( s) at the beginning before the slope changes to a much slower decay with s. Both decays are well approximated with a single exponential. Similar experiments on the satellites give even larger values of s, while the shape of the decay is Gaussian-like. This means, the spin flips allowed for the central levels (not affected by the quadrupole interaction) must be rather effective, while being quenched in the satellites 32. This is also borne out by the 113In NMR measurements. This low abundance nucleus has essentially 115In neighbors due to the low abundance of 125Te and the negligible Ag magnetic moments, and we further can neglect any like-spin interactions. It thus measures the local field fluctuations from surrounding 115In spins, part of which will be in the central levels and show rapid spin exchange, for others it will be quenched. As a consequence we observe a two component decay also for the 113In CT, for which the rapid decay stems from the effective homonuclear interaction that affects a refocussing of the second pulse. For 125Te, as expected, we find a similar behavior with a rather fast, Gaussian spin echo decay at the beginning followed by a slower decay for greater than about s.
These spin echo decay data highlight the complexity of the present couplings among the various nuclear magnetic moments. Although we are not able to provide quantitative description of this behavior, the mere rapidness of the observed decays, e.g., about s and s for the 115In CT and 125Te, respectively, strongly hints at enhanced dipolar interactions. Such strong internuclear interactions would then explain the large field independent linewidths as well as the failure of MAS to lead to a significant narrowing in particular for 125Te, cf. Fig.1 of the main manuscript. For 115In the residual linewidth of 4 to is in agreement with the effective homonuclear decay of the central transition, Fig.4b in the main manuscript. Faster spinning should be more effective. However, we are also not certain whether the enhanced coupling is of pseudo dipolar origin and thus shows an angular dependence under rotation. It might as well be a result of an indirect nuclear coupling of the Bloembergen-Rowland type with a fairly isotropic line broadening such that it would not be affected by MAS. If aided by first principle calculations, more information about the details for the structure could be readily obtained. Such enhanced internuclear interactions that involve electronic exchange couplings and yield effective line broadening even under MAS have already been reported for similar systems, namely for InP, InAs, and InSb12, 13, 14, 16, 15, 17, 18.
10 Acknowledgement
We thank V. Chlan (Prague) for fruitful discussions and G. Klotzsche (Leipzig) for technical support. We acknowledge the financial support by the Deutsche Forschungsgemeinschaft, projects 317319632 and 442459148, and by Leipzig University.
References
- Schröder et al. 2013 Schröder, T.; Rosenthal, T.; Souchay, D.; Petermayer, C.; Grott, S.; Scheidt, E.-W.; Gold, C.; Scherer, W.; Oeckler, O. A high-pressure route to thermoelectrics with low thermal conductivity: The solid solution series AgInxSb1-xTe2 (). J. Solid State Chem. 2013, 206, 20–26
- Kasiviswanathan et al. 1986 Kasiviswanathan, S.; Rao, D. K.; Gopalam, B. Preparation and characterization of the pseudobinary system Cu1-xAgxInTe2. J. Mater. Sci. Lett. 1986, 5, 912–914
- Welzmiller et al. 2014 Welzmiller, S.; Hennersdorf, F.; Fitch, A.; Oeckler, O. Solid solution series between CdIn2Te4 and AgInTe2 investigated by resonant X-ray scattering. Z. Anorg. Allg. Chem. 2014, 640, 3135–3142
- Welzmiller et al. 2015 Welzmiller, S.; Hennersdorf, F.; Schlegel, R.; Fitch, A.; Wagner, G.; Oeckler, O. Silver Indium Telluride Semiconductors and Their Solid Solutions with Cadmium Indium Telluride: Structure and Physical Properties. Inorg. Chem. 2015, 54, 5745–5756, PMID: 26023890
- Range et al. 1969 Range, K.-J.; Engert, G.; Weiss, A. High pressure transformations of ternary chalcogenides with chalcopyrite structure — I. Indium-containing compounds. Solid State Commun. 1969, 7, 1749–1752
- Range et al. 1969 Range, K.-J.; Engert, G.; Weiss, A. AgInTe2-III — eine metastabile Modifikation des AgInTe2? Z. Naturforsch. B 1969, 24, 813–814
- Bovornratanaraks et al. 2010 Bovornratanaraks, T.; Kotmool, K.; Yoodee, K.; McMahon, M. I.; Ruffolo, D. High pressure structural studies of AgInTe2. J. Phys.: Conf. Ser. 2010, 215, 012008
- Kotmool et al. 2015 Kotmool, K.; Bovornratanaraks, T.; Yoodee, K. Ab initio study of structural phase transformations and band gap of chalcopyrite phase in AgInTe2 under high pressure. Solid State Commun. 2015, 220, 25–30
- Lütgemeier 1964 Lütgemeier, H. Die chemische Verschiebung der Kernresonanzlinien in AIIIBV-Verbindungen. Z. Naturforsch. A 1964, 19, 1297–1300
- Becker and Schäfgen 1979 Becker, K.; Schäfgen, H. NMR chemical shifts in copper (I) chalcogen compounds. Solid State Commun. 1979, 32, 1107–1109
- Vanderah and Nissan 1988 Vanderah, T.; Nissan, R. 31P MAS NMR of a II–IV–V2 chalcopyrite-type series. J. Phys. Chem. Solids 1988, 49, 1335–1338
- Shulman et al. 1958 Shulman, R. G.; Wyluda, B. J.; Hrostowski, H. J. Nuclear Magnetic Resonance in Semiconductors. III. Exchange Broadening in GaAs and InAs. Phys. Rev. 1958, 109, 808–809
- Engelsberg and Norberg 1972 Engelsberg, M.; Norberg, R. E. Nuclear Magnetic Resonance and Nuclear-Spin Dynamics in InP. Phys. Rev. B 1972, 5, 3395–3406
- Han et al. 1988 Han, O. H.; Timken, H. K. C.; Oldfield, E. Solid‐state “magic‐angle” sample‐spinning nuclear magnetic resonance spectroscopic study of group III–V (13–15) semiconductors. J. Chem. Phys. 1988, 89, 6046–6052
- Tomaselli et al. 1998 Tomaselli, M.; deGraw, D.; Yarger, J. L.; Augustine, M. P.; Pines, A. Scalar and anisotropic interactions in undoped InP: A triple-resonance NMR study. Phys. Rev. B 1998, 58, 8627–8633
- Adolphi et al. 1992 Adolphi, N. L.; Conradi, M. S.; Buhro, W. E. The 31P NMR spectrum of InP. J. Phys. Chem. Solids 1992, 53, 1073–1074
- Iijima et al. 2004 Iijima, T.; Hashi, K.; Goto, A.; Shimizu, T.; Ohki, S. Indirect nuclear spin–spin coupling in InP studied by CP/MAS NMR. Physica B 2004, 346-347, 476–478, Proceedings of the 7th International Symposium on Research in High Magnetic Fields
- Iijima et al. 2006 Iijima, T.; Hashi, K.; Goto, A.; Shimizu, T.; Ohki, S. Anisotropic indirect nuclear spin–spin coupling in InP: 31P CP NMR study under slow MAS condition. Chem. Phys. Lett. 2006, 419, 28–32
- Haase et al. 2009 Haase, J.; Goh, S. K.; Meissner, T.; Alireza, P. L.; Rybicki, D. High sensitivity nuclear magnetic resonance probe for anvil cell pressure experiments. Rev. Sci. Instrum. 2009, 80, 073905
- Meissner et al. 2013 Meissner, T.; Goh, S. K.; Haase, J.; Richter, M.; Koepernik, K.; Eschrig, H. Nuclear magnetic resonance at up to 10.1 GPa pressure detects an electronic topological transition in aluminum metal. J. Phys.: Condens. Matter 2013, 26, 015501
- Kattinger et al. 2021 Kattinger, C.; Guehne, R.; Tsankov, S.; Jurkutat, M.; Erb, A.; Haase, J. Moissanite anvil cell single crystal NMR at pressures of up to 4.4 GPa. Rev. Sci. Instrum. 2021, 92, 113901
- Meier et al. 2015 Meier, T.; Reichardt, S.; Haase, J. High-sensitivity NMR beyond 200,000 atmospheres of pressure. J. Magn. Reson. 2015, 257, 39–44
- Harris et al. 2008 Harris, R. K.; Becker, E. D.; De Menezes, S. M. C.; Granger, P.; Hoffman, R. E.; Zilm, K. W. Further conventions for NMR shielding and chemical shifts (IUPAC recommendations 2008). Mag. Res. Chem. 2008, 46, 582–598
- Meissner et al. 2010 Meissner, T.; Goh, S. K.; Haase, J.; Meier, B.; Rybicki, D.; Alireza, P. New Approach to High-Pressure Nuclear Magnetic Resonance with Anvil Cells. J. Low Temp. Phys. 2010, 159, 284
- Forman et al. 1972 Forman, R. A.; Piermarini, G. J.; Barnett, J. D.; Block, S. Pressure measurement made by the utilization of ruby sharp-line luminescence. Science 1972, 176, 284–285
- Ruiz-Morales et al. 1997 Ruiz-Morales, Y.; Schreckenbach, G.; Ziegler, T. Calculation of 125Te Chemical Shifts Using Gauge-Including Atomic Orbitals and Density Functional Theory. J. Phys. Chem. A 1997, 101, 4121–4127
- 27 For quadrupole echoes applied on macroscopic samples and coils, we used a static probe with a low-Q RF circuit so that we could use short excitation pulses of 1s. While this ensured small spectral distortions (as we verified by using large frequency offsets) we could not avoid the formation of significant Solomon echoes from multiple quantum transitions (powder sample). The latter interfere with recording of single quantum transition quadrupole echoes and lead to severe spectral distortions, unless we use long echo delays. Unfortunately, due to the spin echo decay most of the signal has decayed at sufficiently long delays so that the thus obtained spectra are compromised, as well. Nevertheless, within error, we find a similar featureless line shape as for the frequency stepped spin echoes, while we also ascertained that the small difference is not due to a bandwidth limitation.
- Vleck 1948 Vleck, J. V. The Dipolar Broadening of Magnetic Resonance Lines in Crystals. Phys. Rev. 1948, 116–1183
- Aikebaier et al. 2012 Aikebaier, Y.; Kurosaki, K.; Sugahara, T.; Ohishi, Y.; Muta, H.; Yamanaka, S. High-temperature thermoelectric properties of non-stoichiometric Ag1-xInTe2 with chalcopyrite structure. Mater. Sci. Eng., B 2012, 122, 999–1002
- Van Kranendonk 1954 Van Kranendonk, J. Theory of quadrupolar nuclear spin-lattice relaxation. Physica 1954, 20, 781 – 800
- Van Kranendonk and Walker 1967 Van Kranendonk, J.; Walker, M. Theory of quadrupolar nuclear spin-lattice relaxation due to anharmonic Raman phonon processes. Phys. Rev. Lett. 1967, 18, 701–703
- Haase and Oldfield 1993 Haase, J.; Oldfield, E. Spin-Echo Behavior of Nonintegral-Spin Quadrupolar Nuclei in Inorganic Solids. J. Magn. Reson. Ser. A 1993, 101, 30–40