Dipartimento di Fisica, Università di Roma - Roma, Italy INFN, Sezione di Roma - Roma, Italy Dipartimento di Fisica, Università di Tor Vergata - Roma, Italy INFN, Sezione di Roma 2 - Roma, Italy ITIS e Liceo Scientifico ”L. Trafelli” - Nettuno, Italy
Measurement of fundamental physical quantities in the framework of the Lab2Go project
Abstract
To establish a closer contact between school and experimental sciences, Sapienza Università di Roma and the Istituto Nazionale di Fisica Nucleare (INFN) launched the Lab2Go project. Lab2Go has the goal of spreading laboratory practice among students and teachers in high schools. In this article, it is presented a measurement, carried out in the framework of the Lab2Go project, of the ratio where and are respectively the Planck’s constant, the speed of light in the vacuum, and the electric charge.
1 Introduction
Modern physics is based on a few key discoveries made across the 19th and 20th centuries: the invariance of speed of light in different reference frames (Michelson-Morley experiment [1]), the quantisation of the electric charge (Millikan experiment [2]) and the quantisation of the electromagnetic waves energy through the Planck relation [3]:
| (1) |
Nowdays, three fundamental constants (speed of light), (electron charge) and (Planck constant) related to these discoveries define (since May 2019 [4]) the measuring units of length, charge and mass in the International System of units (SI) [5]. These three constants are involved in the relations linking measurable quantities in the Light Emitting Diodes. LEDss are semiconductor devices emitting light at a given wavelength when powered by a potential difference above a minimum threshold value (gap voltage). The minimum energy needed to turn on a LED is given by:
| (2) |
Current flowing into the LED as a function of the potential difference (characteristic curve) has an exponential trend, but the region of the curve over the gap voltage can be approximate as a linear function. To estimate gap voltage , we can interpolate data of the approximately linear region of the characteristic curve by the linear function and calculate the intersection between the axis and the fit function. Then is given by:
| (3) |
Lastly, by combining the eqs. 1 and 2 and solving for , we get the relation between gap voltage , Planck’s constant , speed of light in vacuum , electric charge , and wavelength of the LED [6]:
| (4) |
In this article we present the measurement of physical quantity made in the framework of the Lab2Go project [7].
2 Experimental setup and procedure
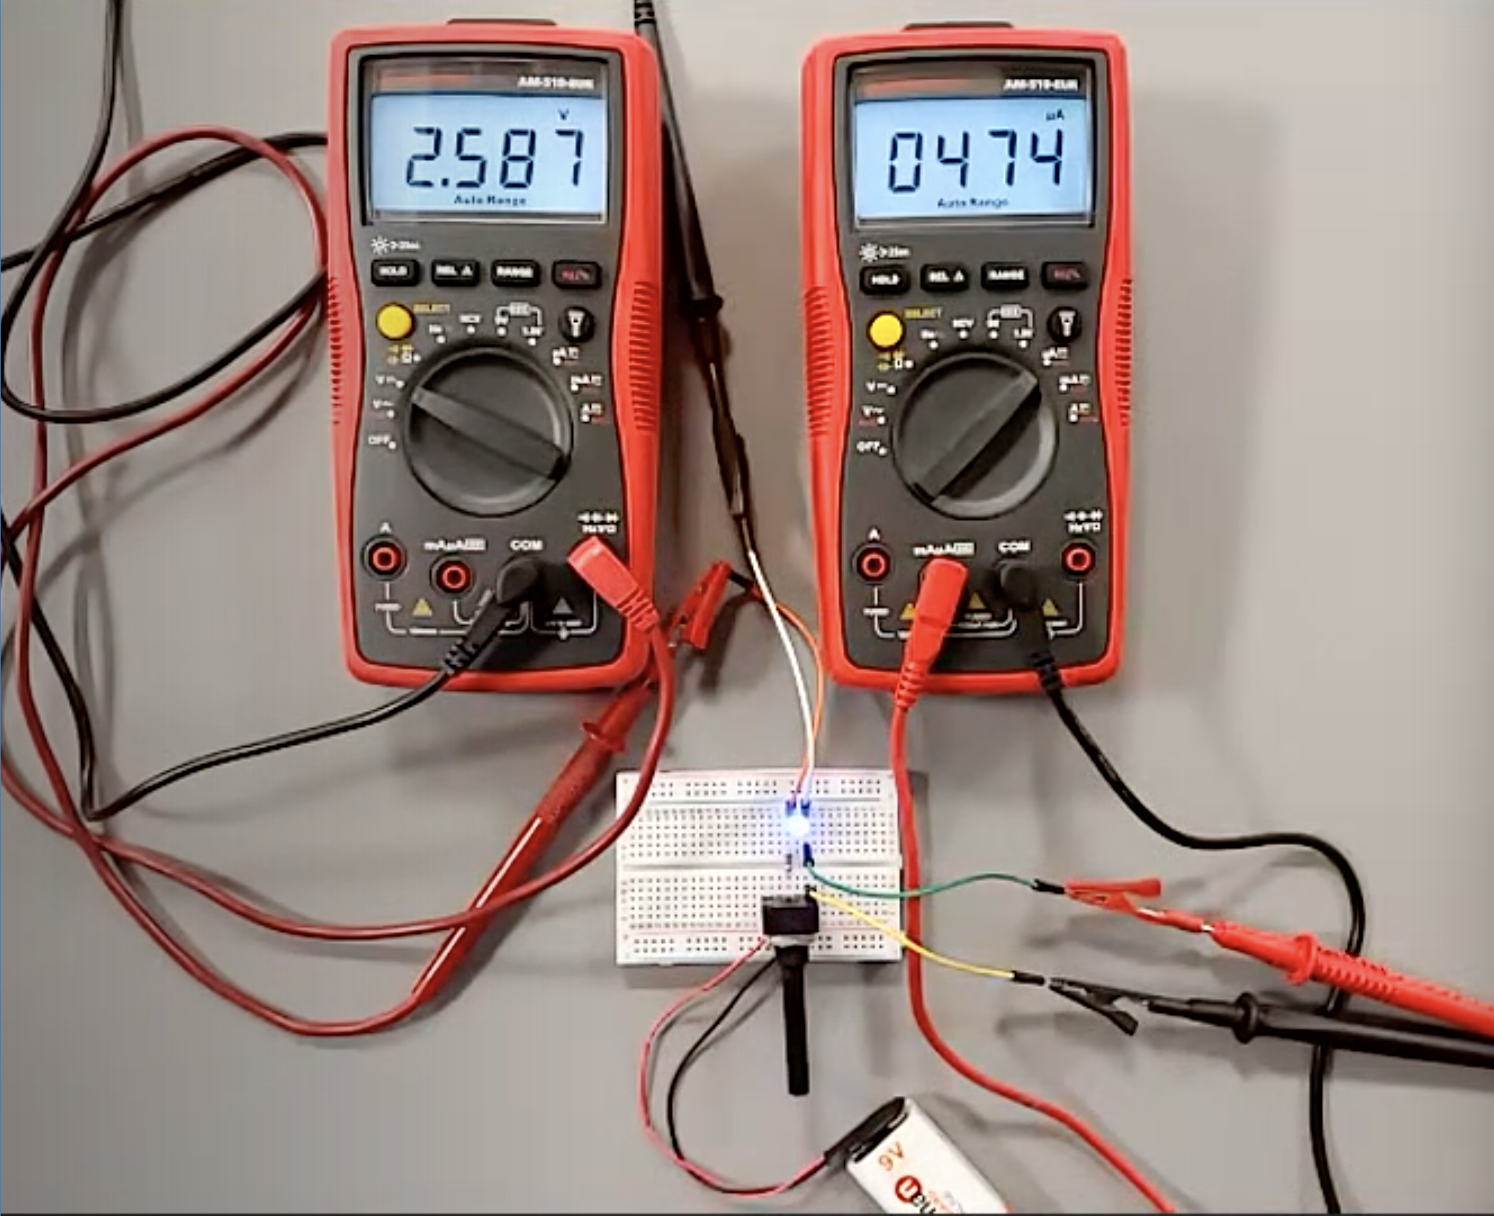
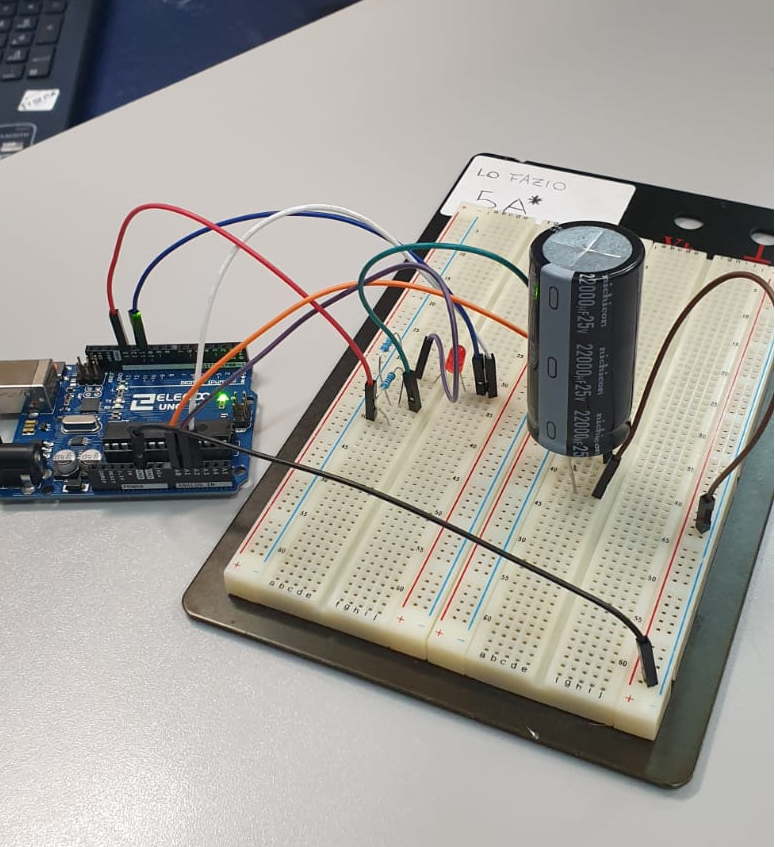
We present here two different approaches to perform the measurement of with instruments and methods available in secondary schools. In the first one (analog approach), LEDs are powered by a battery, the potential difference is varied by a potentiometer, and data of both the potential difference and the current are measured by two multimeters (Fig. 1(a)). In the second version (Arduino-based approach) a 22 mF capacitor, and an Arduino board [8] are used. Arduino is used both to charge/discharge the capacitor, and for Data AcQuisition (DAQ) purposes (Fig. 1(b)). The code (sketch) for Arduino starts charging the capacitor. When the capacitor is fully charged, by an automatic switch, it is discharged powering the LED [9]. In both versions, data of the current as a function of the powering potential difference have been stored for several LEDs colors (red, yellow, green, and blue), corresponding to different wavelengths.
3 Data analysis and results
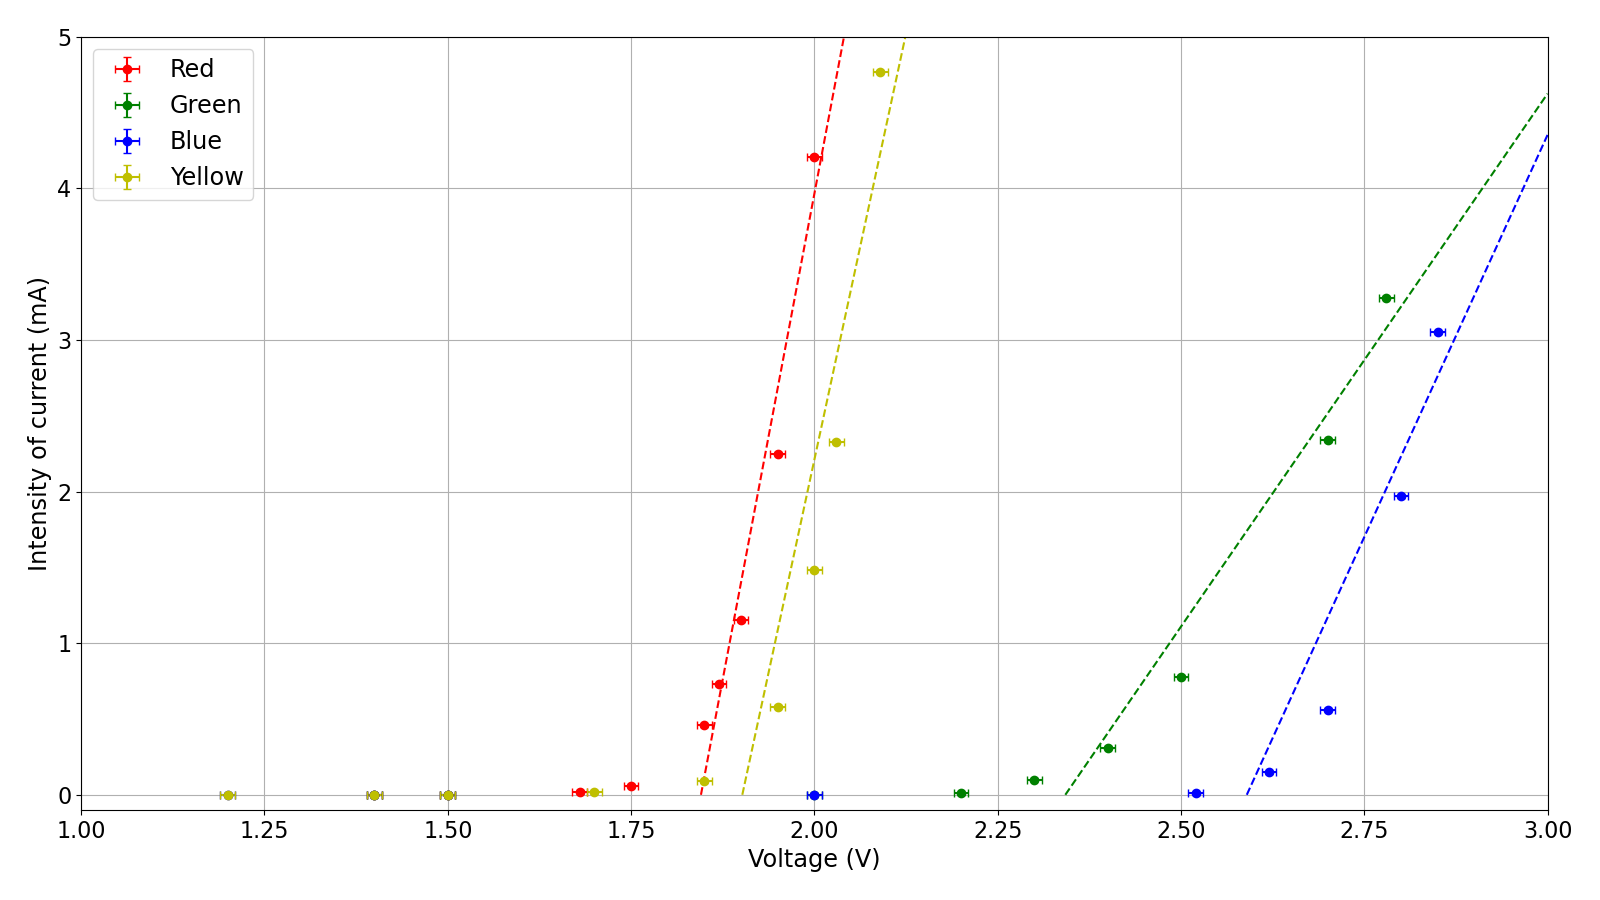
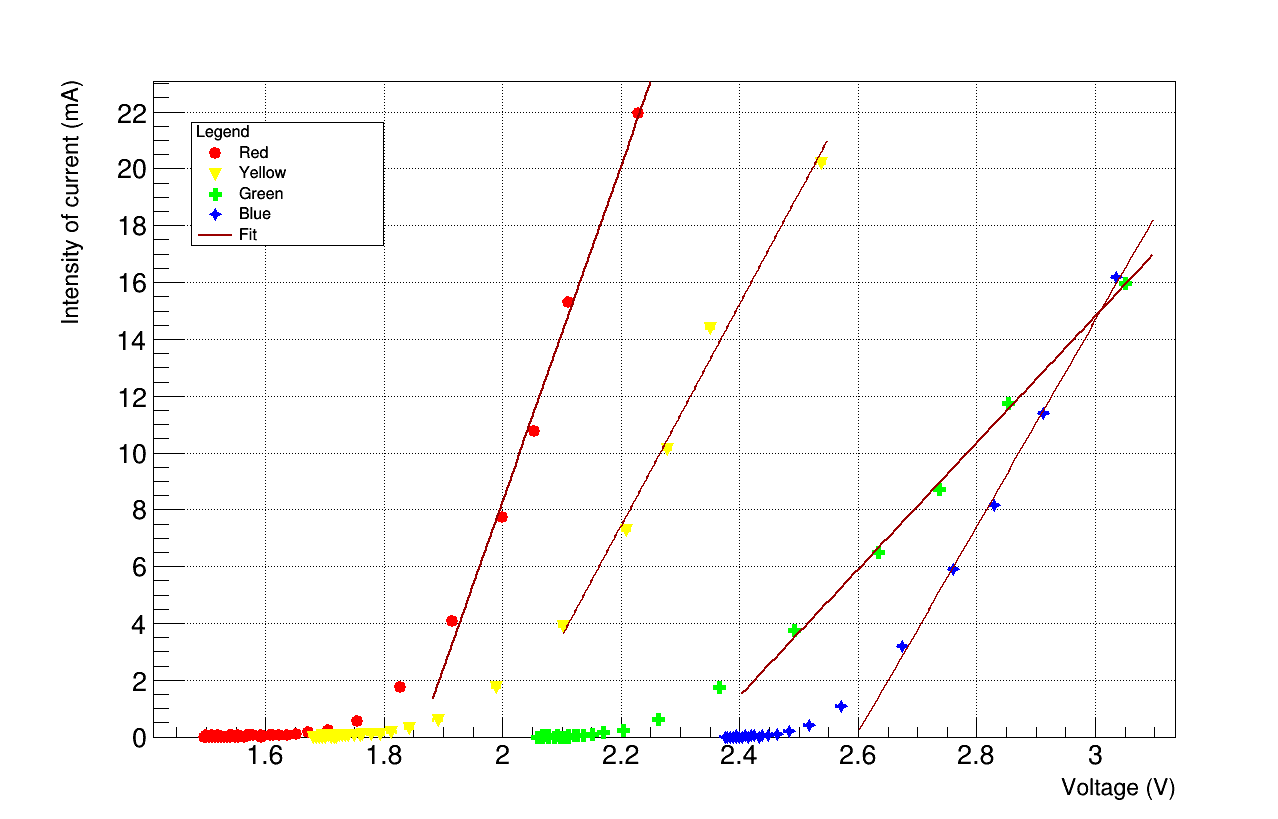
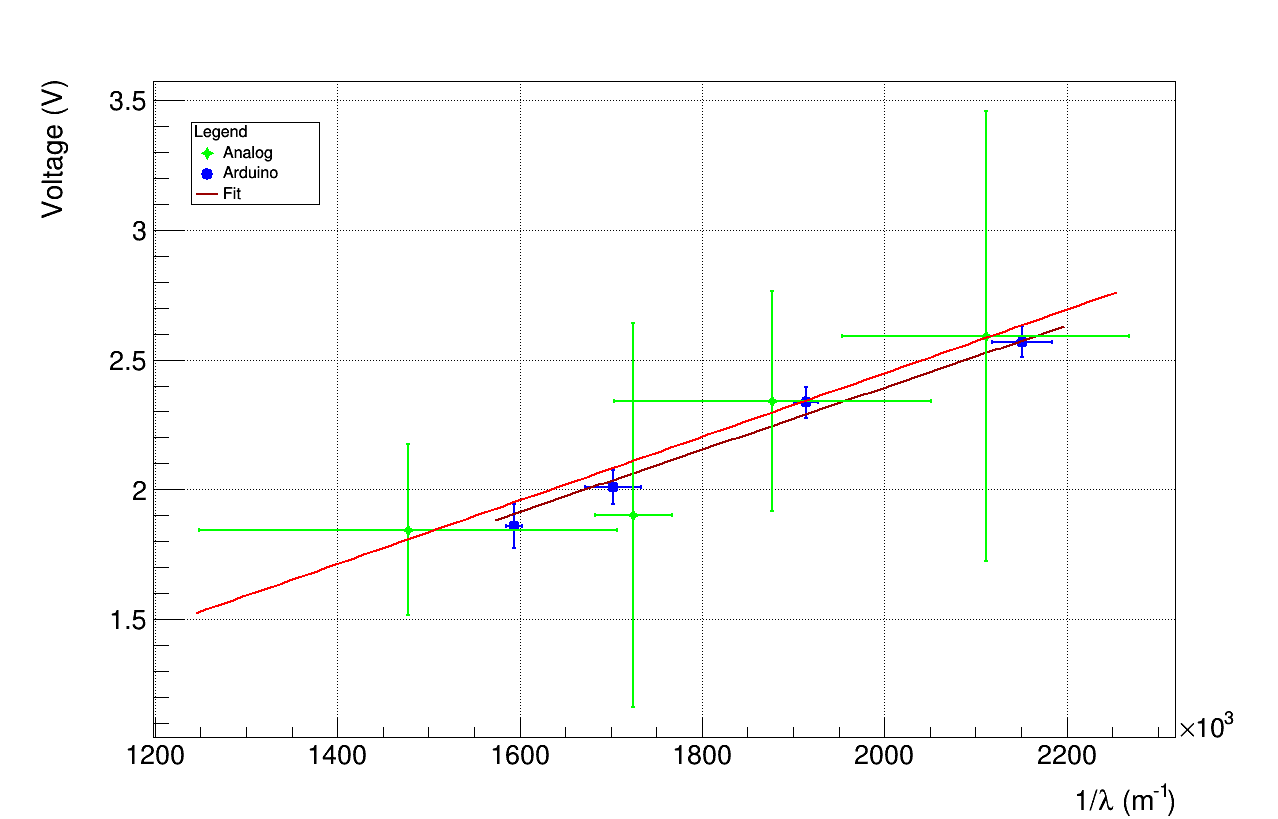
Data of current flowing into the LEDs as a function of the potential difference have been interpolated (Fig. 2), as described in Section 1, allowing estimating values of the gap voltages that are summarized in Table 1. The higher uncertainties on the values of obtained by the analog method (Fig. 2(a)) with respect to the Arduino-based one (Fig. 2(b)), just depend on data not fully contained into the fitting line. In turn, the gap voltages (Tab. 1) have been interpolated (Fig. 3) by eq. 4 as a function of using values of the wavelengths declared in the datasheets of the LEDs.
| Method | ||||
|---|---|---|---|---|
| Analog | ||||
| Arduino |
The slope resulting by interpolation represents the estimated value of parameter . Results are and respectively for the analog and the Arduino-based methods. These values agree respectively within approximately and with the theoretical value value of approximately calculated by the accepted values of and [5].
4 Conclusions
During the school year 2020/21, in the framework of Lab2Go, the measurement of fundamental physical quantities using LEDs has been proposed to high school students. Despite the caveat of Planck’s constant being a fundamental constant since 2019 used as a reference to define other units of measurement and for the calibration of instruments, this experiment can not be made in the future using new instruments; this proposed activity has the advantage of illustrating ”quantum mechanics in action” to students.
Acknowledgements.
The authors acknowledge Mauro Mancini, Francesco Safai Therani, and Comitato di Coordinamento III missione (CC3M)-INFN.References
- [1] R. S. Shankland, “Michelson-Morley experiment,” American Journal of Physics, vol. 32, no. 1, pp. 16–35, 1964.
- [2] M. Niaz, “The oil rop experiment: a rational reconstruction of the Millikan–Ehrenhaft controversy and its implications for chemistry textbooks,” Journal of Research in Science Teaching, vol. 37, no. 5, pp. 480–508, 2000.
- [3] O. Passon and J. Grebe-Ellis, “Planck’s radiation law, the light quantum, and the prehistory of indistinguishability in the teaching of quantum mechanics,” European Journal of Physics, vol. 38, no. 3, p. 035404, 2017.
- [4] B. Wood and H. Bettin, “The Planck constant for the definition and realization of the kilogram,” Annalen der Physik, vol. 531, no. 5, p. 1800308, 2019.
- [5] Bureau International des Poids et Mesures, “The International System of Units.” https://www.bipm.org/en/measurement-units.
- [6] P. J. O’Connor and L. R. O’Connor, “Notes: Measuring Planck’s constant using a light emitting diode,” The Physics Teacher, vol. 12, no. 7, pp. 423–425, 1974.
- [7] Mirco Andreotti, et al., “Il progetto Lab2Go per la diffusione della pratica laboratoriale nelle scuole secondarie di II grado.” https://arxiv.org/abs/2106.08308, 2021.
- [8] Arduino collaboration. https://www.arduino.cc/.
- [9] S. Grignoli, “Un esperimento ”classico” rivisitato: la misura di con i LED,” La Fisica nella Scuola, no. 2, p. 82, 2018.