YETI follow-up observations of the T Tauri star CVSO 30 with transit-like dips
Abstract
The T Tauri star CVSO 30, also known as PTFO 8-8695, was studied intensively with ground based telescopes as well as with satellites over the last decade. It showed a variable light curve with additional repeating planetary transit-like dips every h. However, these dimming events changed in depth and duration since their discovery and from autumn 2018 on, they were not even present or near the predicted observing times. As reason for the detected dips and their changes within the complex light curve, e.g. a disintegrating planet, a circumstellar dust clump, stellar spots, possible multiplicity and orbiting clouds at a Keplerian co-rotating radius were discussed and are still under debate. In this paper, we present additional optical monitoring of CVSO 30 with the meter class telescopes of the Young Exoplanet Transit Initiative in Asia and Europe over the last seven years and characterize CVSO 30 with the new Early Data Release 3 of the ESA Gaia Mission. As a result, we describe the evolution of the dimming events in the optical wavelength range since 2014 and present explanatory approaches for the observed variabilities. We conclude that orbiting clouds of gas at a Keplerian co-rotating radius are the most promising scenario to explain most changes in CVSO 30’s light curve.
keywords:
stars: individual: CVSO 30 – stars: variables: T Tauri – techniques: photometric1 Introduction
While most exoplanets are Gyr old, including in particular transiting planets, it would be best to study planet formation and early evolution with young planets (age Myr). Therefore, the Young Exoplanet Transit Initiative (YETI; Neuhäuser et al., 2011) searched for planet candidates in young open stellar clusters. One of our first targets was the 25 Ori cluster, which was observed within the YETI network since 2010. As a result, we could confirm the detection of a transit-like signal within the light curve of CVSO 30, which was first found by van Eyken et al. (2012). Schmidt et al. (2016) discovered an additional wide companion planet candidate via direct imaging. CVSO 30, which is also known as PTFO 8-8695, is a weak-line T Tauri star with spectral type M3 (Briceño et al., 2005), which showed initially brightness dips of mmag every h lasting about min. However, shape, depth and duration of these dips changed significantly over time as reported by van Eyken et al. (2012) and Raetz et al. (2016). Furthermore, the dimming events can show either no wavelength dependence (Raetz et al., 2016) or, in other epochs, depths that decrease at larger wavelengths (Yu et al., 2015; Onitsuka et al., 2017; Tanimoto et al., 2020). On the one hand, CVSO 30 seems to show no dimming at some epochs (Koen, 2015) and on the other hand, multiple dips per period were detected. Tanimoto et al. (2020) monitored CVSO 30 intensively in the -band and in -filters between 2014 and 2018. They found that CVSO 30 showed three different fading events, namely "dip-A" appeared earlier in phase compared to the dimming reported in van Eyken et al. (2012), which they called "dip-B". Another "dip-C" was discovered in November 2018, later in phase. As diverse as the detected changes in CVSO 30’s light curve were also the attempts to explain their origin during the last decade. van Eyken et al. (2012) argued that the signal was caused by a Jovian planet based on radial velocity measurements and adaptive optics imaging, where no significant variation or background source could be detected. In order to explain the changing depth, duration as well as the dis- and reappearance of the transit-like signal Barnes et al. (2013) proposed a misalignment between the rotational axis of the star and the orbital plane of a precessing planet. This hypothesis agrees with Ciardi et al. (2015), but the model needed further fine tuning to fit their photometric and spectroscopic data. In contrast to this, the planetary scenario is considered unlikely by Yu et al. (2015), because the target does not show the Rossiter-McLaughlin effect or changes in its radial velocity between 2011 and 2013. Also star spots are usually visible for half a rotational period and this contradicts the short duration of the observed fading events. Even if multiple stellar spots were considered, this scenario could reproduce the signal, but it is based on assuming a complex, and stable pattern (Yu et al., 2015). Tanimoto et al. (2020) suggest the idea that the original fading event in van Eyken et al. (2012) consists of a periodically combined dust cloud and a precessing planet, which split up in 2014 to explain the detection of multiple dips per period near the predicted observing times. Additionally, the newly found dip-C could be the result of an accretion hotspot or a dust cloud. Recent publications of Bouma et al. (2020) and Koen (2020) showed that the light curve from the Transiting Exoplanet Survey Satellite (TESS; Ricker et al., 2015) contains two different periods (11.98 h and 10.76 h) and that CVSO 30 can be a binary star with no planetary companion. Bouma et al. (2020) presented also several other possible explanations, which need to be considered further. Koen (2021) combined the binary scenario with star spot models to explain the variability of CVSO 30 based on TESS measurements in one passband. However, a filling factor of roughly 0.5 seems by far too large for normal spots and would have been probably detected in previous high-resolution, high signal-to-noise spectra, as e.g. in the case of the weak-line T Tauri star P1724 Neuhauser et al. (1997).
In this paper, we describe our observations in the optical wavelength range in section 2. In section 3 we explain the data reduction and the routine for photometric measurements. The following section 4 presents our light curve analysis. We test scenarios for the cause of CVSO 30’s variability in section 5. Our results are discussed and we give a conclusion in the final section of this paper.
2 Observations
In contrast to the original YETI campaigns, where the 25 Ori cluster was continuously monitored for 7 to 12 subsequent nights within multiple runs in several years, we focused this time completely on the predicted time slots of the dimming event, according to ephemeris presented in Raetz et al. (2016). An overview of the involved observatories and instrumentation, which participated within our YETI follow-up observations of CVSO 30 since autumn 2014, is given in Table 1. Each monitoring includes typically about 1 h of observation time before and after the start/end of the predicted dimming event. The observations were usually carried out in the -band filter with individual image integration times up to a few minutes, as listed in the observation log in Table 2, for sufficient photometric precision and time resolution.
After receiving message from T. O. B. Schmidt (priv. communication) in summer 2019, who reported a phase shifted dimming within the TESS light curve of CVSO 30, we extended our monitoring also to these additional time slots. Tanimoto et al. (2020) had found this signal independently within their data in November 2018.
Our photometric follow-up observations of CVSO 30 have a total integration time of about 164.4 h spanning over the range of time between October 2014 and February 2021.
| Observatory | Abbrev. | Long. (E) | Lat. (N) | Altitude | Mirror | CCD | # Pixel | FoV |
|---|---|---|---|---|---|---|---|---|
| [deg] | [deg] | [m] | [m] | [arcmin] | ||||
| Lulin/Taiwan | LOT | 120.5 | 23.3 | 2862 | 1.0 | Apogee U42a | 2048 x 2048 | 11.0 x 11.0 |
| Suhora/Poland | Suhora | 20.1 | 49.6 | 1009 | 0.6 | Apogee Aspen CG47b | 1024 x 1024 | 20.0 x 20.0 |
| Jena/Germany | GSH | 11.5 | 50.9 | 367 | 0.9c | E2V CCD42-40d | 2048 x 2048 | 52.8 x 52.8 |
| Tübingen/Germany | IAAT | 9.1 | 48.5 | 400 | 0.8 | SBIG ST-L-1001Ee | 1024 x 1024 | 13.6 x 13.6 |
| Sierra Nevada/Spain | OSN | -3.4 | 37.1 | 2896 | 1.5 | VersArray:2048Bf | 2048 x 2048 | 7.9 x 7.9 |
| Tenerife/Spain | OGS | -16.5 | 28.3 | 2393 | 1.0 | EEV 42-40g | 4 x [2048 x 2048] | 42.5 x 42.5 |
a Huang et al. (2019); b Siwak et al. (2019); c 0.6 m in Schmidt mode; d Mugrauer & Berthold (2010);
e http://astro.uni-tuebingen.de/about/teleskop/telkam.shtml; f Ortiz et al. (2006);
| Date | Observatory | Filter | DIT | |
|---|---|---|---|---|
| 2014 Oct 23 | OSN | R | 172 | 90 |
| 2014 Oct 28 | OSN | R | 165 | 90 |
| 2014 Nov 02 | GSH | R | 66 | 180 |
| 2014 Nov 06 | OSN | R | 145 | 100 |
| 2014 Nov 19 | OSN | R | 62 | 90 |
| 2014 Dec 11 | OSN | R | 125 | 100 |
| 2015 Feb 11 | GSH | R | 74 | 180 |
| 2015 Nov 14 | OGS | R | 60 | 210 |
| 2015 Nov 19 | OGS | clear | 103 | 135 |
| 2015 Nov 23 | OSN | R | 76 | 180 |
| 2016 Feb 02 | OSN | R | 100 | 180 |
| 2016 Oct 26 | OSN | R | 30 | 180 |
| 2017 Jan 05 | OSN | R | 69 | 240 |
| 2017 Jan 14 | OSN | R | 13 | 240 |
| 2017 Jan 23 | OSN | R | 86 | 180 |
| 2017 Oct 27 | OSN | R | 70 | 200 |
| 2017 Nov 13 | OSN | R | 84 | 200 |
| 2017 Nov 22 | OSN | R | 67 | 200 |
| 2017 Nov 22 | GSH | R | 106 | 120 |
| 2018 Jan 23 | OSN | R | 123 | 200 |
| 2018 Feb 14 | IAAT | clear | 124 | 120 |
| 2018 Oct 14 | GSH | R | 47 | 210 |
| 2018 Oct 31 | Suhora | V, I | 80, 80 | 120, 60 |
| 2018 Nov 08 | LOT | R | 60 | 120 |
| 2018 Nov 09 | GSH | R | 32 | 300 |
| 2018 Nov 14 | GSH | R | 50 | 210 |
| 2018 Dec 01 | OSN | R | 85 | 180 |
| 2018 Dec 04 | LOT | R | 136 | 120 |
| 2018 Dec 09 | LOT | R | 47 | 120 |
| 2018 Dec 13 | LOT | R | 80 | 120 |
| 2018 Dec 17 | LOT | R | 137 | 120 |
| 2018 Dec 18 | LOT | R | 137 | 120 |
| 2018 Dec 26 | LOT | R | 37 | 120 |
| 2018 Dec 27 | LOT | R | 137 | 120 |
| 2019 Oct 31 | GSH | R | 65 | 180 |
| 2019 Nov 09 | GSH | R | 52 | 180 |
| 2019 Dec 05 | GSH | R | 78 | 180 |
| 2020 Jan 15 | GSH | R | 53 | 180 |
| 2020 Jan 23 | GSH | R | 60 | 180 |
| 2020 Feb 07 | GSH | R | 38 | 180 |
| 2020 Oct 20 | GSH | R | 62 | 180 |
| 2020 Nov 23 | GSH | R | 77 | 180 |
| 2020 Nov 25 | GSH | R | 63 | 180 |
| 2021 Jan 11 | OSN | R | 66 | 200 |
| 2021 Jan 15 | OSN | R | 79 | 200 |
| 2021 Jan 29 | OSN | R | 139 | 90 |
| 2021 Feb 02 | OSN | R | 82 | 200 |
3 Data reduction and photometry
The data were processed with standard image reduction routines based on IRAF111IRAF is distributed by the National Optical Astronomy Observatories, which are operated by the Association of Universities for Research and Astronomy, Inc., under cooperative agreement with the National Science Foundation. (Tody, 1993), which include bias, dark and flat-field correction.
With our routine, we can perform photometry on all stars within the field of view simultaneously. Therefore, we create a list of pixel coordinates for all detectable light sources with Source Extractor (SExtractor; Bertin & Arnouts, 1996). This list was then used as a reference to remove tracking offsets between the individual images, which was also carried out with SExtractor. We determined the optimal aperture size with IRAF for each night separately, by using 15 different apertures, ranging from one up to two average full width half maxima of point sources, detected in the individual observing nights. The standard deviations of the instrumental magnitude differences, of a subset of the brightest, non-variable stars, were then calculated for all 15 apertures, and we chose as optimal aperture the one, with the smallest sum of standard deviations. The optimized aperture was then utilized for aperture photometry on all stars within the field of view.
At next, we performed differential photometry with the program PHOTOMETRY from Broeg et al. (2005), which creates an artificial comparison star. This artificial star includes information of all detected stars, but they are weighted depending on their stability during the observation. Variable stars have typically a higher standard deviations during the processed time series and therefore, they are weighted lower than stable stars. For more details on the used photometry routine see Errmann et al. (2014) or Errmann (2016).
Finally, we get a list for each star within the field of view, which includes the heliocentric Julian date (HJD), the determined relative magnitude and its uncertainty.
4 Light curve analysis
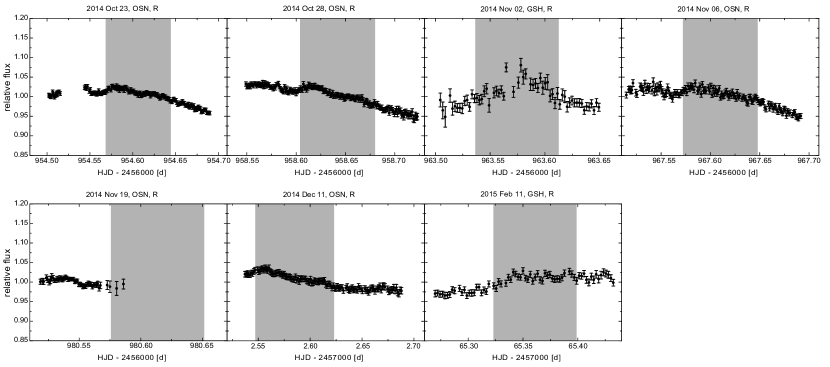
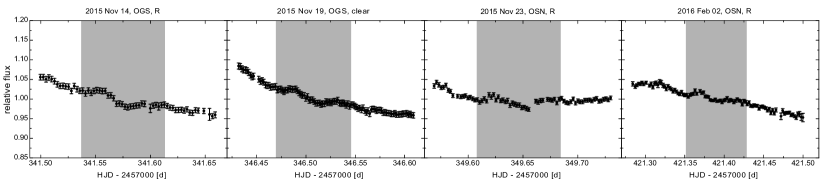
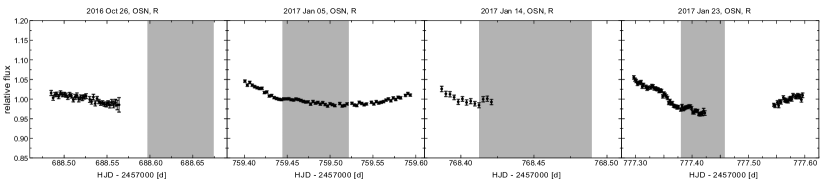
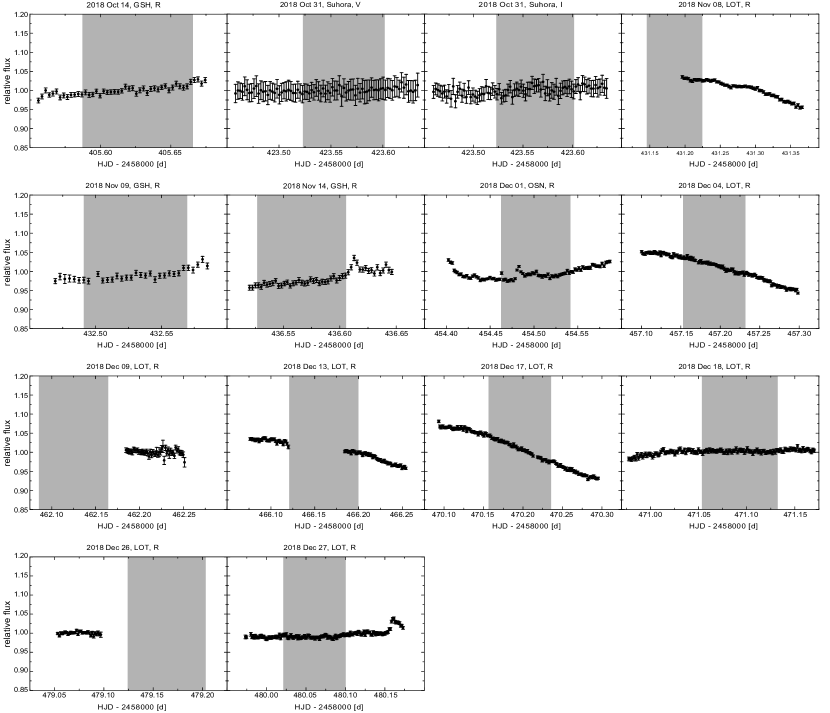
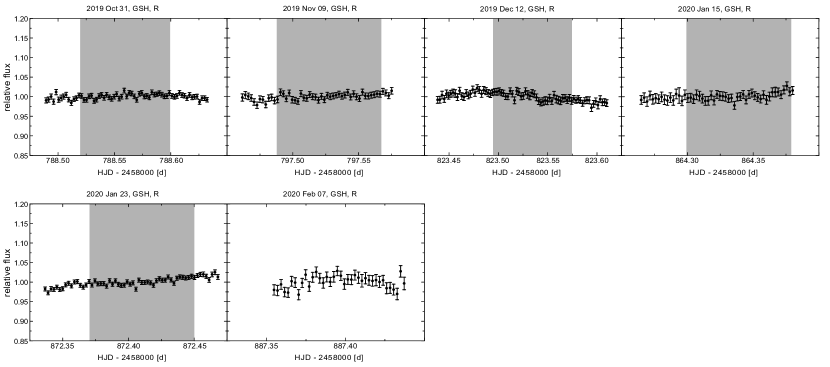
The unprocessed light curves are shown in appendix A. Since CVSO 30 is a T Tauri star, its light curve is impacted by stellar variability which had to be considered and characterized before further investigation. We treated every light curve individually and detrended them by fitting polynomials of the third order to the out-of-event measurements. This was done for the listed nights in Table 5, which exhibit sufficient out-of-event observing time. The nights without significant fading events were not included in Table 5, but they are presented in Fig. 9 - 15. The detrended (if applicable) and also the original photometric measurements of all light curves are provided as online supplementary material.
Furthermore, we found within our light curves three flare-like events. Their flux increase was determined by fitting third order polynomials to the unprocessed photometric measurements outside the flare-like event and then comparing the expected flux, given by the polynomial, to the corresponding actual measurement during the flare. The associated results are given in Table 3.
| Date | Observatory | maximal flux increase [%] |
|---|---|---|
| 2018 Jan 23 | OSN | |
| 2018 Nov 14 | GSH | |
| 2018 Dec 27 | LOT |
4.1 Transit fitting
The detrended light curves of CVSO 30 were further analyzed using the "Exoplanet Transit Database" (ETD; Brát et al., 2010; Poddaný et al., 2010).
ETD is an on-line portal, which can be utilized to fit synthetic transit light curves to observational data. The website determines mid-time, duration and depth of the fading event by using non-linear least-squares algorithm and also removing systematic trends by a second-order polynomial (Brát et al., 2010). As input parameter, a first estimation of the mid-transit time and transit duration are needed together with the radii ratio of host star and companion, as well as the impact parameter and the linear limb darkening coefficient. These variables were obtained from stellar mass, radius and orbital period, as listed in Table 4. The linear limb darkening coefficient for the -band filter () is estimated, based on the given effective temperature and surface gravity, from the work of Claret & Bloemen (2011).
The radius of CVSO 30 was determined by calculating its bolometric magnitude
| (1) |
where is the absolute brightness in the -band (see section 5.2 for details) and the corresponding bolometric correction. We derived mag from the website of "MESA Isochrones & Stellar Tracks222http://waps.cfa.harvard.edu/MIST/model_grids.html", taking into account CVSO 30’s effective temperature, extinction, metallicity and surface gravity (values in Table 4). At next, we used
| (2) |
to calculate CVSO 30’s luminosity (using mag from Prša et al., 2016) and via
| (3) |
its radius. The optimal light curve parameters are found with ETD by iterating the input parameter until the output parameters are consistent with each other, within their one sigma uncertainties, in five consecutive fitting attempts. ETD needs as input parameters the limb darkening, the impact factor, the radii ratio of the planet candidate and the star, as well as a specification of the expected transit center time and duration.
| Parameter | Value | Ref. |
| RA (J2000) [h : m : s] | 05 : 25 : 07.6 | [1] |
| Dec (J2000) [deg : m : s] | + 01 : 34 : 24.5 | [1] |
| Mass [M☉] | [2] | |
| Radius [R☉] | this work | |
| Effective temperature [K] | [2] | |
| Surface gravity [dex] | [2] | |
| Metallicity [dex] | [2] | |
| Distance [pc] | [3] | |
| Age [Myr] | [4] | |
| Apparent brightness [mag] | [5] | |
| Extinction [mag] | this work | |
| Absolute brightness [mag] | this work |
The best-fitting parameters for all detected dimming events are listed in Table 5. We use the designation of Tanimoto et al. (2020) to distinguish the three phase-shifted fading events of CVSO 30. The transit center times of the detected dimming events were converted from HJD into with the online converter333https://astroutils.astronomy.osu.edu/time/hjd2bjd.html, based on Eastman et al. (2010).
4.2 Investigation of the three phase shifted dimming events
We found three different dimming events within our observations, which we call dip-A, dip-B and dip-C based on the work of Tanimoto et al. (2020). Furthermore, their ephemeris
| (4) |
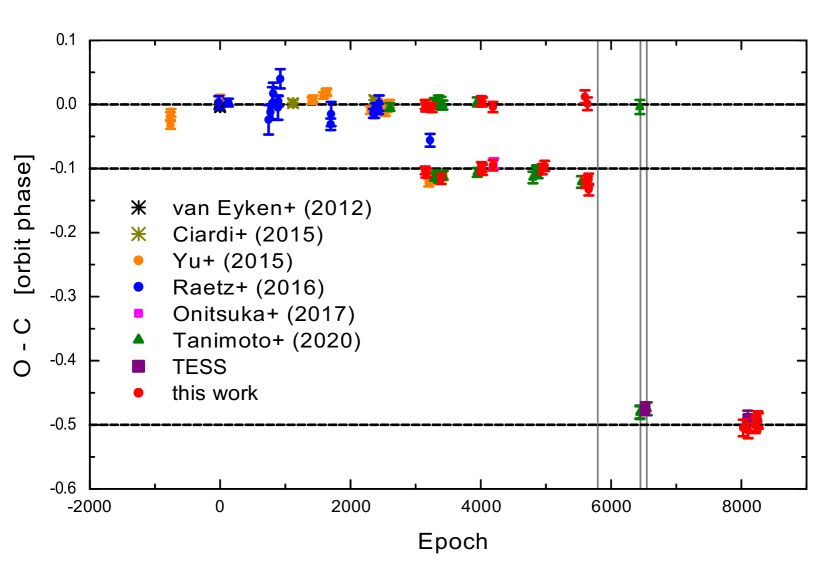
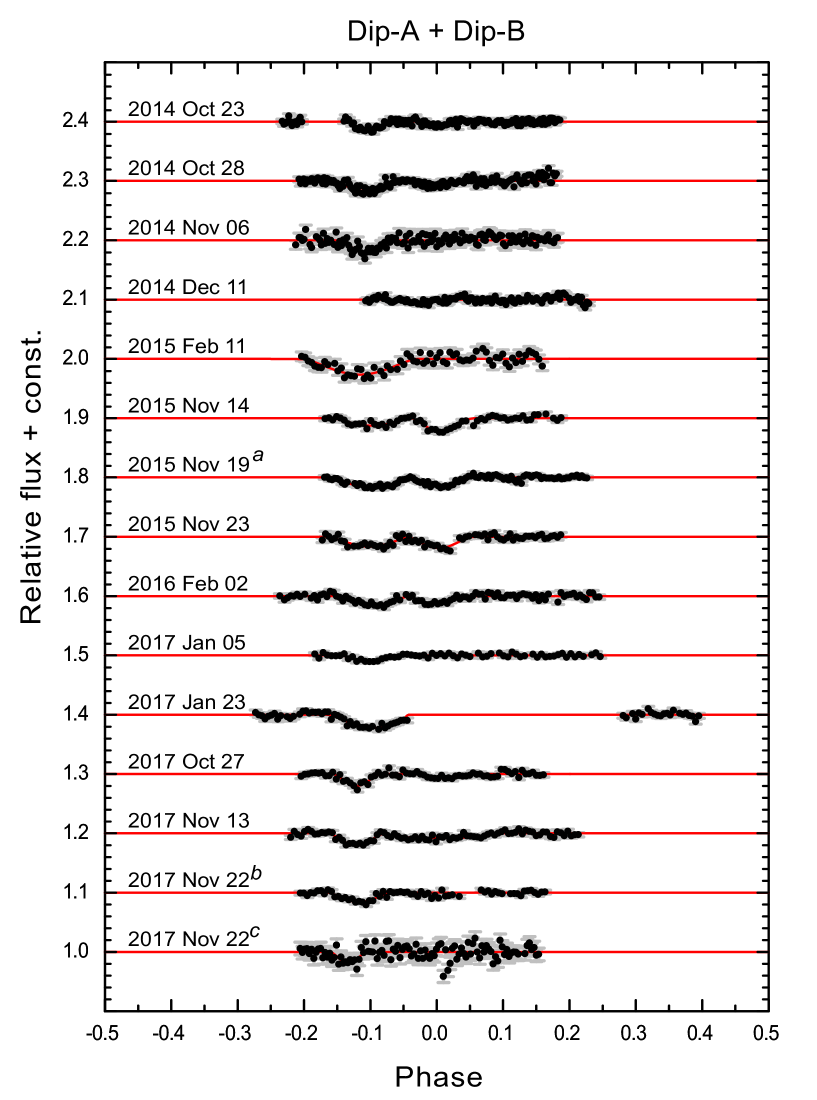
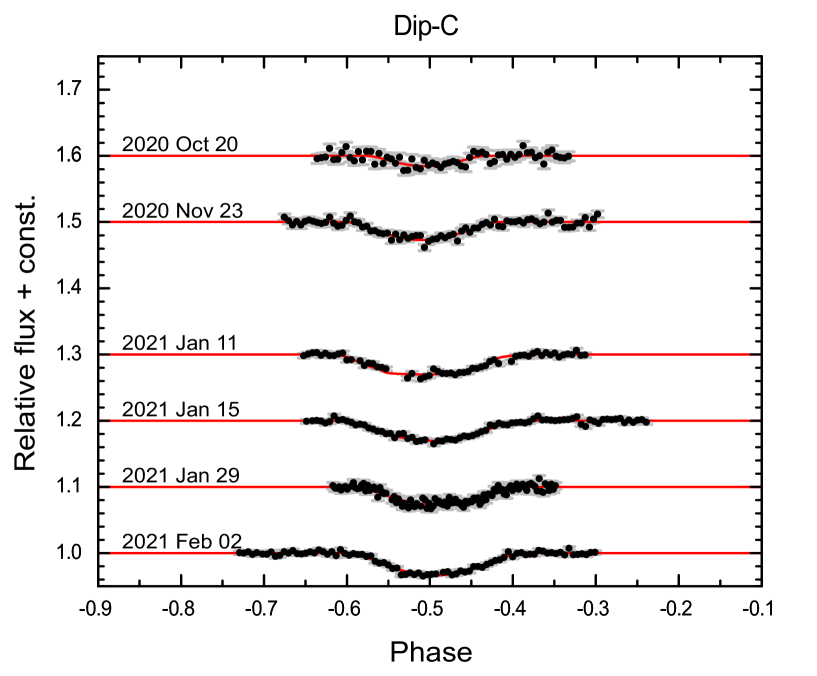
work excellent to predict the occurrence of dip-B within our data, as shown in appendix A and also to characterize the temporal occurrence of dip-A and dip-C. We show the "observed minus calculated" (O-C) diagram in Fig. 1 for our detected fading events together with data from van Eyken et al. (2012), Ciardi et al. (2015), Yu et al. (2015), Raetz et al. (2016), Onitsuka et al. (2017), Tanimoto et al. (2020) and TESS, spanning over a decade of observations. Each dip considered separately shows no significant phase shift within its uncertainties. Therefore, further updates on their ephemeris are not necessary. The detrended and phase folded light curves with the best-fitting models are shown in Fig. 2 and 3.
a clear filter, b OSN, c GSH
As expected, dip-B occurs on average at phase for our observations, using its ephemeris, given in Eqn. 4. Dip-A was visible at an average orbit phase of and dip-C at during our monitoring campaign, in comparison to dip-B. We have found flare-like events within CVSO 30’s light curve and their temporal appearances are indicated as gray vertical lines in Fig. 1. The strongest flare-like event took place after the last significant detection of dip-A and dip-B, and before the first appearance of dip-C. The chronological development of the depths and durations for the three different dimming events are shown in Fig. 4. The average depth of dip-A mmag indicates that dip-A has a comparable depth to dip-B with mmag over the whole monitoring campaign. However, dip-B seems to be significantly deeper in season 2015/2016 with mmag in comparison to the detections in all other seasons mmag. Both, dip-A and dip-B, were not observable anymore since autumn 2017, as illustrated in Fig. 13 to 15. This contradicts the report in Tanimoto et al. (2020), namely that they have detected dip-B on November 09 in 2018. This mentioned detection is also consistent with noise. Dip-C has an average depth of mmag.
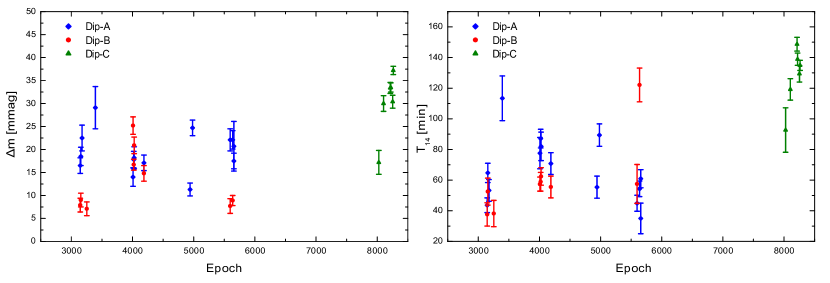
During our follow-up observations dip-A shows an average duration of min, while dip-B and dip-C last on average min and min.
5 Explanatory approaches for the observed variabilities
5.1 Comparison with Tanimoto et al. (2020)
In this subsection we are following the explanation approaches of Tanimoto et al. (2020), who give four possible explanations for the dimming events, namely
-
1.
a cool star spot,
-
2.
an accretion hotspot,
-
3.
a Jovian planet,
-
4.
a circumstellar dust clump,
and test them in the context of their photometric measurements in the near infrared. We will investigate all these scenarios for the individual dimming events, which were not ruled out already by Tanimoto
et al. (2020), based on our observations.
A circumstellar dust clump, consisting of an opaque core and an optically thin dust halo, was the only remaining cause for dip-A that was not falsified. The observed fading of the flux at a particular wavelength is described by
| (5) |
with the filling factor of the core and the dust halo . The depth in the -band is given by , and and are wavelength-dependent coefficients, as defined by Cardelli et al. (1989). The ratio
was determined by Tanimoto
et al. (2020) to be for dip-A in both, season 2014 and 2016, based on its wavelength dependence. The corresponding best-fitting values for season 2014 are , and for season 2016 , . Given these constraints from Tanimoto
et al. (2020), we found that the typical -band depths of dip-A for the corresponding seasons, namely and , from our measurements fulfill Eqn. 5 within their 1 uncertainties. Hence, we cannot rule out this scenario for dip-A.
A precessing Jovian planet and a dust clump were the remaining explanations for dip-B. However, the planet hypothesis faces some difficulties, namely the proposed changing inclination with a period of d is based on the proclaimed detection of dip-B on 2018 November 09, which we cannot confirm with our observations of season 2018/2019 in Fig. 13. We stress that the presumable planet was never confirmed by detections, but a planet scenario was just consistent with non-detections. Furthermore, dip-B seems to be in 2015/2016 typically twice as deep in comparison to other seasons from our follow-up observations. This feature makes a precessing planet even more questionable. Testing the dust clump hypothesis with the derived , and from Tanimoto
et al. (2020), shows that these values fit with our observed depths of and for season 2014/2015 and 2017/2018, respectively within 2 . However, they are slightly outside the 3 interval for the average depth in season 2015/2016 in the -band.
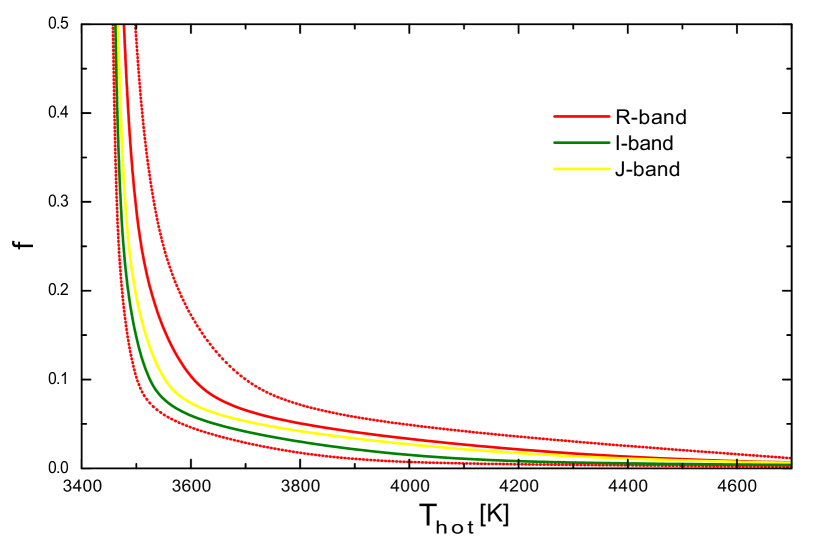
Dip-C is considered to be either an accretion hotspot or also a circumstellar dust clump. The rotational axis of the star has to be inclined for the hotspot scenario, so that the accreating hotspot, which is brighter than the typical surface area of CVSO 30, is not visible for the observer during the fading event. The flux depth of a fading event at any wavelength, can therefore be described as
| (6) |
where is the filling factor and the temperature of the hotspot (Tanimoto et al., 2020). represents the effective temperature of the star and is the brightness for blackbody radiation at a particular wavelength. We use the variables and to create the contour map for our observed dimming events of dip-C and those given in Tanimoto et al. (2020). The average depths in all filters are consistent with each other within uncertainties as illustrated in Fig. 5. On the other hand, the average depth of in the -band also satisfies the values , and for a possible circumstellar dust clump within 3 . Hence, we can neither exclude the hotspot nor the dust clump scenario for dip-C based on the -band photometry.
We have additionally checked if dip-C was detected before 2018 and could be a secondary eclipse of dip-B. The light curves in Raetz et al. (2016) sufficiently cover multiple times the phase of between 2011 and 2013. During this span of time no fading event of dip-C was detected and therefore, we can exclude this hypothesis.
5.2 Comparison with cluster members
We used the recently published data from the Early Data Release 3 of the ESA-Gaia Mission (Gaia EDR3, Gaia Collaboration, 2020) to identify members of the 25 Ori cluster and compare them to CVSO 30. Therefore, we searched around its prominent member, namely the star 25 Ori, within a radius of 61 arcmin for cluster members based on parallax () and proper motion (). This search radius takes into account the assumption, that stellar clusters have typical radii up to 5 pc (Unsöld & Baschek, 2005), which corresponds to arcmin based on the parallax value of 2.9321 mas for the star 25 Ori in Gaia EDR3. We added further 10 arcmin to this radius, in order not to miss a potential cluster member.
Thereby only sources with significant detected parallaxes and proper motions were taken into account. The cluster shows an accumulation at mas within the cumulative distribution function and a common proper motion of mas/yr in right ascension, but no significant movement towards declination mas/yr. We used at next only stars within sufficiently large intervals around these measurements and performed sigma clipping to identify the most probable cluster members. In total, 239 objects were identified which exhibit on average mas and mas/yr, while no significant proper motion in declination ( mas/yr) is detectable.
Based on the photometry of Gaia EDR3, together with distances from Bailer-Jones et al. (2021) and interstellar extinction from the dust maps of Green et al. (2019), we create the colour-magnitude diagram (CMD) of the 25 Ori cluster as illustrated in Fig. 6. The extinction values were converted into the required pass bands using the relations of Wang & Chen (2019).
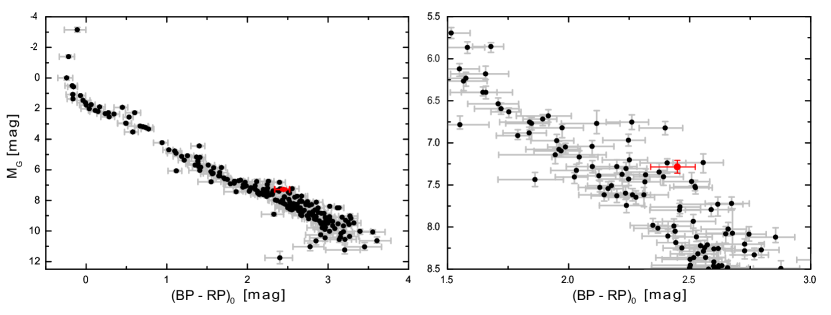
Here, we can confirm the results of Koen (2020) and Bouma et al. (2020) that CVSO 30 is about 0.75 mag brighter than the typical cluster member with comparable colour. This is an indication that CVSO 30 can be a binary consisting of stellar components with comparable brightness. In this case, we have to modify from Table 4 into mag for a single star and following the above procedure, the resulting radius of one stellar component is R⊙.
If CVSO 30 is a binary, we might see it either nearly perpendicular to its orbital plane and/or it is a long periodic one, due to the fact that this object shows no line change in radial velocity (van Eyken
et al., 2012; Ciardi
et al., 2015; Kounkel
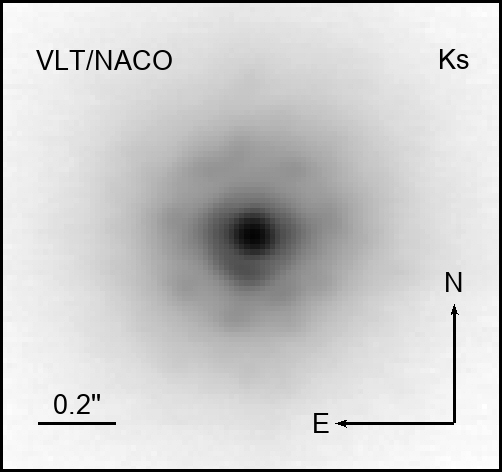
et al., 2019). We used high-resolution direct imaging data with adaptive optics of CVSO 30 from the ESO archive to estimate an upper limit on the possible separation, if CVSO 30 consists of two equally bright stars. The target was observed with NACO at ESO’s VLT on December 03 2012 in jitter mode, using a jitter-width of 4 arcsec, and the data were presented first in Schmidt
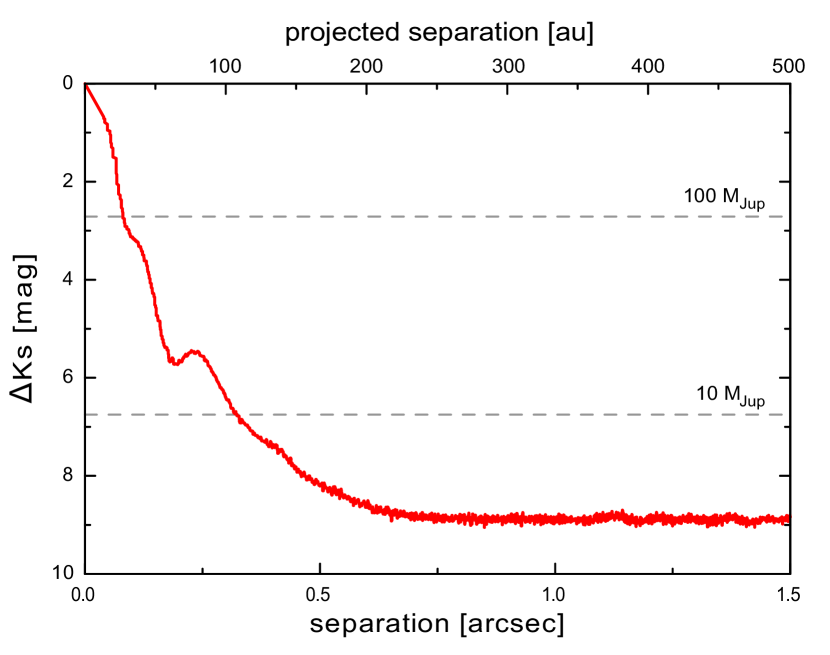
et al. (2016). According to the ESO ambient conditions database444www.archive.eso.org/cms/eso-data/ambient-conditions.html the average DIMM seeing was arcsec and the average coherence time of the atmospheric fluctuations was ms during the s-band observations.
The recorded data contain 15 cubes, each consisting of 4 images with an individual integration time of 15 s. The frames were flatfielded with internal lamp flats, using the software package ESO ECLIPSE555https://www.eso.org/sci/software/eclipse/ (Devillard, 1997). We show the reached detection limit for the s-band image of CVSO 30 in Fig. 7. The PSF of the star does not exhibit significant elongation in any direction, as illustrated in Fig. 8. It exhibits a FWHM of . Adopting the pixel scale mas/px from Schmidt
et al. (2016), this corresponds to mas. The diffraction limit of the 8.2 m VLT in the s-band is about mas.
In order to test, at which separation an equally bright companion can be detected, we shifted the fully reduced image pixel by pixel, averaged it with the original frame and fit a two dimensional Gaussian function with ESO-MIDAS (European
Southern Observatory, 2013). The artificial PSF becomes clearly elongated for equal bright sources with an angular separation larger mas. This is in good agreement with Mugrauer &
Ginski (2015), where they have detected a close binary companion of the exoplanet host star HD 142245 with NACO in the s-band. That binary shows a clearly elongated PSF and an average separation of about mas of its components.
Therefore, in our case a possible equal bright binary would have to be within a separation of 40 mas in order to have not been detected within the observations of CVSO 30. Based on this separation and a distance of pc (Bailer-Jones et al., 2021), we expect an upper limit of the orbital period of about 50 yr for the CVSO 30 system, assuming a total mass of 1 M☉ (corresponding to two times the mass given in Table 4). Additional observations are necessary to further constrain this upper limit, such as high-resolution follow-up spectroscopy or interferometric observations of CVSO 30 in the upcoming decades, as proposed by Koen (2020).
Otherwise, it might be also possible that CVSO 30 is redder ( mag) than the typical cluster member. For a given mass, increasing metallicity shifts the stellar flux from the visual wavelengths range towards the infrared (Bonfils et al., 2005; Mann et al., 2015). Therefore, we searched for information regarding the metallicity of the 25 Ori members. The catalog of Anders et al. (2019) contains 39 cluster stars, which are located in the CMD within CVSO 30’s uncertainties. These stars have a median metallicity of dex, which is consistent with CVSO 30 (see Table 4) within the standard deviation. Therefore, metallicity cannot explain the offset of CVSO 30 within the CMD. If CVSO 30 is actually redder than the other member stars, it needs an additional source, which contributes to the flux in the red wavelengths. This could be an orbiting co-rotating glowing cloud, that shows significant Hα emission. We consider the possibility of this scenario in section 6.
6 Discussion and conclusion
In this article we presented our follow-up photometric observations of the controversial discussed star CVSO 30, which was intensively monitored and analyzed during the last decade, but still misses a clear explanation for its periodically dimming events. Our original YETI monitoring campaign of CVSO 30 started in 2010 (Raetz et al., 2016) and this is the continuation, which yields observations since fall 2014 that focused on the predicted time slots of the fading events.
We characterized CVSO 30 with data of the mission and catalogs. Our derived value of R☉ for its radius lies above those given in Briceño et al. (2005) (1.39 R☉) and Koen (2020) (1.41 R☉), but is consistent with them within . In contrast, our radius does not fit the R☉ from Tanimoto et al. (2020).
The different dimming events, dip-A, dip-B and dip-C, reported in Tanimoto et al. (2020) can be confirmed with our -band observations. All three dips seem to have the same period but are phase shifted as illustrated in Fig. 1. Dip-A was detected by us in all nights if the observing window included the phase of according to the ephemeris in Eqn. 4, while dip-B, e.g., was not present on January 5, 2017. Dip-A and dip-B were detected last in November 2017 and since then no more, as presented in the following light curves in appendix A. That contradicts the detection of dip-B on 09 November 2018 by Tanimoto et al. (2020), because we have recorded the immediately following epoch without any fading event. Dip-A showed sometimes a "v"-shaped profile and then in other epochs a "u"-profile, as illustrated in Fig. 2. The same also applies to dip-B.
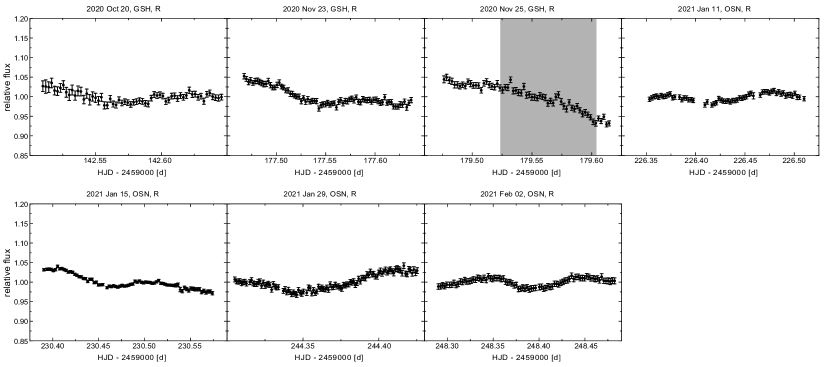
Dip-C was found first by Tanimoto et al. (2020) in autumn 2018. The first successful observation in our data set was in October 2020. Five further detections followed until February 2021. All light curves of dip-C yield "u"-shape like minima.
For all three dips no clear trend was detectable in depth or duration, taking into account the entire period of the follow-up observations.
A circumstellar dust clump, consisting of an opaque core and a optically thin halo, cannot be excluded as cause for all dimming events based on their depths in the -band and infrared. The existence of these clumps could be temporally limited and therefore explain the disappearance of dip-A and dip-B. As a result thereof, additional observations of dip-C in upcoming seasons are necessary to investigate whether this dip might vanish too.
However, such a theoretical clump would orbit around CVSO 30 at a distance of au and have to face temperatures of K. The expected condition at this location is above the sublimation temperatures for olivine, pyroxene, obsidian, iron, ice and carbon, which were derived based on Kobayashi et al. (2011). Therefore, the clump will probably consists of gas rather than dust, which could be problematic for the interpretation by Grosson &
Johns-Krull (2021). A gas cloud would fit better to a weak-line T Tauri star, because dust would have resulted into an infrared excess. Weak-line T Tauri stars have no or only an optically thin disc. Building on this consideration, the flux dips happen when the glowing cloud orbits behind the star (Stauffer
et al., 2017; Jardine &
van Ballegooijen, 2005). A system with gas arranged in a circumstellar clumpy torus, could result from stellar winds at locations around the star where magnetic and gravitational forces are balanced (Jardine &
van Ballegooijen, 2005; Collier
Cameron & Robinson, 1989). In contrast, David
et al. (2017) have presented a scenario, where a cloud, containing a minor amount of dust within the gas, around the young M 2.5 dwarf star RIK-210 could cause dimming up to . This star shows variable dimming events with a period of d and the co-rotating orbit lies, as a result thereof, outside the sublimation distance. In the case of RIK-210 the dips would occur when the star is eclipsed by a dusty gas cloud.
Our case also involves co-rotating material, but we likely see secondary eclipses of light emitting gas. In this case, co-rotating plasma, which emits in a specific wavelength, causes the dimming events when it orbits behind the star and a reduced flux is measured (Palumbo et al., 2021). This orbiting plasma would also result in changes of the Hα emission line profile via Rositter-McLaughlin effect (RME) when it moves in front of the star’s disc as stated by Palumbo et al. (2021). This feature was not observed in the Hα measurements by Yu et al. (2015), who have recorded a set of spectra from CVSO 30 on 2013 December 12, which include the time of a photometric fading event. Their observations started/ended about 2 h before/after the minimum light and cover the timespan when the postulated glowing cloud would orbit behind the star. Therefore, a non-detection of the RME is well explainable with this scenario. Further Hα observations were presented by Johns-Krull et al. (2016). They have measured significant Hα excess emission within the spectra of CVSO 30, that changes its . The changing fits with the orbital period of the "companion". However, the measured s of the excess emission are often shifted in comparison to the predicted velocities (see Fig. 9 in Johns-Krull et al., 2016) based on the ephemeris by van Eyken et al. (2012). Furthermore, the strength of the detected Hα excess is too large (about of the stellar equivalent width) to be caused by a single planet and needs an extended additional luminous volume, which surrounds it (Johns-Krull et al., 2016). All these observed features fit well with a co-rotating glowing cloud, which significantly emits flux in the optical -band. David et al. (2017) stated that those clouds, consisting of partially ionized gas, can cause dimming events up to a few percents when they move behind the star and the cloud’s glowing could be the result of Paschen-continuum bound-free emission. The existence of partially ionized gas which emits in Hα is quite possible even at relatively low temperatures such as K (Rodríguez-Barrera et al., 2015).
Stauffer et al. (2017, 2018, 2021) had analyzed a sample of photometric variable mid-to-late type M dwarfs in star-forming regions without signs of active accretion. These targets are rapidly rotating weak-line T Tauri stars with photometric periods shorter than one day. A subgroup of this sample are the "stars with persistent flux dips", which additionally show two to four discrete flux dips in their phased light curve, with deepest depths of and durations ranging between 1 h and 5 h. Their depths are largely stable but can suddenly disappear or become significantly weaker. Those changes in depth were observed after the detection of flare-like events. Similar fast rotating young M-dwarfs were found by Zhan et al. (2019). We detected some flare-like signals within our observations and they occurred after the last significant detection of dip-A and dip-B as illustrated in Fig. 1. Similar signatures can be found within the presented light curves in Fig. 2 and Fig. 5 in van Eyken et al. (2012), which contain observations from 26 Dec 2009, 01 Jan 2010, 07 Jan 2010 and 09 Feb 2011. The scenario of Stauffer et al. (2017, 2018, 2021) has the flexibility to explain the dis- and reappearance of the dimming events by changes in the geometry of the cloud without relying on active accretion. CVSO 30 shows the same characteristics in its light curve as the stars in Stauffer et al. (2017, 2018, 2021) and is also similar to the detected features in the light curve of TIC 234284556 (Palumbo et al., 2021). Therefore, the dimming events could originate from the currently not well understood process of gas tori around young M dwarfs. Dip-A, -B and -C seem to have the same orbital period, which is why their origin should have also the same distance to the star. This is a further indication for the theory of emitted light from magnetospheric clouds. Furthermore, the measured depth in Table 5 would be the result of a secondary transit and consequently
| (7) |
where represents the stellar flux and the flux of the cloud. According to Stefan-Boltzmann law for the single star or for the binary scenario, respectively.
We consider it well possible that flares due to reconnection of magnetic field lines and plasma tubes also lead to a reconfiguration of spots and groups of spots on the surface, which potentially affect the optical light curve. A strong X-ray flare in CVSO 30’s light curve is reported in Czesla et al. (2019), where they have found no significant transit-induced variation within the expected time slot. That makes an orbiting planet even more questionable. The bell like shape of the X-ray flare may also be owing to an accretion episode of CVSO 30. That fits with Yu et al. (2015), who came to the conclusion that CVSO 30 may be weakly accreting based on their measured strength and breadth of the Hα line profile.
Koen (2021) presents a model, where CVSO 30 is considered to be a binary and the variability is the result of stellar spots. From pure statistics the model can reproduce the detected variations inside the TESS photometry, but the assumed filling factors e.g. for norm-2 models are very large and are based only on measurements in one filter. The detected fading events by TESS are dip-C according to Fig. 1, for which Tanimoto
et al. (2020) had already ruled out the cool star spot scenario based on their multi-band photometry. The two different (apparent rotation) periods within the light curve of CVSO 30 (Bouma et al., 2020; Koen, 2020) could also be caused by two spots of different latitudes, if the star (i.e. just one star) rotates differentially. Reinhold
et al. (2013) and Reinhold &
Gizon (2015) showed that the relative shear increases with rotation period, by analyzing thousands of stars from the -mission (Koch et al., 2010). That fits with the two short-periodic signals of CVSO 30, which are close together in time.
To sum up the results of our monitoring campaign, we confirm the detection by Tanimoto et al. (2020) of three phase shifted dimming events in the light curve of CVSO 30 with our photometric data between 2014 and 2021. Dip-A and dip-B were detected by us last in autumn 2017 and seem to have been vanished since then, while another dip-C was found after that, shifted in phase at about . A Jovian planet as cause for the dimming events is unlikely, because of the colour effects of the transit depths and their disappearance within relatively short timescales. We agree with Bouma et al. (2020) that orbiting clouds of gas at a Keplerian co-rotating radius are the most promising scenario to explain most changes in CVSO 30’s light curve, because it does not need active accretion from a circumstellar disc and a changing shape of the dimming events can result from changes in the cloud’s geometry. However, we consider that also stellar spots and at least some accretion seems to be going on CVSO 30. Nevertheless, further follow-up observations are necessary to find out if more flare-like events occur in the future, right before changes of dip-C can be detected. Furthermore, additional high-resolution spectroscopy and interferometric follow-up observations should be done to test CVSO 30’s multiplicity status as proposed by Koen (2020).
Acknowledgements
This work is based on observations obtained with telescopes of the University Observatory Jena, operated by the Astrophysical Institute of the Friedrich-Schiller-Universität Jena. We thank B. Baghdasaryan, N. Belko, S. Buder, M. Dadalauri, M. Geymeier, H. Gilbert, A. Gonzalez, F. Hildebrandt, H. Keppler, O. Lux, S. Masda, P. Protte, J. Trautmann, A. Trepanowski, and S. Schlagenhauf, who have been involved in some observations of this project, obtained at the University Observatory Jena.
This research was partly based on data obtained at the 1.5 m telescope of the Sierra Nevada Observatory (Spain), which is operated by the Consejo Superior de Investigaciones Científicas (CSIC) through the Instituto de Astrofísica de Andalucía. We thank J.F.Aceituno and V.Casanova for their help with the observations.
This publication is partly based on observations made with ESO Telescopes at the La Silla Paranal Observatory under programme ID 090.C-0448(A).
RB, RN and MM acknowledge the support of the DFG priority program SPP 1992 "Exploring the Diversity of Extrasolar Planets" in projects NE 515/58-1 and MU 2695/27-1.
We acknowledge financial support from the Spanish Agencia Estatal de Investigación of the Ministerio de Ciencia, Innovación y Universidades and the ERDF through projects PID2019-109522GB-C52 and AYA2016-79425-C3-3-P, and the Centre of Excellence "Severo Ochoa" award to the Instituto de Astrofísica de Andalucía (SEV-2017-0709).
We thank R. Errmann for developing and providing the photometry routine "automat.py" and also C. Broeg his program "PHOTOMETRY".
This publication makes use of data products of the SIMBAD and VizieR databases, operated at CDS, Strasbourg, France. We also thank the Gaia Data Processing and Analysis Consortium of the European Space Agency (ESA) for processing and providing the data of the Gaia mission. We thank the MAST portal for providing the TESS photometric results and the MESA Isochrones & Stellar Tracks website for the bolometric correction tables.
We thank the referee for helpful comments, which improved our manuscript.
Data Availability
The data underlying this article are available in this manuscript. The detrended (if applicable) and also the original photometric measurements of all light curves are provided as online supplementary material.
References
- Anders et al. (2019) Anders F., et al., 2019, A&A, 628, A94
- Bailer-Jones et al. (2021) Bailer-Jones C. A. L., Rybizki J., Fouesneau M., Demleitner M., Andrae R., 2021, AJ, 161, 147
- Baraffe et al. (2015) Baraffe I., Homeier D., Allard F., Chabrier G., 2015, A&A, 577, A42
- Barnes et al. (2013) Barnes J. W., van Eyken J. C., Jackson B. K., Ciardi D. R., Fortney J. J., 2013, ApJ, 774, 53
- Bertin & Arnouts (1996) Bertin E., Arnouts S., 1996, A&AS, 117, 393
- Bonfils et al. (2005) Bonfils X., Delfosse X., Udry S., Santos N. C., Forveille T., Ségransan D., 2005, A&A, 442, 635
- Bouma et al. (2020) Bouma L. G., et al., 2020, AJ, 160, 86
- Brát et al. (2010) Brát L., Poddaný S., Pejcha O., Zejda M., 2010, in Prša A., Zejda M., eds, Astronomical Society of the Pacific Conference Series Vol. 435, Binaries - Key to Comprehension of the Universe. p. 443
- Briceño et al. (2005) Briceño C., Calvet N., Hernández J., Vivas A. K., Hartmann L., Downes J. J., Berlind P., 2005, AJ, 129, 907
- Broeg et al. (2005) Broeg C., Fernández M., Neuhäuser R., 2005, Astronomische Nachrichten, 326, 134
- Cardelli et al. (1989) Cardelli J. A., Clayton G. C., Mathis J. S., 1989, ApJ, 345, 245
- Ciardi et al. (2015) Ciardi D. R., et al., 2015, ApJ, 809, 42
- Claret & Bloemen (2011) Claret A., Bloemen S., 2011, A&A, 529, A75
- Collier Cameron & Robinson (1989) Collier Cameron A., Robinson R. D., 1989, MNRAS, 236, 57
- Czesla et al. (2019) Czesla S., Schneider P. C., Salz M., Klocová T., Schmidt T. O. B., Schmitt J. H. M. M., 2019, A&A, 629, A5
- David et al. (2017) David T. J., et al., 2017, ApJ, 835, 168
- Devillard (1997) Devillard N., 1997, The Messenger, 87, 19
- Eastman et al. (2010) Eastman J., Siverd R., Gaudi B. S., 2010, PASP, 122, 935
- Errmann (2016) Errmann R., 2016, PhD dissertation, Friedrich-Schiller-Universität Jena, Germany
- Errmann et al. (2014) Errmann R., et al., 2014, Astronomische Nachrichten, 335, 345
- European Southern Observatory (2013) European Southern Observatory 2013, ESO-MIDAS: General tools for image processing and data reduction (ascl:1302.017)
- Gaia Collaboration (2020) Gaia Collaboration 2020, VizieR Online Data Catalog, p. I/350
- Green et al. (2019) Green G. M., Schlafly E., Zucker C., Speagle J. S., Finkbeiner D., 2019, ApJ, 887, 93
- Grosson & Johns-Krull (2021) Grosson T. A., Johns-Krull C. M., 2021, Research Notes of the American Astronomical Society, 5, 264
- Huang et al. (2019) Huang P. C., et al., 2019, ApJ, 871, 183
- Jardine & van Ballegooijen (2005) Jardine M., van Ballegooijen A. A., 2005, MNRAS, 361, 1173
- Johns-Krull et al. (2016) Johns-Krull C. M., et al., 2016, ApJ, 830, 15
- Kobayashi et al. (2011) Kobayashi H., Kimura H., Watanabe S. i., Yamamoto T., Müller S., 2011, Earth, Planets and Space, 63, 1067
- Koch et al. (2010) Koch D. G., et al., 2010, ApJ, 713, L79
- Koen (2015) Koen C., 2015, MNRAS, 450, 3991
- Koen (2020) Koen C., 2020, MNRAS, 494, 4349
- Koen (2021) Koen C., 2021, A&A, 647, L1
- Kounkel et al. (2018) Kounkel M., et al., 2018, AJ, 156, 84
- Kounkel et al. (2019) Kounkel M., et al., 2019, AJ, 157, 196
- Mann et al. (2015) Mann A. W., Feiden G. A., Gaidos E., Boyajian T., von Braun K., 2015, ApJ, 804, 64
- Mugrauer & Berthold (2010) Mugrauer M., Berthold T., 2010, Astronomische Nachrichten, 331, 449
- Mugrauer & Ginski (2015) Mugrauer M., Ginski C., 2015, MNRAS, 450, 3127
- Neuhauser et al. (1997) Neuhauser R., Torres G., Frink S., Covino E., Alcala J. M., 1997, Mem. Soc. Astron. Italiana, 68, 1061
- Neuhäuser et al. (2011) Neuhäuser R., et al., 2011, Astronomische Nachrichten, 332, 547
- Onitsuka et al. (2017) Onitsuka M., Fukui A., Narita N., Hirano T., Kusakabe N., Ryu T., Tamura M., 2017, PASJ, 69, L2
- Ortiz et al. (2006) Ortiz J. L., Gutiérrez P. J., Santos-Sanz P., Casanova V., Sota A., 2006, A&A, 447, 1131
- Palumbo et al. (2021) Palumbo E. K., Montet B. T., Feinstein A. D., Bouma L. G., Hartman J. D., Hillenbrand L. A., Gully-Santiago M. A., Banks K. A., 2021, arXiv e-prints, p. arXiv:2107.05649
- Poddaný et al. (2010) Poddaný S., Brát L., Pejcha O., 2010, New Astron., 15, 297
- Prša et al. (2016) Prša A., et al., 2016, AJ, 152, 41
- Queiroz et al. (2020) Queiroz A. B. A., et al., 2020, A&A, 638, A76
- Raetz et al. (2016) Raetz S., et al., 2016, MNRAS, 460, 2834
- Reinhold & Gizon (2015) Reinhold T., Gizon L., 2015, A&A, 583, A65
- Reinhold et al. (2013) Reinhold T., Reiners A., Basri G., 2013, A&A, 560, A4
- Ricker et al. (2015) Ricker G. R., et al., 2015, Journal of Astronomical Telescopes, Instruments, and Systems, 1, 014003
- Rodríguez-Barrera et al. (2015) Rodríguez-Barrera M. I., Helling C., Stark C. R., Rice A. M., 2015, MNRAS, 454, 3977
- Schmidt et al. (2016) Schmidt T. O. B., et al., 2016, A&A, 593, A75
- Siwak et al. (2019) Siwak M., Dróżdż M., Gut K., Winiarski M., Ogłoza W., Stachowski G., 2019, Acta Astron., 69, 227
- Stauffer et al. (2017) Stauffer J., et al., 2017, AJ, 153, 152
- Stauffer et al. (2018) Stauffer J., et al., 2018, AJ, 155, 63
- Stauffer et al. (2021) Stauffer J., et al., 2021, AJ, 161, 60
- Tanimoto et al. (2020) Tanimoto Y., et al., 2020, PASJ, 72, 23
- Tody (1993) Tody D., 1993, in Hanisch R. J., Brissenden R. J. V., Barnes J., eds, Astronomical Society of the Pacific Conference Series Vol. 52, Astronomical Data Analysis Software and Systems II. p. 173
- Unsöld & Baschek (2005) Unsöld A., Baschek B., 2005, Der neue Kosmos. Einführung in die Astronomie und Astrophysik, 7 edn. Springer-Verlag, Berlin, Heidelberg, New York
- Wang & Chen (2019) Wang S., Chen X., 2019, ApJ, 877, 116
- Yu et al. (2015) Yu L., et al., 2015, ApJ, 812, 48
- Zhan et al. (2019) Zhan Z., et al., 2019, ApJ, 876, 127
- van Eyken et al. (2012) van Eyken J. C., et al., 2012, ApJ, 755, 42
Appendix A Light curves and results of the transit fitting

| Epoch | Date | orbit phase | |||
|---|---|---|---|---|---|
| Dip-A | |||||
| 3146 | 2014 Oct 23 | ||||
| 3155 | 2014 Oct 28 | ||||
| 3175 | 2014 Nov 06 | ||||
| 3393 | 2015 Feb 11 | ||||
| 4009 | 2015 Nov 14 | ||||
| 4020 | 2015 Nov 19a | ||||
| 4027 | 2015 Nov 23 | ||||
| 4187 | 2016 Feb 02 | ||||
| 4941 | 2017 Jan 05 | ||||
| 4981 | 2017 Jan 23 | ||||
| 5597 | 2017 Oct 27 | ||||
| 5637 | 2017 Nov 13 | ||||
| 5657 | 2017 Nov 22b | ||||
| 5657 | 2017 Nov 22c | ||||
| Dip-B | |||||
| 3146 | 2014 Oct 23 | ||||
| 3155 | 2014 Oct 28 | ||||
| 3253 | 2014 Dec 11 | ||||
| 4009 | 2015 Nov 14 | ||||
| 4020 | 2015 Nov 19a | ||||
| 4027 | 2015 Nov 23 | ||||
| 4187 | 2016 Feb 02 | ||||
| 5597 | 2017 Oct 27 | ||||
| 5637 | 2017 Nov 13 | ||||
| Dip-C | |||||
| 8026 | 2020 Oct 20 | ||||
| 8104 | 2020 Nov 23 | ||||
| 8213 | 2021 Jan 11 | ||||
| 8222 | 2021 Jan 15 | ||||
| 8253 | 2021 Jan 29 | ||||
| 8262 | 2021 Feb 02 |
a clear filter, b OSN, c GSH