Cosmological Fast Optical Transients with the Zwicky Transient Facility:
A Search for Dirty Fireballs
Abstract
Dirty fireballs are a hypothesized class of relativistic massive-star explosions with an initial Lorentz factor below the required to produce a long-duration gamma-ray burst (LGRB), but which could still produce optical emission resembling LGRB afterglows. Here we present the results of a search for on-axis optical afterglows using the Zwicky Transient Facility (ZTF). Our search yielded seven optical transients that resemble on-axis LGRB afterglows in terms of their red colors (mag), faint host galaxy (mag), and rapid fading (mag ). Spectroscopy of the transient emission within a few days of discovery established cosmological distances (redshift to 2.9) for six events, tripling the number of afterglows with redshift measurements discovered by optical surveys without a -ray trigger. A likely associated LGRB (GRB 200524A, GRB 210204A, GRB 210212B, GRB 210610B) was identified for four events (ZTF 20abbiixp/AT 2020kym, ZTF 21aagwbjr/AT 2021buv, ZTF 21aakruew/AT 2021cwd, ZTF 21abfmpwn/AT 2021qbd) post facto, while three (ZTF 20aajnksq/AT 2020blt, ZTF 21aaeyldq/AT 2021any, ZTF 21aayokph/AT 2021lfa) had no detected LGRB counterpart. The simplest explanation for the three “orphan” events is that they were regular LGRBs missed by high-energy satellites owing to detector sensitivity and duty cycle, although it is possible that they were intrinsically subluminous in -rays or viewed slightly off-axis. We rule out a scenario in which dirty fireballs have a similar energy per solid angle to LGRBs and are an order of magnitude more common. In addition, we set the first direct constraint on the ratio of the opening angles of the material producing -rays and the material producing early optical afterglow emission, finding that they must be comparable.
1 Introduction
Decades of observations of long-duration -ray bursts (LGRBs) and their associated afterglows have revealed that in the deaths of some massive () stripped-envelope stars, the newborn compact object can couple erg of energy to ultrarelativistic (initial Lorentz factor ) material, and that this phenomenon preferentially occurs in low-metallicity environments (Kouveliotou et al., 2012). In the traditional LGRB model (Piran, 2004; Mészáros, 2006; Kumar & Zhang, 2015), the outflow is collimated into a jet a few degrees wide as it tunnels through the star. Viewed on-axis, the observer sees a seconds-long burst of -rays from collisions within the jet, then emission from X-ray to radio wavelengths called the “afterglow” (Mészáros & Rees, 1997; Sari et al., 1998; van Paradijs et al., 2000; Panaitescu & Kumar, 2002; Greiner et al., 2011) on timescales of minutes to years. Thousands of afterglows have been detected to date111https://www.mpe.mpg.de/~jcg/grbgen.html, almost all in targeted follow-up observations of discoveries by GRB satellites such as the High Energy Transient Explorer 2 (HETE-2; Ricker et al. 2003), Fermi (Meegan et al., 2009), and Swift (Gehrels et al., 2004).
Despite the significant progress made by LGRB discoveries, many important questions cannot be answered by relying on existing -ray satellites to discover relativistic outflows from collapsing stars. In particular, the rate and angular structure of LGRB jets are unknown in large part because observed LGRBs are viewed almost entirely on-axis (or close to on-axis; Ryan et al. 2015), with only a few suggested exceptions (Huang et al., 2004; Ramirez-Ruiz et al., 2005; Butler et al., 2005; Krühler et al., 2009). Relatedly, it is unknown whether ultrarelativistic speeds, which can only be attained with very small amounts of matter entrained in the jet (“low mass-loading”), are central to the phenomenon. It has been hypothesized that mass-loaded jets (“dirty fireballs;” Paczyński 1998; Dermer et al. 1999) are more common (Huang et al., 2002), but have gone unnoticed because their emission peaks at energies below the range of -ray detectors (Dermer et al., 1999), instead appearing as X-ray flashes (Heise et al., 2001; Zhang et al., 2004; Sakamoto et al., 2005; Soderberg et al., 2007).
A promising approach to answering the above questions is to find relativistic outflows via their afterglow emission, without relying on a trigger from a -ray satellite. Assuming that dirty fireballs result in successful relativistic outflows with a similar energy per solid angle to that of LGRBs, they should produce luminous and rapidly fading optical afterglows (Huang et al., 2002; Rhoads, 2003). The afterglows from clean or dirty fireballs viewed off-axis () will eventually become visible to the observer as the jet decelerates and expands sideways, often referred to as “orphan” afterglows (Rhoads, 1997; Perna & Loeb, 1998; Dalal et al., 2002; Granot et al., 2002; Nakar et al., 2002; Totani & Panaitescu, 2002). For a structured jet (see Granot & Ramirez-Ruiz 2010 for an overview), orphan afterglows could also be detected from jets viewed within the initial opening angle of relativistic material, but outside the narrow high-Lorentz factor region emitting -rays; such events have been referred to as “on-axis orphans” (Nakar & Piran, 2003).
Finding optical afterglows without a GRB trigger is a longstanding goal of transient surveys, and prior to the Zwicky Transient Facility (ZTF; Bellm et al. 2019a; Graham et al. 2019) had only been achieved three times. Searches at X-ray (Grindlay, 1999; Greiner et al., 2000; Khabibullin et al., 2012), optical (Rau et al., 2006; Berger et al., 2013; Ho et al., 2018; Huang et al., 2020), and radio (Levinson et al., 2002; Gal-Yam et al., 2006) wavelengths have to contend with a large false-positive rate, particularly from stellar flares at optical and X-ray wavelengths, and from active galactic nuclei (AGNs) at radio wavelengths. Nonetheless, two confirmed optical afterglows were serendipitously discovered via fading broadband afterglow emission: iPTF14yb (Cenko et al., 2015) and ATLAS17aeu (Stalder et al., 2017; Bhalerao et al., 2017; Melandri et al., 2019) were discovered by the Palomar Transient Factory (Law et al., 2009) and the ATLAS survey (Tonry et al., 2018), respectively, with LGRB counterparts discovered post facto. A third optical event, PTF11agg (Cenko et al., 2013), resembled a GRB afterglow (rapidly fading optical emission, a long-lived scintillating radio counterpart, coincidence with a dwarf galaxy) yet had no identified high-energy counterpart, leading to suggestions that it might be a dirty fireball.
In the last few years, with the enhanced survey speed (Bellm, 2016; Ofek & Ben-Ami, 2020) of ZTF, the discovery of optical afterglows without a GRB trigger has become routine. As we discuss in this paper, ten afterglows have been discovered to date using ZTF data, five from the year 2021 alone. Most were identified by human scanners within 12 hr of the first ZTF detection, through dedicated searches for fast optical transients that make use of the transient’s rise rate, fade rate, color, and contextual information such as the host galaxy (Ho et al., 2020b; Andreoni et al., 2020a, 2021). .
We describe our search strategy and give an overview of the sample in §2. In §3 we compare the multiwavelength properties of the ZTF afterglows to the cosmological LGRB population. §4 discusses the implications for dirty fireballs, jet collimation, and the prevalence of relativistic jets in collapsing massive stars. We summarize in §5 and discuss how to make future progress.
Throughout the paper we use the term “afterglow” to refer to cosmological fast optical transients whose observed properties strongly resemble those of GRB afterglows. In addition, for brevity we use the term “orphan afterglow” to refer to afterglows with no associated detected GRB. However, as discussed in §3.2, an associated LGRB cannot be ruled out, so a more precise term would be “apparently orphan.” We use “on-axis” to refer to a viewing angle that is within the opening angle of the initial relativistic material.
We assume a flat CDM cosmology with H and (Planck Collaboration et al., 2016). Times are presented in UTC, and magnitudes are given in AB (Oke & Gunn, 1983). The optical photometry and spectroscopy will be made public through WISeREP, the Weizmann Interactive Supernova Data Repository (Yaron & Gal-Yam, 2012).
2 Observations
2.1 ZTF
The ZTF custom mosaic camera (Dekany et al., 2020) is mounted on the 48-inch Samuel Oschin Telescope (P48) at Palomar Observatory. As summarized by Bellm et al. (2019b), during Phase I (ZTF-I; ) observing time was divided between public (40%), partnership (40%), and Caltech (20%) surveys. During ZTF-II it is 50% public and 30% partnership. Three custom filters are used (, , and ; hereafter , , and , respectively; Dekany et al. 2020) and images reach a typical dark-time limiting magnitude of mag.
Images are processed and reference-subtracted by the IPAC ZTF pipeline (Masci et al., 2019) using the Zackay et al. (2016) image-subtraction algorithm. Every 5 point-source detection is saved as an “alert.” Alerts are distributed in Avro format (Patterson et al., 2019) and can be filtered based on a machine-learning real-bogus metric (Mahabal et al., 2019; Duev et al., 2019); host-galaxy characteristics, including a star-galaxy classifier (Tachibana & Miller, 2018); and light-curve properties. During ZTF-I the collaboration used a web-based system called the GROWTH marshal (Kasliwal et al., 2019) to identify, monitor, and coordinate follow-up observations for transients of interest. In ZTF Phase II (ZTF-II; 2020–present) the collaboration uses the Fritz marshal (van der Walt et al., 2019; Duev et al., 2019).
Four events were discovered as part of high-cadence (HC) observations — either the high-cadence partnership survey, which covered 2500 deg2 with six visits per night (three in band and three in band), or the ZTF Uniform Depth Survey (ZUDS222https://github.com/zuds-survey/zuds-pipeline), which covered 2500 deg2 with six visits per night (2, 2, and 2). Three events were discovered in one-day cadence data, including two from public observations shadowing the Transiting Exoplanet Survey Satellite (TESS; Ricker et al. 2014) fields (van Roestel et al., 2019). Finally, two events were discovered as part of the public ZTF-II all-sky survey, which covers 15,000 in band and band every two nights.
2.2 Search Procedure
Every night, the ZTF alert stream is filtered by several independent pipelines to identify young or fast-evolving transients. In this paper we focus on events discovered via the approach described by Ho et al. (2020b) and Perley et al. (2021c). In short, basic cuts are applied to remove artifacts, asteroids, and stellar flares. Remaining transients are divided into several groups, including new transients (those with no detections prior to the current night). One of us (A.Y.Q.H., D.A.P., Y.Y.) visually inspects the new transients and determines whether any meet the following criteria for afterglows.
-
1.
A fast rise from the previous nondetection (mag ).
-
2.
Red colors (mag) expected from optically thin synchrotron radiation (see Ho et al. 2020b) or rapid intranight fading in a single band.
- 3.
Our search criteria evolved over time. Based on a strategy developed to discover afterglows in iPTF data (Ho et al., 2018), we initially searched for afterglows via rapid intranight fading. However, the intranight-fading approach has two limitations: it requires multiple observations per night in a single filter, and ZTF only obtains high-cadence observations across a few thousand square degrees of sky. In addition, when an afterglow is discovered it has already faded significantly, making spectroscopic follow-up observations more difficult. To discover afterglows earlier in their evolution and over a wider area of sky, we broadened our strategy to also include events that rapidly brighten (Ho et al., 2020b). This approach enabled us to discover two events in the two-day cadence all-sky public survey (AT 2021cwd and AT 2021lfa) that showed no significant fading in the ZTF data: in fact, each event had only one -band and one -band measurement in the alert stream. We discuss the possibilities enabled by discovering afterglows in the all-sky survey in §5.
a candidate is identified by the daily scanner, we check for associated GRBs, obtain follow-up observations to confirm the afterglow nature, and publicly announce the discovery of the transient. In most cases, we obtain deep imaging to measure the rate of fading and obtain a better constraint on the color. We primarily use the Liverpool Telescope (LT; Steele et al. 2004) owing to its sensitivity, robotic scheduling, and multiband capabilities. When LT is unavailable, we request observations with the Spectral Energy Distribution Machine (SEDM; Blagorodnova et al. 2018; Rigault et al. 2019) on the Palomar 60-inch telescope (P60; Cenko et al. 2006a) or the Growth-India Telescope (GIT). The latency from the first ZTF detection to the first epoch of follow-up imaging has ranged from 0.2 d to 0.9 d. For identifying an associated detected GRB, we search the archives of the third Interplanetary Network (IPN333http://www.ssl.berkeley.edu/ipn3/index.html), which consists of ten spacecraft that provide all-sky full-time monitoring for high-energy bursts. The most sensitive GRB detectors in the IPN are the Burst Alert Telescope (BAT; Barthelmy et al. 2005) onboard the Neil Gehrels Swift Observatory (Swift; Gehrels et al. 2004), the Gamma-ray Burst Monitor (GBM; Meegan et al. 2009) on the Fermi spacecraft, and the KONUS instrument on the Wind spacecraft (Konus-Wind; Aptekar et al. 1995). If a transient is confirmed to be rapidly fading, and has colors consistent with optically thin synchrotron radiation, we trigger X-ray observations with Swift and optical spectroscopy of the transient emission to measure its redshift. If a candidate is confirmed to be cosmological and is “orphan” (no GRB is found post facto), we trigger radio observations with the Very Large Array (VLA; Perley et al. 2011). The time from first ZTF detection to public announcement is typically 24 hr.
2.3 Overview of ZTF Afterglows
Pre-ZTF, three afterglows had been discovered using optical surveys: PTF11agg (Cenko et al., 2013), iPTF14yb (Cenko et al., 2015), and ATLAS17aeu (Stalder et al., 2017; Bhalerao et al., 2017). With ZTF, the number of optically discovered afterglows has increased from three (of which two had redshift measurements) to 13 (of which nine have redshift measurements).
| Name | R.A. | Decl. | IAU Name | Disc. Date | Disc. Mag. | Redshift | GRB | Ref. |
|---|---|---|---|---|---|---|---|---|
| (J2000) | (J2000) | (MJD) | (AB) | |||||
| PTF11agg | 08:22:17.195 | 21:37:38.26 | – | 55591.2203 | – | [1] | ||
| iPTF14yb | 14:45:58.01 | 14:59:35.1 | – | 56714.4289 | 1.9733 | 140226A | [2] | |
| ATLAS17aeu | 09:13:13.89 | 61:05:33.6 | – | 57758.4130 | 170105A | [3,4,5] | ||
| ZTF19abvizsw | 18:37:53.48 | 61:29:52.7 | AT 2019pim | 58728.1799 | 1.2596 | – | [6,7] | |
| ZTF20aajnksq | 12:47:04.87 | 45:12:02.3 | AT 2020blt | 58876.2801 | 2.9 | – | this work†; [8] | |
| ZTF20abbiixp | 14:12:10.33 | 60:54:19.0 | AT 2020kym | 58993.2863 | 1.256 | 200524A | this work; [9,10] | |
| ZTF20abtxwfx | 16:41:21.21 | 57:08:20.5 | AT 2020sev | 59079.2220 | Unknown | 200817A | [10] | |
| ZTF20acozryr | 02:48:44.31 | 12:08:14.1 | AT 2020yxz | 59157.3661 | 1.105 | 201103B | [10] | |
| ZTF21aaeyldq | 08:15:15.33 | 05:52:01.3 | AT 2021any | 59230.2916 | 2.5131 | – | this work; [11] | |
| ZTF21aagwbjr | 07:48:19.32 | 11:24:34.1 | AT 2021buv | 59249.2966 | 0.876 | 210204A | this work; [10] | |
| ZTF21aakruew | 10:24:42.15 | 11:36:40.9 | AT 2021cwd | 59257.3697 | Unknown | 210212B | this work; [12] | |
| ZTF21aayokph | 12:32:48.72 | 01:29:22.5 | AT 2021lfa | 59338.2325 | 1.0624 | – | this work; [13] | |
| ZTF21abfmpwn | 16:15:40.38 | 14:23:56.5 | AT 2021qbd | 59376.2325 | 1.1345 | 210610B | this work; [14] |
References. — [1] Cenko et al. (2013), [2] Cenko et al. (2015), [3] Stalder et al. (2017), [4] Bhalerao et al. (2017), [5] Melandri et al. (2019), [6] Perley et al. (2019a), [7] Kasliwal et al. (2020), [8] Ho et al. (2020b), [9] Ho et al. (2020a), [10] Andreoni et al. (2021), [11] Ho et al. (2021b), [12] Yao et al. (2021c), [13] Yao et al. (2021b), [14] Perley et al. (2021b)
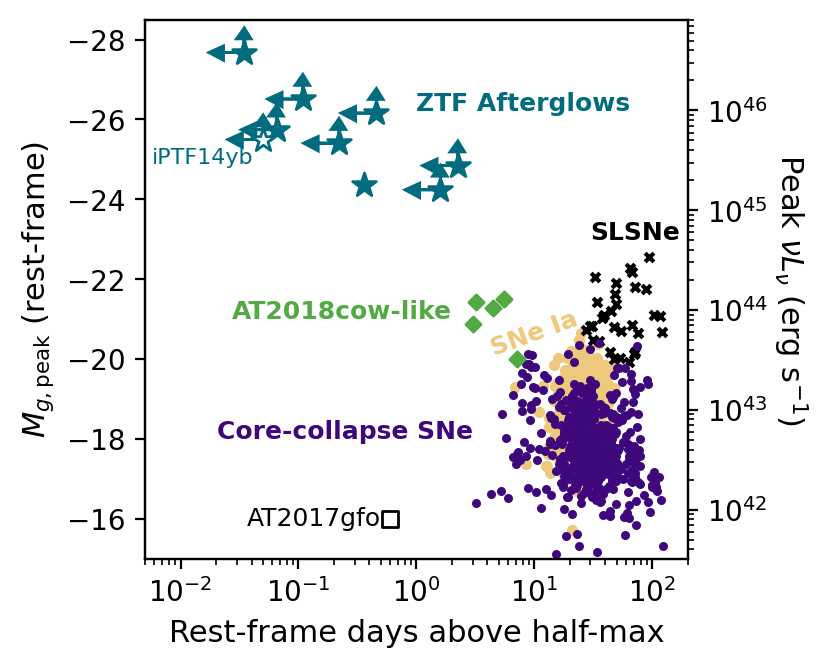
The afterglows in Table 2.3 constitute the shortest-lived optical extragalactic transients that have been discovered in optical survey data and followed up in real time. To illustrate this, Figure 1 shows the duration above half-maximum intensity and the peak absolute magnitude for optical transients, primarily with light curves observed by ZTF (Fremling et al., 2020; Perley et al., 2020; Ho et al., 2021c). Most supernovae (SNe) evolve on timescales from 10–100 d, powered by radioactive decay, with their characteristic duration set by diffusion through optically thick ejecta (Villar et al., 2017a). By contrast, the afterglow emission is governed by optically thin synchrotron radiation. We caution that for the afterglows, estimates of the duration and peak luminosity are imprecise because the ZTF cadence is much slower than the light-curve timescale; the exception is AT 2019pim owing to TESS observations of the light curve (Perley et al., in prep; Fausnaugh et al. 2019). To estimate the duration, we use best-fit power laws to the light curve (§3.2). The luminosity estimates are described in §3.3.
In the remainder of this section we provide discovery and follow-up details for events discovered by our search procedure. The X-ray, optical, and radio are respectively provided in Tables 6, 7, and 8 in the Appendix. When appropriate, we estimate the chance spatial and temporal coincidence of the optical transient with a GRB, by calculating the number of LGRBs we expect a given facility to detect in the localization region during the time interval of interest. For Fermi-GBM, we use the fact that during the year 2020 GBM detected 260 bursts, for a rate of 0.7 . For the IPN, we use the fact that according to the IPN master list444http://www.ssl.berkeley.edu/ipn3/masterli.txt, during the year 2020 IPN detected 422 bursts, an average of 1.5 d-1.
2.3.1 ZTF 20abbiixp / AT 2020kym / GRB 200524A
ZTF 20abbiixp was first detected by ZTF on 2020 May 24.29 (MJD 58993.29) in an -band image at mag as part of the ZTF Uniform Depth Survey. The most recent nondetection was 0.84 d prior at mag. The most recent -band nondetection was 1.01 d prior at mag, giving an -band rise rate of mag .
There were five detections the first night, all in , which showed significant fading of 0.35 mag over 0.48 hr ; we provide the full set of ZTF photometry in Table 6, and plot the light curve in Figure 2. Legacy Survey imaging (Dey et al., 2019) showed no associated host at the transient position down to mag. The fast rise, rapid intranight fading, and lack of detected host in deep imaging led the transient to be flagged by the daily scanner on 2020 May 24.8. ZTF 20abbiixp also passed the ZTFReST search criteria during their science validation (Andreoni et al., 2021).
A search for an associated GRB identified the long-duration GRB 200524A (Pookalil et al., 2020; Fana Dirirsa et al., 2020) consistent with the position and time of ZTF 20abbiixp. GRB 200524A had triggered the Fermi-GBM and the Fermi-Large Area Telescope (LAT; Atwood et al. 2009), and Swift X-ray Telescope (XRT; Burrows et al. 2005) ToO observations had been initiated (Evans & Swift Team, 2020). The burst was found to also have triggered ASTROSAT (Gupta et al., 2020; Singh et al., 2014) and Konus-Wind (Svinkin et al., 2020).
The trigger time was 1.8 hr prior to the first ZTF detection. The offset was 0.151 deg from the LAT position, which had a localization region of radius 0.2 deg (90% containment, statistical error only). The expected number of GRBs detected by GBM in this location over a 0.84 d window is . We therefore consider the association secure. We publicly reported the transient (Ho et al., 2020a) and saved it to the Transient Name Server (TNS555https://www.wis-tns.org/), where it was assigned the name AT 2020kym. Our public report of the ZTF transient and likely GRB association represented the first identification of the afterglow of GRB 200524A.
GRBs detected by the Fermi-LAT are of general interest because they typically have a relativistic energy release that is an order of magnitude or more greater than the canonical value, as well as brighter-than-average X-ray and optical afterglows (Nysewander et al., 2009; Cenko et al., 2011; McBreen et al., 2010). A multiwavelength analysis of AT 2020kym will be published in a separate paper by Ghosh et al., so here we simply summarize the observations that we and other groups obtained.
We obtained a long-slit spectrum of AT 2020kym between hr and hr with the Gemini Multi-Object Spectrograph (GMOS) on Gemini-North (Hook et al., 2004) under our Target-of-Opportunity (ToO) program666GN-2020A-Q-117; PI: Miller, and as discussed by Yao et al. (2021a) measured a redshift of . The spectrum will be published by Ghosh et al.
Because of the interest in Fermi-LAT GRBs, a variety of follow-up observations were obtained for this event. We triggered our VLA program777Project ID VLA/20A-374; PI A. Ho beginning 5 d after the burst and obtained several observations at 10 GHz, which will be presented by Ghosh et al. The X-ray afterglow was detected by Swift-XRT (Capalbi et al., 2020). Optical photometry was obtained with a large number of facilities (Kumar et al., 2020b; Lipunov et al., 2020; Rumyantsev et al., 2020; Sanwal et al., 2020; Belkin et al., 2020; Izzo, 2020; Perley & Ho, 2020; de Ugarte Postigo et al., 2020; Hosokawa et al., 2020; Kumar et al., 2020a; Zheng et al., 2020; Blazek et al., 2020; Kuin et al., 2020).
2.3.2 ZTF 21aaeyldq / AT 2021any
ZTF 21aaeyldq was first detected by ZTF on 2021 January 16.29 (MJD 59230.29) in an -band image at mag as part of the high-cadence partnership survey. The most recent nondetection was 20.3 min prior at mag (in a public-data image), giving a rise rate of mag . There were six detections the first night in band and band, which showed significant fading of 1.9 mag over 3.3 hr and an extinction-corrected red color of mag. The ZTF photometry is presented in Table 6, the - and -band light curves are shown in Figure 3, and the -band light curve is shown compared to other events in the right panel of Figure 2. No host galaxy was visible at the transient position in deep Legacy Survey pre-imaging ( mag). Owing to the fast fading, red color, and lack of detected host, the transient was flagged by the daily scanner on 2021 January 16.75.
We searched the Fermi-GBM Burst Catalog888https://heasarc.gsfc.nasa.gov/W3Browse/fermi/fermigbrst.html, the Fermi-GBM Subthreshold Trigger list999https://gcn.gsfc.nasa.gov/fermi_gbm_subthresh_archive.html (with reliability flag not equal to 2), the Swift GRB Archive101010https://swift.gsfc.nasa.gov/archive/grb_table/, and the Gamma-Ray Coordinates Network archives111111https://gcn.gsfc.nasa.gov/gcn3_archive.html for an associated GRB between the last ZTF nondetection (2021 January 16.28) and the first ZTF detection 20 min later. No associated GRB had been reported. We searched the pointing history of different satellites, and determined that the transient position was visible to Fermi-GBM for 14 min out of the 20 min in the interval between the last nondetection and the first detection. The position was not visible to Swift-BAT or to SPI-ACS (Vedrenne et al., 2003) onboard the INTernational Gamma-ray Astrophysics Laboratory (INTEGRAL; Winkler et al. 2003): INTEGRAL was not obtaining data due to its regular perigee passage. Konus-Wind was only recording data in its S2 detector, but despite the high incident angle to the source (115 deg), reasonable upper limits on the -ray emission may be derived (§3.2). We reported the transient to the TNS on January 16.9 and it was assigned the name AT 2021any.
AT 2021any was observed with the Optical Spectrograph and InfraRed Imager System (OSIRIS; Cepa et al. 2000) mounted on the 10.4 m Gran Telescopio Canarias (GTC) telescope at the Roque de los Muchachos Observatory in the island of La Palma (Spain). The observation consisted of s exposures with grism R1000B and a 1′′ wide slit, aligned with the parallactic angle (Filippenko, 1982), which results in a resolving power of and spectral coverage between 3700 Å and 7800 Å. The observation was performed at a mean epoch of 00:06 UT on 17 January 2021. The data reduction was performed using a custom pipeline based on shell scripts and IRAF routines that included bias, response (flatfielding), wavelength calibration, and flux calibration based on the observation of a spectrophotometric star. Telluric features were not removed.
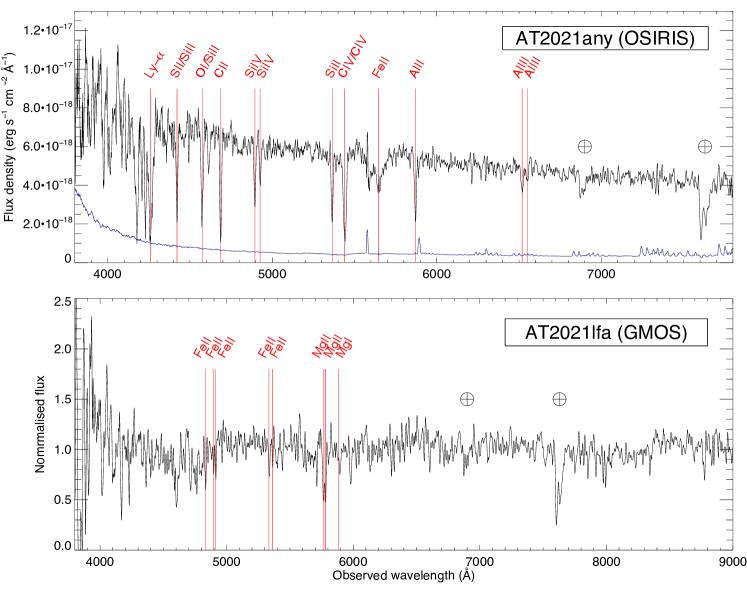
As mentioned by de Ugarte Postigo et al. (2021a), the spectrum (see Figure 4) shows several prominent absorption features corresponding to Ly-, S II, O I, Si II, Si IV, C II, C IV, Fe II, Al II, and Al III at a common redshift of . To determine the redshift we use the average value calculated for each of the unblended features, taking their standard deviation as the uncertainty. The equivalent widths measured for these lines are displayed in Table 2, together with their measured wavelength and redshift. The reduced spectra can be plotted and downloaded within the GRBSpec database121212http://grbspec.eu (de Ugarte Postigo et al., 2014).
| Name | Obs. | Feature | EW | |
|---|---|---|---|---|
| (Å) | (Å) | |||
| AT 2021any | 4421.02 | S II 1259.52 | 2.5131 | |
| Si II 1260.42 | 2.5131 | |||
| 4574.15 | O I 1302.17 | 2.5131 | ||
| Si II 1304.37 | 2.5131 | |||
| 4686.88 | C II 1334.53 | 2.5120 | ||
| 4894.81 | Si IV 1393.76 | 2.5119 | ||
| 4926.22 | Si IV 1402.77 | 2.5118 | 3.46 0.77 | |
| 5364.17 | Si II 1526.71 | 2.5135 | 7.81 0.74 | |
| 5440.73 | C IV 1548.2 | 2.514 | 17.58 0.98 | |
| C IV 1550.77 | 2.5131 | |||
| 5647.44 | Fe II 1608.45 | 2.5111 | 8.98 0.91 | |
| 5870.30 | Al II 1670.79 | 2.5135 | 7.82 0.85 | |
| 6518.77 | Al III 1854.72 | 2.5147 | 2.97 0.64 | |
| 6549.65 | Al III 1862.79 | 2.5160 | 1.49 0.52 | |
| AT 2021lfa | 4834.99 | FeII 2344.21 | 1.0625 | 2.51 0.82 |
| 4897.54 | Fe II 2374.46 | 1.0626 | 2.65 0.85 | |
| 4914.12 | Fe II 2382.77 | 1.0624 | 3.52 0.90 | |
| 5334.21 | Fe II 2586.65 | 1.0622 | 3.12 0.95 | |
| 5363.12 | Fe II 2600.17 | 1.0626 | 3.94 0.92 | |
| 5768.26 | Mg II 2796.30 | 1.0628 | 3.30 0.85 | |
| 5780.84 | Mg II 2803.50 | 1.0620 | 4.63 0.88 |
Preceding our spectroscopic observations with OSIRIS, we obtained two acquisition images of 60 s and 30 s in the -band filter (first reported by de Ugarte Postigo et al. 2021a). The afterglow is clearly detected in each image. No calibration frames were taken for these observations, but the raw images are of high quality.
After a weather-induced delay, we obtained two epochs of observations with the Calar Alto Faint Object Spectrograph (CAFOS) mounted on the 2.2 m telescope of the Centro Astronómico Hispano en Andalucía (CAHA), Almeria, Spain, in the filter (first reported by Kann et al. 2021a, and Kann et al. 2021b). The observations consisted of s at d after the GRB, and another s a night later. Observing conditions were fair, but with mediocre seeing. The afterglow is clearly detected in each stack. Images were bias-subtracted, flatfielded, aligned, and stacked with standard procedures in ESO MIDAS131313https://www.eso.org/sci/software/esomidas/ and PyRAF141414https://iraf-community.github.io/pyraf.html. The CAFOS and OSIRIS photometry is presented in Table 6. Additional optical follow-up observations of AT 2021any were reported by a variety of facilities (Kumar et al., 2021; Ahumada et al., 2021; Zhu et al., 2021; Coughlin & Ahumada, 2021a; Coughlin & Ahumada, 2021b; Rossi et al., 2021c; Guelbenzu et al., 2021; Ghosh et al., 2021).
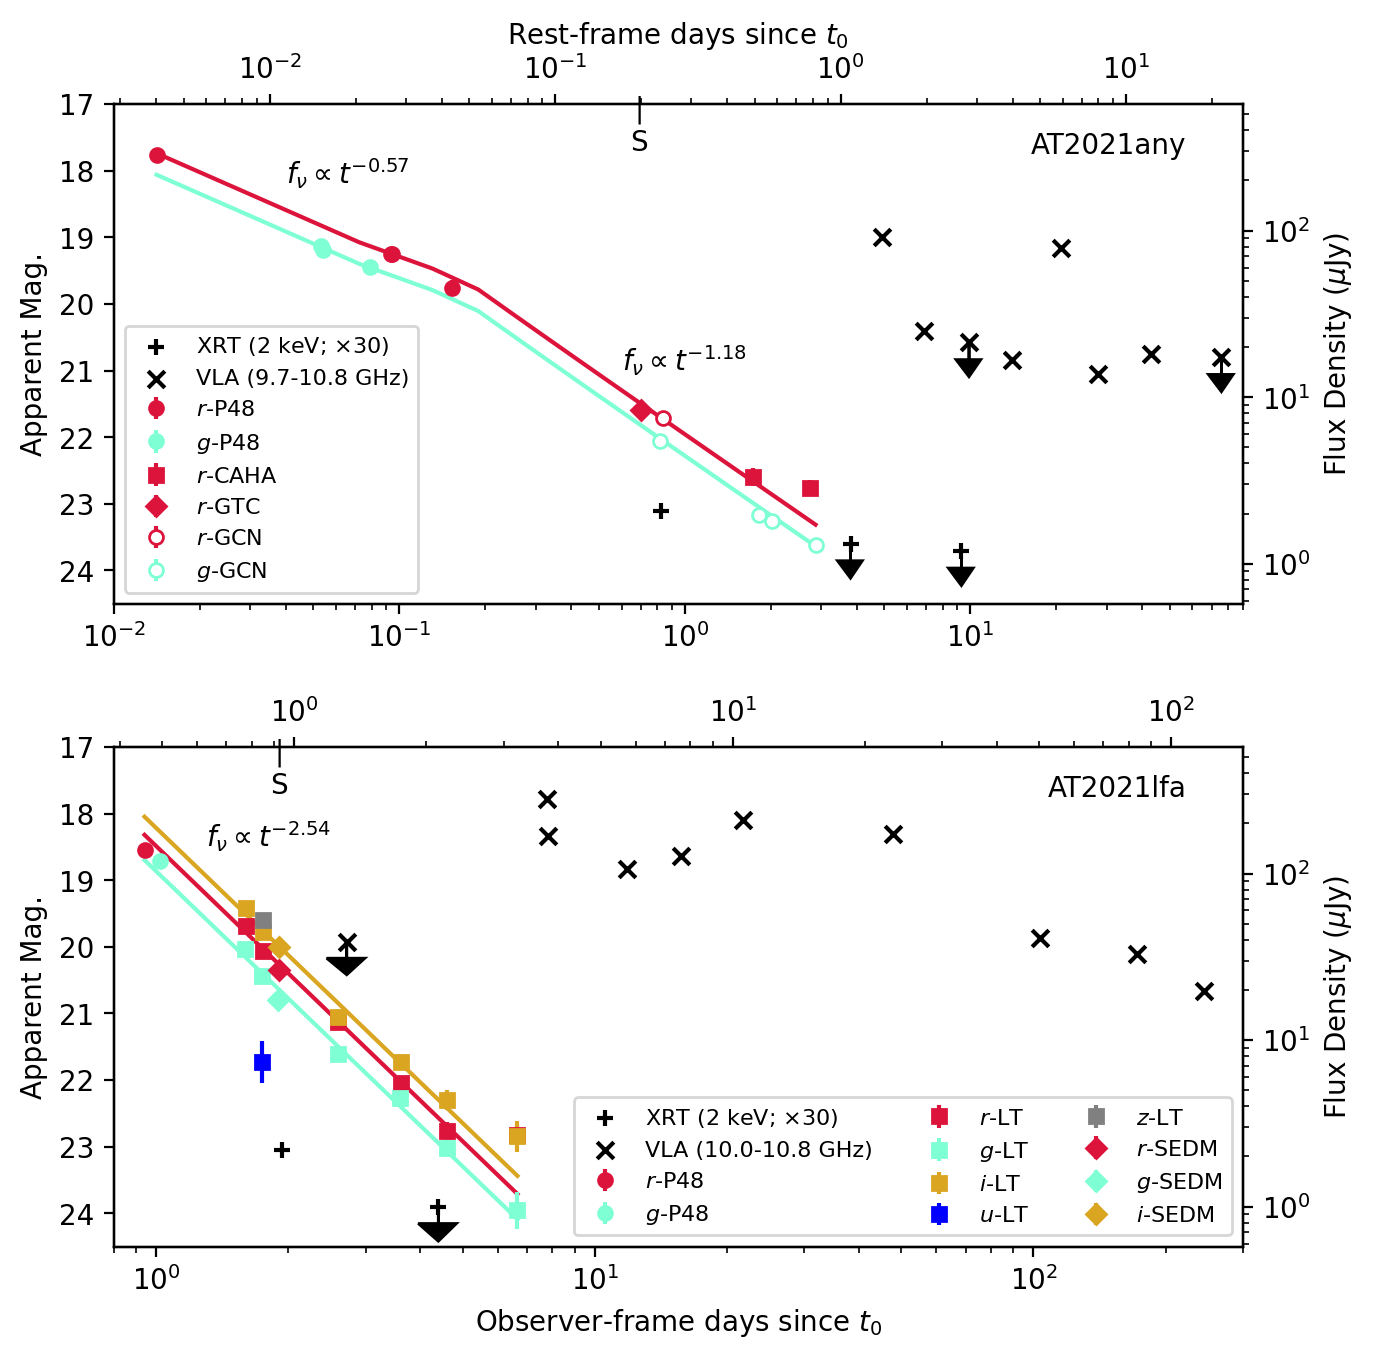
We obtained a Swift-XRT151515PI A. Ho; target ID 13991 observation of AT 2021any beginning 0.81 d after the first optical detection. We obtained three epochs of 3 ks exposures and reduced the data using the online tool161616https://www.swift.ac.uk/userobjects/ developed by the Swift team (Evans et al., 2007). In the first epoch X-ray emission was detected at the transient position, and there was no detection in the subsequent two epochs. The observation log is provided in Table 7. Taking a neutral hydrogen column density of (Willingale et al., 2013) and assuming a power-law spectrum with photon index , we find an unabsorbed flux density of using webpimms171717https://heasarc.gsfc.nasa.gov/cgi-bin/Tools/w3pimms/w3pimms.pl. The X-ray light curve is shown in Figure 3.
We obtained eight epochs of VLA observations of AT 2021any under our ToO program181818VLA/20B-164 and VLA/21A-319, PI D. Perley: six epochs were in X-band (10 GHz), one epoch was in X- and Ku-band (15 GHz), and one epoch was in S- (3 GHz), C- (6 GHz), X-, and Ku-band. The source J0808-0751 was used as a phase calibrator. For most observations 3C138 was used as the flux calibrator, although to account for the recent flaring behavior of this source we also observed 3C286 during the third epoch, and in the final two epochs we observed 3C286 only. Reduction of the data was performed using the Astronomical Image Processing System (AIPS) using standard synthesis imaging techniques. Calibration was performed by hand, with regions of the spectrum heavily contaminated by radio-frequency interference (RFI) excluded. We reported the first detection (Perley et al., 2021a) and the observations are listed in Table 8. The 10 GHz radio light curve is shown in Figure 3, and the evolution of the radio spectral energy distribution (SED) is shown in Figure 5.

| Name | Date | Exposure | ||||
|---|---|---|---|---|---|---|
| (UT) | (s) | (mag†) | (mag) | (mag) | (mag) | |
| AT 2021any | 2022 January 31 | 1380 | 25.90 | – | – | |
| – | – | 1080 | – | – | ||
| AT 2020blt‡ | 2022 January 31 | 960 | – | 26.49 | 25.92 | – |
| – | 2022 February 27 | 1920 | – | – | ||
| AT 2021lfa | 2022 March 03 | 1080 | 25.55 | – | – | 24.68 |
| – | – | 900 | – | 26.50 | – |
2.3.3 ZTF 21aagwbjr / AT 2021buv / GRB 210204A
ZTF 21aagwbjr was first detected in an image obtained on 2021 February 04.30 at mag as part of the one-day cadence TESS shadowing survey. The previous nondetection was 1.87 hr prior at mag. The previous -band nondetection was 1.05 d prior at mag, giving a rise rate in band of mag . There was only one detection the first night. There were four detections the second night, two in band and two in band. Owing to the rapid fade rate of mag in band, the extinction-corrected red color (mag), and the presence of a faint (mag, mag) counterpart (putative host galaxy) at the transient position in Legacy Survey imaging, the transient was flagged by the daily scanner on February 05.7. ZTF 21aagwbjr was also flagged by the ZTFReST pipeline, and the ZTF photometry was presented by Andreoni et al. (2021).
A search for an associated GRB identified the long-duration GRB 210204A consistent with the position and time of ZTF 21aagwbjr. GRB 210204A had triggered Fermi-GBM (Fermi GBM Team, 2021), the Gamma-Ray Detector (GRD) onboard the Gravitational Wave High-energy Electromagnetic Counterpart All-sky Monitor (GECAM; Zhang et al. 2019; Li et al. 2021), Konus-Wind (Frederiks et al., 2021a; Frederiks & Konus-Wind Team, 2021), and AstroSat (Waratkar et al., 2021). The trigger time of February 04.27 was 43 min prior to the first ZTF detection. The IPN localized the burst to a region of 6.7 (Hurley et al., 2021). The number of expected GRBs detected by the IPN in this region over the 1.87 hr window is , so the association is quite secure. The transient was reported (Kool et al., 2021) and saved to the TNS, where it was assigned the name AT 2021buv. The multiwavelength properties of AT 2021buv will be published in a separate paper by Kumar et al. Here we summarize the follow-up observations that were obtained.
We measured the redshift of AT 2021buv using a long-slit spectrum obtained with GMOS-S191919ToO program GS-2021A-Q-124; PI A. Ho (Gimeno et al., 2016). The observation was conducted in the Nod-and-Shuffle mode with a 10-wide slit, beginning 42.8 hr after the Fermi-GBM trigger. We obtained s spectroscopic exposures with the B600 grating and s exposures with the R400 grating, providing coverage over the range 3620–9600 Å. We reduced the spectrum using the IRAF package for GMOS, and clearly detected Mg II and Mg I in absorption at . The redshift of 0.876 was independently measured using VLT/X-shooter (Xu et al., 2021) from absorption features including fine-structure lines of Fe II, and emission lines of O II, O III, H, and H. The GMOS spectrum will be published by Kumar et al.
AT 2021buv was also detected in the X-ray (Evans & Swift Team, 2021; Kennea et al., 2021) and radio (Chandra et al., 2021) bands. Additional optical photometry has been made available (Teja et al., 2021; Belkin et al., 2021; Rossi et al., 2021a; Gupta et al., 2021a) and includes reports of a jet break (Gupta et al., 2021a; Rossi et al., 2021a).
2.3.4 ZTF 21aakruew / AT 2021cwd / GRB 210212B
ZTF 21aakruew was first detected in a ZTF image obtained on 2021 February 12.37 at mag, as part of the public survey. The last nondetection was 2.0 d prior at mag, giving a rise rate of mag . The extinction-corrected color was mag and there was no host galaxy visible at the transient position in Legacy Survey imaging (down to mag). Owing to the fast rise and lack of detected host, the transient was noted by the daily scanner on February 12.7.
The uncertainty in the color was not sufficient to determine whether it was red as expected for optically thin synchrotron emission (mag) or blue as expected for thermal flares (mag). To determine the color more precisely, we obtained LT imaging on February 12.98. The LT imaging revealed rapid fading of 2.4 mag in band and red colors (extinction-corrected mag). We report our optical photometry in Table 6.
We could not identify any GRB consistent with the position and time of ZTF 21aakruew. We publicly announced the transient (Yao et al., 2021d) and saved it to the TNS, where it was assigned the name AT 2021cwd. After our announcement, the IPN announced that AT 2021cwd was in the localization region of long-duration GRB 210212B by Konus-Wind, INTEGRAL, and Swift-BAT (Svinkin et al., 2021a, b). The burst time was 6.2 hr prior to the first ZTF detection. Follow-up optical photometry was obtained by us with LT as well as by other groups (Pozanenko et al., 2021; Nicuesa Guelbenzu & Klose, 2021). A conservative estimate of the 3 IPN localization area is 1286 (the BAT coded region cannot be confidently excluded). The number of GRBs expected to be detected by the IPN in this area during the 2 d window is 0.09, so the association is fairly secure. Unfortunately no redshift measurement was obtained of this event.
2.3.5 ZTF 21aayokph / AT 2021lfa
ZTF 21aayokph was first detected in a public ZTF image on 2021 May 04.23 at mag. The last nondetection was 1.92 d prior at mag (also in a public-survey image), giving a rise rate in band of mag . The source was detected in both band and band the first night, with an extinction-corrected red color of mag. The nearest object in Legacy Survey pre-imaging was 29 away, at mag and mag. Owing to the fast rise, red color, and lack of detected host galaxy at the transient position, the transient was flagged by the daily scanner on May 04.7. We searched for an associated GRB; none was identified in the 1.92 d window consistent with the optical-transient position. We publicly reported the source (Yao et al., 2021b) and saved it to the TNS, where it was assigned the name AT 2021lfa.
We obtained a long-slit spectrum of AT 2021lfa with GMOS-S202020Program GS-2021A-Q-124, PI A. Ho starting on 2021 May 05.18, or d after the first optical detection. The observation was performed in the Nod-and-Shuffle mode with a 10-wide slit. We obtained s exposures with each of the B600 and R400 gratings, providing coverage over the range 3620–9540 Å. No flux calibration was performed. The spectrum was reduced using the IRAF package for GMOS. We clearly identified absorption lines of Mg II2796, 2803 at in the B600 and R400 spectra. Absorption lines from Mg I and Fe II were marginally detected in the spectra at a consistent redshift. the lack of observed damped Lyman- places an upper limit of . We reported the redshift measurement in Yao et al. (2021b). The spectrum with our line identifications is shown in Figure 4, and the measured line strengths are reported in Table 2.
We observed the position of AT 2021lfa with Swift-XRT212121Target ID 14306, PI A. Ho beginning on May 05.23, d after the first optical detection (Ho et al., 2021a). We obtained two epochs of 5 ks exposures separated by 2.5 d and reduced the data using the online tool developed by the Swift team. In the first epoch X-ray emission was detected at the transient position with a count rate of , and there was no detection in the second epoch with a 3 upper limit of . The observation log is provided in Table 7. Taking a neutral hydrogen column density of and assuming a power-law spectrum with photon index , webpimms gives an unabsorbed 0.3–10 keV flux density of . The X-ray measurements are shown in Figure 3.
We obtained follow-up observations with the SEDM and LT, LT image reduction was provided by the basic IO:O pipeline. P60 and LT image subtraction was performed following Fremling et al. (2016) using PS1 images for and SDSS for . Our photometric observations are provided in Table 5. Optical photometry was also obtained by other groups (Watson et al., 2021; Butler et al., 2021; Kim et al., 2021; Fu et al., 2021; O’Connor et al., 2021; Pankov et al., 2021a; Rossi et al., 2021b), including a claimed detection 3 hr prior to the first ZTF detection (Lipunov et al., 2021). The -band light curve is shown in Figure 2, the multiband optical light curve is shown in Figure 3, and the optical SED obtained with LT at d is shown in Figure 6.
We obtained nine separate epochs of observations of AT 2021lfa with the VLA under our ToO program222222VLA/21A-319, PI D. Perley. The epochs generally involved various combinations of X-, Ku-, and C-bands, although in one epoch L-band was also included, and in some cases an observation was repeated in the lowest-frequency band after a few hours or days to look for evidence of short-timescale scintillation. The observation log is provided in Table 8. We employed 3C286 as a flux calibrator for all observations and J1224+0330 as the phase calibrator. In three of these epochs we also observed J1407+2827 in X-band only as a polarization leakage calibrator, although no evidence of polarization in the afterglow was detected. Observations were reduced using AIPS in the same manner as for the observations of AT 2021any. The 10 GHz radio light curve is shown in Figure 3, and the evolution of the SED is shown in Figure 5.
2.3.6 ZTF 21abfmpwn / AT 2021qbd / GRB 210610B
ZTF 21abfmpwn was first detected in an image obtained as part of the high-cadence partnership survey on 2021 June 11.23 at mag. The last nondetection was 0.85 d prior at mag (in a public survey image), and the most recent nondetection in the same filter was 0.94 d prior at mag (also in a public survey image). The rise time was therefore mag in band. The daily scanner promptly identified ZTF 21abfmpwn as the afterglow to the Swift LGRB 210610B (Page et al., 2021), which was known to have a bright associated X-ray and optical afterglow at (Fynbo et al., 2021; de Ugarte Postigo et al., 2021b; Dutta et al., 2021). GRB 210610B was also detected by Fermi-GBM (Malacaria et al., 2021) and Konus-Wind (Frederiks et al., 2021b). The burst time was 9.7 hr before the first ZTF detection.
The transient would have passed our selection criteria regardless of the known GRB association owing to its rapid rise, its red color (extinction-corrected mag), significant intranight fading (0.32 mag in 3.1 hr, ), and faint (, mag) object 03 away in Legacy Survey imaging. We publicly reported the ZTF detection (Perley et al., 2021b) and saved the afterglow to the TNS, where it was assigned the name AT 2021qbd. We provide the ZTF photometry in Table 6.
3 Comparison to the LGRB Population
In this section we compare the properties of the optically discovered afterglows to the population of optical afterglows detected in follow-up observations of GRB triggers.
3.1 Redshift Distribution
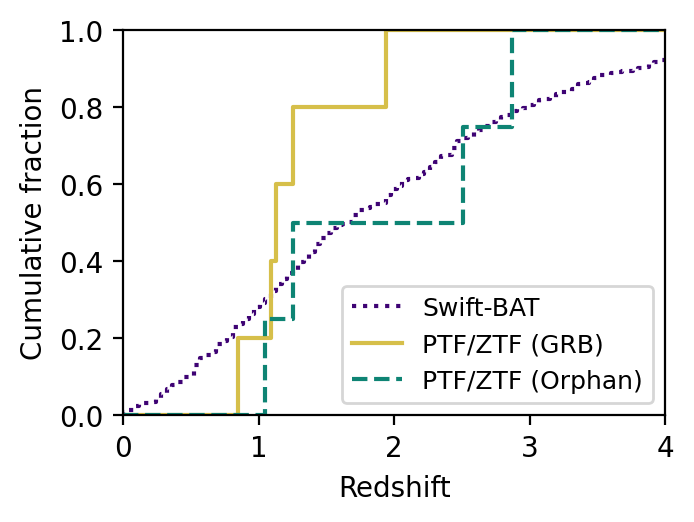
In Figure 7 we show the cumulative redshift distribution of all optically discovered events to date compared to that of Swift-BAT GRBs with optical afterglows232323https://swift.gsfc.nasa.gov/archive/grb_table/. Current optical searches sample a wide range of redshifts, from to . However, we cannot discern any statistically significant differences between the optically selected and GRB-selected events at this stage owing to the small sample size. In the future, it will be interesting to see whether the “orphan” events lie at different redshifts from the events with associated detected GRBs.
3.2 Prompt Emission
To compare the prompt emission properties of the optically discovered afterglows to the GRB-discovered population, we begin by calculating the basic properties of the accompanying GRB for each event, which are summarized in Table 3.2. For events with probable associated GRBs (as established in §2), we calculate the time interval containing 5% to 95% of the burst fluence (), the fluence, the isotropic-equivalent -ray energy release and luminosity , and the peak energy . Because all the bursts were detected by Konus-Wind, we use the same approach as that used by Tsvetkova et al. (2017) and Tsvetkova et al. (2021). For bursts also detected by Fermi-GBM, we confirmed that the energetics inferred from Fermi-GBM data are consistent with the Konus-Wind values. We recalculated these values for published events in order to provide consistent measurements.
| Name (GRB) | Inst.b | Fluence | Peak Flux | Ref.f | ||||
|---|---|---|---|---|---|---|---|---|
| (s) | () | () | (keV) | ( erg) | ( erg ) | |||
| PTF11agg | – | – | – | – | – | |||
| iPTF14yb (140226A) | IKO | g | ||||||
| ATLAS17aeu (170105A) | AIKP | h | – | – | ||||
| AT2019pimi | – | – | – | [1] | ||||
| AT2020blt | – | – | – | this work; [2] | ||||
| AT2020kym (200524A) | AFK | |||||||
| AT2020sev (200817A) | FIKS | – | – | |||||
| AT2020yxz (201103B) | GIK | j | ||||||
| AT2021any | – | – | – | |||||
| AT2021buv (210204A) | ABCFIKOS | |||||||
| AT2021cwd (210212B) | IK | j | – | – | ||||
| AT2021lfa | – | – | – | |||||
| AT2021qbd (210610B) | FKS |
References. — [1] Perley et al. (in prep.), [2] Ho et al. (2020b).
For orphan events, we estimate the time of an associated burst using a power-law fit to the optical light curve, and use the coverage by high-energy satellites during the relevant period to set limits on the properties of an associated GRB. Because Fermi-GBM and Konus-Wind operate using a flux-based trigger, we use the estimated flux sensitivity to set an upper limit on . However, because is an important physical quantity for drawing comparisons with the LGRB population, we also use a typical fluence threshold to estimate an upper limit on . The upper limits on and in Table 3.2 have cosmological corrections applied.
We fit the AT 2021any ZTF light curve with a broken power law following the procedure applied to AT 2020blt (Ho et al., 2020b), which made use of a modified fitting function from Zeh et al. (2006). We fit the function to the -band and -band light curves simultaneously, with a constant offset in magnitude between the light curves. Since the host galaxy is not detected in deep Legacy Survey imaging, and the ZTF points are all brighter than 20 mag, we do not fit for a constant offset from the host. Using the curve_fit package in scipy, we find a best-fit that is 9 min after the last nondetection and 11 min prior to the first detection.
The best-fit temporal power-law index is prior to the break, and after the break, with a break at hr. The goodness of fit is for degrees of freedom. The pre-break index we measure is shallower than the value of reported by Gupta et al. (2021b) on the basis of GCN photometry. The post-break index we measure is shallower than the value of reported by Kann et al. (2021b). The best fit is shown in Figure 3.
We fit the AT 2021lfa light curve to a single power law, to the , , and light curves simultaneously, with a constant offset in magnitude between each pair of bands. Since the host galaxy is not detected in deep Legacy Survey imaging, we do not fit for a constant offset from the host. We find a best-fit of May 03.29, which is 0.98 d prior to the first detection and 0.94 d after the last nondetection. The best-fit temporal power-law index is , with a goodness of fit of for degrees of freedom. The fits do not capture an apparent late-time flattening in the -band and -band light curves. The fit is shown in Figure 3.
Our best-fit for AT 2021any is within the interval of visibility to Fermi-GBM. Using the Fermi-GBM trigger sensitivity, we estimate that the upper limit on the peak flux is , although a ground-based analysis could reduce the sensitivity by a factor of 2–3. However, early optical afterglow light curves can have complex behavior (Kann et al., 2010), so our power-law fit may not be appropriate. To be conservative, we report an upper limit based on Konus-Wind. AT 2021any had only nonstandard Konus-Wind data, so we estimate an upper limit on the flux of (20–10,000 keV; 3.68 s timescale), a factor of a few higher than typical Konus-Wind peak flux upper limits (Ridnaia et al., 2020). For the fluence, a conservative upper limit is (Tsvetkova et al., 2021). The corresponding limits on the energetics, with cosmological corrections, is and .
For AT 2021lfa, the steep power-law index of the optical light curve suggests that we are observing after the jet break (as discussed in §3.4), so we are unable to use our estimated as a burst time. Given the large window between the last nondetection and the first detection, we use the upper limit on the peak flux from Konus-Wind data of (20–10,000 keV; 2.944 s timescale), giving . To set an upper limit on the fluence, we searched for a GRB counterpart using the procedure of Tsvetkova et al. (2021). The nondetection suggests that the limiting fluence is comparable to the fluence of the weakest burst from Tsvetkova et al. (2021), so approximately (20 keV–10 MeV). The corresponding upper limits on and are reported in Table 3.2.
We compute new upper limits for PTF 11agg in a consistent way. The interval of interest is the 21.5 hr between the last nondetection and the first detection. Konus-Wind was taking data with stable background conditions for 98% of the time. We find an upper limit on the peak flux of (20 keV–10 MeV, 2.944 s timescale), which is insensitive to the assumed spectral model. We set a fluence threshold in the same way as for AT 2021lfa.
| Name | (11h) | (1d) | Ref.c | |
|---|---|---|---|---|
| (erg ) | (erg ) | |||
| iPTF14yb | 1.02 | [1] | ||
| AT 2019pim | 0.9 (d), 0 (d), 2 () | [2] | ||
| AT 2020blt | 0.54 (d), 2.62 (d) | [3] | ||
| AT 2020kym | 1.53 (d), 0.8 (d) | |||
| AT 2020yxz | 0.96 | [4] | ||
| AT 2021any | 0.7 (d), 2.3 (d) | [5] | ||
| AT 2021buv | 0.6 (d), 1.7 (d) | [6] | ||
| AT 2021lfa | 2.54 | |||
| AT 2021qbd | 1.57 | [7] |
We can now compare the energetics of the prompt high-energy emission to that of typical LGRBs. The burst durations and values in Table 3.2 classify each event as a classical LGRB with (Cano et al., 2017). The values of range from 3.3 s (for ATLAS17aeu / GRB 170105A) to 388.6 s (for AT 2020sev / GRB 200817A). It is not surprising that we would detect more LGRB afterglows than short-duration GRB (SGRB) afterglows, because LGRB afterglows are an order of magnitude more luminous than SGRB afterglows (Kann et al., 2011; Berger, 2014).
For the orphan events we cannot rule out an associated prompt LGRB with a “classical” high luminosity of (Cano et al., 2017). This can be understood as follows. For most events, the coverage by sensitive detectors such as Swift-BAT and Fermi-GBM, together with the uncertainty on the burst time, means that the most robust upper limit comes from Konus-Wind. The Konus-Wind flux threshold of a few could only rule out a GRB at (800 Mpc), a much lower redshift than any of our events.
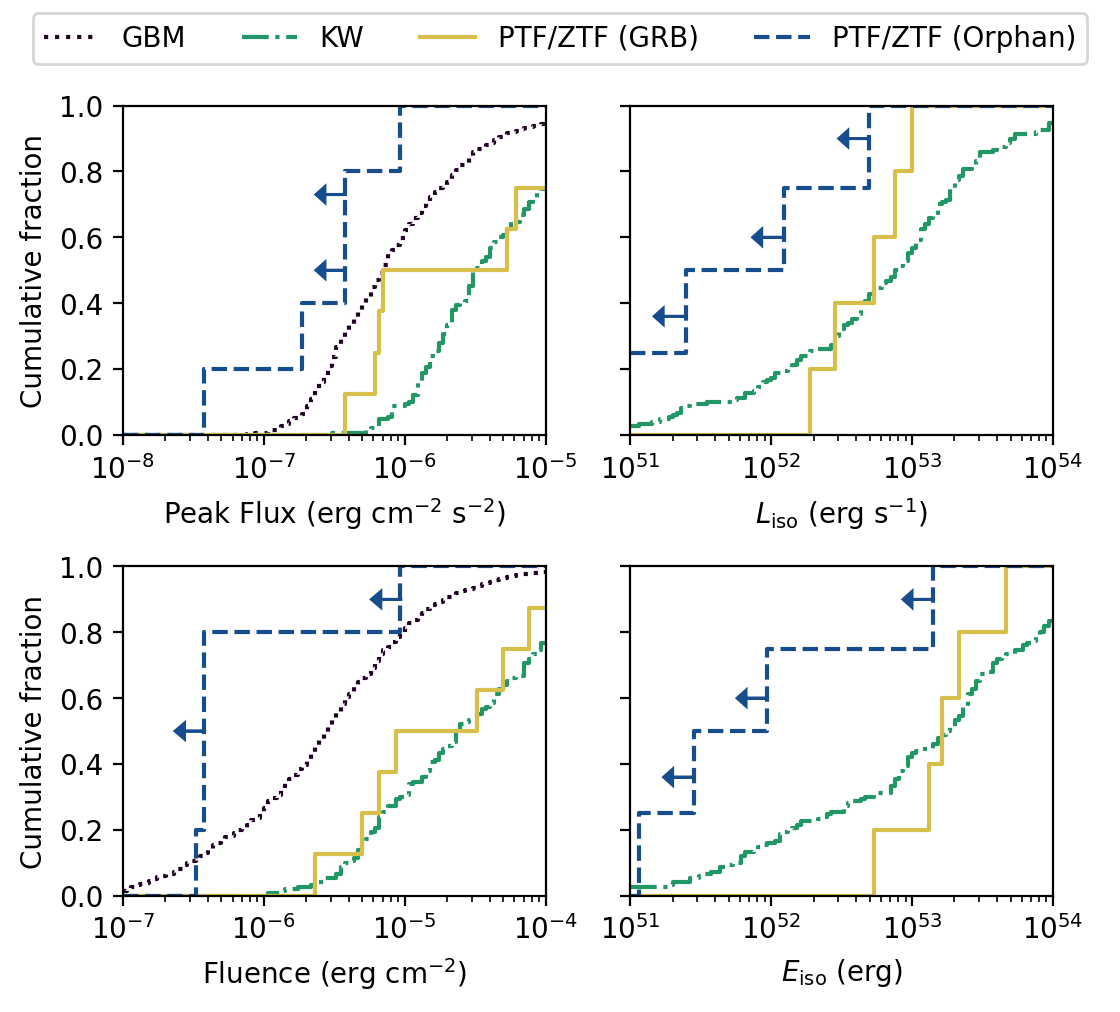
The cumulative distributions of the prompt energetics are shown in Figure 8. For comparison, we display the distribution of GRBs in the Fermi-GBM Burst Catalog242424https://heasarc.gsfc.nasa.gov/W3Browse/fermi/fermigbrst.html (Gruber et al., 2014; von Kienlin, 2014; Narayana Bhat et al., 2016; von Kienlin et al., 2020; Poolakkil et al., 2021), and LGRBs from Konus-Wind with redshift measurements (Tsvetkova et al., 2017). The sample size is too small to discern statistically significant differences. However, so far it appears that if the orphan events are ordinary LGRBs, the bursts have lower luminosities and energies than the events with detected LGRBs. The limits are consistent with a picture in which the GRB-associated events have higher luminosities and energies, making them detectable by all-sky GRB monitors, whereas the orphan events have lower but still ordinary LGRB parameters.
3.3 Optical Light Curves
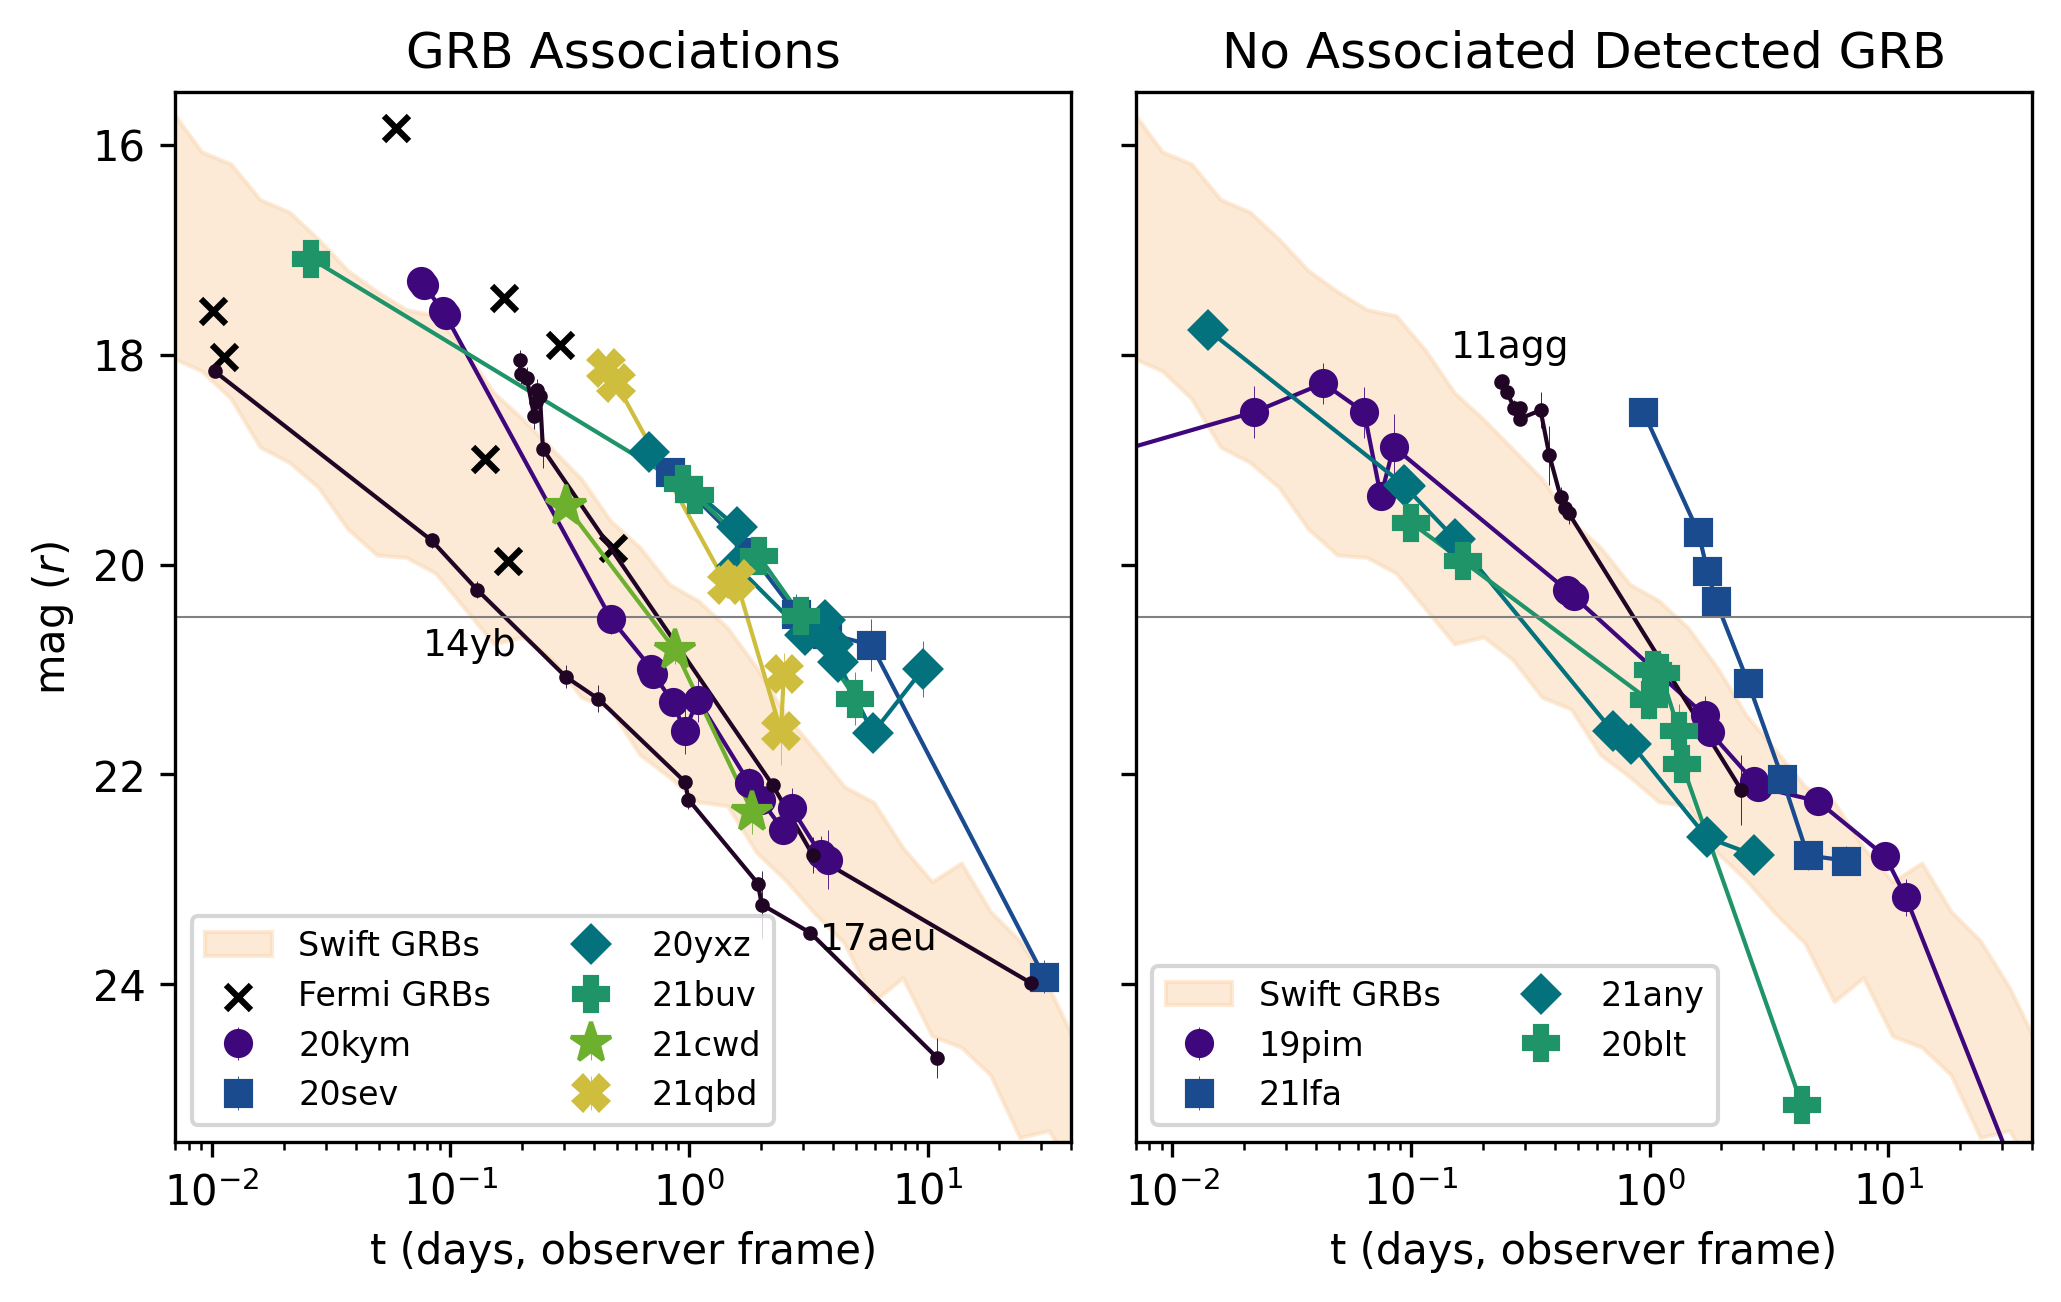
In Figure 2 we show the -band light curves of the ZTF afterglows compared to the sample of optical afterglows detected in follow-up observations of Swift-BAT GRBs presented by Kann et al. (2010), and of Fermi-GBM GRBs presented by Singer et al. (2015). The shaded region indicates the 25th and 75th percentile bounds of the Kann et al. (2010) sample. The left panel shows the events with GRB associations, including two events detected prior to ZTF (iPTF14yb and ATLAS17aeu), and the right panel shows the events with no associated detected GRB, including one event detected prior to ZTF (PTF11agg). The left panel of Figure 2 demonstrates that the events with detected GRBs have particularly bright afterglows — most events are brighter than the 75th percentile from the Kann et al. (2010) sample.
Comparing the brightness of the orphan optical afterglows, shown in the right panel of Figure 2, is challenging because of the uncertainty in the true time of first light. Using the best-fit values for PTF11agg and AT 2021lfa, the light curves appear to be brighter than those of most GRB afterglows. The best-fit values for AT 2021any and AT 2020blt suggest that the light curves are fairly typical in brightness for GRB afterglows. The most extreme case — a value of equal to the last nondetection — would put the first AT 2020blt detection at d, and the first AT 2021any detection at d. So, while AT 2020blt could also have been fairly bright, AT 2021any would still be typical.
For events with measured redshifts, we construct rest-frame -band optical light curves to compare the optical luminosity of LGRB afterglows. We convert the observed -band light curves using
| (1) |
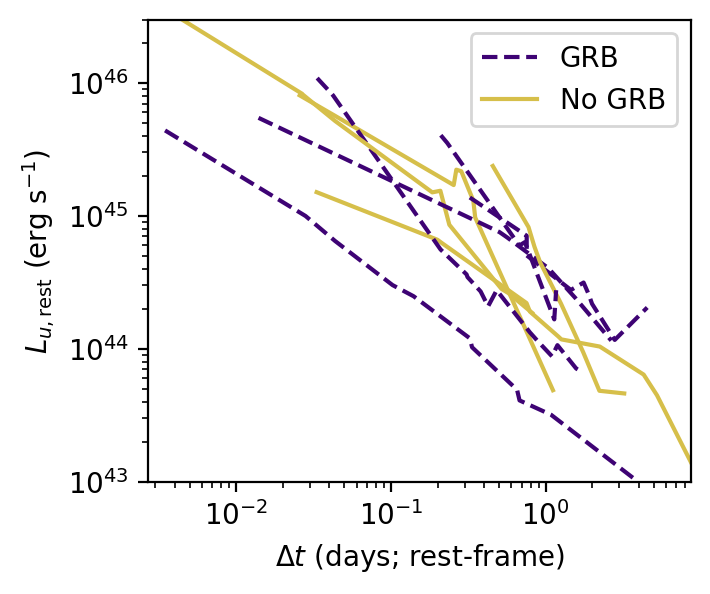
where is the luminosity distance, is the observed -band flux at a given time , and is the redshift. The temporal and spectral indices are defined as . The frequencies are set to Hz and Hz for band and , respectively. For each event we adopt a typical value of (Greiner et al., 2011). The values of we adopt for each burst are shown in Table 3.2, and the resulting light curves are shown in Figure 9. We also take a cross-section of the light curves at 11 hr and 1 d in the rest frame; we provide the luminosities in Table 3.2. The luminosities are typical of LGRB light curves (Racusin et al., 2011) and we find no evidence that the orphan events are distinct.
As a final check, we calculate the rest-frame -band luminosities of the orphan events at 11 hr, and plot them along with the limits on in Figure 10. We compare them to a sample of LGRBs from Nysewander et al. (2009). For the comparison, we calculate the rest-frame -band luminosity using the same adopted spectral index () as in Nysewander et al. (2009). The limits on are not sensitive enough to rule out a contemporaneous LGRB for any event.

3.4 Multiwavelength Properties of the Orphan Afterglows
In this section, we analyze the multiwavelength data of AT 2021any and AT 2021lfa, and put the properties of all optical orphan afterglows discovered to date in the context of the LGRB population. Thus far, five orphan optical afterglows have been discovered: PTF11agg (), AT 2019pim (), AT 2020blt (), AT 2021any (), and AT 2021lfa (). The properties of PTF11agg and AT 2020blt were presented by Cenko et al. (2013) and Ho et al. (2020b) respectively, and AT 2019pim will be discussed in detail in a separate paper by Perley et al. Gupta et al. (2021b) analyzed the public data of AT 2021any and concluded that its properties were consistent with being a LGRB viewed on-axis. By modeling the optical light curve of AT 2020blt, and adopting deeper limits on accompanying -ray emission than did Ho et al. (2020b), Sarin et al. (2021) argued that it was likely viewed on-axis but with an unusually low -ray efficiency of .
The optical light curves of AT 2021any and AT 2021lfa have temporal indices that are similar to those of LGRB optical afterglows in the literature (Zeh et al., 2006; Kann et al., 2010; Li et al., 2012; Wang et al., 2018). The AT 2021lfa power-law index of is close to expectations for synchrotron emission from a power-law distribution of electrons after the edge of the jet is visible, for a typical electron energy power-law index of (Sari et al., 1999). The AT 2021any light curve shows a clear break. The post-break index of is close to expectations for synchrotron emission before the edge of the jet is visible (Sari et al., 1999). The pre-break index of is quite shallow, and close to the pre-break value measured for AT 2020blt (Ho et al., 2020b).
are commonly attributed to two effects in collimated relativistic jets (Rhoads, 1997; Sari et al., 1999): sideways expansion and the edge of the jet being visible, both of which are thought to occur when the Lorentz factor , where is the opening angle of the jet. The fact that we did not observe the break in AT 2021lfa suggests that it occurred within a day of the burst in the rest frame, which is common for LGRB optical afterglows (Zeh et al., 2006; Kann et al., 2010; Wang et al., 2018), and enables us to estimate the opening angle of the jet. We use the expression from Sari et al. (1999),
| (2) |
where is in units of , is the circumburst density in units of , and is the time of the jet break. For AT 2021lfa, we adopt hr and . The opening angle, which is more sensitive to the timing of the break, is therefore . For AT 2021any, the shallower decay index suggests that we did not observe the transition. Taking d in the rest frame, and , we infer an opening angle of .
The optical light curves constrain our viewing angle. For AT 2021any, the shallow () index is consistent with an event viewed directly on-axis, in agreement with Gupta et al. (2021b). For AT 2021lfa, from the available photometry we cannot determine whether the event was initially viewed on-axis. However, given the high luminosity, it must have been viewed at least very close to on-axis.
Interestingly, of the five orphan optical afterglows observed so far, all show either a prominent break in the light curve or We discussed AT 2021any and AT 2021lfa above. AT 2020blt had a clear jet break (Ho et al., 2020b). AT 2019pim had a complicated light curve, with several segments having different decay indices: an early segment had while a later segment appeared to show a steeper value of , which could also represent a break. The light curve of PTF11agg was fit by a single power law with index , but possibly a value as steep as owing to the uncertainty in the burst time. The data are consistent with AT 2021any, AT 2019pim, and AT 2020blt being viewed within the initial opening angle of the jet, while AT 2021lfa and PTF11agg may have been viewed slightly off-axis.
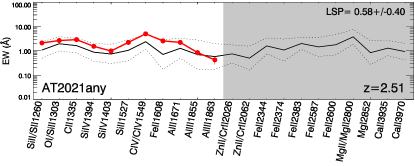
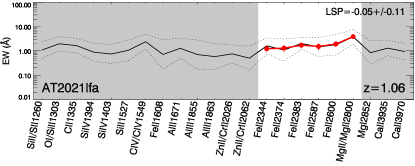
The optical spectra of AT 2021any and AT 2021lfa are also typical of LGRB afterglows. We compare the strength of the redshift-corrected spectral features of each object with those of a large sample of LGRB afterglow spectra. To do this, we calculate a line-strength parameter (LSP; de Ugarte Postigo et al. 2012) and construct a line-strength diagram.
| (3) |
In the case of AT 2021any, we obtain an LSP of , which implies that the observed features are stronger than those of 80% of the sample. The line-strength diagram for this spectrum (Figure 11) shows no clear deviations of the relative line strength of the lines with those of the sample, except perhaps a slight deficit of Al III. So although the lines are stronger than average, there is no significant difference in the ionization state or composition. For AT 2021lfa we calculate a value of LSP = , close to the average of the LGRB sample. The line-strength diagram (Figure 11) also shows a line-strength distribution that follows the average values of the sample, with the same relative strength of lines.
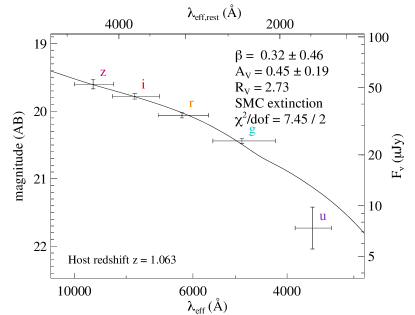
The optical to X-ray SEDs of AT 2021any and AT 2021lfa are also typical of LGRBs. For AT 2021any we take the NOT photometry from Zhu et al. (2021) at d, and find a spectral index of across the bands where . At this epoch, the spectral index from the optical to X-ray band is shallower, . We show the ultraviolet-optical-infrared (UVOIR) SED of AT 2021lfa in Figure 6. The best-fit observed spectral index is , including a rapid drop beteween the and bands, which implies host dust extinction. By fitting an SMC-like extinction law similar to that of the (SMC; Fitzpatrick, 1999; Gordon et al., 2003), we find and mag. At the epoch of the SEDM observation 0.3 d later, the optical to X-ray index is . The values of , , and are all standard for LGRB afterglows (Cenko et al., 2009; Greiner et al., 2011).
The low signal-to-noise ratio of our X-ray observations precludes a detailed analysis of the X-ray data, so we focus on comparing the overall X-ray luminosity to that of LGRB afterglows. For comparison we use the analysis of Swift/XRT data by Margutti et al. (2013). We estimate the rest-frame 0.3–30 keV luminosity of each of our events, converting the count rate to unabsorbed 0.3–30 keV flux using webpimms. We find for AT 2021any and for AT 2021lfa. These values are within the typical range for LGRB afterglows at these epochs. We can set upper limits of and on the fade rate for AT 2021any and AT 2021lfa, respectively, which are consistent with the typical in the epochs relevant to our observations (Margutti et al., 2013), and also with the fact that our X-ray data were obtained post-break for AT 2021lfa. Since a jet break should be achromatic (Rhoads, 1999), the X-ray light curve would be expected to be steep at this stage.
Our VLA radio observations of AT 2021lfa and AT 2021any constitute the first multifrequency radio observations of optical orphan afterglows having redshift measurements. AT 2020blt had only one detection, at 10 GHz (Ho et al., 2020b). PTF11agg had detailed observations with the VLA and CARMA, but no redshift measurement (Cenko et al., 2013). The spectral luminosities of at are typical of LGRBs (Chandra & Frail, 2012).
The 10 GHz radio light curves of AT 2021any and AT 2021lfa, which are shown in Figure 3, exhibit evidence for relatively short-timescale variability. Both show rapid fading from the first to second observation, and the light curve of AT 2021any has an abrupt rebrightening at d. The early fading in AT 2021lfa represents a factor-of-two flux decrease in a few hours. For AT 2021any, the flux drops by a factor of four from 4.91 d to 6.86 d. The rebrightening at represents a factor of 2–3 change in flux over seven days in the observer frame (two days in the rest frame); the fade represents a factor of 5–6 over the same timescale.
Interstellar scintillation can cause short-term variations at these frequencies, and we find that it likely makes a significant contribution to the light curve of AT 2021any. Scintillation results from small-scale inhomogeneities in the interstellar medium (ISM), which change the phase of an incoming wavefront. As the Earth moves, the line of sight to a background source changes, so the net effect is an observed change in flux. The effect is greatest for sources observed at a frequency that is close to the transition frequency , which separates strong scattering () from weak scattering (). Using the NE2001 model of the ISM (Cordes & Lazio, 2002), we find that the positions of AT 2021any and AT 2021lfa have a transition frequency GHz and GHz, respectively. So, the 10 GHz light curve of AT 2021any is very likely affected by scintillation. The 10 GHz light curve of AT 2021lfa may not be: it is possible that the earliest emission represents a truly distinct emission component, such as a reverse shock (Kulkarni et al., 1999; Sari et al., 1999; Harrison et al., 2001; Laskar et al., 2013; Perley et al., 2014; Laskar et al., 2016).
The SED evolution of AT 2021any is shown in Figure 5. The data at all epochs are fainter with increasing frequency, suggesting that the emission is optically thin at all epochs (i.e., that the synchrotron self-absorption frequency GHz). We fit a power law of the form to each epoch, and find significant changes with time. In particular, the spectral index appears to be steeper () during the brightest parts of the light curve. The spectral index is shallower () between brightening episodes, which is a more typical spectral index for GRB afterglows at frequencies below the cooling frequency (Granot & Sari, 2002). If the brightening is due to scintillation, it may be that the changing spectral index is also due to the frequency-dependent effects of scintillation.
In the full SED evolution of AT 2021lfa (Figure 6), which spans 7.83–103.58 d, we appear to observe the transition from optically thick to optically thin regimes. During the epochs 7.83–15.72 d, corresponding to the first peak and rise of the light curve, the data appear to be self-absorbed. We measure a power-law index of at d and an index of at d. By 21.71 d, the index has become significantly more shallow: we measure . During the fading of the light curve, at 47.74 d and 103.58 d, we measure an optically thin spectral index of and (respectively), indicating that the self-absorption frequency has passed through the VLA observing bands, and that the cooling frequency lies above the VLA bands at all epochs of observation.
In conclusion, we do not find any clear differences between the multiwavelength properties of the orphan optical afterglows and the population of LGRBs discovered by high-energy satellites, So, at this stage we have no evidence of a population of optical afterglows that are distinct from LGRBs. We address the implications in §4.
4 Discussion
In §3.2, we concluded that the optically discovered afterglows resemble the population of on-axis LGRBs in terms of their -ray to radio properties. Although the events listed in Table 2.3 were not selected in a fully consistent way, we can still draw valuable conclusions from the ratio of events with associated detected GRBs to those without.
4.1 Comparison to LGRB Rate
First we compare our detected afterglow rate to the LGRB rate. To do this, we adopt an approach similar to that of Cenko et al. (2013): construct a mock catalog of LGRBs, adopt a light curve from the Swift/BAT follow-up sample obtained with the P60 telescope (Cenko et al., 2009), then check how many of these events would have been discovered by us using ZTF by folding the light curve through the log of ZTF observations.
We created a log of all the observations in which we could have reliably discovered an afterglow. To be conservative, we only used field-nights in which an event could have been recognized via intranight fading. We used ztfquery and the ZTF observation log to select all field-nights in the years 2020 and 2021 with the following criteria:
-
1.
A typical limiting magnitude fainter than mag.
-
2.
At least two -band observations that night.
-
3.
An -band observation the previous night in the same filter with a limiting magnitude fainter than mag.
-
4.
A field with Galactic latitude deg.
Applying the criteria above resulted in an observation log of 19,190 field-nights and 35,171 unique observations. We used ztfquery to estimate a typical limiting magnitude for each of the field-nights in each filter.
Next, we constructed a mock catalog of LGRBs. In the last few years, Swift/BAT detected an average of 73 LGRBs . Accounting for the field of view and duty cycle in the same way as Cenko et al. (2013), we estimate an all-sky rate of 511 , slightly less than the rate of 630 adopted by Cenko et al. (2013) (which included SGRBs). In two years of ZTF, we therefore expect there to be 1022 LGRBs. We assigned each of our 1022 mock GRBs a random burst time , uniformly distributed between 1 January 2020 and 31 December 2021; a random R.A. and Decl. uniformly distributed across the sky; and a random GRB -band light curve based on the sample of Cenko et al. (2009). We excluded four events — GRB 050607, GRB 060110, GRB 071003, and GRB 071011 — because they had Galactic latitudes . For the light curve, we obtained P60 -band data from Cenko et al. (2009), and in some cases added photometry from the literature (Cenko et al., 2006b; Soderberg et al., 2007; Perley et al., 2008; Covino et al., 2008; Littlejohns et al., 2012). If the data did not extend to below the ZTF detection threshold, we extrapolated the light curve using the best-fit power law from Cenko et al. (2013).
We considered nine bursts “dark” to the P48252525GRB 050412, GRB 050915A, GRB 060510B, GRB 060805A, GRB 060923A, GRB 061222A, GRB 070521, GRB 080320, and GRB 050607.. For the remainder, we sampled the light curve using the ZTF observation log, to check if it would have been identified by us. We defined a detection as being 0.5 mag brighter than the limiting magnitude. We checked if the set of detections met the following criteria:
-
1.
First detection brighter than 20 mag.
-
2.
Pair of detections within the first night with separation where 0.02 d d.
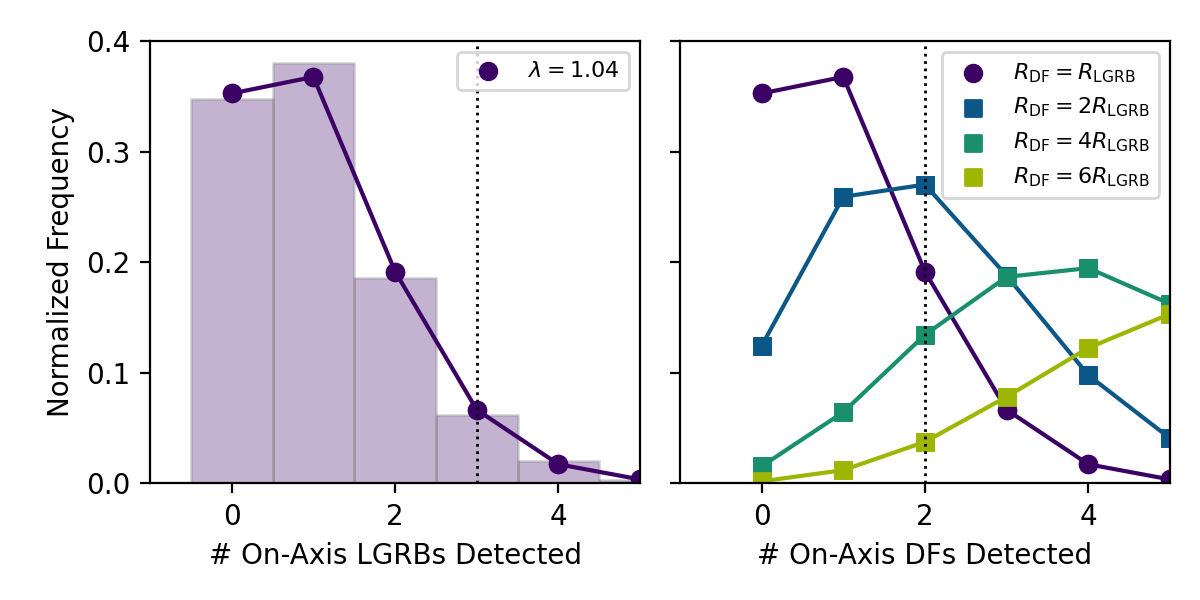
The above criteria were chosen to be a restrictive subset of our filter, so that we can be more confident in our completeness. Note that observations were grouped by field ID, so we ignore overlap between fields. Taking overlap into account would slightly increase the LGRB discovery rate. Three afterglows passed these criteria in 2020 and 2021 (AT 2020blt, AT 2021any, and AT 2021qbd), of which two (AT 2020blt and AT 2021any) were orphan.262626An additional source, AT 2021kym, passes the criteria if field overlap is taken into account.
We ran the simulation 1000 times, and the resulting number of expected detected LGRB afterglows is shown in the left panel of Figure 12. The vertical dotted line indicates the number of events we detected with ZTF under these criteria (which are more stringent than our actual criteria). We estimate that the probability of detecting one LGRB afterglow is 60%, while the probability of detecting three LGRB afterglows is only 7%; we can therefore be confident that our searches are reasonably complete. Detecting three events appears unlikely, but we cannot formally rule it out, particularly given the uncertainties in the expected number of LGRBs, which we estimate to be %. Thus, from a rate estimate we do not have definitive evidence of a new class of relativistic explosions.
4.2 The Rate of Dirty Fireballs
We did not detect any confirmed new class of relativistic explosions using our experiment, so can set the most robust upper limit to date on the dirty-fireball rate. A longstanding puzzle in the LGRB field is the “baryon loading problem”: that to efficiently produce -rays, the baryon loading content (Piran, 2004). In the baryon-rich environment of a massive-star interior, it may be more natural for jets to become mass-loaded, in which case they could not accelerate material to (Huang et al., 2002). It has been argued that dirty fireballs would have an energy similar to that of clean fireballs (with the energy in lower-Lorentz factor material; Huang et al. 2002) and would be similarly collimated (Rhoads, 2003), in which case the optical afterglows would closely resemble each other (Huang et al., 2002).
Even in the extreme case that all three orphan afterglows (AT 2020blt, AT 2021any, AT 2021lfa) are dirty fireballs, we can dismiss the possibility that dirty fireballs produce optical afterglows similar to those of LGRBs (as originally conceived) and are an order of magnitude more common than LGRBs. This result is not surprising. Cenko et al. (2015) and Ho et al. (2018) searched PTF data for extragalactic fast transients and recovered only one known GRB afterglow (iPTF14yb), already suggesting that dirty fireballs were not a significant population in the fast optical transient sky. Searches for fast X-ray transients have also resulted in the conclusion that the ratio of dirty () fireballs to LGRBs () can be no more than a factor of a few (Grindlay, 1999; Dermer et al., 1999; Greiner et al., 2000; Nakar & Piran, 2003).
To make this limit quantitative, we use the result from our simulation in Figure 12. The right panel of Figure 12 shows the expected number of detected on-axis dirty fireballs for different hypothetical rates relative to the LGRB rate, assuming the same afterglow properties for both groups. The vertical dotted line displays the number of orphan afterglows detected (AT 2020blt and AT 2021any). For each relative rate, we integrated the Poisson probability distribution function above to see when we would expect to see at least two events at 95% confidence. Assuming that both are dirty fireballs (which is unlikely), we rule out a scenario in which dirty fireballs produce similar on-axis optical afterglows to ordinary LGRBs and have a rate that is six times the LGRB rate (95% confidence). Assuming neither is a dirty fireball, which we consider more likely, the limit becomes three times the LGRB rate.
The lack of a large population of dirty fireballs has several possible explanations. One possibility is that mass-loaded jets are less likely to escape the envelope. Another is that the process of jet production and propagation somehow precludes the entrainment of matter. A final possibility is that low-Lorentz-factor jets are successful but produce significantly different optical afterglows; for example, if they have a lower energy per solid angle, the optical afterglow would be fainter. Lei et al. (2013) investigated two different jet-launching mechanisms and found that baryon-rich jets tended to be less luminous. A lower-Lorentz-factor outflow could also exhibit a longer plateau phase owing to the longer deceleration time (Shen & Matzner, 2012; Duffell & MacFadyen, 2015), resulting in suppressed early-afterglow emission. As calculated by Ho et al. (2020b), a dirty fireball with would have a deceleration time of 1.2 d. A typical rest-frame -band luminosity of LGRB afterglows at 1 d in the rest frame is (Racusin et al., 2011), about an order of magnitude fainter than the luminosity at which we are discovering afterglows (Figure 9). So, more sensitive searches may be required to test this scenario.
4.3 The Optical Beaming Factor
Finding optical afterglows without a GRB trigger is also of interest as a way to directly constrain the solid angle of the material producing optical afterglow emission, sometimes referred to as the “optical beaming factor,” . As discussed by Nakar & Piran (2003), the collimation-corrected GRB energy is typically calculated using the optical beaming factor, with an implicit assumption that (Frail et al., 2001; Panaitescu & Kumar, 2001). However, until now there has been no direct test of this assumption.
Our work establishes that . By the same argument as in §4.2, we find at 95% confidence, if our orphan events were viewed outside the -ray emitting region. If the orphan events were simply LGRBs missed by satellites, then we have . This result is consistent with top-hat jet models (the “spherical approximation”), because in these models, the beaming is expected to be similar for all of the relativistic material.
Nakar & Piran (2003) performed a similar exercise and came to a conclusion, using X-ray afterglows. They found that the X-ray beaming factor must be close to the -ray beaming factor, concluding that the bulk energies at (the -ray emitting material) and (the X-ray emitting material) are similar and that the homogeneous-jet approximation is reasonable. Our work shows that the energies in the -ray, X-ray, and optical-emitting material are all similar.
The result that the beaming factor of the afterglow-emitting material is similar to the beaming factor of the -ray-emitting material is consistent with jet structures predicted by simulations, and the emission predicted from analytical modeling. In collapsar simulations, the jet develops radial and angular structure from its interaction with the dense stellar material (Zhang et al., 2004; McKinney, 2006; Tchekhovskoy et al., 2008; Duffell & MacFadyen, 2015; Gottlieb et al., 2021). Most relevant for this work is the angular structure: a narrow ultrarelativistic core with a wide mildly relativistic sheath or cocoon, sometimes referred to as a “two-component jet” (see Granot & Ramirez-Ruiz 2010 for a review). The relative amount of energy in the wide and narrow components depends on a number of factors, but is likely at most comparable for successful jets (Ramirez-Ruiz et al., 2002; Nakar & Piran, 2017; De Colle et al., 2018). So, the energy per solid angle from the wider component should be significantly lower than that of the narrow component, leading to fainter afterglow emission, as predicted by Nakar & Piran (2017). We would therefore expect to be biased against afterglow emission from the wide-angle material in our current searches for cosmological () transients.
4.4 The Prevalence of Relativistic Jets in Collapsing Massive Stars
By searching for cosmological relativistic explosions in the ZTF data, we have found no clear new phenomenon that is more common than LGRBs. This result has implications for the fraction of CC SNe that harbor central engines and successful, LGRB-energy relativistic outflows. The observed rate of LGRBs has large uncertainties, as does the beaming fraction; from rates alone, the intrinsic LGRB rate could be anywhere from 0.01% to 1% of the CC SN rate (see Table 10 of Ho et al. 2020c). Radio searches have discovered one likely off-axis afterglow, and have constrained the rate to be 40–240 , or 0.06%–0.1% of the CC SN rate (Mooley et al., 2022). Our searches support the idea that energetic relativistic outflows are rare, i.e., that the rate is within a factor of a few of the LGRB rate. However, we cannot set any constraints on the prevalence of weaker, lower-energy jets.
5 Summary and Conclusions
In this paper, discovered by ZTF without a GRB trigger. Extragalactic fast transients powered by optically thin synchrotron emission can be efficiently discovered using high-cadence observations, by requiring rapid evolution (to rule out ordinary extragalactic transients like SNe) and red colors (to rule out the primary contaminant, stellar flares). Using rapid-turnaround optical spectroscopy, X-ray, and radio observations, we measured the redshift of almost all of the events, and showed that they closely resemble on-axis LGRB afterglows. rules out a scenario in which low-Lorentz-factor jets (“dirty” or “failed” fireballs) have an energy per solid angle similar to that of clean fireballs and are more common than classical GRBs, consistent with past searches at X-ray and optical wavelengths. In addition, we set the first direct constraint on the optical beaming factor in LGRBs, finding that it must be comparable to the -ray beaming factor.
Our searches were originally motivated by the search for dirty fireballs. The discovery of a population of optical afterglows with a rate greatly exceeding the LGRB rate would have lent strong support for their existence (Cenko et al., 2013). However, it is now clear that it is not so simple. It may be more efficient to search for the prompt X-ray emission expected to accompany a dirty fireball, such as the X-ray flashes found by HETE-2 (Sakamoto et al., 2005). This will become possible in the next few years with facilities such as the Space Variable Object Monitor (SVOM; Wei et al. 2016; Cordier et al. 2015) and Einstein-Probe (Yuan et al., 2018), and perhaps in the next decade with facilities like the Gamow Explorer (White et al., 2021). Millimeter-wavelength observations of the reverse shock could help infer the initial Lorentz factor (e.g., Laskar et al. 2019).
In addition, our current searches are not sensitive to fainter populations, such as highly off-axis afterglows or very dirty fireballs with a long deceleration time. Finding off-axis events is essential for studying LGRB jet structure, and the lack of a significant population of luminous dirty fireballs simplifies the picture. We will address search strategies for finding slower-evolving relativistic explosions in future studies.
Our work resulted in the discovery of orphan events of unknown origin, Ruling out an associated detected LGRB is not straightforward, and at present requires determining the pointing histories of different high-energy satellites; this work benefited from the coordination enabled by the IPN. Based on the coverage and sensitivity of the different spacecraft, the simplest explanation for the orphan events is that they were ordinary LGRBs for which the prompt emission was missed. To determine whether this was truly the case, more sensitive high-energy observations would be required. An all-sky facility with a fluence threshold equal to that of the BAT () could rule out an GRB out to , which includes all of the events in our sample. A burst with could be ruled out at .
With a much higher afterglow discovery rate, manual scanning and triggering will be impractical, as it already is for GRBs themselves. This would motivate an optical version of the Swift facility: autonomous candidate identification and triggering for confirmation. Some of the events in our sample could have been intranight triggers, since there was a nondetection followed by a detection on the same night. With a manageable false-positive rate, deep imaging facilities could confirm a candidate based on fade rate and colors. Spectroscopy to measure the redshift, and X-ray and radio follow-up observations to detect the afterglow at other wavelengths, could then be autonomously performed. Given that the typical time from the close of the ZTF shutter to the release of alerts is 8 min (Masci et al., 2019), with higher latencies primarily coming from crowded Galactic fields, it is not unreasonable to strive for afterglow identification, classification, and follow-up observations within 30 min of core collapse.
Appendix A Optical Photometry
In Table 6 we provide optical photometry for the afterglows in our sample.
| Name | Date | Inst. | Filt. | Mag | |
|---|---|---|---|---|---|
| (MJD) | (d) | (AB) | |||
| AT2021any | 59230.2916 | 0.0141 | P48‡ | ||
| AT2021any | 59230.3307 | 0.0532 | P48 | ||
| AT2021any | 59230.3316 | 0.0541 | P48 | ||
| AT2021any | 59230.3563 | 0.0788 | P48 | ||
| AT2021any | 59230.3712 | 0.0937 | P48 | ||
| AT2021any | 59230.3717 | 0.0942 | P48 | ||
| AT2021any | 59230.4303 | 0.1528 | P48 | ||
| AT2021any | 59230.9772 | 0.6997 | GTC | ||
| AT2021any | 59232.0096 | 1.7321 | CAHA | ||
| AT2021any | 59233.0184 | 2.7409 | CAHA | ||
| AT2020kym | 58993.2863 | 0.0752 | P48 | ||
| AT2020kym | 58993.2886 | 0.0775 | P48 | ||
| AT2020kym | 58993.3041 | 0.0930 | P48 | ||
| AT2020kym | 58993.3065 | 0.0954 | P48 | ||
| AT2020kym | 58994.2141 | 1.0029 | P48 | ||
| AT2020kym | 58994.2993 | 1.0882 | P48 | ||
| AT2021cwd | 59257.3697 | 0.2600 | P48 | ||
| AT2021cwd | 59257.4158 | 0.3061 | P48 | ||
| AT2021cwd | 59257.9850 | 0.8753 | LT | ||
| AT2021cwd | 59257.9860 | 0.8763 | LT | ||
| AT2021cwd | 59257.9871 | 0.8774 | LT | ||
| AT2021cwd | 59257.9895 | 0.8798 | LT | ||
| AT2021cwd | 59258.9459 | 1.8362 | LT | ||
| AT2021cwd | 59258.9509 | 1.8412 | LT | ||
| AT2021cwd | 59258.9559 | 1.8462 | LT | ||
| AT2021lfa | 59338.2324 | 0.9393 | P48 | ||
| AT2021lfa | 59338.3126 | 1.0195 | P48 | ||
| AT2021lfa | 59338.8893 | 1.5962 | LT | ||
| AT2021lfa | 59338.8920 | 1.5988 | LT | ||
| AT2021lfa | 59338.8946 | 1.6015 | LT | ||
| AT2021lfa | 59339.0342 | 1.7411 | LT | ||
| AT2021lfa | 59339.0376 | 1.7445 | LT | ||
| AT2021lfa | 59339.0403 | 1.7472 | LT | ||
| AT2021lfa | 59339.0429 | 1.7498 | LT | ||
| AT2021lfa | 59339.0456 | 1.7525 | LT | ||
| AT2021lfa | 59339.1898 | 1.8967 | SEDM | ||
| AT2021lfa | 59339.1925 | 1.8994 | SEDM | ||
| AT2021lfa | 59339.1952 | 1.9021 | SEDM | ||
| AT2021lfa | 59339.8817 | 2.5886 | LT | ||
| AT2021lfa | 59339.8868 | 2.5936 | LT | ||
| AT2021lfa | 59339.8917 | 2.5986 | LT | ||
| AT2021lfa | 59340.8923 | 3.5992 | LT | ||
| AT2021lfa | 59340.8973 | 3.6042 | LT | ||
| AT2021lfa | 59340.9023 | 3.6092 | LT | ||
| AT2021lfa | 59341.8829 | 4.5897 | LT | ||
| AT2021lfa | 59341.8878 | 4.5947 | LT | ||
| AT2021lfa | 59341.8928 | 4.5997 | LT | ||
| AT2021lfa | 59343.9336 | 6.6405 | LT | ||
| AT2021lfa | 59343.9419 | 6.6488 | LT | ||
| AT2021lfa | 59343.9501 | 6.6570 | LT | ||
| AT2021qbd | 59376.2325 | 0.4053 | P48 | ||
| AT2021qbd | 59376.2752 | 0.4480 | P48 | ||
| AT2021qbd | 59376.3206 | 0.4935 | P48 | ||
| AT2021qbd | 59376.3601 | 0.5329 | P48 | ||
| AT2021qbd | 59377.2694 | 1.4422 | P48 | ||
| AT2021qbd | 59377.3326 | 1.5055 | P48 | ||
| AT2021qbd | 59377.3336 | 1.5064 | P48 | ||
| AT2021qbd | 59377.3613 | 1.5341 | P48 | ||
| AT2021qbd | 59377.3959 | 1.5687 | P48 | ||
| AT2021qbd | 59378.2548 | 2.4277 | P48 | ||
| AT2021qbd | 59378.3232 | 2.4961 | P48 |
Appendix B X-ray Observations
In Table 7 we provide a log of our X-ray observations of the orphan afterglows AT 2021any and AT 2021lfa.
| Name | Date | Exp. | Count Rate | Flux‡‡ | |
|---|---|---|---|---|---|
| (MJD) | (d) | (ks) | () | () | |
| AT 2021any | 59231.10 | 0.83 | 3.7 | ||
| AT 2021any | 59234.08 | 3.80 | 2.6 | ||
| AT 2021any | 59239.58 | 9.31 | 2.9 | ||
| AT 2021lfa | 59339.23 | 1.94 | 5.0 | ||
| AT 2021lfa | 59341.69 | 4.39 | 5.1 |
Appendix C Radio Observations
In Table 8 we provide a log of our VLA radio observations of the orphan afterglows AT 2021any and AT 2021lfa.
| Name | Date | Band | |||||
|---|---|---|---|---|---|---|---|
| (MJD) | (d) | (GHz) | (GHz) | (Jy) | |||
| AT2021any | 59235.19 | 4.91 | X | 9.981 | 3.58 | A | |
| AT2021any | 59235.19 | 4.91 | X | 10.98 | 1.79 | A | |
| AT2021any | 59235.19 | 4.91 | X | 9.0 | 1.79 | A | |
| AT2021any | 59235.19 | 4.91 | X | 11.5 | 0.896 | A | |
| AT2021any | 59235.19 | 4.91 | X | 10.49 | 0.896 | A | |
| AT2021any | 59235.19 | 4.91 | X | 9.51 | 0.896 | A | |
| AT2021any | 59235.19 | 4.91 | X | 8.49 | 0.896 | A | |
| AT2021any | 59237.13 | 6.86 | X | 9.981 | 3.58 | A | |
| AT2021any | 59237.13 | 6.86 | X | 10.98 | 1.79 | A | |
| AT2021any | 59237.13 | 6.86 | X | 9.0 | 1.79 | A | |
| AT2021any | 59237.13 | 6.86 | X | 11.5 | 0.896 | A | |
| AT2021any | 59237.13 | 6.86 | X | 10.49 | 0.896 | A | |
| AT2021any | 59237.13 | 6.86 | X | 9.51 | 0.896 | A | |
| AT2021any | 59237.13 | 6.86 | Ku | 15.1 | 5.38 | A | |
| AT2021any | 59237.13 | 6.86 | Ku | 13.58 | 2.69 | A | |
| AT2021any | 59237.13 | 6.86 | Ku | 16.62 | 2.69 | A | |
| AT2021any | 59237.13 | 6.86 | Ku | 12.81 | 1.34 | A | |
| AT2021any | 59237.13 | 6.86 | Ku | 14.31 | 1.34 | A | |
| AT2021any | 59237.13 | 6.86 | Ku | 15.85 | 1.34 | A | |
| AT2021any | 59240.17 | 9.90 | S | 3.0 | 1.1 | A | |
| AT2021any | 59240.17 | 9.90 | S | 3.3 | 0.64 | A | |
| AT2021any | 59240.17 | 9.90 | S | 2.7 | 0.64 | A | |
| AT2021any | 59240.17 | 9.90 | C | 5.1 | 1.8 | A | |
| AT2021any | 59240.17 | 9.90 | C | 7.0 | 2.0 | A | |
| AT2021any | 59240.17 | 9.90 | C | 6.1 | 3.8 | A | |
| AT2021any | 59240.17 | 9.90 | X | 10.0 | 4.0 | A | |
| AT2021any | 59240.17 | 9.90 | X | 9.0 | 2.0 | A | |
| AT2021any | 59240.17 | 9.90 | Ku | 15.3 | 5.0 | A | |
| AT2021any | 59240.17 | 9.90 | Ku | 15.1 | 2.0 | A | |
| AT2021any | 59244.31 | 14.04 | X | 9.5 | 3.1 | A | |
| AT2021any | 59244.31 | 14.04 | X | 9.0 | 2.0 | A | |
| AT2021any | 59244.31 | 14.04 | X | 10.0 | 2.0 | A | |
| AT2021any | 59244.31 | 14.04 | X | 8.5 | 1.0 | A | |
| AT2021any | 59244.31 | 14.04 | X | 9.5 | 1.0 | A | |
| AT2021any | 59244.31 | 14.04 | X | 10.5 | 1.0 | A | |
| AT2021any | 59244.31 | 14.04 | X | 11.5 | 1.0 | A | |
| AT2021any | 59251.08 | 20.81 | X | 9.7 | 3.6 | A | |
| AT2021any | 59251.08 | 20.81 | X | 9.0 | 2.0 | A | |
| AT2021any | 59251.08 | 20.81 | X | 10.8 | 1.6 | A | |
| AT2021any | 59251.08 | 20.81 | X | 8.5 | 1.0 | A | |
| AT2021any | 59251.08 | 20.81 | X | 9.5 | 1.0 | A | |
| AT2021any | 59251.08 | 20.81 | X | 10.5 | 1.0 | A | |
| AT2021any | 59251.08 | 20.81 | X | 11.5 | 1.0 | A | |
| AT2021any | 59258.25 | 27.97 | X | 9.7 | 3.6 | A | |
| AT2021any | 59273.11 | 42.84 | X | 9.7 | 3.6 | A | |
| AT2021any | 59306.06 | 75.78 | X | 9.0 | 2.0 | D | |
| AT2021any | 59306.06 | 75.78 | X | 10.8 | 1.6 | D | |
| AT2021lfa | 59340.01 | 2.72 | X | 9.0 | 2.0 | D | |
| AT2021lfa | 59340.01 | 2.72 | X | 10.8 | 1.6 | D | |
| AT2021lfa | 59345.08 | 7.79 | X | 9.0 | 2.0 | D | |
| AT2021lfa | 59345.08 | 7.79 | X | 10.8 | 1.6 | D | |
| AT2021lfa | 59345.12 | 7.83 | Ku | 13.1 | 0.9 | D | |
| AT2021lfa | 59345.12 | 7.83 | Ku | 14.0 | 0.9 | D | |
| AT2021lfa | 59345.12 | 7.83 | Ku | 14.9 | 0.9 | D | |
| AT2021lfa | 59345.12 | 7.83 | Ku | 15.8 | 0.9 | D | |
| AT2021lfa | 59345.12 | 7.83 | Ku | 16.7 | 0.9 | D | |
| AT2021lfa | 59345.12 | 7.83 | Ku | 17.7 | 0.9 | D | |
| AT2021lfa | 59345.12 | 7.83 | X | 9.0 | 2.0 | D | |
| AT2021lfa | 59345.12 | 7.83 | X | 10.8 | 1.6 | D | |
| AT2021lfa | 59349.11 | 11.82 | Ku | 13.1 | 0.9 | D | |
| AT2021lfa | 59349.11 | 11.82 | Ku | 14.0 | 0.9 | D | |
| AT2021lfa | 59349.11 | 11.82 | Ku | 14.9 | 0.9 | D | |
| AT2021lfa | 59349.11 | 11.82 | Ku | 15.8 | 0.9 | D | |
| AT2021lfa | 59349.11 | 11.82 | Ku | 16.7 | 0.9 | D | |
| AT2021lfa | 59349.11 | 11.82 | Ku | 17.7 | 0.9 | D | |
| AT2021lfa | 59349.11 | 11.82 | X | 9.0 | 2.0 | D | |
| AT2021lfa | 59349.11 | 11.82 | X | 10.8 | 1.6 | D | |
| AT2021lfa | 59353.01 | 15.72 | Ku | 13.1 | 0.9 | D | |
| AT2021lfa | 59353.01 | 15.72 | Ku | 14.0 | 0.9 | D | |
| AT2021lfa | 59353.01 | 15.72 | Ku | 14.9 | 0.9 | D | |
| AT2021lfa | 59353.01 | 15.72 | Ku | 15.8 | 0.9 | D | |
| AT2021lfa | 59353.01 | 15.72 | Ku | 16.7 | 0.9 | D | |
| AT2021lfa | 59353.01 | 15.72 | Ku | 17.7 | 0.9 | D | |
| AT2021lfa | 59353.01 | 15.72 | X | 9.0 | 2.0 | D | |
| AT2021lfa | 59353.01 | 15.72 | X | 10.8 | 1.6 | D | |
| AT2021lfa | 59359.00 | 21.71 | Ku | 13.1 | 0.9 | D | |
| AT2021lfa | 59359.00 | 21.71 | Ku | 14.0 | 0.9 | D | |
| AT2021lfa | 59359.00 | 21.71 | Ku | 14.9 | 0.9 | D | |
| AT2021lfa | 59359.00 | 21.71 | Ku | 15.8 | 0.9 | D | |
| AT2021lfa | 59359.00 | 21.71 | Ku | 16.7 | 0.9 | D | |
| AT2021lfa | 59359.00 | 21.71 | Ku | 17.7 | 0.9 | D | |
| AT2021lfa | 59359.00 | 21.71 | X | 9.0 | 2.0 | D | |
| AT2021lfa | 59359.00 | 21.71 | X | 10.8 | 1.6 | D | |
| AT2021lfa | 59385.03 | 47.74 | X | 9.0 | 2.0 | DtoC | |
| AT2021lfa | 59385.03 | 47.74 | X | 10.8 | 1.6 | DtoC | |
| AT2021lfa | 59440.03 | 102.73 | L | 1.43 | 0.4 | C | |
| AT2021lfa | 59440.03 | 102.73 | L | 1.81 | 0.4 | C | |
| AT2021lfa | 59440.03 | 102.73 | C | 4.5 | 1.0 | C | |
| AT2021lfa | 59440.03 | 102.73 | C | 5.5 | 1.0 | C | |
| AT2021lfa | 59440.03 | 102.73 | C | 6.5 | 1.0 | C | |
| AT2021lfa | 59440.03 | 102.73 | C | 7.5 | 1.0 | C | |
| AT2021lfa | 59440.03 | 102.73 | C | 5.0 | 2.0 | C | |
| AT2021lfa | 59440.03 | 102.73 | C | 7.0 | 2.0 | C | |
| AT2021lfa | 59440.87 | 103.58 | Ku | 13.1 | 2.0 | C | |
| AT2021lfa | 59440.87 | 103.58 | Ku | 15.1 | 2.0 | C | |
| AT2021lfa | 59440.87 | 103.58 | Ku | 17.1 | 2.0 | C | |
| AT2021lfa | 59440.87 | 103.58 | X | 8.5 | 1.0 | C | |
| AT2021lfa | 59440.87 | 103.58 | X | 9.5 | 1.0 | C | |
| AT2021lfa | 59440.87 | 103.58 | X | 10.5 | 1.0 | C | |
| AT2021lfa | 59440.87 | 103.58 | X | 11.5 | 1.0 | C | |
| AT2021lfa | 59440.87 | 103.58 | X | 9.0 | 2.0 | C | |
| AT2021lfa | 59440.87 | 103.58 | X | 11.0 | 2.0 | C | |
| AT2021lfa | 59440.87 | 103.58 | C | 4.5 | 1.0 | C | |
| AT2021lfa | 59440.87 | 103.58 | C | 5.5 | 1.0 | C | |
| AT2021lfa | 59440.87 | 103.58 | C | 6.5 | 1.0 | C | |
| AT2021lfa | 59440.87 | 103.58 | C | 7.5 | 1.0 | C | |
| AT2021lfa | 59440.87 | 103.58 | C | 5.0 | 2.0 | C | |
| AT2021lfa | 59440.87 | 103.58 | C | 7.0 | 2.0 | C | |
| AT2021lfa | 59509.61 | 172.32 | Ku | 12.5 | 1.0 | B | |
| AT2021lfa | 59509.61 | 172.32 | Ku | 13.5 | 1.0 | B | |
| AT2021lfa | 59509.61 | 172.32 | Ku | 14.5 | 1.0 | B | |
| AT2021lfa | 59509.61 | 172.32 | Ku | 15.5 | 1.0 | B | |
| AT2021lfa | 59509.61 | 172.32 | Ku | 16.5 | 1.0 | B | |
| AT2021lfa | 59509.61 | 172.32 | Ku | 17.5 | 1.0 | B | |
| AT2021lfa | 59509.61 | 172.32 | Ku | 13.1 | 2.0 | B | |
| AT2021lfa | 59509.61 | 172.32 | Ku | 15.1 | 2.0 | B | |
| AT2021lfa | 59509.61 | 172.32 | Ku | 17.1 | 2.0 | B | |
| AT2021lfa | 59509.61 | 172.32 | X | 9.0 | 2.0 | B | |
| AT2021lfa | 59509.61 | 172.32 | X | 11.0 | 2.0 | B | |
| AT2021lfa | 59509.61 | 172.32 | X | 10.0 | 4.1 | B | |
| AT2021lfa | 59509.61 | 172.32 | C | 5.0 | 2.0 | B | |
| AT2021lfa | 59509.61 | 172.32 | C | 7.0 | 2.0 | B | |
| AT2021lfa | 59517.54 | 180.24 | C | 5.0 | 2.0 | B | |
| AT2021lfa | 59517.54 | 180.24 | C | 7.0 | 2.0 | B | |
| AT2021lfa | 59582.39 | 245.10 | Ku | 15.1 | 6.1 | B | |
| AT2021lfa | 59582.39 | 245.10 | Ku | 13.6 | 3.1 | B | |
| AT2021lfa | 59582.39 | 245.10 | Ku | 16.6 | 3.1 | B | |
| AT2021lfa | 59582.39 | 245.10 | Ku | 12.8 | 1.5 | B | |
| AT2021lfa | 59582.39 | 245.10 | Ku | 14.3 | 1.5 | B | |
| AT2021lfa | 59582.39 | 245.10 | Ku | 15.8 | 1.5 | B | |
| AT2021lfa | 59582.39 | 245.10 | Ku | 17.4 | 1.5 | B | |
| AT2021lfa | 59582.39 | 245.10 | X | 10.0 | 4.1 | B | |
| AT2021lfa | 59582.39 | 245.10 | X | 9.0 | 2.0 | B | |
| AT2021lfa | 59582.39 | 245.10 | X | 11.0 | 2.0 | B | |
| AT2021lfa | 59582.39 | 245.10 | C | 6.1 | 3.8 | B | |
| AT2021lfa | 59582.39 | 245.10 | C | 7.0 | 2.0 | B | |
| AT2021lfa | 59582.39 | 245.10 | C | 5.1 | 1.8 | B |
References
- Ahumada et al. (2021) Ahumada, T., Della Costa, J., Cenko, B., & Quimby, R. 2021, GRB Coordinates Network, 29309, 1
- Alexander et al. (2021) Alexander, K. D., Laskar, T., Kilpatrick, C., et al. 2021, GRB Coordinates Network, 30218, 1
- Andreoni et al. (2020a) Andreoni, I., Kool, E. C., Sagués Carracedo, A., et al. 2020a, ApJ, 904, 155, doi: 10.3847/1538-4357/abbf4c
- Andreoni et al. (2020b) Andreoni, I., Lu, W., Smith, R. M., et al. 2020b, ApJ, 896, L2, doi: 10.3847/2041-8213/ab94a5
- Andreoni et al. (2021) Andreoni, I., Coughlin, M. W., Kool, E. C., et al. 2021, ApJ, 918, 63, doi: 10.3847/1538-4357/ac0bc7
- Aptekar et al. (1995) Aptekar, R. L., Frederiks, D. D., Golenetskii, S. V., et al. 1995, Space Sci. Rev., 71, 265, doi: 10.1007/BF00751332
- Astropy Collaboration et al. (2013) Astropy Collaboration, Robitaille, T. P., Tollerud, E. J., et al. 2013, A&A, 558, A33, doi: 10.1051/0004-6361/201322068
- Astropy Collaboration et al. (2018) Astropy Collaboration, Price-Whelan, A. M., Sipőcz, B. M., et al. 2018, AJ, 156, 123, doi: 10.3847/1538-3881/aabc4f
- Atwood et al. (2009) Atwood, W. B., Abdo, A. A., Ackermann, M., et al. 2009, ApJ, 697, 1071, doi: 10.1088/0004-637X/697/2/1071
- Barthelmy et al. (2005) Barthelmy, S. D., Barbier, L. M., Cummings, J. R., et al. 2005, Space Sci. Rev., 120, 143, doi: 10.1007/s11214-005-5096-3
- Belkin et al. (2020) Belkin, S., Novichonok, A., Pozanenko, A., et al. 2020, GRB Coordinates Network, 27820, 1
- Belkin et al. (2021) Belkin, S., Pozanenko, A., Klunko, E., et al. 2021, GRB Coordinates Network, 29417, 1
- Bellm (2016) Bellm, E. C. 2016, PASP, 128, 084501, doi: 10.1088/1538-3873/128/966/084501
- Bellm et al. (2019a) Bellm, E. C., Kulkarni, S. R., Graham, M. J., et al. 2019a, PASP, 131, 018002, doi: 10.1088/1538-3873/aaecbe
- Bellm et al. (2019b) Bellm, E. C., Kulkarni, S. R., Barlow, T., et al. 2019b, PASP, 131, 068003, doi: 10.1088/1538-3873/ab0c2a
- Berger (2014) Berger, E. 2014, ARA&A, 52, 43, doi: 10.1146/annurev-astro-081913-035926
- Berger et al. (2013) Berger, E., Leibler, C. N., Chornock, R., et al. 2013, ApJ, 779, 18, doi: 10.1088/0004-637X/779/1/18
- Bhalerao et al. (2017) Bhalerao, V., Kasliwal, M. M., Bhattacharya, D., et al. 2017, ApJ, 845, 152, doi: 10.3847/1538-4357/aa81d2
- Blagorodnova et al. (2018) Blagorodnova, N., Neill, J. D., Walters, R., et al. 2018, PASP, 130, 035003, doi: 10.1088/1538-3873/aaa53f
- Blazek et al. (2020) Blazek, M., Kann, D. A., de Ugarte Postigo, A., et al. 2020, GRB Coordinates Network, 27810, 1
- Burrows et al. (2005) Burrows, D. N., Hill, J. E., Nousek, J. A., et al. 2005, Space Sci. Rev., 120, 165, doi: 10.1007/s11214-005-5097-2
- Butler et al. (2021) Butler, N., Watson, A. M., Kutyrev, A., et al. 2021, GRB Coordinates Network, 29941, 1
- Butler et al. (2005) Butler, N. R., Sakamoto, T., Suzuki, M., et al. 2005, ApJ, 621, 884, doi: 10.1086/427746
- Cano et al. (2017) Cano, Z., Wang, S.-Q., Dai, Z.-G., & Wu, X.-F. 2017, Advances in Astronomy, 2017, 8929054, doi: 10.1155/2017/8929054
- Capalbi et al. (2020) Capalbi, M., Perri, M., D’Elia, V., et al. 2020, GRB Coordinates Network, 27811, 1
- Cenko et al. (2006a) Cenko, S. B., Fox, D. B., Moon, D.-S., et al. 2006a, PASP, 118, 1396, doi: 10.1086/508366
- Cenko et al. (2006b) Cenko, S. B., Kasliwal, M., Harrison, F. A., et al. 2006b, ApJ, 652, 490, doi: 10.1086/508149
- Cenko et al. (2009) Cenko, S. B., Kelemen, J., Harrison, F. A., et al. 2009, ApJ, 693, 1484, doi: 10.1088/0004-637X/693/2/1484
- Cenko et al. (2011) Cenko, S. B., Frail, D. A., Harrison, F. A., et al. 2011, ApJ, 732, 29, doi: 10.1088/0004-637X/732/1/29
- Cenko et al. (2013) Cenko, S. B., Kulkarni, S. R., Horesh, A., et al. 2013, ApJ, 769, 130, doi: 10.1088/0004-637X/769/2/130
- Cenko et al. (2015) Cenko, S. B., Urban, A. L., Perley, D. A., et al. 2015, ApJ, 803, L24, doi: 10.1088/2041-8205/803/2/L24
- Cepa et al. (2000) Cepa, J., Aguiar, M., Escalera, V. G., et al. 2000, in Society of Photo-Optical Instrumentation Engineers (SPIE) Conference Series, Vol. 4008, Optical and IR Telescope Instrumentation and Detectors, ed. M. Iye & A. F. Moorwood, 623–631, doi: 10.1117/12.395520
- Chambers et al. (2016) Chambers, K. C., Magnier, E. A., Metcalfe, N., et al. 2016, arXiv e-prints, arXiv:1612.05560. https://arxiv.org/abs/1612.05560
- Chandra et al. (2021) Chandra, P., Bhalerao, V., Misra, K., & Anupama, G. C. 2021, GRB Coordinates Network, 29541, 1
- Chandra & Frail (2012) Chandra, P., & Frail, D. A. 2012, ApJ, 746, 156, doi: 10.1088/0004-637X/746/2/156
- Cordes & Lazio (2002) Cordes, J. M., & Lazio, T. J. W. 2002, arXiv e-prints, astro. https://arxiv.org/abs/astro-ph/0207156
- Cordier et al. (2015) Cordier, B., Wei, J., Atteia, J. L., et al. 2015, arXiv e-prints, arXiv:1512.03323. https://arxiv.org/abs/1512.03323
- Coughlin & Ahumada (2021a) Coughlin, M., & Ahumada, T. 2021a, GRB Coordinates Network, 29316, 1
- Coughlin & Ahumada (2021b) —. 2021b, GRB Coordinates Network, 29316, 1
- Coulter et al. (2017) Coulter, D. A., Foley, R. J., Kilpatrick, C. D., et al. 2017, Science, 358, 1556, doi: 10.1126/science.aap9811
- Covino et al. (2008) Covino, S., D’Avanzo, P., Klotz, A., et al. 2008, MNRAS, 388, 347, doi: 10.1111/j.1365-2966.2008.13393.x
- Cowperthwaite et al. (2017) Cowperthwaite, P. S., Berger, E., Villar, V. A., et al. 2017, ApJ, 848, L17, doi: 10.3847/2041-8213/aa8fc7
- Dalal et al. (2002) Dalal, N., Griest, K., & Pruet, J. 2002, ApJ, 564, 209, doi: 10.1086/324142
- De Colle et al. (2018) De Colle, F., Lu, W., Kumar, P., Ramirez-Ruiz, E., & Smoot, G. 2018, MNRAS, 478, 4553, doi: 10.1093/mnras/sty1282
- de Ugarte Postigo et al. (2014) de Ugarte Postigo, A., Blazek, M., Janout, P., et al. 2014, in Society of Photo-Optical Instrumentation Engineers (SPIE) Conference Series, Vol. 9152, Software and Cyberinfrastructure for Astronomy III, ed. G. Chiozzi & N. M. Radziwill, 91520B, doi: 10.1117/12.2055774
- de Ugarte Postigo et al. (2020) de Ugarte Postigo, A., Kann, D. A., Blazek, M., et al. 2020, GRB Coordinates Network, 27807, 1
- de Ugarte Postigo et al. (2021a) de Ugarte Postigo, A., Kann, D. A., Perley, D. A., et al. 2021a, GRB Coordinates Network, 29307, 1
- de Ugarte Postigo et al. (2021b) de Ugarte Postigo, A., Thoene, C., Agui Fernandez, J. F., et al. 2021b, GRB Coordinates Network, 30194, 1
- de Ugarte Postigo et al. (2012) de Ugarte Postigo, A., Fynbo, J. P. U., Thöne, C. C., et al. 2012, A&A, 548, A11, doi: 10.1051/0004-6361/201219894
- Dekany et al. (2020) Dekany, R., Smith, R. M., Riddle, R., et al. 2020, PASP, 132, 038001, doi: 10.1088/1538-3873/ab4ca2
- Dermer et al. (1999) Dermer, C. D., Chiang, J., & Böttcher, M. 1999, ApJ, 513, 656, doi: 10.1086/306871
- Dey et al. (2019) Dey, A., Schlegel, D. J., Lang, D., et al. 2019, AJ, 157, 168, doi: 10.3847/1538-3881/ab089d
- Drout et al. (2017) Drout, M. R., Piro, A. L., Shappee, B. J., et al. 2017, Science, 358, 1570, doi: 10.1126/science.aaq0049
- Duev et al. (2019) Duev, D. A., Mahabal, A., Masci, F. J., et al. 2019, MNRAS, 489, 3582, doi: 10.1093/mnras/stz2357
- Duffell & MacFadyen (2015) Duffell, P. C., & MacFadyen, A. I. 2015, ApJ, 806, 205, doi: 10.1088/0004-637X/806/2/205
- Dutta et al. (2021) Dutta, A., Kumar, H., Sahu, D. K., et al. 2021, GRB Coordinates Network, 30201, 1
- Evans & Swift Team (2020) Evans, P. A., & Swift Team. 2020, GRB Coordinates Network, 27798, 1
- Evans & Swift Team (2021) —. 2021, GRB Coordinates Network, 29412, 1
- Evans et al. (2007) Evans, P. A., Beardmore, A. P., Page, K. L., et al. 2007, A&A, 469, 379, doi: 10.1051/0004-6361:20077530
- Fana Dirirsa et al. (2020) Fana Dirirsa, F., Axelsson, M., Ohno, M., et al. 2020, GRB Coordinates Network, 27797, 1
- Fausnaugh et al. (2019) Fausnaugh, M. M., Vanderspek, R., & TESS Team. 2019, GRB Coordinates Network, 25982, 1
- Fermi GBM Team (2021) Fermi GBM Team. 2021, GRB Coordinates Network, 29390, 1
- Filippenko (1982) Filippenko, A. V. 1982, PASP, 94, 715, doi: 10.1086/131052
- Fitzpatrick (1999) Fitzpatrick, E. L. 1999, PASP, 111, 63, doi: 10.1086/316293
- Frail et al. (2001) Frail, D. A., Kulkarni, S. R., Sari, R., et al. 2001, ApJ, 562, L55, doi: 10.1086/338119
- Frederiks & Konus-Wind Team (2021) Frederiks, D., & Konus-Wind Team. 2021, GRB Coordinates Network, 29424, 1
- Frederiks et al. (2021a) Frederiks, D., Golenetskii, S., Lysenko, A., et al. 2021a, GRB Coordinates Network, 29415, 1
- Frederiks et al. (2021b) —. 2021b, GRB Coordinates Network, 30196, 1
- Fremling et al. (2016) Fremling, C., Sollerman, J., Taddia, F., et al. 2016, A&A, 593, A68, doi: 10.1051/0004-6361/201628275
- Fremling et al. (2020) Fremling, C., Miller, A. A., Sharma, Y., et al. 2020, ApJ, 895, 32, doi: 10.3847/1538-4357/ab8943
- Fu et al. (2021) Fu, S. Y., Zhu, Z. P., Liu, X., et al. 2021, GRB Coordinates Network, 29948, 1
- Fynbo et al. (2021) Fynbo, J. P. U., Izzo, L., de Ugarte Postigo, A., Malesani, D. B., & Pursimo, T. 2021, GRB Coordinates Network, 30182, 1
- Gal-Yam et al. (2006) Gal-Yam, A., Ofek, E. O., Poznanski, D., et al. 2006, ApJ, 639, 331, doi: 10.1086/499157
- Gehrels et al. (2004) Gehrels, N., Chincarini, G., Giommi, P., et al. 2004, ApJ, 611, 1005, doi: 10.1086/422091
- Ghosh et al. (2021) Ghosh, A., Dimple, Kumar, A., et al. 2021, GRB Coordinates Network, 29364, 1
- Gimeno et al. (2016) Gimeno, G., Roth, K., Chiboucas, K., et al. 2016, in Society of Photo-Optical Instrumentation Engineers (SPIE) Conference Series, Vol. 9908, Ground-based and Airborne Instrumentation for Astronomy VI, ed. C. J. Evans, L. Simard, & H. Takami, 99082S, doi: 10.1117/12.2233883
- Gordon et al. (2003) Gordon, K. D., Clayton, G. C., Misselt, K. A., Landolt, A. U., & Wolff, M. J. 2003, ApJ, 594, 279, doi: 10.1086/376774
- Gottlieb et al. (2021) Gottlieb, O., Nakar, E., & Bromberg, O. 2021, MNRAS, 500, 3511, doi: 10.1093/mnras/staa3501
- Graham et al. (2019) Graham, M. J., Kulkarni, S. R., Bellm, E. C., et al. 2019, PASP, 131, 078001, doi: 10.1088/1538-3873/ab006c
- Granot et al. (2002) Granot, J., Panaitescu, A., Kumar, P., & Woosley, S. E. 2002, ApJ, 570, L61, doi: 10.1086/340991
- Granot & Ramirez-Ruiz (2010) Granot, J., & Ramirez-Ruiz, E. 2010, arXiv e-prints, arXiv:1012.5101. https://arxiv.org/abs/1012.5101
- Granot & Sari (2002) Granot, J., & Sari, R. 2002, ApJ, 568, 820, doi: 10.1086/338966
- Greiner et al. (2000) Greiner, J., Hartmann, D. H., Voges, W., et al. 2000, A&A, 353, 998. https://arxiv.org/abs/astro-ph/9910300
- Greiner et al. (2011) Greiner, J., Krühler, T., Klose, S., et al. 2011, A&A, 526, A30, doi: 10.1051/0004-6361/201015458
- Grindlay (1999) Grindlay, J. E. 1999, ApJ, 510, 710, doi: 10.1086/306617
- Gruber et al. (2014) Gruber, D., Goldstein, A., Weller von Ahlefeld, V., et al. 2014, ApJS, 211, 12, doi: 10.1088/0067-0049/211/1/12
- Guelbenzu et al. (2021) Guelbenzu, A. N., Rau, A., & Klose, S. 2021, GRB Coordinates Network, 29330, 1
- Gupta et al. (2021a) Gupta, R., Pandey, S. B., Kumar, A., et al. 2021a, GRB Coordinates Network, 29490, 1
- Gupta et al. (2021b) Gupta, R., Kumar, A., Bhushan Pandey, S., et al. 2021b, arXiv e-prints, arXiv:2111.11795. https://arxiv.org/abs/2111.11795
- Gupta et al. (2020) Gupta, S., Sharma, V., Bhattacharya, D., et al. 2020, GRB Coordinates Network, 27818, 1
- Harrison et al. (2001) Harrison, F. A., Yost, S. A., Sari, R., et al. 2001, arXiv e-prints, astro. https://arxiv.org/abs/astro-ph/0103377
- Heise et al. (2001) Heise, J., Zand, J. I., Kippen, R. M., & Woods, P. M. 2001, in Gamma-ray Bursts in the Afterglow Era, ed. E. Costa, F. Frontera, & J. Hjorth, 16, doi: 10.1007/10853853_4
- Ho et al. (2021a) Ho, A., Yao, Y., & Perley, D. 2021a, GRB Coordinates Network, 29953, 1
- Ho et al. (2021b) Ho, A. Y. Q., Perley, D. A., Yao, Y., & Andreoni, I. 2021b, Transient Name Server AstroNote, 20, 1
- Ho et al. (2020a) Ho, A. Y. Q., Yao, Y., Perley, D. A., & GROWTH Collaboration. 2020a, GRB Coordinates Network, 25658, 1
- Ho et al. (2018) Ho, A. Y. Q., Kulkarni, S. R., Nugent, P. E., et al. 2018, ApJ, 854, L13, doi: 10.3847/2041-8213/aaaa62
- Ho et al. (2020b) Ho, A. Y. Q., Perley, D. A., Beniamini, P., et al. 2020b, ApJ, 905, 98, doi: 10.3847/1538-4357/abc34d
- Ho et al. (2020c) Ho, A. Y. Q., Perley, D. A., Kulkarni, S. R., et al. 2020c, ApJ, 895, 49, doi: 10.3847/1538-4357/ab8bcf
- Ho et al. (2021c) Ho, A. Y. Q., Perley, D. A., Gal-Yam, A., et al. 2021c, arXiv e-prints, arXiv:2105.08811. https://arxiv.org/abs/2105.08811
- Hook et al. (2004) Hook, I. M., Jørgensen, I., Allington-Smith, J. R., et al. 2004, PASP, 116, 425, doi: 10.1086/383624
- Hosokawa et al. (2020) Hosokawa, R., Nakamura, N., Murata, K. L., et al. 2020, GRB Coordinates Network, 27824, 1
- Huang et al. (2002) Huang, Y. F., Dai, Z. G., & Lu, T. 2002, MNRAS, 332, 735, doi: 10.1046/j.1365-8711.2002.05334.x
- Huang et al. (2004) Huang, Y. F., Wu, X. F., Dai, Z. G., Ma, H. T., & Lu, T. 2004, ApJ, 605, 300, doi: 10.1086/382202
- Huang et al. (2020) Huang, Y.-J., Urata, Y., Huang, K., et al. 2020, ApJ, 897, 69, doi: 10.3847/1538-4357/ab8f9a
- Hunter (2007) Hunter, J. D. 2007, Computing in Science and Engineering, 9, 90, doi: 10.1109/MCSE.2007.55
- Hurley et al. (2021) Hurley, K., Ipn, Mitrofanov, I. G., et al. 2021, GRB Coordinates Network, 29408, 1
- Izzo (2020) Izzo, L. 2020, GRB Coordinates Network, 27817, 1
- Kann et al. (2021a) Kann, D. A., de Ugarte Postigo, A., Thoene, C. C., et al. 2021a, GRB Coordinates Network, 29321, 1
- Kann et al. (2010) Kann, D. A., Klose, S., Zhang, B., et al. 2010, ApJ, 720, 1513, doi: 10.1088/0004-637X/720/2/1513
- Kann et al. (2011) —. 2011, ApJ, 734, 96, doi: 10.1088/0004-637X/734/2/96
- Kann et al. (2021b) Kann, D. A., Nicuesa Guelbenzu, A., de Ugarte Postigo, A., et al. 2021b, GRB Coordinates Network, 29344, 1
- Kasliwal et al. (2017) Kasliwal, M. M., Nakar, E., Singer, L. P., et al. 2017, Science, 358, 1559, doi: 10.1126/science.aap9455
- Kasliwal et al. (2019) Kasliwal, M. M., Cannella, C., Bagdasaryan, A., et al. 2019, PASP, 131, 038003, doi: 10.1088/1538-3873/aafbc2
- Kasliwal et al. (2020) Kasliwal, M. M., Anand, S., Ahumada, T., et al. 2020, ApJ, 905, 145, doi: 10.3847/1538-4357/abc335
- Kennea et al. (2021) Kennea, J. A., Osborne, J. P., Page, K. L., et al. 2021, GRB Coordinates Network, 29413, 1
- Khabibullin et al. (2012) Khabibullin, I., Sazonov, S., & Sunyaev, R. 2012, MNRAS, 426, 1819, doi: 10.1111/j.1365-2966.2012.21807.x
- Kim et al. (2021) Kim, V., Pankov, N., Krugov, M., et al. 2021, GRB Coordinates Network, 29950, 1
- Kool et al. (2021) Kool, E., Andreoni, I., Ho, A., et al. 2021, Transient Name Server AstroNote, 54, 1
- Kouveliotou et al. (2012) Kouveliotou, C., Wijers, R. A. M. J., & Woosley, S. 2012, Gamma-ray Bursts
- Krühler et al. (2009) Krühler, T., Greiner, J., Afonso, P., et al. 2009, A&A, 508, 593, doi: 10.1051/0004-6361/200912649
- Kuin et al. (2020) Kuin, N. P. M., Page, K. L., & Swift UVOT Team. 2020, GRB Coordinates Network, 27825, 1
- Kulkarni et al. (1999) Kulkarni, S. R., Djorgovski, S. G., Odewahn, S. C., et al. 1999, Nature, 398, 389, doi: 10.1038/18821
- Kumar et al. (2020a) Kumar, A., Pandey, S. B., Ghosh, A., et al. 2020a, GRB Coordinates Network, 27806, 1
- Kumar et al. (2021) Kumar, A., Pandey, S. B., Gupta, R., et al. 2021, GRB Coordinates Network, 29308, 1
- Kumar et al. (2020b) Kumar, H., Bhalerao, V., Anupama, G. C., et al. 2020b, GRB Coordinates Network, 27800, 1
- Kumar & Zhang (2015) Kumar, P., & Zhang, B. 2015, Phys. Rep., 561, 1, doi: 10.1016/j.physrep.2014.09.008
- Laskar et al. (2013) Laskar, T., Berger, E., Zauderer, B. A., et al. 2013, ApJ, 776, 119, doi: 10.1088/0004-637X/776/2/119
- Laskar et al. (2016) Laskar, T., Alexander, K. D., Berger, E., et al. 2016, ApJ, 833, 88, doi: 10.3847/1538-4357/833/1/88
- Laskar et al. (2019) Laskar, T., van Eerten, H., Schady, P., et al. 2019, ApJ, 884, 121, doi: 10.3847/1538-4357/ab40ce
- Laskar et al. (2021) Laskar, T., Alexander, K. D., Kilpatrick, C., et al. 2021, GRB Coordinates Network, 30217, 1
- Law et al. (2018) Law, C. J., Gaensler, B. M., Metzger, B. D., Ofek, E. O., & Sironi, L. 2018, ApJ, 866, L22, doi: 10.3847/2041-8213/aae5f3
- Law et al. (2009) Law, N. M., Kulkarni, S. R., Dekany, R. G., et al. 2009, PASP, 121, 1395, doi: 10.1086/648598
- Lei et al. (2013) Lei, W.-H., Zhang, B., & Liang, E.-W. 2013, ApJ, 765, 125, doi: 10.1088/0004-637X/765/2/125
- Levinson et al. (2002) Levinson, A., Ofek, E. O., Waxman, E., & Gal-Yam, A. 2002, ApJ, 576, 923, doi: 10.1086/341866
- Li et al. (2021) Li, C. Y., Xiong, S. L., Xiao, S., et al. 2021, GRB Coordinates Network, 29392, 1
- Li et al. (2012) Li, L., Liang, E.-W., Tang, Q.-W., et al. 2012, ApJ, 758, 27, doi: 10.1088/0004-637X/758/1/27
- Lipunov et al. (2020) Lipunov, V., Gorbovskoy, E., Kornilov, V., et al. 2020, GRB Coordinates Network, 27801, 1
- Lipunov et al. (2021) Lipunov, V., Kornilov, V., Gorbovskoy, E., et al. 2021, GRB Coordinates Network, 29959, 1
- Littlejohns et al. (2012) Littlejohns, O. M., Willingale, R., O’Brien, P. T., et al. 2012, MNRAS, 421, 2692, doi: 10.1111/j.1365-2966.2012.20499.x
- Mahabal et al. (2019) Mahabal, A., Rebbapragada, U., Walters, R., et al. 2019, PASP, 131, 038002, doi: 10.1088/1538-3873/aaf3fa
- Malacaria et al. (2021) Malacaria, C., Hristov, B., & Fermi GBM Team. 2021, GRB Coordinates Network, 30199, 1
- Margutti et al. (2013) Margutti, R., Soderberg, A. M., Wieringa, M. H., et al. 2013, ApJ, 778, 18, doi: 10.1088/0004-637X/778/1/18
- Masci et al. (2019) Masci, F. J., Laher, R. R., Rusholme, B., et al. 2019, PASP, 131, 018003, doi: 10.1088/1538-3873/aae8ac
- McBreen et al. (2010) McBreen, S., Krühler, T., Rau, A., et al. 2010, A&A, 516, A71, doi: 10.1051/0004-6361/200913734
- McKinney (2006) McKinney, J. C. 2006, MNRAS, 368, 1561, doi: 10.1111/j.1365-2966.2006.10256.x
- McMullin et al. (2007) McMullin, J. P., Waters, B., Schiebel, D., Young, W., & Golap, K. 2007, Astronomical Society of the Pacific Conference Series, Vol. 376, CASA Architecture and Applications, ed. R. A. Shaw, F. Hill, & D. J. Bell, 127
- Meegan et al. (2009) Meegan, C., Lichti, G., Bhat, P. N., et al. 2009, ApJ, 702, 791, doi: 10.1088/0004-637X/702/1/791
- Melandri et al. (2019) Melandri, A., Rossi, A., Benetti, S., et al. 2019, A&A, 621, A81, doi: 10.1051/0004-6361/201833814
- Mészáros (2006) Mészáros, P. 2006, Reports on Progress in Physics, 69, 2259, doi: 10.1088/0034-4885/69/8/R01
- Mészáros & Rees (1997) Mészáros, P., & Rees, M. J. 1997, ApJ, 482, L29, doi: 10.1086/310692
- Mooley et al. (2022) Mooley, K. P., Margalit, B., Law, C. J., et al. 2022, ApJ, 924, 16, doi: 10.3847/1538-4357/ac3330
- Nakar & Piran (2003) Nakar, E., & Piran, T. 2003, New A, 8, 141, doi: 10.1016/S1384-1076(02)00202-6
- Nakar & Piran (2017) —. 2017, ApJ, 834, 28, doi: 10.3847/1538-4357/834/1/28
- Nakar et al. (2002) Nakar, E., Piran, T., & Granot, J. 2002, ApJ, 579, 699, doi: 10.1086/342791
- Narayana Bhat et al. (2016) Narayana Bhat, P., Meegan, C. A., von Kienlin, A., et al. 2016, ApJS, 223, 28, doi: 10.3847/0067-0049/223/2/28
- Nicuesa Guelbenzu & Klose (2021) Nicuesa Guelbenzu, A., & Klose, S. 2021, GRB Coordinates Network, 29528, 1
- Nysewander et al. (2009) Nysewander, M., Fruchter, A. S., & Pe’er, A. 2009, ApJ, 701, 824, doi: 10.1088/0004-637X/701/1/824
- O’Connor et al. (2021) O’Connor, B., Dichiara, S., Troja, E., et al. 2021, GRB Coordinates Network, 29952, 1
- Ofek & Ben-Ami (2020) Ofek, E. O., & Ben-Ami, S. 2020, PASP, 132, 125004, doi: 10.1088/1538-3873/abc14c
- Oke & Gunn (1983) Oke, J. B., & Gunn, J. E. 1983, ApJ, 266, 713, doi: 10.1086/160817
- Oke et al. (1995) Oke, J. B., Cohen, J. G., Carr, M., et al. 1995, PASP, 107, 375, doi: 10.1086/133562
- Paczyński (1998) Paczyński, B. 1998, ApJ, 494, L45, doi: 10.1086/311148
- Page et al. (2021) Page, K. L., Gropp, J. D., Kennea, J. A., et al. 2021, GRB Coordinates Network, 30170, 1
- Panaitescu & Kumar (2001) Panaitescu, A., & Kumar, P. 2001, ApJ, 560, L49, doi: 10.1086/324061
- Panaitescu & Kumar (2002) —. 2002, ApJ, 571, 779, doi: 10.1086/340094
- pandas development team (2020) pandas development team, T. 2020, pandas-dev/pandas: Pandas, latest, Zenodo, doi: 10.5281/zenodo.3509134
- Pankov et al. (2021a) Pankov, N., Belkin, S., Klunko, E., et al. 2021a, GRB Coordinates Network, 29954, 1
- Pankov et al. (2021b) Pankov, N., Pozanenko, A., Rumyantsev, V., Belkin, S., & GRB FuN, I. 2021b, GRB Coordinates Network, 30245, 1
- Patterson et al. (2019) Patterson, M. T., Bellm, E. C., Rusholme, B., et al. 2019, PASP, 131, 018001, doi: 10.1088/1538-3873/aae904
- Perley (2019) Perley, D. A. 2019, PASP, 131, 084503, doi: 10.1088/1538-3873/ab215d
- Perley & Ho (2020) Perley, D. A., & Ho, A. 2020, GRB Coordinates Network, 27805, 1
- Perley et al. (2019a) Perley, D. A., Ho, A. Y. Q., Copperwheat, C. M., & Growth Collaboration. 2019a, GRB Coordinates Network, 25643, 1
- Perley et al. (2021a) Perley, D. A., Ho, A. Y. Q., Yao, Y., & Perley, R. A. 2021a, GRB Coordinates Network, 29343, 1
- Perley et al. (2021b) Perley, D. A., Yao, Y., Ho, A. Y. Q., et al. 2021b, GRB Coordinates Network, 30206, 1
- Perley et al. (2008) Perley, D. A., Li, W., Chornock, R., et al. 2008, ApJ, 688, 470, doi: 10.1086/591961
- Perley et al. (2014) Perley, D. A., Cenko, S. B., Corsi, A., et al. 2014, ApJ, 781, 37, doi: 10.1088/0004-637X/781/1/37
- Perley et al. (2019b) Perley, D. A., Mazzali, P. A., Yan, L., et al. 2019b, MNRAS, 484, 1031, doi: 10.1093/mnras/sty3420
- Perley et al. (2020) Perley, D. A., Fremling, C., Sollerman, J., et al. 2020, ApJ, 904, 35, doi: 10.3847/1538-4357/abbd98
- Perley et al. (2021c) Perley, D. A., Ho, A. Y. Q., Yao, Y., et al. 2021c, MNRAS, 508, 5138, doi: 10.1093/mnras/stab2785
- Perley et al. (2011) Perley, R. A., Chandler, C. J., Butler, B. J., & Wrobel, J. M. 2011, ApJ, 739, L1, doi: 10.1088/2041-8205/739/1/L1
- Perna & Loeb (1998) Perna, R., & Loeb, A. 1998, ApJ, 509, L85, doi: 10.1086/311784
- Piran (2004) Piran, T. 2004, Reviews of Modern Physics, 76, 1143, doi: 10.1103/RevModPhys.76.1143
- Planck Collaboration et al. (2016) Planck Collaboration, Ade, P. A. R., Aghanim, N., et al. 2016, A&A, 594, A13, doi: 10.1051/0004-6361/201525830
- Pookalil et al. (2020) Pookalil, S., Mailyan, B., Hamburg, R., & Fermi GBM Team. 2020, GRB Coordinates Network, 27809, 1
- Poolakkil et al. (2021) Poolakkil, S., Preece, R., Fletcher, C., et al. 2021, ApJ, 913, 60, doi: 10.3847/1538-4357/abf24d
- Pozanenko et al. (2021) Pozanenko, A., Belkin, S., Kim, V., et al. 2021, GRB Coordinates Network, 29512, 1
- Prentice et al. (2018) Prentice, S. J., Maguire, K., Smartt, S. J., et al. 2018, ApJ, 865, L3, doi: 10.3847/2041-8213/aadd90
- Racusin et al. (2011) Racusin, J. L., Oates, S. R., Schady, P., et al. 2011, ApJ, 738, 138, doi: 10.1088/0004-637X/738/2/138
- Ramirez-Ruiz et al. (2002) Ramirez-Ruiz, E., Celotti, A., & Rees, M. J. 2002, MNRAS, 337, 1349, doi: 10.1046/j.1365-8711.2002.05995.x
- Ramirez-Ruiz et al. (2005) Ramirez-Ruiz, E., Granot, J., Kouveliotou, C., et al. 2005, ApJ, 625, L91, doi: 10.1086/431237
- Rau et al. (2006) Rau, A., Greiner, J., & Schwarz, R. 2006, A&A, 449, 79, doi: 10.1051/0004-6361:20054317
- Rhoads (1997) Rhoads, J. E. 1997, ApJ, 487, L1, doi: 10.1086/310876
- Rhoads (1999) —. 1999, ApJ, 525, 737, doi: 10.1086/307907
- Rhoads (2003) —. 2003, ApJ, 591, 1097, doi: 10.1086/368125
- Ricker et al. (2003) Ricker, G. R., Atteia, J. L., Crew, G. B., et al. 2003, in American Institute of Physics Conference Series, Vol. 662, Gamma-Ray Burst and Afterglow Astronomy 2001: A Workshop Celebrating the First Year of the HETE Mission, ed. G. R. Ricker & R. K. Vanderspek, 3–16, doi: 10.1063/1.1579291
- Ricker et al. (2014) Ricker, G. R., Winn, J. N., Vanderspek, R., et al. 2014, in Society of Photo-Optical Instrumentation Engineers (SPIE) Conference Series, Vol. 9143, Space Telescopes and Instrumentation 2014: Optical, Infrared, and Millimeter Wave, ed. J. Oschmann, Jacobus M., M. Clampin, G. G. Fazio, & H. A. MacEwen, 914320, doi: 10.1117/12.2063489
- Ridnaia et al. (2020) Ridnaia, A., Svinkin, D., & Frederiks, D. 2020, in Journal of Physics Conference Series, Vol. 1697, Journal of Physics Conference Series, 012030, doi: 10.1088/1742-6596/1697/1/012030
- Rigault et al. (2019) Rigault, M., Neill, J. D., Blagorodnova, N., et al. 2019, A&A, 627, A115, doi: 10.1051/0004-6361/201935344
- Rossi et al. (2021a) Rossi, A., Melandri, A., & CIBO Collaboration. 2021a, GRB Coordinates Network, 29433, 1
- Rossi et al. (2021b) Rossi, A., Palazzi, E., Cusano, F., & Grawita Collaboration. 2021b, GRB Coordinates Network, 30079, 1
- Rossi et al. (2021c) Rossi, A., Palazzi, E., & Grawita Collaboration. 2021c, GRB Coordinates Network, 29327, 1
- Rumyantsev et al. (2020) Rumyantsev, V., Pozanenko, A., Belkin, S., et al. 2020, GRB Coordinates Network, 27802, 1
- Ryan et al. (2015) Ryan, G., van Eerten, H., MacFadyen, A., & Zhang, B.-B. 2015, ApJ, 799, 3, doi: 10.1088/0004-637X/799/1/3
- Sakamoto et al. (2005) Sakamoto, T., Lamb, D. Q., Kawai, N., et al. 2005, ApJ, 629, 311, doi: 10.1086/431235
- Sanwal et al. (2020) Sanwal, P., Misra, K., Ghosh, A., et al. 2020, GRB Coordinates Network, 27803, 1
- Sari et al. (1999) Sari, R., Piran, T., & Halpern, J. P. 1999, ApJ, 519, L17, doi: 10.1086/312109
- Sari et al. (1998) Sari, R., Piran, T., & Narayan, R. 1998, ApJ, 497, L17, doi: 10.1086/311269
- Sarin et al. (2021) Sarin, N., Hamburg, R., Burns, E., et al. 2021, arXiv e-prints, arXiv:2106.01556. https://arxiv.org/abs/2106.01556
- Shen & Matzner (2012) Shen, R., & Matzner, C. D. 2012, ApJ, 744, 36, doi: 10.1088/0004-637X/744/1/36
- Singer et al. (2015) Singer, L. P., Kasliwal, M. M., Cenko, S. B., et al. 2015, ApJ, 806, 52, doi: 10.1088/0004-637X/806/1/52
- Singh et al. (2014) Singh, K. P., Tandon, S. N., Agrawal, P. C., et al. 2014, in Society of Photo-Optical Instrumentation Engineers (SPIE) Conference Series, Vol. 9144, Space Telescopes and Instrumentation 2014: Ultraviolet to Gamma Ray, ed. T. Takahashi, J.-W. A. den Herder, & M. Bautz, 91441S, doi: 10.1117/12.2062667
- Smith et al. (2021) Smith, I. A., Perley, D. A., & Tanvir, N. R. 2021, GRB Coordinates Network, 30360, 1
- Soderberg et al. (2007) Soderberg, A. M., Nakar, E., Cenko, S. B., et al. 2007, ApJ, 661, 982, doi: 10.1086/515562
- Stalder et al. (2017) Stalder, B., Tonry, J., Smartt, S. J., et al. 2017, ApJ, 850, 149, doi: 10.3847/1538-4357/aa95c1
- Steele et al. (2004) Steele, I. A., Smith, R. J., Rees, P. C., et al. 2004, in Society of Photo-Optical Instrumentation Engineers (SPIE) Conference Series, Vol. 5489, Proc. SPIE, ed. J. Oschmann, Jacobus M., 679–692, doi: 10.1117/12.551456
- Svinkin et al. (2020) Svinkin, D., Golenetskii, S., Aptekar, R., et al. 2020, GRB Coordinates Network, 27867, 1
- Svinkin et al. (2021a) Svinkin, D., Golenetskii, S., Frederiks, D., et al. 2021a, GRB Coordinates Network, 29511, 1
- Svinkin et al. (2021b) —. 2021b, GRB Coordinates Network, 29514, 1
- Tachibana & Miller (2018) Tachibana, Y., & Miller, A. A. 2018, PASP, 130, 128001, doi: 10.1088/1538-3873/aae3d9
- Tchekhovskoy et al. (2008) Tchekhovskoy, A., McKinney, J. C., & Narayan, R. 2008, MNRAS, 388, 551, doi: 10.1111/j.1365-2966.2008.13425.x
- Teja et al. (2021) Teja, R. S., Dutta, A., Kumar, H., et al. 2021, GRB Coordinates Network, 29414, 1
- Tonry et al. (2018) Tonry, J. L., Denneau, L., Heinze, A. N., et al. 2018, PASP, 130, 064505, doi: 10.1088/1538-3873/aabadf
- Totani & Panaitescu (2002) Totani, T., & Panaitescu, A. 2002, ApJ, 576, 120, doi: 10.1086/341738
- Tsvetkova et al. (2017) Tsvetkova, A., Frederiks, D., Golenetskii, S., et al. 2017, ApJ, 850, 161, doi: 10.3847/1538-4357/aa96af
- Tsvetkova et al. (2021) Tsvetkova, A., Frederiks, D., Svinkin, D., et al. 2021, ApJ, 908, 83, doi: 10.3847/1538-4357/abd569
- van der Walt et al. (2019) van der Walt, S., Crellin-Quick, A., & Bloom, J. 2019, The Journal of Open Source Software, 4, 1247, doi: 10.21105/joss.01247
- van Eerten et al. (2010) van Eerten, H., Zhang, W., & MacFadyen, A. 2010, ApJ, 722, 235, doi: 10.1088/0004-637X/722/1/235
- van Paradijs et al. (2000) van Paradijs, J., Kouveliotou, C., & Wijers, R. A. M. J. 2000, ARA&A, 38, 379, doi: 10.1146/annurev.astro.38.1.379
- van Roestel et al. (2019) van Roestel, J., Bellm, E. C., Duev, D. A., et al. 2019, Research Notes of the American Astronomical Society, 3, 136, doi: 10.3847/2515-5172/ab459c
- Vedrenne et al. (2003) Vedrenne, G., Roques, J. P., Schönfelder, V., et al. 2003, A&A, 411, L63, doi: 10.1051/0004-6361:20031482
- Villar et al. (2017a) Villar, V. A., Berger, E., Metzger, B. D., & Guillochon, J. 2017a, ApJ, 849, 70, doi: 10.3847/1538-4357/aa8fcb
- Villar et al. (2017b) Villar, V. A., Guillochon, J., Berger, E., et al. 2017b, ApJ, 851, L21, doi: 10.3847/2041-8213/aa9c84
- Virtanen et al. (2020) Virtanen, P., Gommers, R., Oliphant, T. E., et al. 2020, Nature Methods, 17, 261, doi: https://doi.org/10.1038/s41592-019-0686-2
- von Kienlin (2014) von Kienlin, A. 2014, GRB Coordinates Network, 16450, 1
- von Kienlin et al. (2020) von Kienlin, A., Meegan, C. A., Paciesas, W. S., et al. 2020, ApJ, 893, 46, doi: 10.3847/1538-4357/ab7a18
- Wang et al. (2018) Wang, J., Zhu, Z. P., Xu, D., et al. 2018, ApJ, 867, 147, doi: 10.3847/1538-4357/aae6c3
- Waratkar et al. (2021) Waratkar, G., Shenoy, V., Vibhute, A., et al. 2021, GRB Coordinates Network, 29410, 1
- Watson et al. (2021) Watson, A. M., Butler, N., Becerra, R. L., et al. 2021, GRB Coordinates Network, 29940, 1
- Wei et al. (2016) Wei, J., Cordier, B., Antier, S., et al. 2016, arXiv e-prints, arXiv:1610.06892. https://arxiv.org/abs/1610.06892
- Wes McKinney (2010) Wes McKinney. 2010, in Proceedings of the 9th Python in Science Conference, ed. Stéfan van der Walt & Jarrod Millman, 56 – 61, doi: 10.25080/Majora-92bf1922-00a
- White et al. (2021) White, N. E., Bauer, F. E., Baumgartner, W., et al. 2021, in Society of Photo-Optical Instrumentation Engineers (SPIE) Conference Series, Vol. 11821, Society of Photo-Optical Instrumentation Engineers (SPIE) Conference Series, 1182109, doi: 10.1117/12.2599293
- Willingale et al. (2013) Willingale, R., Starling, R. L. C., Beardmore, A. P., Tanvir, N. R., & O’Brien, P. T. 2013, MNRAS, 431, 394, doi: 10.1093/mnras/stt175
- Winkler et al. (2003) Winkler, C., Courvoisier, T. J. L., Di Cocco, G., et al. 2003, A&A, 411, L1, doi: 10.1051/0004-6361:20031288
- Xu et al. (2021) Xu, D., Izzo, L., Fynbo, J. P. U., et al. 2021, GRB Coordinates Network, 29432, 1
- Yao et al. (2021a) Yao, Y., Miller, A., Ho, A., & Perley, D. 2021a, GRB Coordinates Network, 29673, 1
- Yao et al. (2021b) Yao, Y., Perley, D., & Ho, A. 2021b, GRB Coordinates Network, 29938, 1
- Yao et al. (2021c) Yao, Y., Perley, D., Ho, A., & Zwicky Transient Facility Collaboration. 2021c, GRB Coordinates Network, 29508, 1
- Yao et al. (2021d) —. 2021d, GRB Coordinates Network, 29508, 1
- Yao et al. (2019) Yao, Y., Miller, A. A., Kulkarni, S. R., et al. 2019, ApJ, 886, 152, doi: 10.3847/1538-4357/ab4cf5
- Yao et al. (2021e) Yao, Y., Ho, A. Y. Q., Medvedev, P., et al. 2021e, arXiv e-prints, arXiv:2112.00751. https://arxiv.org/abs/2112.00751
- Yaron & Gal-Yam (2012) Yaron, O., & Gal-Yam, A. 2012, PASP, 124, 668, doi: 10.1086/666656
- Yuan et al. (2018) Yuan, W., Zhang, C., Ling, Z., et al. 2018, in Society of Photo-Optical Instrumentation Engineers (SPIE) Conference Series, Vol. 10699, Space Telescopes and Instrumentation 2018: Ultraviolet to Gamma Ray, ed. J.-W. A. den Herder, S. Nikzad, & K. Nakazawa, 1069925, doi: 10.1117/12.2313358
- Zackay et al. (2016) Zackay, B., Ofek, E. O., & Gal-Yam, A. 2016, ApJ, 830, 27, doi: 10.3847/0004-637X/830/1/27
- Zeh et al. (2006) Zeh, A., Klose, S., & Kann, D. A. 2006, ApJ, 637, 889, doi: 10.1086/498442
- Zhang et al. (2019) Zhang, D., Li, X., Xiong, S., et al. 2019, Nuclear Instruments and Methods in Physics Research A, 921, 8, doi: 10.1016/j.nima.2018.12.032
- Zhang et al. (2004) Zhang, W., Woosley, S. E., & Heger, A. 2004, ApJ, 608, 365, doi: 10.1086/386300
- Zheng et al. (2020) Zheng, W., Filippenko, A. V., & KAIT GRB Team. 2020, GRB Coordinates Network, 27814, 1
- Zhu et al. (2021) Zhu, Z. P., Fynbo, J. P. U., Perley, D. A., Fu, S. Y., & Xu, D. 2021, GRB Coordinates Network, 29310, 1