A multi-transition methanol maser study of the accretion burst source G358.930.03-MM1
Abstract
We present the most complete to date interferometric study of the centimeter wavelength methanol masers detected in G358.930.03 at the burst and post-burst epochs. A unique, NIR/(sub)mm-dark and FIR-loud MYSO accretion burst was recently discovered in G358.930.03. The event was accompanied by flares of an unprecedented number of rare methanol maser transitions. The first images of three of the newly-discovered methanol masers at 6.18, 12.23, and 20.97 GHz are presented in this work. The spatial structure evolution of the methanol masers at 6.67, 12.18, and 23.12 GHz is studied at two epochs. The maser emission in all detected transitions resides in a region of 0.2′′ around the bursting source and shows a clear velocity gradient in the north-south direction, with red-shifted features to the north and blue-shifted features to the south. A drastic change in the spatial morphology of the masing region is found: a dense and compact ”spiral” cluster detected at epoch I evolved into a disperse, ”round” structure at epoch II. During the transition from the first epoch to the second, the region traced by masers expanded. The comparison of our results with the complementary VLA, VLBI, SMA, and ALMA maser data is conducted. The obtained methanol maser data support the hypothesis of the presence of spiral-arm structures within the accretion disk, which was suggested in previous studies of the source.
1 Introduction
Is there a common mechanism of star formation across the entire stellar mass spectrum? While star formation theory is well established for low-mass stars (e.g., McKee & Ostriker 2007), much less is known about high-mass star formation. Recent studies such as Caratti o Garatti et al. (2017) and Hunter et al. (2017) provide direct evidence that massive young stellar objects (MYSOs), analogously to low-mass stellar objects, form via disk-mediated accretion accompanied by episodic accretion bursts. These bursts may be a result of disk fragmentation (Ahmadi et al., 2019; Meyer et al., 2019b). Such a mechanism provides a means to overcome radiation pressure (Hosokawa et al., 2016), and it is thought that up to half of the final stellar mass may be acquired in these accretion events. But the accretion process itself is poorly understood — largely due to scarce observational evidence. Presently, only three cases of accretion bursts in MYSOs have been reported: S255IR (Caratti o Garatti et al., 2017), NGC6334I (Hunter et al., 2017), and — the topic of this paper — G358.930.03 (Stecklum et al., 2021). A potential fourth accretion-burst source, G323.460.08, may have recently undergone such an event (Proven-Adzri et al., 2019).
A larger sample is clearly needed, but identifying MYSOs undergoing accretion bursts is difficult. It is in this respect that masers have proven to be a powerful probe of the mechanisms of massive star formation. Masing occurs only within certain ranges of physical conditions of the gas and radiation field (e.g., see the reviews by Ellingsen et al. 2007 and Breen et al. 2019). Thus the spatial distribution of masers can reveal the distribution of temperature, density and radiation enhancements in the region, while the kinematics of maser spots can trace gas motions. All of these properties are essential for understanding the episodic accretion phenomenon.
If the accretion burst augments the local radiation field, the resulting increase in incident photons will cause all masers in the foreground of the continuum emission to increase in flux. Masers, either compact or extended, and covering a wide range of velocities may be involved — as was seen in S255IR (Szymczak et al., 2018), NGC6334I (MacLeod et al., 2018), and recently in G358.930.03 (MacLeod et al., 2019; Brogan et al., 2019; Breen et al., 2019). Moreover, in all these sources, multiple maser transitions were seen to flare111Hereafter, we use the word ”flare” to refer to a sudden increase in the maser flux density (in some cases, caused by an accretion burst) and the word ”burst” to refer to the accretion burst itself. and rare maser transitions appeared. The masers then weakened or disappeared in a span of weeks to months for the rarer masers but longer for the more common transitions (MacLeod et al., 2018).
1.1 G358.93-0.03
On January 14, 2019, a rapid rise of the 6.67 GHz class II methanol maser flux density, accompanied by the appearance of several new velocity features, was detected in G358.930.03 (Sugiyama et al., 2019) by the Ibaraki 6.7 GHz Methanol Maser Monitor (iMet) program (Yonekura et al., 2016). The flare of 6.67 GHz maser emission reached a first peak on February 15, 2019, when the flux density of the maser feature at km s-1 reached 660 Jy (Figure 1). A second peak occurred on March 12, when the velocity feature at km s-1 reached a flux density of 900 Jy. A daily spectrum of the 6.67 GHz methanol maser in G358.930.03 is published regularly on the iMet project website222http://vlbi.sci.ibaraki.ac.jp/iMet/G358.9-00-190114/daily.html.
Intensive follow-up observations were made by the Maser Monitoring Organization333https://www.masermonitoring.org/ (M2O), a self-organized collaboration of maser monitoring observatories. Monitoring with the 26-m telescope of the Hartebeesthoek Radio Astronomy Observatory (HartRAO, Republic of South Africa; Figure 1) confirmed that the flaring 6.67 GHz maser flux density had been rapidly increasing since February of 2019 and in 1.5 months reached 1000 Jy — about 200 greater than the stable flux density of 5 Jy that had been reported by observations spanning the previous decade (Caswell et al., 2010; Chambers et al., 2014; Hu et al., 2016; Rickert et al., 2019).
In addition to the 6.67 GHz methanol maser flare, the appearance of multiple new maser transitions was observed in G358.930.03. A rare 23.12 GHz class II methanol maser (only the fourth known occurrence of this transition) was detected. A 12.18 GHz class II methanol maser, previously undetected in this source despite several epochs of observations (Breen et al., 2012), was found to have a higher flux density than the flaring 6.67 GHz maser. The ATCA observations of G358.930.03 conducted in March, 2019 detected emission from 12 additional methanol transitions, six of which were previously undetected class II methanol masers; among these were the first known torsionally excited methanol masers (Breen et al., 2019). In January-March, 2019, Volvach et al. (2020) reported a short-lived (44 days) 19.97 GHz methanol maser emission. More transitions may have been missed owing to insufficient frequency coverage. The latest observations with the SMA (March, 2019) and ALMA (April, 2019) yielded an additional 14 methanol maser discoveries in the (sub)millimeter range, primarily from transitions in excited torsional states (Brogan et al., 2019).
G358.930.03 was a maser-quiet source at the pre-flare epoch, with only two maser transitions detected: the 6.67 GHz methanol maser (Caswell et al., 2010; Chambers et al., 2014; Hu et al., 2016; Rickert et al., 2019) and 22 GHz water maser (Titmarsh et al., 2016). Moreover, G358.930.03 was not as well-studied as S255IR or NGC6334I. For example, no maser proper motion data is available to provide a parallax distance. According to the BeSSeL Revised Kinematic Distance Calculator444http://bessel.vlbi-astrometry.org/revised_kd_2014 (Reid et al., 2014), the near kinematic distance to the source is kpc.
The SMA and ALMA (sub)millimeter imaging resolved G358.930.03 into a cluster of eight continuum sources (Brogan et al., 2019). Two of these sources, MM1 and MM3, were found to host hot molecular cores. All of the newly-discovered methanol masers were found to be associated with the brightest continuum source, MM1 (e.g. Brogan et al. (2019); Burns et al. (2020)).
The flaring class II methanol maser transitions detected in G358.930.03 require similar physical conditions according to theoretical models, albeit over a wider range of values (Sobolev et al., 1997a, b; Cragg et al., 2004, 2005). Thus, the simultaneous flaring of these masers indicates a sudden change in the local physical conditions — probably related to the radiation field — which could provoke the necessary conditions for maser amplification.
The multi-epoch Long Baseline Array (LBA) observations, performed during the 6.67 GHz methanol maser flare, allowed the imaging of the subluminal propagation of a thermal radiation ”heatwave” emanating from the accreting high-mass protostar (Burns et al., 2020).
The SMA and ALMA images revealed a partial elliptical ring of the methanol masers, which was interpreted as a coherent physical structure illuminated by a radiative event from the central object (Brogan et al., 2019).
Remarkably, the VLA observations of Chen et al. (2020a, b), conducted during the maser flare epoch in March, 2019, revealed that the discovered rare maser transitions of HDO, HNCO, and 13CH3OH appear to trace a spiral-arm structure around the bursting source (Chen et al., 2020b). This finding was the first observational evidence of a link between accretion bursts and disk substructures (Chen et al., 2020b).
The accretion burst in G358.930.03 was decisively confirmed by multi-epoch SOFIA observations (Stecklum et al., 2021). The event is found to be the first NIR/(sub)mm-dark and FIR-loud MYSO accretion burst, showing an increase in the source flux only in the FIR, and not in the NIR or (sub)mm bands (Stecklum et al., 2021).
The excellent coordination of the M2O observatories ensured that monitoring of G358.930.03 was done in a timely manner. As a result, we had the unique opportunity to observe a stage of the flare that was missed in the cases of S255 and NGC6334I. In this paper, we present the most complete to date interferometric study of the methanol masers detected in G358.930.03 at the burst and post-burst epochs.
2 OBSERVATIONS AND DATA REDUCTION
Two observing sessions of G358.930.03 were carried out with the Karl G. Jansky Very Large Array (VLA) on February 25, 2019 (epoch I) and on June 4, 2019 (epoch II) as the Target of Opportunity programs 19A-448 and 19A-476. The first session was a follow-up observation in response to the rapid rise of the 6.67 GHz methanol maser flux density detected in the source in January 2019 (Sugiyama et al., 2019). The second session was made in response to the 22 GHz water maser flare of April 2019 (the M2O monitoring data, Fig. 1).
The epoch I observation was made during a CB reconfiguration which led to an asymmetrical beam, highly elongated in the N-S direction. At the first epoch, the priority was to catch the flaring methanol masers before they faded, so promptness was the driving factor more than resolution. The epoch II observation was made in A-configuration.
In this paper, we present the C-, Ku-, and K-bands spectral line and K-band continuum observations. The observing time for each session was two hours. The pointing coordinates for G358.930.03 were RA (J2000) = 17h 43m 10.02s and Dec (J2000) = 5145.8, with an LSR velocity of km s-1. The same calibration sources were used at both epochs: 3C286 was used as a flux density, bandpass, and delay calibrator; J17443116 was the complex gain calibrator (with an angular separation from the target source of 4.6∘).
The maser lines were observed in narrow spectral windows (1, 2 and 4 MHz at C-, Ku-, and K-bands, respectively) with 512 or 1024 channels. Continuum emission was observed in 31 spectral windows with 128 1-MHz channels. Observation parameters, including the synthesized beam size and the rms noise level, for spectral line and continuum data, are presented in Tables 1 and 2. Table 1 contains the list of detected maser transitions (detection of maser emission in each band and epoch is marked with ’Y’, non-detection is marked with ’N’).
All steps of the post-correlation data reduction were done with the Common Astronomy Software Applications (CASA, McMullin et al. (2007)). For basic flagging and data calibration, we used the VLA CASA Calibration Pipeline. Nevertheless, there were two issues that required special, additional treatment. First, during the observations we used the VLA catalog coordinates for the phase calibrator J17443116. Post-observation, we learned that the VLBI Source Position Catalog555http://astrogeo.org/vlbi/solutions/rfc_2019d/ lists a more reliable position. The discrepancy from the VLA catalog position is 0.313 arcsec. Prior to calibration and imaging we corrected the calibrator position to the VLBI catalog values with CASA task fixvis. Second, the observations were carried out during a multi-frequency maser flare in the source, which led to the detection of a number of methanol maser lines in the wide-band VLA continuum window (for the list of the detected maser lines, see the note to Table 2). The maser lines were not flagged by the pipeline, and their data appeared in the continuum images as a false detection of continuum peaks. Additional manual flagging was done to avoid this contamination.
Calibrated data were imaged with the CASA task clean. Briggs weighting was used for maser data and natural weighting was used for continuum data. Gaussian fitting of the images was performed with the CASA task imfit. A two-dimensional Gaussian brightness distribution was fit to all maser and continuum emission peaks with a flux density above the 3 level (see Tables 1 and 2 for -levels) to determine their positions and flux densities. Further in the text, we list and discuss so-called “maser spots” — maser emission detected in a single velocity channel of a data cube.
To estimate the uncertainties in the absolute positions of the masers detected with the VLA, we compared our positions with those obtained by other observations made recently by the M2O collaboration. The 6.7 GHz methanol maser spots detected with the VLA at the first epoch (February 25, 2019) were superposed with the 6.7 GHz data obtained with the LBA on February 28, 2019 from Burns et al. (2020). A N-S position difference was noted and estimated to be 0.07 arcsec. This value is within the accuracy of the VLA position measurement and is within one pixel of our C-band VLA images. Absolute coordinates measured with VLA can be affected by uncompensated ionospheric propagation delays, and the effect is most notorious for declinations 30∘ (Argon et al., 2000). To estimate the displacements for other types of masers, we (1) measured the median positions of the centres of the maser clusters, (2) estimated shifts between centres of the maser clusters and MM1 (the central source of our maps (Brogan et al., 2019)). The estimated offsets are indicated in the notes of Tables 5-9. The offsets were introduced to our data and used in the data analysis and preparation of Figures 3-7, 10-11, and 13-15. Note that the absolute positional uncertainty of MM1, with which we compare positions of the detected masers, is 0.03 arcsec (Brogan et al., 2019). The absolute position shift between the first and second VLA epochs appeared to be of 0.04 arcsec.
| Band | Transition | Freq.aaThe adopted rest frequency (with errors in the last digit); references: (1) Pickett et al. (1998); (2) Müller et al. (2004). The listed methanol transitions are indicated in the text by the frequency in GHz rounded to two decimal places. | Epoch | Int. Time | Synth. Beam | PA | Spec. res. | rms | Detect. |
| (MHz) | (min) | (arcsec) | (∘) | (km s-1) | (mJy/beam) | ||||
| C | CH3OH 17-2 18-3 E (vt=1) | 6181.146(21)11footnotemark: | II | 16 | 2.02 0.86 | +0.12 | 0.09 | 10 | Y |
| CH3OH 51 60 A+ (vt=0) | 6668.5192(8)22footnotemark: | I | 14 | 3.65 0.75 | +7.44 | 0.09 | 12 | Y | |
| II | 16 | 1.89 0.80 | +0.41 | 0.09 | 8 | Y | |||
| Ku | CH3OH 20 3-1 E (vt=0) | 12 178.597(4)22footnotemark: | I | 16 | 1.97 0.40 | +4.36 | 0.10 | 10 | Y |
| II | 16 | 1.10 0.43 | -5.16 | 0.10 | 6 | Y | |||
| CH3OH 165 174 E (vt=0) | 12 229.348(16)11footnotemark: | II | 16 | 1.08 0.43 | -4.95 | 0.10 | 7 | Y | |
| K | CH3OH 176 185 E (vt=0) | 20 346.864(16)11footnotemark: | II | 19 | 0.67 0.25 | +10.85 | 0.12 | 10 | N |
| CH3OH 101 112 A+ (vt=1) | 20 970.620(21)11footnotemark: | II | 19 | 0.65 0.24 | -10.49 | 0.11 | 11 | Y | |
| CH3OH 92 101 A+ (vt=0) | 23 121.0242(5)22footnotemark: | I | 16 | 1.00 0.20 | -1.18 | 0.05 | 15 | Y | |
| II | 19 | 0.58 0.22 | -11.28 | 0.10 | 17 | Y |
| BandaaThe following maser lines were detected in the continuum window (the listed lines were flagged during data processing to avoid false detection in continuum images): 20.97 and 20.35 (epoch I only) GHz. | Freq. | Epoch | Int. Time | Synth. Beam | PA | 1 rms | Detect. | |
|---|---|---|---|---|---|---|---|---|
| (GHz) | (min) | (arcsec) | (∘) | (Jy/beam) | MM1 | MM3bbThe source is not considered further in the present study. | ||
| K | 20.0 | I | 32 | 1.28×0.30 | +0.28 | 16 | Y | Y |
| II | 19 | 0.78×0.32 | -9.98 | 15 | N | N | ||
3 Results
3.1 Methanol Maser Emission
Maser emission is detected in all frequency bands: there are not only well-known methanol masers at 6.67 and 12.18 GHz, but also rare and recently discovered ones. The four newly discovered methanol maser transitions at 6.18, 12.23, 20.35, and 20.97 GHz, detected in G358.930.03 with the 26-m HartRAO telescope (MacLeod et al., 2019) and ATCA (Breen et al., 2019), were observed at epoch II with the VLA. Of the four, only the 20.35 GHz maser was not detected with the VLA as it had already faded away by the date of the observation.
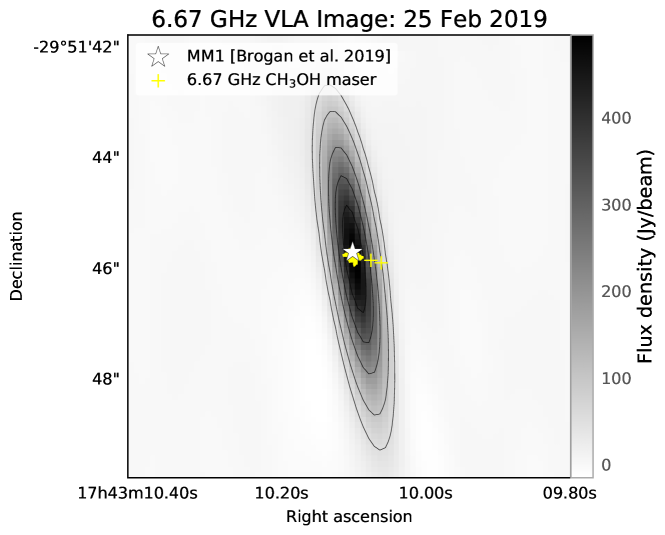
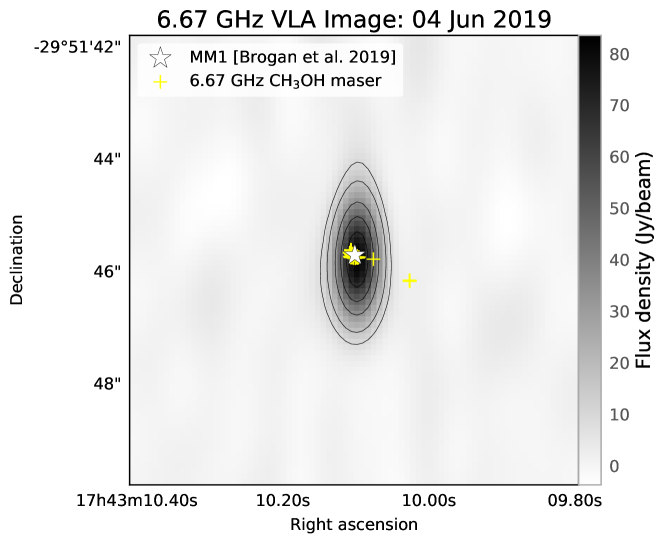
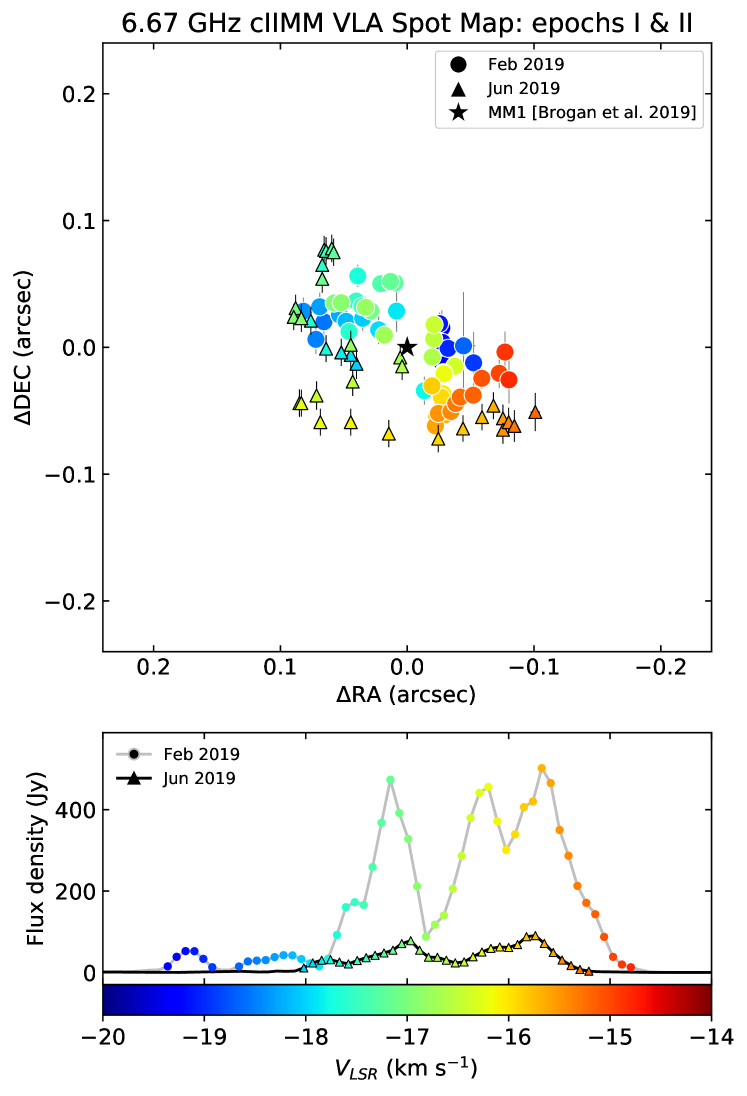
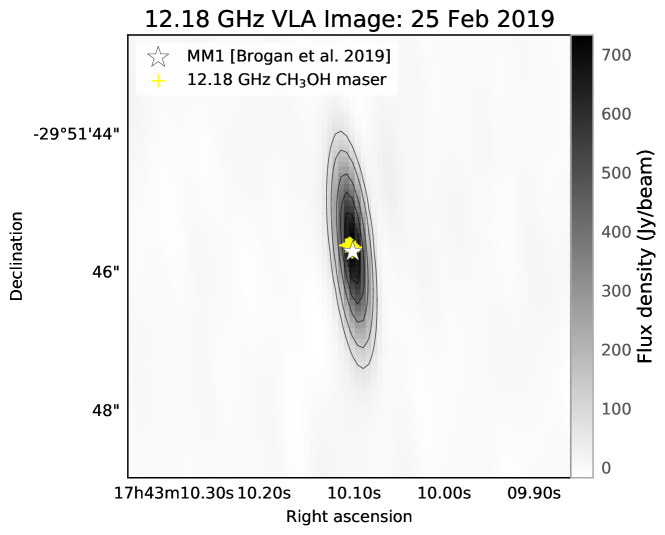
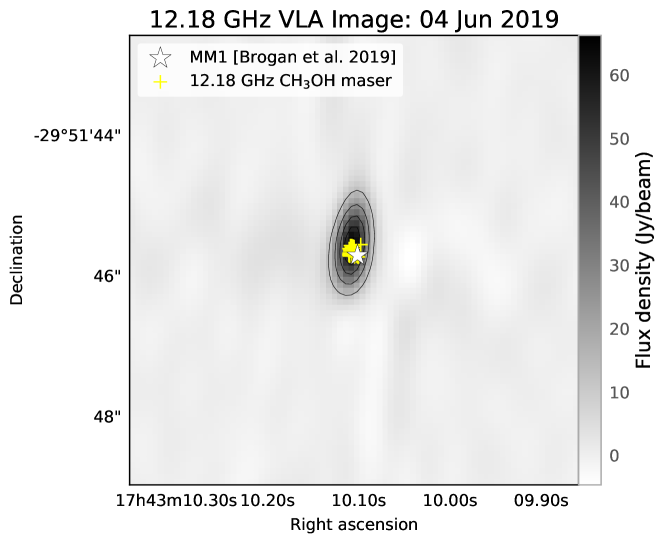
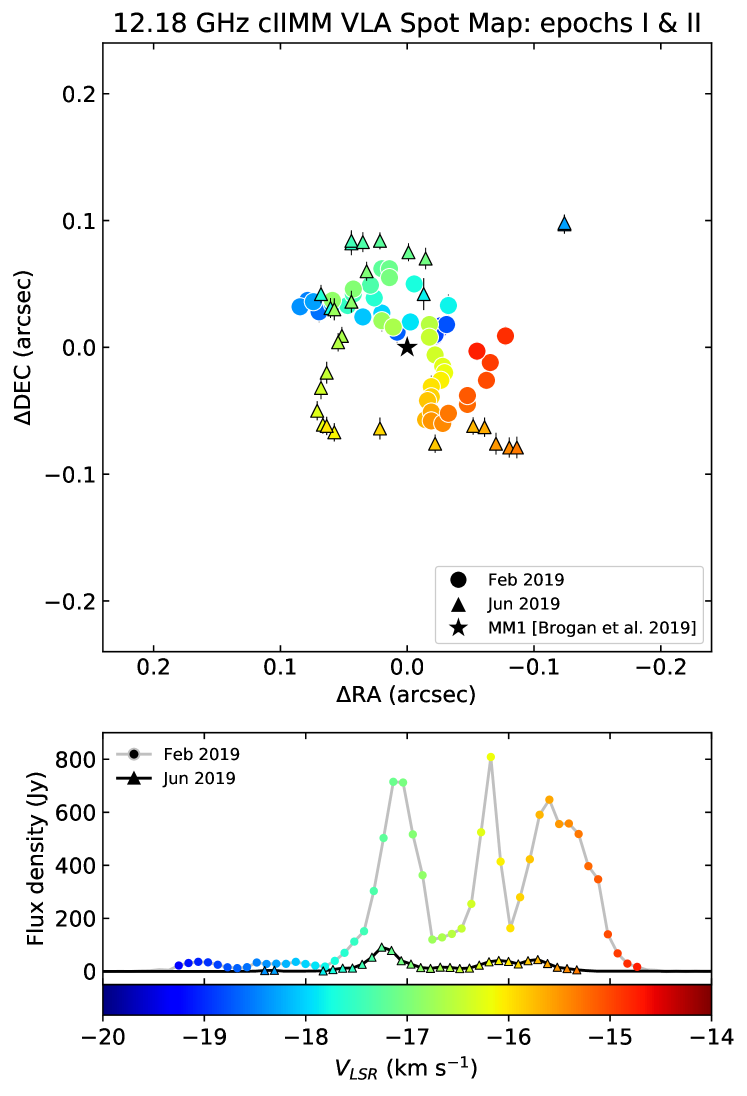
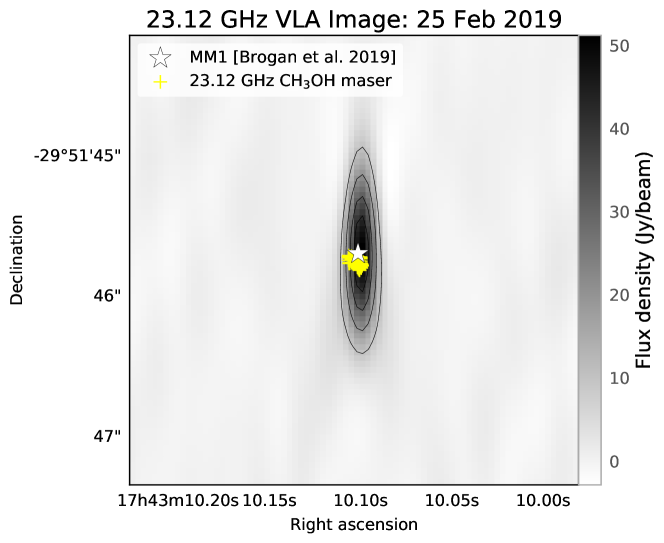
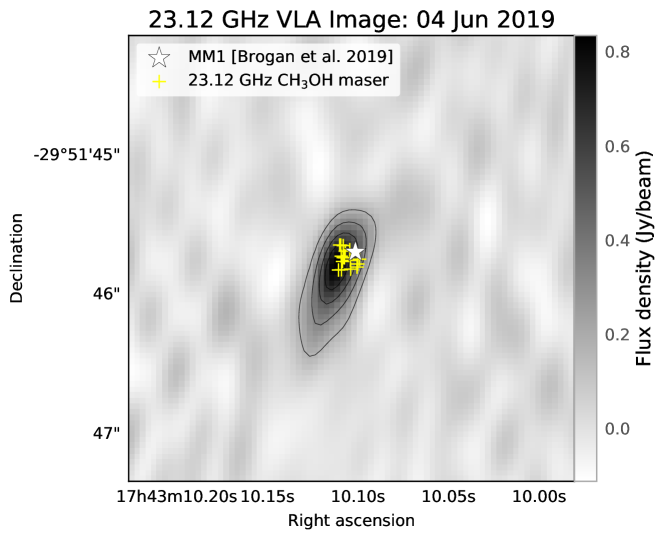
The position, velocity, integrated and peak flux density of each maser spot are listed in Tables 4–9. These tables, in machine-readable format, are presented in the Appendix. Images of the brightest emission spots detected at a particular frequency, as well as spectra of these maser transitions and their spatial distribution, are presented in Figures 2–7. Each map is centered on the position of the millimeter core MM1 from Brogan et al. (2019) (indicated by a star marker).
Note that the structures seen in the maser spot maps are much smaller than the angular size of the VLA synthesized beam in each band (Table 1).
The high signal-to-noise achieved for the bright maser emission allows us to fit the maser spot positions with sub-beamsize accuracy. Nevertheless, if there is more than one maser spot in a velocity channel, the spatial and velocity structure will be dominated by the brighter components (i.e., we obtain ’centroid mapping’; see Section 4.2 for the further discussion on the issue). This is especially true for the crowded maser regions detected at the flare epoch.
6.18 GHz. The 6.18 GHz class II methanol maser is one of the torsionally excited lines discovered with the ATCA during the burst in G358.930.03 (Breen et al., 2019). By the time of the VLA epoch II observations, the flux density of the 6.18 GHz maser had dropped significantly and remained at the 0.1 Jy level (Figure 2b), compared to the flaring flux density of 300 Jy. At the VLA epoch II, only the 18.6 km s-1 feature remained detectable. The ATCA spectrum showed emission from to km s-1 with a peak emission at 16.2 km s-1. However, both the ATCA and VLA positions of the 6.18 GHz maser coincide within their positional uncertainties.
6.67 GHz. The first epoch of the VLA observations was conducted soon after the first 6.67 GHz maser flare in G358.930.03. On February 25, 2019 (VLA epoch I), the single-dish flux density of the velocity feature at km s-1 had decreased from 600 Jy to 450 Jy, according to iMet data666http://vlbi.sci.ibaraki.ac.jp/iMet/G358.9-00-190114/daily.html. We note that February 25 was also the date when the dominant feature at VLSR km s-1 was overtaken by the feature at VLSR km s-1.
The brightest flare of the 6.67 GHz maser occurred on March 12, when the km s-1 velocity feature reached 900 Jy. By the second VLA epoch (June 4, 2019), the single-dish flux density of the 6.67 GHz methanol maser had decreased to 90 Jy, with both lines — at VLSR 16 km/s (dominant in the first flare) and 17 km/s (dominant in the second flare) — having about the same amplitude (see Fig. 1 and 3).
The methanol maser emission at 6.67 GHz is detected at both VLA epochs, coming from an area of (1000 AU, for an assumed distance of 6.75 kpc) around the MM1 position (Fig. 3). Several fainter (1 Jy) maser spots were detected outside of the main cluster. These “distant” maser spots are located to the west of the main cluster (Fig. 3(a,b)). At the first VLA epoch, the cluster of the 6.67 GHz maser spots was elongated in the NE-SW direction, with most of the blue-shifted masers to the NE and the red-shifted features to the SW. Here, ’blue’ and ’red’ refer to the centroid of the velocity range, of about km s-1. In contrast, the 6.67 GHz maser spots detected at the second epoch are arranged in a bow-shaped structure, again with the blue-shifted velocity features to the north and red-shifted features to the south. The overall velocity pattern of the spectrum did not change greatly between epochs, although the weaker velocity features at VLSR – km s-1 detected in the first epoch were not detected at the second epoch.
|
12.18 GHz. The methanol maser emission at 12.18 GHz is found in a region of 0.2′′ around MM1 (Figure 4). This maser transition shows a behaviour quite similar to that of the 6.67 GHz maser. At the VLA epoch I, the 12.18 GHz maser emission is also elongated in the NE-SW direction with blue-shifted velocity features to the north-east and red-shifted features to the south-west. At the VLA epoch II, there is a wide bow-shaped structure with red-shifted masers to the north and a less-ordered structure to the south, comprised of blue-shifted masers.
At the post-flare epoch (VLA epoch II), both maser transitions faded to about the same flux density with the 6.67 GHz maser slightly stronger: the peak flux densities of the 6.67 GHz and 12.18 GHz emission were 84 Jy and 79 Jy, respectively.
|
12.23 GHz. The 12.23 GHz methanol maser was discovered in observations of G358.930.03 with the 26-m HartRAO telescope (MacLeod et al., 2019). The emission in this transition was detected in March 2019 with a flux density of 1100 Jy, but only 0.1 Jy remained at the VLA observation in June 2019 (Fig. 5). The flaring spectral feature at VLSR 15.5 km s-1 detected at HartRAO was below our 3 detection limit, and, as for the 6.18 GHz maser, the only emission still detectable at epoch II has a velocity close to the minimum velocity of the flaring spectrum. The brightest 12.23 GHz maser spot detected with the VLA is at VLSR 17.1 km s-1. Maser spots detected with the VLA lie in a region of 0.2′′ slightly to the NE of MM1.
20.97 GHz. The 20.97 GHz methanol maser was discovered by the Mopra observations of G358.930.03 conducted during the burst (Breen et al., 2019). In the present study, this methanol maser transition was observed only at the second epoch. The maser emission at 20.97 GHz occupies the velocity range of to km s-1, the same as other methanol maser transitions detected in the source. By the time of the VLA observations, the flaring 20.97 GHz spectral feature at VLSR km s-1 had decayed from 1000 Jy (Breen et al., 2019) to 70 Jy (Fig. 6). The blue-shifted feature at VLSR km s-1 with a flux density of 100 Jy had become the dominant one. Spatially, the maser spots trace an almost round structure of size of 0.2′′, pointing eastward from the MM1 position. There is a clear velocity gradient with blue-shifted features to the north and red-shifted features to the south.
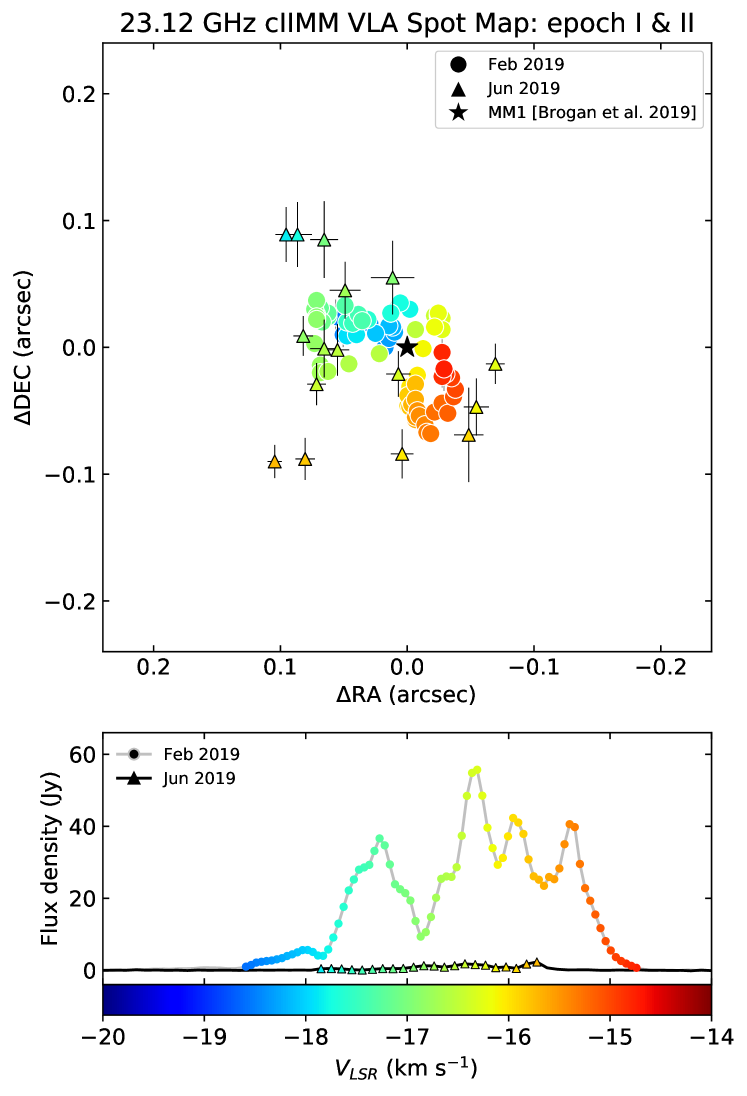
23.12 GHz. During the burst, the 23.12 GHz methanol masers associated with G358.930.03 showed the brightest and the most complex spectrum (MacLeod et al., 2019) of this rare maser transition detected to date (see Galván-Madrid et al. 2010 and references therein). The 23.12 GHz emission covers the same velocity range as of the 6.67 and 12.18 GHz masers, but with about lower flux density. By the VLA epoch II, the 23.12 GHz maser had faded to 2 Jy, but continued to have a complex, multi-component spectrum.
Spatially, the 23.12 GHz maser emission is found around MM1 (Figure 7). At the flare epoch, the 23.12 GHz maser cluster appeared to be more compact than the 6.67/12.18 GHz masers, with a size of 0.15′′. The flaring 23.12 GHz emission consists of two elongated sub-clusters, with the northern cluster hosting blue-shifted velocity features and the southern cluster with red-shifted features. At VLA epoch II, the 23.12 GHz emission is found in an expanded region of 0.2′′ (note that the lower flux densities at epoch II result in higher positional uncertainties, which could affect the apparent size of the region). The structure of the masing region at the post-flare epoch is less ordered, but shows the same north-south velocity gradient.
|
3.2 Continuum Emission
The VLA observations toward G358.930.03 detected two continuum sources (Table 2). The hot core MM3 showed continuum emission in all three frequency bands at both epochs. Nevertheless, MM3 has no evident association with the bursting source and the detected methanol masers, and is not considered further in the present study. The bursting source MM1 was detected in K-band at the first epoch of the VLA observations. No K-band emission above the 3 noise level was found at the second epoch.
In our VLA observation, conducted on February 25, 2019, during the burst epoch, MM1 showed an integrated flux density of 0.2 mJy at 20 GHz.
Note that the only centimetre observations found in the literature on the pre-burst epoch are those of Hu et al. (2016), who report a null detection at C-band, but based on only 20 seconds of data. The latest VLA B-array observation of Chen et al. (2020a) also reported a non-detection of Ku-band continuum emission in the direction of MM1 at 3 level of 20 Jy.
At the post-burst epoch, on April 12, 2019 in ALMA observations, the flux density was 282 mJy at 337 GHz (Brogan et al., 2019). Note, however, that the observations were made at different stages of the source’s activity, and, therefore, the results of the observations cannot be directly compared.
The K-band continuum images of MM1 at both epochs are shown in Figure 8 and a summary of the parameters of the detected continuum peak is presented in Table 3. The offset between the ALMA and VLA positions of MM1 is 0.2 (Fig. 9) which is similar to the absolute positional uncertainty reported in Brogan et al. (2019).
| Association | Band | Epoch | RA(J2000) | DEC(J2000) | Integrated flux | Peak flux | SNR |
|---|---|---|---|---|---|---|---|
| (h m s) | (∘ ) | (Jy) | (Jy/beam) | ||||
| MM1 | K | I | 17:43:10.106(0.0001)aaThe positional uncertainties are statistical errors of fit. | 29:51:45.45(0.03)aaThe positional uncertainties are statistical errors of fit. | 246(18) | 223(7) | 14 |
4 Discussion
4.1 The accretion burst
A unique feature of the burst in G358.930.03 is the discovery of new maser transitions (Breen et al., 2019; Brogan et al., 2019; MacLeod et al., 2019). Three of these, the maser transitions at 6.18, 12.23, and 20.35 GHz, were not even predicted by maser pumping calculations performed up to now. Others had been predicted in theoretical works (e.g., Sobolev et al. 1997b; Cragg et al. 2005), but had not been detected previously. The reasons for their rarity are not entirely clear.
Several of the newly detected methanol masers were imaged for the first time in the VLA observations presented here. The high sensitivity and moderate resolution of the VLA allow us to study the spatial structure of very weak masers, that are not accessible to VLBI imaging, but are readily detectable by the VLA. We were able to image and precisely locate positions of faint masers at 6.18 and 12.23 GHz with flux densities of 0.1 Jy (Figures 2 and 5). Notably, not only do the imaged methanol masers, including the newly discovered ones, arise in the same region, but they also trace the same structures (Figure 10).
The VLA epoch I (February 25, 2019) observations were carried out during the maximum flare activity of the 6.67 GHz methanol maser in G358.930.03, midway between the two peaks of the flare on February 14 and March 12 (iMet data; see section 3). Thus, the VLA epoch I can be considered as a flare epoch while the VLA epoch II (June 4, 2019) is a post-flare one.
Pre-flare VLA data from early 2012 exist and were published by Hu et al. (2016). In the quiescent state, the peak 6.67 GHz maser flux density was 5 Jy (Hu et al., 2016). The data of Hu et al. (2016) were obtained with the beam of the VLA C-configuration, i.e. with much lower resolution than our VLA data, which precludes a comparison of the spot maps.
Our VLA data indicate that all of the flaring methanol masers originate from a single region of size 0.2′′ (Figures 10 and 11) which coincides with the brightest mm source, MM1, detected with ALMA (Brogan et al., 2019). The close spatial association of the various flaring maser transitions is expected if caused by an accretion burst.
In order to analyse the maser density distribution at two VLA epochs and its evolution between the observations, we calculated the number of detected maser spots around MM1 – see histograms in Figure 11. The blue markers on the map and blue histogram bars correspond to the VLA epoch I, and the red markers/bars correspond to the epoch II. The bin width of the histograms is 0.02 arcsec which is one tenth of the area occupied by the maser emission and corresponds to the median position fitting error of our data (see Tables 4-9).
At the first VLA epoch, the flaring methanol maser emission consists of two linked sub-clusters, where the northern cluster hosts blue-shifted velocity spots while the southern cluster has red-shifted ones (Figure 10a). The analyses of the density of the maser spot distribution around MM1 (Figure 11), shows two density peaks located almost symmetrically around the source at the separations of 0.05 arcsec. One ’knot’ is located to NE and another to SW of the MM1 position. Following the idea of Chen et al. (2020b), we interpret the VLA maser spot map obtained during the flare epoch for the 6.67, 12.18 and 23.12 class II methanol masers as a two-arm spiral pattern. The most crowded parts of the maser clusters could be explained as turning points of the gas motion in the arms (Meyer et al., 2018).
At the post-flare epoch, all detected methanol masers (including the newly-discovered and rare transitions) trace a bow-shaped structure extending eastward from the MM1 position (Figure 10b). While the velocity pattern persisted (the blue-shifted velocity spots are found to the north and the red-shifted to the south), the region affected by the maser emission expanded. The histograms in Figure 11 show that the maximums of the maser spot density shifted outwards to the radius of 0.09 arcsec from the position of the central source.
To estimate the evolution of the maser distribution in the region, we compare the positions of the maser emission density ”knots” evaluated from the histograms in Figure 11. The density peaks were found at the diameter of 0.1 arcsec around MM1 at epoch I, and of 0.2 arcsec at epoch II. Thus, the region of physical conditions suitable to sustain maser emission doubled in size.
The drastic change between flare and post-flare epochs affected the entire masing region of 1000 AU (adopting the BeSSeL estimate of a near kinematic distance of 6.75 kpc) and happened in a period of about three months. Assuming these parameters, the triggering event may have propagated at a speed of 0.06 from the bursting source. Such a high speed is almost certainly not caused by any physical movement of material. Hence, the flare and spatial rearrangement of the maser emission must be caused by a radiative event from the protostar that propagated through regions of more favorable physical conditions, more distant from the protostar.
4.2 Comparison of the VLA data with other observations
A thermal radiation “heatwave” emanating from an accreting high-mass protostar in G358.930.03, propagating at subluminal speed, has been inferred from multi-epoch LBA observations of 6.67 GHz methanol masers (Burns et al., 2020). The lower spatial resolution of the VLA prohibits such a precise analysis of the spatial structure of the maser emission in the region. On the other hand, it provides a unique insight into an extended component of maser emission.
The comparison of the VLA cross-correlation spectra (with a synthesized beam size of 3.5 arcsec, see Table 1) and single-dish spectra obtained with the Hitachi 32-m radio telescope as a part of the Ibaraki 6.7-GHz Methanol Maser Monitor (iMet) program shows that 100% of the single-dish flux density is recovered on the VLA baselines (Figure 12). In contrast, only 10% of the maser flux density was recovered with the milli-arcsecond synthesized beam of the LBA (Burns et al., 2020). Based on these results and in accordance with the core/halo hypothesis of the structure of class II methanol maser masers (e.g. Minier et al. 2002), we conclude that with the VLA baselines we detect both compact (core) and extended (halo) emission while with the LBA baselines we detect only the compact core emission.
The comparison of the 6.7 GHz methanol maser spot maps obtained in the VLBI observations of Burns et al. (2020) and in our VLA observations (Figure 13), shows that compact and extended components of the maser emission trace the same region around MM1, but highlight rather different structures. Both compact (VLBI data) and extended (VLA data) emission can be divided in two clusters: an upper (northern) cluster consisting of blue-shifted velocity spots and a lower (southern) cluster consisting of red-shifted velocity spots. However, the northern cluster of extended VLA maser emission is smaller than the southern cluster, while for the compact VLBI emission, the two clusters have about the same size. Also noteworthy is that both extended and compact maser emission trace roughly the same turning points in the both the northern and southern clusters.
Nevertheless, the LBA (Burns et al., 2020) and VLA observations were carried out with a three-day interval from each other during the period of high activity of the source. Therefore, it is possible that not all differences in the structure of the spot maps can be attributed to the extended/compact emission duality. For example, the most southern, linearly elongated maser cluster detected with the LBA has no counterpart in the VLA map. The iMet monitoring data indicated that the source shows daily/intraday variability. If we assume that a 0.05 arcsec cluster was ignited by the propagation of the heat wave over three days between the observations, the wave speed must be of 0.7c. On the one hand, a wave propagating through the low density material is supposed to have a speed of light, thus the speed of 0.7c is achievable, especially in the lower density outer regions. However, the absence of the elongated southern substructure is most likely due to the effect of centroid mapping. The most distant spot from MM1 with a particular velocity will be averaged in the synthesised beam with any other spots with the same velocity in the region, on average that will bring the centroid map position to be closer to center of the red cluster.
It is also found that the cm-wavelength methanol masers detected with the VLA (this paper) and newly discovered high-frequency methanol masers detected with the SMA and ALMA (Brogan et al., 2019) trace similar spatial patterns (see Figure 14). Here we present a comparison of our VLA data with the 199.575 GHz methanol maser – the strongest (sub)millimeter maser detected in Brogan et al. (2019). Our analysis showed that the VLA epoch I data (February, 2019) resembles the SMA 199.575 GHz maser data obtained on March 14, 2019, while the VLA epoch II data (June, 2019) is similar to the spatial distribution of the 199.575 GHz methanol maser detected on April, 16 with the ALMA. In February-March, 2019, during the peak activity of the methanol maser flare (see Figure 1), both the common (VLA data) and (sub)millimeter, torsionally excited (SMA and ALMA data) methanol maser transitions are found in two sub-clusters separated by location and velocity, with the northern cluster containing the blue-shifted maser spots and the southern cluster predominated by the red-shifted velocity spots (Figure 14a). At the post-flare epoch, in April-June, 2019, all detected methanol masers trace a wider and less-dense/more-elongated formation, which can be interpreted as a spiral-arm structure (Figure 14b).
The cross-matching of our data and the results from Chen et al. (2020b) showed that the spatial distribution of the methanol masers detected at the second VLA epoch closely reassembles that which Chen et al. (2020b) reported for the 13CH3OH, HDO, and HNCO masers in G358.930.03 (Figure 15b). Note that despite the fact that the observations of Chen et al. (2020b) were conducted with the VLA on April 4, 2019, i.e. closer to our VLA epoch I (38 day apart - see Figure 15a), the data of the VLA epoch II (61 day apart) appeared to be more fitting (Figure 15b). Chen et al. (2020b) argue that the rare masers detected in their VLA observation trace a two-armed spiral structure; in this scenario the arms reveal accretion flows falling onto the central star in spiral trajectories. According to theory (e.g. Meyer et al. 2019a; Jankovic et al. 2019), spiral arms, as well as accretion burst, are products of gravitational instability of a disk around MYSOs. Our VLA data seems to suggest that the spiral-arm features of the accretion disk are traced not only by rare maser species detected by Chen et al. (2020b), but also by more common methanol masers at 6.67 and 12.18 GHz. Note that the observations of Chen et al. (2020b) were performed still at the flare epoch (April 4), while our VLA observations took place at the post-flare epoch (June 4) - see Figure 1. In the period between observations, no drastic changes in the structure of the spectrum were observed for the methanol maser at 6.7 GHz, for example; the only striking difference was the gradual decrease in the maser flux density from 500 Jy to 100 Jy777http://vlbi.sci.ibaraki.ac.jp/iMet/G358.9-00-190114/daily.html. The two-arm spiral infall gas flow structure seems to still exist at the post-flare period, and the physical conditions (e.g., temperature) in these flows change with the flare propagation, making different type of masers (with different pumping conditions) gradually arise or disappear in the flows. The resemblance of the maser clusters detected in Chen et al. (2020b) and in our observations at epoch II (Figure 15b) indicates that the spatial distribution of the methanol masers remained roughly constant after April 2019.
Note that the most recent VLBI/ALMA results obtained by the M2O indicate the presence of a more complex spatial structure of the regions traced by the methanol masers than that found with the VLA (Burns et al. in prep., Brogan et al. in prep). For example, VLBI observations suggest a 4-arm system (Burns et al. in prep.), not the two-arm system that was discovered with the VLA (Chen et al. (2020b), this paper). Nevertheless, the VLBI and VLA results do not contradict each other, but rather indicate the limitations of spatially unresolved maser spot fitting when there is complex underlying spatial morphology in each channel. It is possible that the two arms in the blue side of the disk are averaged within the VLA synthesised beam into one arm, and the same for the two arms on the red side of the disk. Since the disk is almost face-on, the velocity differences across the disk are small which worsens this effect as the centroid mapping technique derives a single spot per velocity channel and many maser spots exist in different parts of the disk (in different arms) at the same velocity. A more detailed comparison of the VLA and VLBI/ALMA results obtained for the source will be presented in the future M2O publications.
4.3 Cm-continuum emission of MM1
The strong millimeter continuum emission of MM1 Brogan et al. (2019), coupled with the lack of significant centimeter emission (Figure 8) indicates that the source is probably in a precursor state of ultracompact HII region (Churchwell, 2002), as it was indicated in Brogan et al. (2019).
Our continuum observations suggest a moderate decrease in the flux densities of MM1 in the period between the flare and post-flare epochs. As we indicated in Section 3, the ALMA mm-observations and VLA cm-observations were performed during different epochs of the source activity. The analysis is particularly difficult because the presumptive bursting source MM1 was detected only in K-band and at one epoch of observation. Moreover, in contrast to S255 and NGC6334I, cm-continuum emission in G358.930.03 shows much lower flux densities.
Nevertheless, a decrease of the cm-continuum flux density of a source can happen during accretion event. In the case of NGC6334I, for example, Hunter et al. (2017) reported a 4-fold increase in the dust continuum emission, while the free-free emission (at 1.5 cm) fell by about the same factor (Brogan & Hunter, 2018; Hunter, 2019). Such a decrease would naturally occur if the ionizing photon flux from the young stellar object is reduced due to the bloating of the star. At the high densities of these MSFR, the recombination timescale for the ionized gas can be of the order of days to weeks. Hence, the free-free continuum emission can track the same accretion events, but show a decrease while the IR luminosity increases (Hunter, 2019).
5 Summary
A multi-epoch and multi-frequency VLA imaging of maser and continuum emission in C, Ku, and K-bands was performed for the massive star-forming region G358.930.03. Two observing sessions were conducted, at the maser flare epoch (VLA epoch I) and at a post-flare epoch (VLA epoch II). The main outcomes and scientific insights obtained from the observations are summarized as follows:
(1) Maser emission is detected and imaged in several methanol transitions. Spatial structure evolution is studied for methanol masers at 6.67, 12.18, and 23.12 GHz at two observational epochs.
(2) The first interferometric images are obtained for the new methanol maser transitions at 6.18, 12.23, and 20.97 GHz (the masers were discovered in G358.930.03 in single-dish and ATCA observations (MacLeod et al., 2019; Brogan et al., 2019)).
(3) Methanol maser emission in all detected transitions and at both epochs is found in a region with a diameter of 0.2′′ around the MM1 position and shows a velocity gradient in the NS direction.
(4) A drastic change in the spatial distribution of the detected methanol masers is found. At the flare epoch, the 6.67, 12.18, and 23.12 GHz methanol masers are found in elongated regions, aligned in a NE-SW direction. At the post-flare epoch, the methanol masers trace bow-shaped structures extending eastward from the MM1 position. During the transition from the first epoch to the second, the region traced by masers expanded while the velocity gradient decreased.
(5) The obtained data suggests that the methanol masers detected with the VLA trace the spiral-arm structures within the accretion disk which were first discovered in rare maser lines in Chen et al. (2020b).
(6) K-band continuum emission is detected at VLA epoch I toward the supposed bursting source and the most line-rich hot core, detected with ALMA by Brogan et al. (2019) as G358.930.03-MM1. A moderate decrease in the flux density of MM1 in the period between the flare and post-flare epoch is detected.
| Epoch | RA(J2000) | DEC(J2000) | Integrated flux | Peak flux | VLSR |
|---|---|---|---|---|---|
| (h m s) | (∘ ) | (Jy) | (Jy/beam) | (km s-1) | |
| II | 17:43:10.09610.0012 | -29:51:45.5490.106 | 0.080.01 | 0.090.01 | -18.61 |
| Epoch | RA(J2000) | DEC(J2000) | Integrated flux | Peak flux | VLSR |
|---|---|---|---|---|---|
| (h m s) | (∘ ) | (Jy) | (Jy/beam) | (km s-1) | |
| I | 17:43:10.09890.0001 | -29:51:45.7570.014 | 15.550.15 | 15.800.06 | -19.36 |
| 17:43:10.09880.0001 | -29:51:45.7860.010 | 38.080.27 | 38.120.11 | -19.27 | |
| 17:43:10.09890.0001 | -29:51:45.7680.009 | 54.480.34 | 54.160.13 | -19.19 |
Note. — (1) Table 5 is published in its entirety in the machine-readable format. A portion is shown here for guidance regarding its form and content.
(2) The positional shifts of RA=0.010, DEC=0.079 (epoch I) and RA=0.017, DEC=0.017 (epoch II) were introduced to the data to prepare Figures 3 and 10-11, and 13-15 (see section 2).
| Epoch | RA(J2000) | DEC(J2000) | Integrated flux | Peak flux | VLSR |
|---|---|---|---|---|---|
| (h m s) | (∘ ) | (Jy) | (Jy/beam) | (km s-1) | |
| I | 17:43:10.10240.0100 | -29:51:45.6190.007 | 21.700.21 | 21.950.09 | -19.25 |
| 17:43:10.10200.0100 | -29:51:45.6210.007 | 31.130.29 | 31.300.12 | -19.16 | |
| 17:43:10.10220.0100 | -29:51:45.6260.007 | 35.830.33 | 35.920.14 | -19.06 |
Note. — (1) Table 6 is published in its entirety in the machine-readable format. A portion is shown here for guidance regarding its form and content.
(2) The positional shifts of RA=-0.034, DEC=-0.058 (epoch I) and RA=-0.070, DEC=-0.058 (epoch II) were introduced to the data to prepare Figures 4 and 10-11, and 13-15(see section 2).
| Epoch | RA(J2000) | DEC(J2000) | Integrated flux | Peak flux | VLSR |
|---|---|---|---|---|---|
| (h m s) | (∘ ) | (Jy) | (Jy/beam) | (km s-1) | |
| II | 17:43:10.11480.0012 | -29 51 45.7150.080 | 0.090.02 | 0.070.01 | -16.15 |
| 17:43:10.11750.0008 | -29 51 45.5230.006 | 0.080.02 | 0.080.01 | -16.63 | |
| 17:43:10.10740.0013 | -29 51 45.7070.057 | 0.100.02 | 0.080.01 | -16.73 |
| Epoch | RA(J2000) | DEC(J2000) | Integrated flux | Peak flux | VLSR |
|---|---|---|---|---|---|
| (h m s) | (∘ ) | (Jy) | (Jy/beam) | (km s-1) | |
| II | 17:43:10.09880.0003 | -29:51:45.6080.012 | 7.310.36 | 5.950.16 | -17.61 |
| 17:43:10.09880.0003 | -29:51:45.6160.013 | 13.290.64 | 10.310.28 | -17.50 | |
| 17:43:10.10530.0003 | -29:51:45.6160.012 | 27.301.20 | 18.480.48 | -17.39 |
| Epoch | RA(J2000) | DEC(J2000) | Integrated flux | Peak flux | VLSR |
|---|---|---|---|---|---|
| (h m s) | (∘ ) | (Jy) | (Jy/beam) | (km s-1) | |
| I | 17:43:10.10550.0001 | -29:51:45.7200.014 | 0.870.03 | 0.820.01 | -18.59 |
| 17:43:10.10540.0001 | -29:51:45.7200.012 | 1.380.04 | 1.190.02 | -18.54 | |
| 17:43:10.10510.0001 | -29:51:45.7340.010 | 1.990.05 | 1.630.02 | -18.49 |
Note. — (1) Table 9 is published in its entirety in the machine-readable format. A portion is shown here for guidance regarding its form and content.
(2) The positional shifts of RA=-0.005, DEC=-0.051 (epoch I) and RA=-0.035, DEC=-0.040 (epoch II) were introduced to the data to prepare Figures 7 and 10-11, and 13-15 (see section 2).
References
- Ahmadi et al. (2019) Ahmadi, A., Kuiper, R., & Beuther, H. 2019, A&A, 632, A50, doi: 10.1051/0004-6361/201935783
- Argon et al. (2000) Argon, A. L., Reid, M. J., & Menten, K. M. 2000, ApJS, 129, 159, doi: 10.1086/313406
- Breen et al. (2012) Breen, S. L., Ellingsen, S. P., Caswell, J. L., et al. 2012, MNRAS, 421, 1703, doi: 10.1111/j.1365-2966.2012.20432.x
- Breen et al. (2019) Breen, S. L., Sobolev, A. M., Kaczmarek, J. F., et al. 2019, ApJ, 876, L25, doi: 10.3847/2041-8213/ab191c
- Brogan & Hunter (2018) Brogan, C., & Hunter, T. R. 2018, in 2018AAS, Vol. 231, 2018AAS 231, 342.20
- Brogan et al. (2019) Brogan, C. L., Hunter, T. R., Towner, A. P. M., et al. 2019, ApJ, 881, L39, doi: 10.3847/2041-8213/ab2f8a
- Burns et al. (2020) Burns, R. A., Sugiyama, K., Hirota, T., et al. 2020, NatAs, 4, 506, doi: 10.1038/s41550-019-0989-3
- Caratti o Garatti et al. (2017) Caratti o Garatti, A., Stecklum, B., Garcia Lopez, R., et al. 2017, NatPh, 13, 276, doi: 10.1038/nphys3942
- Caswell et al. (2010) Caswell, J. L., Fuller, G. A., Green, J. A., et al. 2010, MNRAS, 404, 1029, doi: 10.1111/j.1365-2966.2010.16339.x
- Chambers et al. (2014) Chambers, E. T., Yusef-Zadeh, F., & Ott, J. 2014, A&A, 563, A68, doi: 10.1051/0004-6361/201322752
- Chen et al. (2020a) Chen, X., Sobolev, A. M., Breen, S. L., et al. 2020a, ApJ, 890, L22, doi: 10.3847/2041-8213/ab72a5
- Chen et al. (2020b) Chen, X., Sobolev, A. M., Ren, Z.-Y., et al. 2020b, NatAs, doi: 10.1038/s41550-020-1144-x
- Churchwell (2002) Churchwell, E. 2002, ARA&A, 40, 27, doi: 10.1146/annurev.astro.40.060401.093845
- Cragg et al. (2004) Cragg, D. M., Sobolev, A. M., Caswell, J. L., Ellingsen, S. P., & Godfrey, P. D. 2004, MNRAS, 351, 1327, doi: 10.1111/j.1365-2966.2004.07882.x
- Cragg et al. (2005) Cragg, D. M., Sobolev, A. M., & Godfrey, P. D. 2005, MNRAS, 360, 533, doi: 10.1111/j.1365-2966.2005.09077.x
- Ellingsen et al. (2007) Ellingsen, S. P., Voronkov, M. A., Cragg, D. M., et al. 2007, in 2007IAUS, Vol. 242, 213, doi: 10.1017/S1743921307012999
- Galván-Madrid et al. (2010) Galván-Madrid, R., Montes, G., Ramírez, E. A., et al. 2010, ApJ, 713, 423, doi: 10.1088/0004-637X/713/1/423
- Hosokawa et al. (2016) Hosokawa, T., Hirano, S., Kuiper, R., et al. 2016, ApJ, 824, 119, doi: 10.3847/0004-637X/824/2/119
- Hu et al. (2016) Hu, B., Menten, K. M., Wu, Y., et al. 2016, ApJ, 833, 18, doi: 10.3847/0004-637X/833/1/18
- Hunter (2019) Hunter, T. R. 2019, in 2019asrc conf, 91, doi: 10.5281/zenodo.3585380
- Hunter et al. (2017) Hunter, T. R., Brogan, C. L., MacLeod, G., et al. 2017, ApJ, 837, L29, doi: 10.3847/2041-8213/aa5d0e
- Jankovic et al. (2019) Jankovic, M. R., Haworth, T. J., Ilee, J. D., et al. 2019, MNRAS, 482, 4673, doi: 10.1093/mnras/sty3038
- MacLeod et al. (2018) MacLeod, G. C., Smits, D. P., Goedhart, S., et al. 2018, MNRAS, 478, 1077, doi: 10.1093/mnras/sty996
- MacLeod et al. (2019) MacLeod, G. C., Sugiyama, K., Hunter, T. R., et al. 2019, MNRAS, 489, 3981, doi: 10.1093/mnras/stz2417
- McKee & Ostriker (2007) McKee, C. F., & Ostriker, E. C. 2007, ARA&A, 45, 565, doi: 10.1146/annurev.astro.45.051806.110602
- McMullin et al. (2007) McMullin, J. P., Waters, B., Schiebel, D., Young, W., & Golap, K. 2007, in ASPC, Vol. 376, 2007ASPC 376, 127
- Meyer et al. (2019a) Meyer, D. M. A., Kreplin, A., Kraus, S., et al. 2019a, MNRAS, 487, 4473, doi: 10.1093/mnras/stz1585
- Meyer et al. (2018) Meyer, D. M. A., Kuiper, R., Kley, W., Johnston, K. G., & Vorobyov, E. 2018, MNRAS, 473, 3615, doi: 10.1093/mnras/stx2551
- Meyer et al. (2019b) Meyer, D. M. A., Vorobyov, E. I., Elbakyan, V. G., et al. 2019b, MNRAS, 482, 5459, doi: 10.1093/mnras/sty2980
- Minier et al. (2002) Minier, V., Booth, R. S., & Conway, J. E. 2002, A&A, 383, 614, doi: 10.1051/0004-6361:20011766
- Müller et al. (2004) Müller, H. S. P., Menten, K. M., & Mäder, H. 2004, A&A, 428, 1019, doi: 10.1051/0004-6361:20041384
- Pickett et al. (1998) Pickett, H. M., Poynter, R. L., Cohen, E. A., et al. 1998, J. Quant. Spec. Radiat. Transf., 60, 883, doi: 10.1016/S0022-4073(98)00091-0
- Proven-Adzri et al. (2019) Proven-Adzri, E., MacLeod, G. C., Heever, S. P. v. d., et al. 2019, MNRAS, 487, 2407, doi: 10.1093/mnras/stz1458
- Reid et al. (2014) Reid, M. J., Menten, K. M., Brunthaler, A., et al. 2014, ApJ, 783, 130, doi: 10.1088/0004-637X/783/2/130
- Rickert et al. (2019) Rickert, M., Yusef-Zadeh, F., & Ott, J. 2019, MNRAS, 482, 5349, doi: 10.1093/mnras/sty2901
- Sobolev et al. (1997a) Sobolev, A. M., Cragg, D. M., & Godfrey, P. D. 1997a, MNRAS, 288, L39, doi: 10.1093/mnras/288.2.L39
- Sobolev et al. (1997b) —. 1997b, A&A, 324, 211
- Stecklum et al. (2021) Stecklum, B., Wolf, V., Linz, H., et al. 2021, A&A, 646, A161, doi: 10.1051/0004-6361/202039645
- Sugiyama et al. (2019) Sugiyama, K., Saito, Y., Yonekura, Y., & Momose, M. 2019, ATel, 12446, 1
- Szymczak et al. (2018) Szymczak, M., Olech, M., Wolak, P., Gérard, E., & Bartkiewicz, A. 2018, A&A, 617, A80, doi: 10.1051/0004-6361/201833443
- Titmarsh et al. (2016) Titmarsh, A. M., Ellingsen, S. P., Breen, S. L., Caswell, J. L., & Voronkov, M. A. 2016, MNRAS, 459, 157, doi: 10.1093/mnras/stw636
- Volvach et al. (2020) Volvach, A. E., Volvach, L. N., Larionov, M. G., et al. 2020, MNRAS, 494, L59, doi: 10.1093/mnrasl/slaa036
- Yonekura et al. (2016) Yonekura, Y., Saito, Y., Sugiyama, K., et al. 2016, PASJ, 68, 74, doi: 10.1093/pasj/psw045