11email: Valentina.R11@yandex.ru
Results of selected stellar spectroscopy programs at the 6-m telescope of SAO RAS performed with the NES echelle spectrograph
Over the past two decades the echelle spectrograph NES of the 6-m telescope of the Special Astrophysical Observatory of the Russian Academy of Sciences was used to perform high resolution spectroscopy of far evolved stars spanning a wide range of initial masses. The studies cover a diversity of stars with high mass-loss rates during the preceding and current stages of evolution. All these stars have extended atmospheres and structured circumstellar envelopes produced by strong stellar winds. We have studied luminous blue variables (LBVs) near the Eddington limit; hot supergiants with B[e] phenomenon in spectra, which are very likely intermediate-mass binary systems soon after the fast mass exchange stage; a group of yellow hypergiants, as well as an extensive sample of low-mass post-AGB supergiants. The diverse nature of the types of these stars whose common feature is the presence of a circumstellar envelope makes the spectroscopy of such objects a comprehensive task. Such studies consist of many etapes, which include not only determining the peculiarities of their atmospheric chemical composition and understanding the role of supergiants in the enrichment of the interstellar medium with freshly synthesized elements, but also the determination of the evolution status of the objects considered, as well as search for and analysis of spectroscopic manifestations of kinematic processes in their extended and unstable atmospheres and gas-dust envelopes. We spectroscopically monitored selected objects to study in detail the instability of the kinematic state of the atmospheres of the stars considered. Studies of stars at neighboring evolutionary stages have been recently initiated. This review reports briefly the most significant observational obtained within the framework of the programs in 1998–2021.
1 Introduction
The authors’ (VGK and VEP) experience in stellar spectroscopy performed with the 6-meter telescope of the Special Astrophysical Observatory of the Russian Academy of Sciences accumulated during the first twenty years of the operation of the 6-m telescope (Panchuk, 1998) allowed us to identify the types of observational programs that seemed productive when carried out on a multiprogram telescope. These are primarily programs whose preparation involves no serious work input on the part of qualified service personnel. We therefore focused our efforts on the development of instruments permanently attached to the Nasmyth foci platforms of the 6-m telescope (Klochkova et al., 1991; Gazhur et al., 1990; Panchuk et al., 1993; Monin and Panchuk, 2002). Second, our experience has shown that programs that require observations to be performed at predetermined time are difficult to reconcile with the multi-program status of the telescope.
Our preference is for survey programs combined with continuous monitoring of selected objects. In this case observations need not to be made at predetermined times, which, given the information about the repeatability of clear nights (Erokhin and Plyaskin, 1983) and seeing at the 6-m telescope (Panchuk and Afanas’ev, 2011), increases the probability of successful observations. Of the programs that meet such requirements, of interest to us are those aimed at studying objects in the upper part of the Hertzsprung-Russell (H–R) diagram. Objects studied span a wide range of parameters, requiring quite a variety of skills acquired by analyzing the results of the programs performed at the end of the 20th century (Klochkova and Panchuk, 1998).
The matter lost via stellar wind and envelope outflow (or its ejecting) is usually pre-processed through nucleosynthesis during the preceding stages of evolution. During the evolutionary stages under study, mass loss occurs at a varying rate and often with a low level of symmetry. The lower limit of the velocities of relative motions in the atmospheres and envelopes of the objects studied is – km s-1, and that is why since we prefer to use the NES spectrograph of the 6-m telescope (Panchuk et al., 2009, 2017), which provides better accuracy of measurements based on individual lines and groups of lines.
2 Low-mass supergiants at the post-AGB phase
We started carrying out this program by studying the supergiant population at high galactic latitudes (Klochkova and Panchuk, 1989; Klochkova et al., 1997b) with Main Stellar Spectrograph (Panchuk et al., 2014) and the first high-resolution LYNX echelle spectrograph (Panchuk et al., 1993). With the introduction of the NES spectrograph into the practice of observations, the program was extended to the spectroscopy of supergiants with large infrared flux excess and proved to be most efficient both in terms of results and scientometric criteria. IR flux excess is the main criterion for selecting candidate stars, which include various star types with high mass-loss rates during the previous and current stages of evolution. The vast majority of the objects studied are asymptotic giant branch (hereafter AGB) stars and their nearest descendants – post-AGB stars that rapidly evolve toward the planetary nebula (PN) stage and for this reason also referred to as protoplanetary nebulae (PPN). This type of stars is of interest primarily for searching for evolutionary changes in the chemical composition of stars that have passed the AGB stage and the third dredge-up.
Here we only point out the most significant results. First and foremost, it is the detection of excess of -process heavy metals in the atmospheres of seven single post-AGB stars (Klochkova, 1997, 2019) in what was an empirical support for the conclusions of the theory of the evolution of this type of stars. In the spectra of three of these stars a new phenomenon—splitting of strong metal absorptions—was detected for the first time, indicating that -process heavy metals are brought into circumstellar envelopes (Klochkova and Panchuk, 2016). Figure 1 excellently illustrates this effect showing variable Å absorption profile of in the spectra of the post-AGB supergiant . According to data reported by Klochkova (2013), two short-wave components form in two different layers of the structured envelope of the star, which expand with the velocities of and km s-1 relative to the systemic velocity.
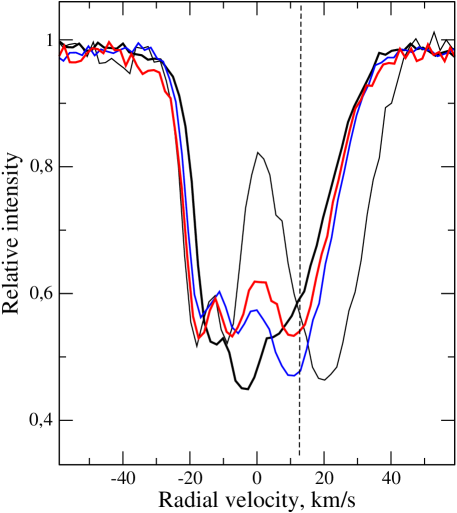
The splitting of strong absorptions is observed in the optical spectra of selected post-AGB stars with C-rich envelopes and atmospheres enriched in carbon and heavy metals of the -process. The splitting is maximal in Ba II ions, whose lines can break up into 2–3 components. An analysis of IR and radio spectroscopy data showed that individual components of the split absorptions form in structured circumstellar envelopes. We thus observe the dredge-up of heavy metals synthesized during the preceding evolution of the star into the shell. The type of strong absorption profiles (splitting or asymmetry, number of components) is associated with the morphology of the envelope and with its kinematical and chemical properties.
The diversity nature of the types of infrared-excess stars makes their spectroscopy a comprehensive task. The stages of their study include not only identifying the features of the chemical composition and elucidating the role of supergiants in the enrichment of the interstellar medium with freshly synthesized elements, but also the determination of the evolutionary status of the objects considered and an analysis of the spectral manifestations of kinematic processes in their extended, often unstable, atmospheres and in gas-dust envelopes. Studies of the instability of spectra and of the kinematic state of atmospheres of selected stars require spectroscopic monitoring.
The program that started with the detection of overabundance of -process elements has been extended to incorporate the kinematics of stellar atmospheres and envelopes (Klochkova and Chentsov, 2007; Klochkova, 2014), the construction of spectral atlases (Klochkova et al., 2007; Chentsov et al., 1999) and spectropolarimetry of selected objects (Klochkova et al., 2004). The commissioning of the NES spectrograph made it possible to study circumstellar envelopes by observing both the rotational structure of molecular spectra (in emission and absorption, see Fig. 7 in (Panchuk et al., 2009)) and the narrow components of resonance lines in Fig. 1).
Long-term monitoring has revealed monotonic changes in the spectra of several objects and allowed us to determine their evolutionary status (see, e.g., (Klochkova et al., 2002, 2016)). The status of some objects remains uncertain as evidenced by the case of the peculiar variable V838 Mon that erupted in 2002. Kipper et al. (2004) determined the parameters and chemical composition of its atmosphere from spectra acquired with the NES spectrograph of the 6-m telescope. However, the study of the nature of the object and the cause of its outbreak continues for the third decade with the results summarized by Kamiński et al. (2021).
The NES spectrograph was used to determine the fundamental parameters and detailed chemical composition of the atmospheres of several rare types of stars. For example, the spectra of extremely hydrogen-deficient supergiants in common-envelope binary systems were studied. Currently, information is available only for four extremely hydrogen-deficient close binaries (HdBs) considered to be SN Ia precursors. Surprisingly, all four objects have very close effective temperatures K. The best known among them is the supergiant Sgr (), whose main features are strong and variable H emission and large IR excess. Based on spectroscopic criteria only Kipper and Klochkova (2012) determined the effective temperature K, surface gravity , and microturbulent velocity km s-1 for this star. It has a hydrogen content of H/He , small iron deficit [Fe/H] and altered abundances of CNO-elements. A significant excess of heavy metals [s/Fe]=+0.7 was also detected. Many permitted and forbidden emission features were found in the spectrum, which correspond to low-excitation transitions of metal atoms and ions. The P Cyg-type profiles indicate the existence of a rotating accretion disk in the system. Kipper and Klochkova (2008) obtained similar results for a related system – the semiregular variable KS Per.

One of the important advantages of the NES spectrograph is its good sensitivity in the ground-based ultraviolet if combined with a proper CCD. This part of the spectrum is important for spectroscopy of a number of specific programs. An example is the spectroscopy of metal-deficient stars because the spectral details required to analyze the features of the atmospheres of such stars can be found just in the short-wave part of the spectrum. The spectroscopic observations of 14 metal-deficient G–K-type stars with high space velocities carried out with the NES spectrograph in the wavelength range 3550–5100 Å allowed the fundamental parameters and atmospheric abundances of over chemical elements including - and -process heavy elements ranging from Sr to Dy (Klochkova et al., 2011) to be determined by the models atmospheres method. For a number of elements, their abundances were computed taking into account deviations from the local thermodynamic equilibrium in the population of atomic levels. For six stars, the ratio of the abundance of the long-lived radioactive element Th to that Eu, which is an -process element, was determined using the method of synthetic spectrum. For the stars studied the various Galactic populations to which they belong were determined based on the inferred kinematical parameters and chemical composition.
An atlas (Chentsov et al., 2011) of high ratio spectra with high spectral resolution was prepared based on observations made in this poorly studied short-wavelength interval down to Å (Chentsov et al., 2011). The spectra of well-studied stars with similar temperatures ( Ori, Lyr and Cyg) are compared with those of the metal-deficient A-type supergiant KS Per with hydrogen-deficient atmosphere. The high spectral resolution and high ratio make a detailed description of the spectra a relevant task of standard stars in the ground-based ultraviolet region (300–380 nm), which is more informative than the optical spectrum due to line saturation, especially for hot stars. Figure 2 in (Chentsov et al., 2011) shows one of the shortest wavelength fragments of this spectral atlas, – Å.
The spectra in the wavelength interval 3550–5000 Å were also used to produce an atlas for several metal-deficient stars, (Klochkova et al., 2006). The above authors used these spectra to compute the abundances of a large set of chemical elements in the atmospheres of this sample of metal-deficient stars.
3 Massive stars at advanced evolution stages
The study of luminous stars is complicated by the fundamental circumstance – it is impossible to determine the star center-of-mass velocity from the spectrum that forms in nonstationary atmosphere. Whereas in the studies of post-AGB stars the results of the millimeter- and submillimiter-wave spectroscopy of their envelopes can be used to fix the systemic velocity, in the case of massive supergiants the main circumstance contributing to the determination of the star center-of-mass velocity is its membership in a stellar group. A typical example is the study of the spectrum of an LBV candidate in the Cyg OB2 association (Klochkova and Chentsov, 2004). In such cases, it is necessary to additionally measure the radial velocities of several faint member stars of an association or open cluster in order to determine the average radial velocity of the stellar group, and the task of estimating the center-of-mass velocity of a luminous star becomes rather time consuming (Chentsov et al., 2013).
The velocities of yellow hypergiants can be measured from CO, OH molecular bands. For example, Oudmaijer et al. (1996) reliably determined the systemic velocity for the V1302 Aql hypergiant (the central star of the IR source IRC+10420) from several rotational bands of the CO molecule. High-resolution optical spectroscopy can be used to measure the positions of emissions that form in the circumstellar gas medium and thereby constrain with high accuracy the velocity of the center of mass in the “hypergiant+envelope” system (e.g., for V1302 Aql (Klochkova et al., 2002) and for VES 723 (Miroshnichenko et al., 2021). The results of long-term monitoring of Northern yellow hypergiants are summarized and their fundamental parameters summarized in a review by Klochkova (2019). The fundamental parameters of the stars were determined from homogeneous high-resolution spectroscopic data. The luminosity criterion employed was the infrared oxygen triplet O I Å with extremal values of equivalent width: the mean luminosity of the stars considered is . The combined data of detailed positional measurements allowed the expansion velocity of the circumstellar envelope to be estimated as 11–40 km/s. Weak absorptions allowed the pulsation amplitudes of four objects to be estimated, which lie in the narrow interval of – km s-1.
On the whole, the spectra of extremely luminous stars compactly located in the upper part of the Hertzsprung-Russell were shown to exhibit a great variety of features, namely, the presence (or absence) of permitted and forbidden emissions, emission components of complex profiles, specific behavior of spectral details of different nature. High spectral resolution monitoring was shown to be an efficient tool for detecting the variability of the dynamic state at different depths in the extended atmosphere and the circumstellar envelope of hypergiants. In particular, such observations made it possible to prove the reliability of the yellow-hypergiant status for V1427 Aql and the absence of a companion in the V509 Cas system.
An general conclusion from observations of the V1302 Aql hypergiant in – years was that its effective temperature has been increasing rapidly during the 20th century—at a rate of about 120 K per year. Our 2001–2014 observations suggest that the hypergiant is entering a phase where its temperature increase has ceased and the object is approaching the Yellow Void boundary on the Hertzsprung-Russell diagram.
Let us also mention the spectroscopy of several Cepheids (Usenko et al., 2013, 2005). The results for Polaris are particularly important, the atmospheric parameters of the Cepheid member of this nearby multiple system were studied in detail (Usenko et al., 2005). Later, Usenko and Klochkova (2008) were the first to determine the basic parameters of companion B. Turner et al. (2013) used extensive data of the spectral monitoring of Polaris carried out by V.G. Klochkova and M.V. Yushkin with the NES spectrograph to study the variation of its luminosity and effective temperature and concluded that Polaris pulsates in the fundamental mode undergoes the first crossing of the instability strip.
4 CHANGES IN THE OPTICAL SPECTRUM OF THE CAS HYPERGIANT DUE TO A ENVELOPE EJECTION IN 2013
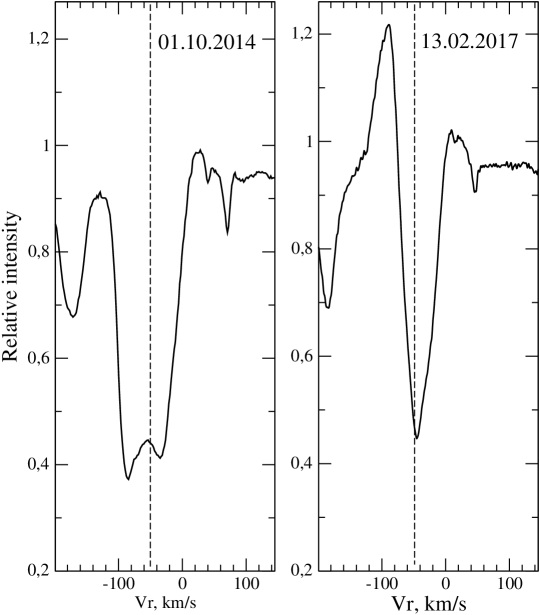
Spectral monitoring of the yellow hypergiant Cas with NES spectrograph attached to the 6-m telescope after the mass ejection that occurred in 2013 revealed changes in H line: from a doubled core profile in to the reverse P Cyg-profile in the early (see Fig. 3) and again to the doubled-core profile with a strongly redshifted core, which is indicative of the fast infall of matter. The splitting of the low-excitation absorption profiles into three components (Klochkova et al., 2018) was first detected in . It was concluded that there is no correlation in the evolution of the H profiles and splitted absorption profiles. Pulsation-type variability with an amplitude of about 10 km/s is characteristic solely of weak and moderate-intensity absorption features. In the long-wave part of the 2013 spectrum envelope emissions were detected whose intensity in 2017 decreased until almost disappearing. Envelope emission lines of metals are permanently present in the wings of the H and K lines of Ca II. Monitoring of Cas allowed us to record dynamic instabilities in the star’s upper atmosphere and detect for the first time the stratification of its gas envelope during the mass-ejection episode. (Klochkova et al., 2018).
The ejection was accompanied by a decrease of the Cas temperature and brightness by about K and , respectively (Kraus et al., 2019). During the ejection TiO molecular bands and atmospheric low-excitation metal lines characteristic of a later spectral type appeared in the spectrum. An analysis of the parameters of emissions that appear in the phases of maximum brightness showed that they vary synchronously with the flux in the strong forbidden [Ca II] emission. Recent ejections suggest that the time interval between such events is decreasing. This could mean that Cas is “preparing” for a major mass ejection followed by a star crossing the Yellow Void boundary. The relevance of systematic spectral monitoring of Cas is obvious.
5 HOT SUPERGIANTS WITH B[E] PHENOMENON
As noted above, the main criterion for selecting candidates to the family of luminous stars with infrared excess is the anomalous spectral energy distribution. Due to such a broadly encompassing criterion, the sample often included stars of unclear evolutionary status. For example, before their detailed study began, V1302 Aql and 3 Pup were considered to be post-AGB stars evolving toward the planetary nebula stage. Only a study of the chemical composition of the atmospheres of V1302 Aql (Klochkova et al., 1997a) and 3 Pup (Plets et al., 1995) allowed both stars to be classified as massive supergiants at different stages of evolution. Currently, V1302 Aql is the most bona fide representative of the yellow hypergiant family, and the hot star 3 Pup is classified as a B[e] object.
The B[e]-phenomenon consists in the spectrum of the star exhibiting a number of peculiar details: strong H I and He I emissions, as well as emissions of the permitted metal lines and low-excitation forbidden lines. The second essential feature of stars with the B[e]-phenomenon is their strong infrared flux excess due to the presence of hot circumstellar dust. However, the stars meeting the above two criteria constitute a group of very heterogeneous objects. In the spectrum of 3 Pup the complex line profiles change with time (Chentsov et al., 2010): the magnitude and sign of the absorption asymmetry and the blue-to-red emission intensity ratio vary. The profiles of all forbidden emissions in the recorded wavelength range have the same shape and width and the same radial velocity within the errors, which allows us to adopt the average radial velocity of forbidden emissions as the systemic velocity of the star: km/s. Weak photospheric absorptions exhibit bona fide date-to-date velocity variations (by up to 7 km/s.
According to its main parameters, 3 Pup is close to the star MWC 17 with the phenomenon B[e] in its spectrum. Multiple observations performed with the NES spectrograph attached to the 6-m BTA telescope made it possible to study in details the features of the optical spectrum of MWC 17 (Klochkova and Chentsov, 2016). Numerous permitted and forbidden emissions, as well as interstellar Na I lines and DIBs were identified in the – Å wavelength interval. In this case too, the velocity of forbidden emissions is adopted as the systemic velocity . However, a comparison of our data obtained for MWC 17 with earlier published data leads us to conclude that in the spectrum of MWC 17 shows no significant variability unlike that of 3 Pup.
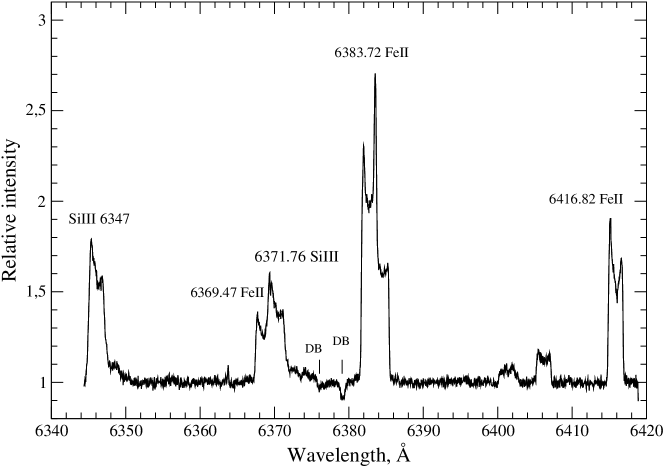
Among the stars with the B[e]-phenomenon B-supergiants in binary systems have especially challenging spectra. As an example, we mention the object MWC 84 = CI Cam, which was observed spectroscopically over considerable time with the NES spectrograph attached to the 6-m telescope. The object is unique because it has both a companion and a circumstellar gas disk. Barsukova et al. (2006) analyzed the results of the spectroscopic monitoring of CI Cam and showed that the companion is a white dwarf. Miroshnichenko et al. (2002) found a complex structure of permitted and forbidden emissions, which is indicative of the stratification of their formation region. They also concluded that these spectral features formed in a tilted circumstellar disk observed edge-on. To illustrate this feature, we show a fragment of the CI Cam spectrum in Fig. 4. The Si III and Fe II ion emissions are structured. Also apparent in this fragments are the interstellar bands DIB 6376.32 and 6379.32 Å. We also point out that all components of the infrared oxygen triplet OI 7773 Å in the spectrum of CI Cam appear as quite strong and structured emissions.
6 MIRA CETI TYPE STARS
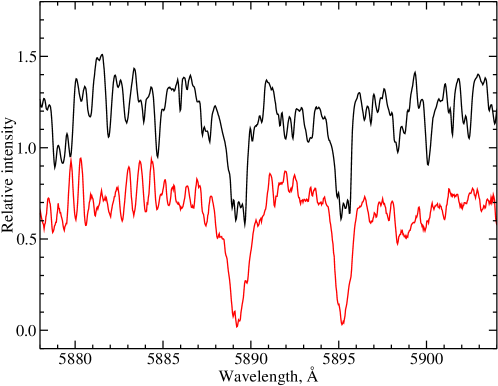
Miras are cool low-mass AGB stars (with masses less than –. Spectroscopic observations performed with the Main Stellar Spectrograph (Panchuk et al., 2014) attached to the 6-m telescope in the late s, combined with computations of synthetic (Panchuk, 1978c) molecule spectra suggested that the optical spectra of Miras do not form in the stellar atmosphere, but mainly in the cold circumstellar envelope (Panchuk, 1978b). This hypothesis can explain the variations of the visual amplitudes from period to period, the radial-velocity amplitudes that do not repeat from period to period, and the peculiarities of the behavior of hydrogen and metal emission lines (Panchuk, 1978a). The new program of spectroscopic observations of Mira stars (performed with the NES spectrograph) mostly focuses on S-type stars where the carbon-to-oxygen number ratio is close to unity. In the atmospheres and envelopes of these objects almost all C and O atoms are bound in CO molecules. The CO molecule has a maximum dissociation potential, implying that near O/C there is a lack of oxygen to form oxides and a lack of free carbon to form carbon-containing molecules. Thus the atmospheres of S-type Miras have significantly smaller content of TiO molecules than those of M-type Miras, and exhibit virtually no and CN molecules typical of C-type Miras. Therefore, the atmospheres of S-type stars are the most transparent for this interval of effective temperatures, allowing the dynamics of the spectral features of the atmosphere and envelope to be observed over a wide range of light-curve phases. Under certain conditions, in the most opaque parts of the atmosphere the spectrum of the circumstellar envelope can be observed. Figure 5 shows the part of the spectrum in the vicinity of the Na I resonance doublet for the two light-curve phases of the Mira variable star R Cam (its spectral type varies from to ).
The high spectral resolution allows us to measure the widths of the molecular lines (or their blends) in the vibrational-rotational band of the electronic system ’ of the TiO molecule (the bottom spectrum in Fig. 5, left part). Near the maximum light narrow features repeating in the D and D lines (and hence certainly belonging to sodium lines) were detected in the cores of the Na I resonance doublet. The width of these features is smaller than that of the lines of the molecular spectrum. All spectra have good signal accumulation, implying than that the deep Na I absorption cores are real. We believe that at maximum light, when the molecular absorption does not distort the structure of the Na I doublet cores, details of several envelopes detached from the star during the AGB stage can be seen in the spectra of S-type Miras. The structure of the cores of the resonant sodium doublet lines in Miras was detected for the first time.
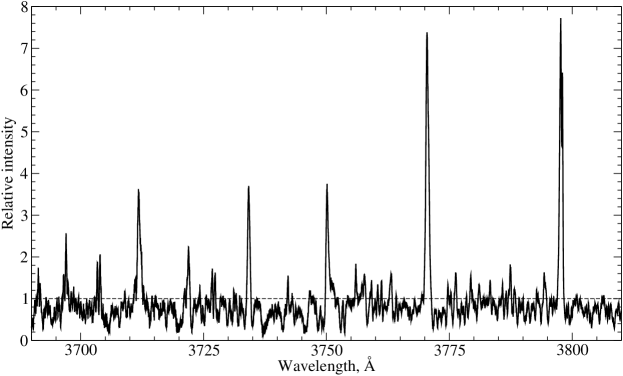
In the ground-based ultraviolet, where the molecular absorption is insignificant, spectra of S-type Miras exhibit Balmer emission lines with profiles indented by metal absorption lines (Fig. 6). The distortion of the emission lines can be used to estimate the parameters of the absorbing layer located above the formation region of emission features.

The study of non-synchronized intensity variations in various Balmer lines allows three effects to be separated: suppression of emissions by molecular absorption in the envelope, suppression in metal absorption lines, and variations of the emission intensities proper. Note that the half-width of undistorted emissions (more than 1 Å) is several times greater than both the thermal Doppler broadening and the broadening arising in the emission region behind the spherically symmetric shock. Thus, the broad simultaneously recorded fragment of the spectrum and the high spectroscopic resolution of the NES spectrograph also open up the possibility of studying asymmetric mass loss in AGB-stage stars.
7 YOUNG PLANETARY NEBULAS
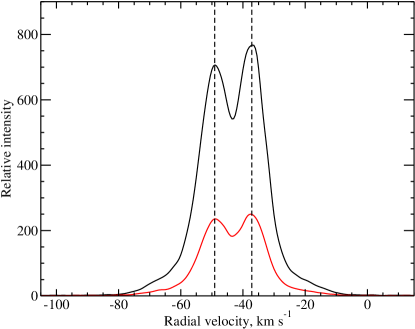
The rapid transition from the red giant to the planetary nebula (PN) stage (Harm and Schwarzschild, 1975), the transition duration is shorter than years) makes it difficult to find and study the rare post-AGB objects. Kwok (1982) suggested (and this hypothesis was later confirmed) that some signs of mass loss in red supergiants may still remain apparent during the young (compact) PN stage. Remnants of matter lost at the AGB and post-AGB stages have masses comparable to those of the PN, and are an important factor in the formation of the observed PN structure. Studies of the kinematic structure of PNs, like spectroscopy of Mira envelopes, will help clarify the picture of mass loss during the fast phase of the crossing the gap of the H–R diagram by low-mass luminous stars. Here, we consider our primary goal to be to improve the accuracy of determination of the kinematic expansion velocities of PN fragments observed in the lines of different elements and their ions, followed by obtaining (a lower) estimate for the dynamic age of the nebula. This can bring about the main advantage of the NES spectrograph over most spectrographs used for producing catalogs of PN expansion velocities (Sabbadin, 1984; Weinberger, 1989). Figure 7 shows the O III Bowen line profiles in the spectrum of - obtained with the NES spectrograph. The OIII Å line profile is marked in red, and the OIII Å profile, in black. Half the distance between the two dashed verticals in this figure corresponds to the expansion velocity. The accuracy of the Doppler component difference is m/s.
The advantage of the NES echelle spectrograph is that it allowed observations to be made in the “high slit” mode, which makes it possible to compare the expansion velocities measured from the lines of different atoms and ions for different position angles of the slit position in the PN image and different points along the height of the slit. For illustration, Figure 8 shows a Doppler image of a pair of O III Bowen lines (=5007 Å (top left) and =4559 Å (bottom right)) in the spectrum of NGC 2392 – a natural laboratory of jet formation. The spectra of image details projected on different areas along the height of the NES slit are can be seen along the vertical axis and the splitting (fragmentation) of lines due to line-of-sight velocity differences, along the horizontal line.
A combinatiion the NES spectrograph with a 4.6K2K detector allows the PN spectrum to be recorded to register (in two exposures) in the wavelength interval spanning from the ground-based ultraviolet to the near infrared, making it possible to study the lines formed by combinations of different processes (excitation, ionization, collisions, recombination, and fluorescence).
8 CONCLUSIONS
The design features and parameters of the NES spectrograph (fixed location in the telescope, high spectroscopic resolution, wide spectral range, the possibility of observing extended objects) serve both as the foundation for performing a variety of spectroscopic studies, and a stimulus for further development of the spectrograph, including the first steps along the lines of adaptive optics (Klochkova et al., 2020). The most productive programs proved to be those combining elements of the survey with long-term monitoring.
Acknowledges
The work of V.G. Klochkova was supported by the Russian Science Foundation (project No. 20-19-00597). V.E. Panchuk acknowledges the support from Government of the Russian Federation and the Ministry of Higher Education and Science of the Russian Federation (grant 075-15-2020-780) (No. 13.1902.21.0039). Observations on the telescopes of the Special Astrophysical Observatory of the Russian Academy of Sciences are supported by the Ministry of Science and Higher Education of the Russian Federation (contract No. 05.619.21.0016, unique project identifier RFMEFI61919X0016).
References
- Barsukova et al. (2006) E. A. Barsukova, N. V. Borisov, A. N. Burenkov, et al., Astronomy Reports 50 (8), 664 (2006).
- Chentsov et al. (2011) E. L. Chentsov, V. G. Klochkova, T. Kipper, et al., Astrophys. Bull., 66 (4), 466 (2011).
- Chentsov et al. (2010) E. L. Chentsov, V. G. Klochkova, and A. S. Miroshnichenko, Astrophys. Bull., 65 (2), 150 (2010).
- Chentsov et al. (2013) E. L. Chentsov, V. G. Klochkova, V. E. Panchuk, et al., Astronomy Reports 57 (7), 527 (2013).
- Chentsov et al. (1999) E. L. Chentsov, V. G. Klochkova, and N. S. Tavolganskaya, Bull. Spec. Astrophys. Obs. 48, 25 (1999).
- Erokhin and Plyaskin (1983) V. N. Erokhin and S. P. Plyaskin, Bull. SAO, 17, 40 (1983).
- Gazhur et al. (1990) E. B. Gazhur, V. G. Klochkova, and V. E. Panchuk, Soviet Astron. Lett. 16, 202 (1990).
- Harm and Schwarzschild (1975) R. Harm and M. Schwarzschild, ApJ 200, 324 (1975).
- Kamiński et al. (2021) T. Kamiński, R. Tylenda, A. Kiljan, et al., A&A 655, id. A32 (2021).
- Kipper and Klochkova (2008) T. Kipper and V. G. Klochkova, Baltic Astronomy 17, 195 (2008).
- Kipper and Klochkova (2012) T. Kipper and V. G. Klochkova, Baltic Astronomy 21, 219 (2012).
- Kipper et al. (2004) T. Kipper, V. G. Klochkova, K. Annuk, et al., A&A 416, 1107 (2004).
- Klochkova (1997) V. G. Klochkova, Bull. Spec. Astrophys. Obs. 44, 5 (1997).
- Klochkova (2013) V. G. Klochkova, Astronomy Letters 39 (11), 765 (2013).
- Klochkova (2014) V. G. Klochkova, Astrophys. Bull., 69 (3), 279 (2014).
- Klochkova (2019) V. G. Klochkova, Astrophys. Bull., 74 (4), 475 (2019).
- Klochkova and Chentsov (2004) V. G. Klochkova and E. L. Chentsov, Astronomy Reports 48 (12), 1005 (2004).
- Klochkova and Chentsov (2016) V. G. Klochkova and E. L. Chentsov, Astrophys. Bull., 71 (1), 33 (2016).
- Klochkova et al. (2016) V. G. Klochkova, E. L. Chentsov, A. S. Miroshnichenko, et al., MNRAS 459 (4), 4183 (2016).
- Klochkova et al. (1997a) V. G. Klochkova, E. L. Chentsov, and V. E. Panchuk, MNRAS 292 (1), 19 (1997a).
- Klochkova et al. (2007) V. G. Klochkova, E. L. Chentsov, V. E. Panchuk, et al., Baltic Astronomy 16, 155 (2007).
- Klochkova and Chentsov (2007) V. G. Klochkova and E. L. Chentsov, Astronomy Reports 51 (12), 994 (2007).
- Klochkova et al. (2011) V. G. Klochkova, T. V. Mishenina, V. E. Panchuk, et al., Astrophys. Bull., 66 (1), 28 (2011).
- Klochkova and Panchuk (1989) V. G. Klochkova and V. E. Panchuk, Soviet Astron. Lett., 15, 264 (1989).
- Klochkova and Panchuk (1998) V. G. Klochkova and V. E. Panchuk, Bull. Spec. Astrophys. Obs. 44, 39 (1998).
- Klochkova and Panchuk (2016) V. G. Klochkova and V. E. Panchuk, Astronomy Reports 60 (3), 344 (2016).
- Klochkova et al. (1997b) V. G. Klochkova, V. E. Panchuk, and E. L. Chentsov, A&A 323, 789 (1997b).
- Klochkova et al. (1991) V. G. Klochkova, V. E. Panchuk, and V. P. Ryadchenko, Soviet Astron. Lett. 17, 274 (1991).
- Klochkova et al. (2018) V. G. Klochkova, V. E. Panchuk, and N. S. Tavolzhanskaya, Astronomy Reports 62 (9), 623 (2018).
- Klochkova et al. (2004) V. G. Klochkova, V. E. Panchuk, M. V. Yushkin, and A. S. Miroshnichenko, Astronomy Reports 48 (4), 288 (2004).
- Klochkova et al. (2020) V. G. Klochkova, Y. V. Sheldakova, V. V. Vlasyuk, and A. V. Kudryashov, Astrophys. Bull., 75 (4), 468 (2020).
- Klochkova et al. (2002) V. G. Klochkova, M. V. Yushkin, E. L. Chentsov, and V. E. Panchuk, Astronomy Reports 46 (2), 139 (2002).
- Klochkova et al. (2006) V. G. Klochkova, G. Zhao, S. V. Ermakov, and V. E. Panchuk, Chinese J. Astron. Astrophys. 6 (5), 579 (2006).
- Kraus et al. (2019) M. Kraus, I. Kolka, A. Aret, et al., MNRAS 483 (3), 3792 (2019).
- Kwok (1982) S. Kwok, ApJ 258, 280 (1982).
- Likkel et al. (1987) L. Likkel, A. Omont, M. Morris, and T. Forveille, A&A 173, L11 (1987).
- Miroshnichenko et al. (2002) A. S. Miroshnichenko, V. G. Klochkova, K. S. Bjorkman, and V. E. Panchuk, A&A 390, 627 (2002).
- Miroshnichenko et al. (2021) A. S. Miroshnichenko, V. G. Klochkova, E. L. Chentsov, et al., MNRAS 507 (1), 879 (2021).
- Monin and Panchuk (2002) D. N. Monin and V. E. Panchuk, Astronomy Letters 28 (12), 847 (2002).
- Oudmaijer et al. (1996) R. D. Oudmaijer, M. A. T. Groenewegen, H. E. Matthews, et al., MNRAS 280 (4), 1062 (1996).
- Panchuk (1978a) V. E. Panchuk, Soviet Astron. Lett. 4, 201 (1978a).
- Panchuk (1978b) V. E. Panchuk, Soviet Astron. Lett. 4, 170 (1978b).
- Panchuk (1978c) V. E. Panchuk, Soobshcheniya Spetsial’noj Astrofizicheskoj Observatorii 22, 5 (1978c).
- Panchuk (1998) V. E. Panchuk, Bull. Spec. Astrophys. Obs. 44, 65 (1998).
- Panchuk and Afanas’ev (2011) V. E. Panchuk and V. L. Afanas’ev, Astrophys. Bull., 66 (2), 233 (2011).
- Panchuk et al. (2014) V. E. Panchuk, G. A. Chuntonov, and I. D. Naidenov, Astrophys. Bull., 69 (3), 339 (2014).
- Panchuk et al. (1993) V. E. Panchuk, V. G. Klochkova, G. A. Galazutdinov, et al., Astronomy Letters 19 (6), 431 (1993).
- Panchuk et al. (2017) V. E. Panchuk, V. G. Klochkova, and M. V. Yushkin, Astronomy Reports 61 (9), 820 (2017).
- Panchuk et al. (2009) V. E. Panchuk, V. G. Klochkova, M. V. Yushkin, and I. D. Naidenov, J. Optical Technology 76 (2), 87 (2009).
- Plets et al. (1995) H. Plets, C. Waelkens, and N. R. Trams, A&A 293, 363 (1995).
- Sabbadin (1984) F. Sabbadin, A&AS 58, 273 (1984).
- Turner et al. (2013) D. G. Turner, V. V. Kovtyukh, I. A. Usenko, and N. I. Gorlova, ApJ 762 (1), L8 (2013).
- Usenko and Klochkova (2008) I. A. Usenko and V. G. Klochkova, MNRAS 387 (1), L1 (2008).
- Usenko et al. (2013) I. A. Usenko, V. G. Klochkova, and N. S. Tavolzhanskaya, Astronomy Letters 39 (9), 634 (2013).
- Usenko et al. (2005) I. A. Usenko, A. S. Miroshnichenko, V. G. Klochkova, and M. V. Yushkin, MNRAS 362 (4), 1219 (2005).
- Weinberger (1989) R. Weinberger, A&AS 78, 301 (1989).