One second interrogation time in a 200 round-trip waveguide atom interferometer
Abstract
We report a multiple-loop guided atom interferometer in which the atoms make 200 small-amplitude round-trips, instead of one large single orbit. The approach is enabled by using ultracold 39K gas in 1D waveguide potential formed by a loosely focusing 1064 nm dipole trap and a magnetic Feshbach resonance that can tune the -wave scattering length across zero to significantly reduce the atom loss from cold collisions. The momentum transfer is imparted by a Bragg diffraction of efficiency from a standingwave colinear to the 1D waveguide. This scheme is resilient against noisy environments, achieving 0.9 s interrogation time without any vibration noise isolation or cancellation. The AC signal sensitivity of the scheme can be used with the device to measure localized potentials with high sensitivity. We used this technique to measure the dynamic polarizability of the 39K ground state at 1064 nm. The interferometer may also be a useful approach to building a compact multiple-loop Sagnac atom interferometer for rotation sensing.
Light pulse atom interferometers are important measurement tools in areas ranging from fundamental science to practical applications such as inertial sensing [1, 2]. The most widely-used atom interferometer is the free-space Mach-Zehnder configuration in which an atomic wave packet is split by a beamsplitter light pulse into two wavepackets which move apart before being reflected by a mirror light pulse and then subjected to a second beamsplitter pulse when the wavepackets overlap again. Long interrogation times are desirable because sensitivity scales as the square of the interrogation time. However, because the atoms are falling freely under gravity during the interrogation sequence the most sensitive free-space atom interferometers are several meters high [3], which is incompatible with applications requiring a high-performance portable instrument [4].
The guided atom interferometer, a matter wave analogy of the fiber optic interferometer, is a promising path to the goal of a sensitive compact atom interferometer [5, 6, 7, 8, 9] because the waveguide supports the atoms against gravity during the interferometer sequence. Since the waveguide potential affects the propagation and phase accumulation of the matter wave packets it is essential that it be stable, flat, and smooth. While painted waveguide structures [10] can be flat and smooth, it has not yet been shown that guide potential fluctuations can be made sufficiently small for atom interferometry. In waveguides formed by laser beams [11] or magnetic fields from macroscopic coils [12] the potential can be smooth and, if the potential is symmetric, fluctuations made common mode so that they do not affect the interferometer phase. Potentials made in this way necessarily have some curvature along the waveguide, an imperfection which can reduce the interferometer contrast over time, limiting the usable interrogation time [7, 13]. The longest interrogation time reported to date for a waveguide atom interferometer appears to be 100 ms [7].
We report a guided atom interferometer exhibiting high contrast fringes with an interrogation time of over one second in a waveguide with significant curvature. The waveguide is formed by a loosely focusing 1064 nm beam, and the atom momentum is imparted by Bragg pulses formed by standing waves collinear to the waveguide. Using a non-interacting Bose-Einstein condensate as the matter wave source enables a multiple loop scheme [14, 15, 16, 17] involving hundreds of short round trips in the guide because the contrast-degrading scattering that occurs when the wavepackets pass through each other is suppressed. Thus our results have significantly improved previous demonstration in the number of loop, contrast, and interrogation time [14]. The fast modulation of wavepacket momentum by the high reflection rate implements a form of dynamic decoupling [18] or phase sensitive detection [19] that greatly reduces the effect of technical phase noise in the interferometer, to the point where the instrument operates in a noisy environment with no vibration isolation or stabilization of the inertial reference mirror. The interferometer would be particularly well-suited to measuring rotation through the Sagnac effect [16, 17] and to probing interesting weak interactions [20, 21] on micron-scale distances.
The experimental scheme is shown in Fig. 1. Full details are provided in the Supplemental Material [22]. The interferometer sequence starts with formation of a nearly pure Bose-Einstein condensate (BEC) of 39K in the state near the center of a one-dimensional waveguide with trapping frequencies Hz. The 39K isotope is useful because of a convenient Feshbach resonance [23] that allows a magnetic field to tune the s-wave scattering length through zero [24, 25] and to control the collisional loss [26]. The waveguide potential is a combination of the approximately harmonic transverse optical dipole potential (Hz and Hz) of a 1064 nm laser beam and a harmonic axial magnetic potential (Hz) arising from the residual curvature in the Helmholtz coils that control the interaction strength. An undesirable compressional mode of the BEC along the -axis is induced during the condensate preparation [27, 28]. The interferometer beamsplitters and mirrors are formed by pulses of a 766 nm standing wave, aligned with the waveguide, that impart or change the wavepacket momentum by Bragg diffraction [29, 30, 31]. As shown in Fig. 1(a) and (b), the first splitting pulse transforms the initially stationary condensate into a coherent superposition of two momentum states, , and the subsequent series of mirror pulses each switch the direction of momentum, . The last splitting pulse with adjustable Bragg laser phase recombines the atoms, and the atom numbers in each momentum state () are measured by absorption imaging using a fringe suppression algorithm [32, 33]. The interferometer phase is a linear combination of the Bragg pulse phases seen by the atoms that takes the form of a sum with alternating sign, [34].
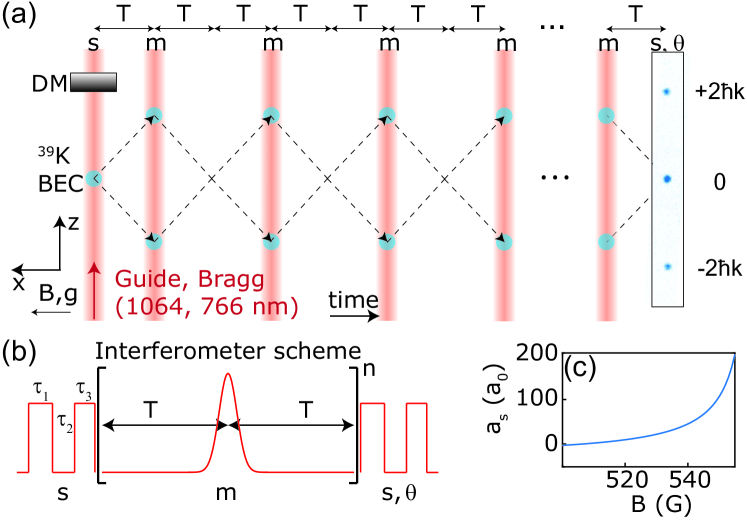
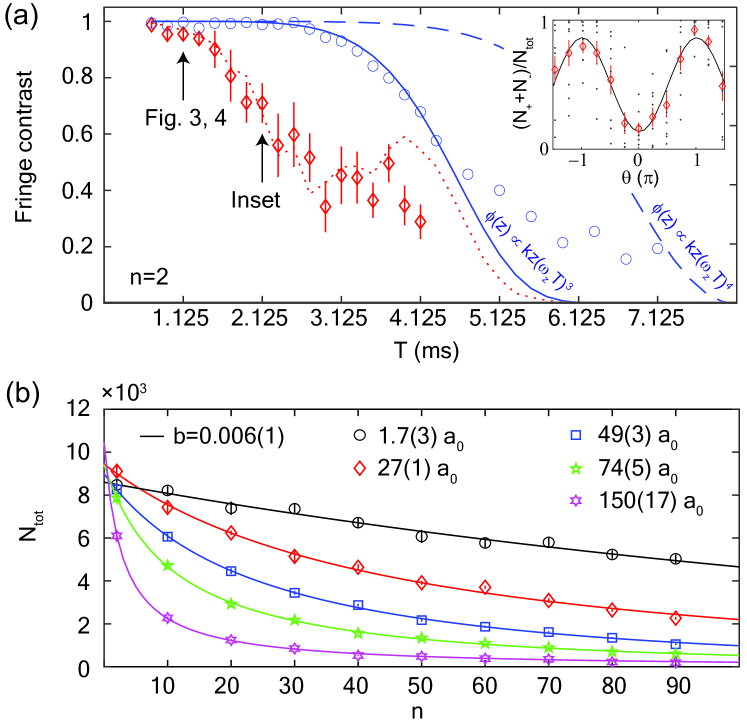
Figure 2(a) illustrates some challenges implicit in waveguide atom interferometry. The inset shows both the raw data for a fringe (gray dots, the fraction of atoms in the momentum state versus the phase of the final Bragg pulse) and the resulting averaged interference fringe (red diamonds and black line). The envelope of the raw data indicates the underlying fringe contrast , which is reduced by technical phase noise to the lower value given by the amplitude of the averaged fringe. Figure 2(a) shows both measures of contrast for a double loop () interferometer as a function of half the reflection pulse separation time . The contrast decreases with increasing for two reasons: the axial curvature in the waveguide potential and the phase noise resulting from mechanical vibrations of the retro-reflecting mirror. The curvature effect is seen in the behavior of the maximum fringe contrast (blue circles), which shows a large reduction in contrast when exceeds a few ms due to the spatial phase gradient over the wave packet (blue lines) [7, 22]: The blue dashed line indicates the degradation of due to the spatial phase gradient that is proportional to , originating from that the atoms lose their momentum when climb up the waveguide while the momentum kick from the Bragg diffraction is constant [7]. In our particular experiment, the BEC wavepacket exhibits a compressional mode that largely fluctuates the wavepacket size over time [28], which further exacerbates the spatial phase gradient to [22]. The shot-to-shot phase fluctuations from mechanical noise further reduce the average fringe contrast (red diamonds). The behavior is in good agreement with a model based on the measured mechanical motion of the reference mirror (red dotted line) [22],
The main result of this paper is that using many reflections with short to confine the atoms near in the center of the guide, rather than a few large amplitude excursions in which the atoms would see more curvature, mitigates the reductions in contrast due to curvature [7] and to vibration-induced phase noise. One of the major concern with this approach is that in general the two wavepackets will lose atoms due to scattering every time they pass through each other. This process is illustrated in Fig. 2(b), where the total atom number is plotted as a function of the number of reflections for various s-wave scattering length . The fitted curves are the analytic solution of the differential equation describing one- and two-body loss. We can associate the coefficient with the loss rate of a mirror pulse because the exponential decay time of stationary atom numbers is longer than s for . The current mirror efficiency can sustain up to loops if the two-body loss rate is sufficiently small. We find that the two-body loss coefficient scales like [22], in agreement with theory [26]. The fitted curve at s-wave scattering length is indistinguishable from the case of zero two-body loss coefficient () [22], showing that the collisional loss can effectively be eliminated by magnetic field control of . We used for the rest of the experiments.
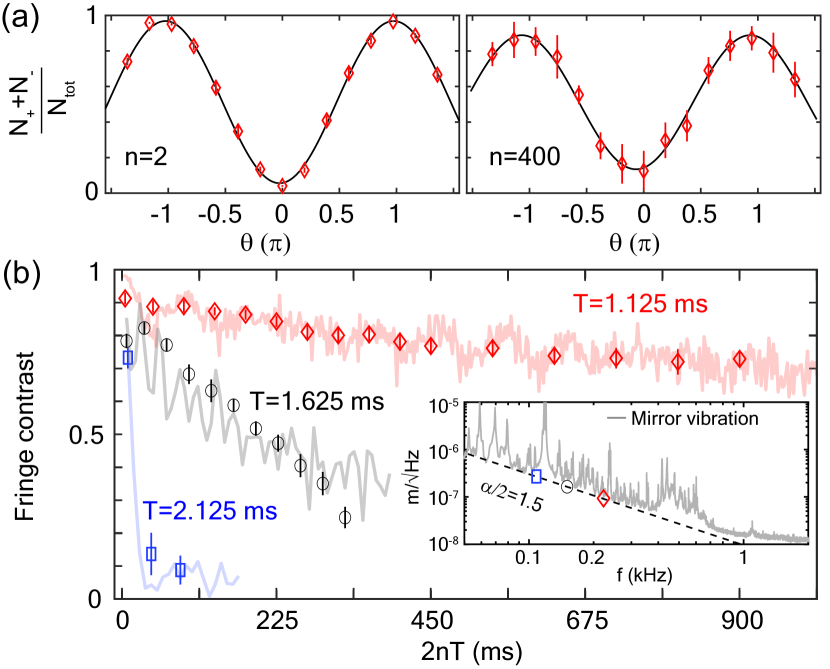
Figure 3(a) compares interferometer fringes corresponding to reflections (one round-trip) and to reflections (200 round-trips) for ms under this condition of negligible scattering loss. We chose to be even because the resulting symmetrical interferometer suppresses effects that would reduce fringe contrast if the number of round trips was odd [7, 22]. We have observed fringes with contrast after an interrogation time ms (Fig. 3(b)), which is an order of magnitude longer than previous waveguide atom interferometers [7, 8, 9]. Moreover, the practical total interrogation time is currently limited by atom loss from the interferometer due to the slightly imperfect mirror reflectivity (black curve in Fig. 2(b)) because the interaction-induced dephasing is much slower than the measured interrogation times for small [24, 35]. A number of round trips (expected interrogation time s) should be possible if the reflection pulse efficiency is improved to by reducing the momentum width of the atoms [29]. That will be possible if the amplitude of the compressional mode is reduced by employing an appropriate loading sequence of the BEC [27]. It is useful to compare our approach to that of Ref. [36] in which a bright soliton () was used to compensate for the wave packet dispersion. Here we can choose a positive because of the compressional mode, which will allow the atom number, and hence the signal, to be larger than is possible for the soliton approach.
It is remarkable that the long interrogation time is obtained without any mechanical noise cancellation or isolation-the optical table supporting the atom interferometer sits on rigid legs standing on the laboratory floor. This noise immunity arises because the form of the interferometer phase as an alternating sign sum of phases leads to an interferometer response to Bragg pulse phase noise which acts as a pass band filter of frequency , similar to lock-in detection [19], suggesting that the system might be useful for noise spectrum analysis [37]. Figure 3(b) shows that the multiple-loop configuration with short improves the available interrogation time by at least two orders of magnitude. The faint bands show the predictions of a model in which the phase of the atom-laser interaction was calculated classically as if the wave packet was a point particle [22, 34]. It is in good agreement with the experimental data. We observed that the fringe contrast at fixed dropped rapidly with increasing [Fig. 3(b)]. We found that the phase noise scales as for [22] and that the noise slope at the region is steep enough to wash out the fringe (see inset of Fig. 3(b)). This result shows that the multiple-loop scheme outperforms the single loop approach in an environment where the noise power spectral density scales like when .
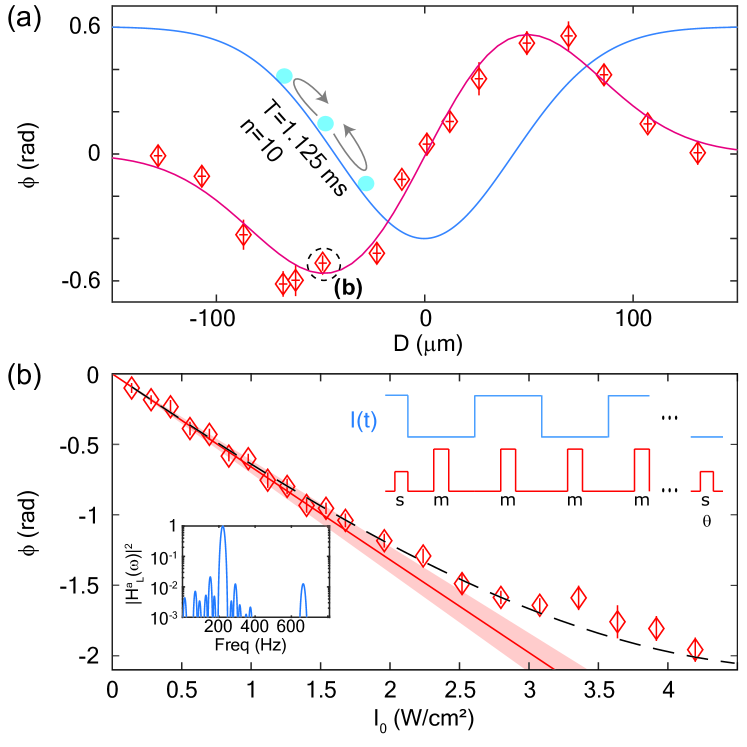
We have used the lock-in like response of the multiple-loop atom interferometer to measure the AC Stark shift [38] produced by a 1064 nm Gaussian beam of waist m and maximum intensity overlapping the waveguide and propagating perpendicular to it (Fig. 4). This application highlights another advantage of the multiple-loop approach for measuring localized interactions, namely that the atoms can accumulate phase shifts from the interaction many times during the total interrogation time, thereby boosting the sensitivity. The on/off state of the AC Stark shift beam is switched every time the wavepackets cross in the center of the waveguide (upper-right inset of Fig. 4(b)). This synchronous signal modulation results in the highest sensitivity as the interferometer coherently accumulates the extra phase shift from the interaction [22]. The red line in Fig. 4(b) is a fit of the data up to (see caption). Whereas the black dashed line is a fit including the drag effect of the attractive 1064 nm potential; higher the intensity, the atoms are pulled into the intensity maximum and acumulates less phase. From this fit we find a value for the ground state polarizability of atomic units, which is in good agreement with the reference value atomic units [39]. The multiple-loop phase-sensitive atom interferometer would be ideal for measuring interactions of the wavepackets with a localized source in which the size is comparable to or smaller than the atom separation, since the phase could accumulate coherently as the wavepackets make multiple trips past the source, becoming times the single-loop phase shift after round trips.
In addition to the possibility of phase-sensitive detection, the multiple-loop approach might offer better signal-to-noise ratio than that of a single loop in situations where mechanical vibrations transmitted to the retro-reflecting mirror create significant phase noise. An important application of the multiple-loop scheme is the case of a Sagnac atom interferometer realized by moving the waveguide in a horizontal plane transversely back and forth synchronous with the reflection pulse sequence so that the wavepacket trajectories enclose area [40] or by using a closed loop waveguide [10, 41, 42]. The enclosed area and hence the Sagnac phase is proportional to the number of loops, amplifying the signal without increasing the physical size of the interferometer.
Looking to the future, we believe that ms is feasible for a moderate waveguide beam waist (m) with active vibration reduction and removal of waveguide curvature . It will be possible to reduce by optimizing the magnetic coil geometry and reducing the field to G to exploit another Feshbach resonance where and kHz/G for 39K [23]. Strontium atoms are also a good choice for atom interferometry since they have small and zero magnetic moment [6]. The instrument that does not require large B field is also practical to use outside of the laboratory, combined with the noise-immune characteristic of the multiple-loop scheme. If the mirror pulse efficiency is optimized to , an interrogation time of s should be possible. To the optimistic projection of rotation sensitivity based off of our previous demonstration of moving waveguide Sagnac interferometer in which the sensitivity was at [40], our multiple-loop scheme might envision at within a scale, in which the sensitivity was only available for a meter scale baseline [43].
We have demonstrated multiple-loop atom interferometry in a waveguide. Collisional loss is suppressed deploying a magnetic Feshbach resonance, reducing the -wave scattering length close to zero. The interrogation times are extended by two orders of magnitude from the single-loop limit set by the waveguide curvature and technical noise. We have also demonstrated quantum lock-in amplification [19]. The system may be useful for multiple-loop Sagnac interferometry [16], for noise spectrum analysis [37] and, perhaps, for resonant detection of gravitational waves [44].
Acknowledgments
We would like to acknowledge Saurabh Pandey for useful comments, Doga Kurkcuoglu for theoretical help, Nick Dallmann for the loan of a network analyzer, and Carlo Samson for work on the design and construction of the apparatus.
This work was supported by the U.S. Department of Energy through awards 20180045DR and 20180753PRD3 of the LANL Laboratory Directed Research and Development program.
∗E-mail: khs89p@gmail.com
‡E-mail: boshier@lanl.gov
†Current address: Atom Computing, Inc., Boulder, Colorado 80301, USA
References
- Bongs et al. [2019] K. Bongs, M. Holynski, J. Vovrosh, P. Bouyer, G. Condon, E. Rasel, C. Schubert, W. P. Schleich, and A. Roura, Taking atom interferometric quantum sensors from the laboratory to real-world applications, Nature Reviews Physics 1, 731 (2019).
- Cronin et al. [2009] A. D. Cronin, J. Schmiedmayer, and D. E. Pritchard, Optics and interferometry with atoms and molecules, Reviews of Modern Physics 81, 1051 (2009).
- Asenbaum et al. [2017] P. Asenbaum, C. Overstreet, T. Kovachy, D. D. Brown, J. M. Hogan, and M. A. Kasevich, Phase shift in an atom interferometer due to spacetime curvature across its wave function, Physical Review Letters 118, 183602 (2017).
- Wu et al. [2019] X. Wu, Z. Pagel, B. S. Malek, T. H. Nguyen, F. Zi, D. S. Scheirer, and H. Müller, Gravity surveys using a mobile atom interferometer, Science Advances 5, eaax0800 (2019).
- Xu et al. [2019] V. Xu, M. Jaffe, C. D. Panda, S. L. Kristensen, L. W. Clark, and H. Müller, Probing gravity by holding atoms for 20 seconds, Science 366, 745 (2019).
- Zhang et al. [2016] X. Zhang, R. P. del Aguila, T. Mazzoni, N. Poli, and G. M. Tino, Trapped-atom interferometer with ultracold Sr atoms, Physical Review A 94, 043608 (2016).
- Burke et al. [2008] J. H. T. Burke, B. Deissler, K. J. Hughes, and C. A. Sackett, Confinement effects in a guided-wave atom interferometer with millimeter-scale arm separation, Physical Review A 78, 023619 (2008).
- Jo et al. [2007] G. B. Jo, Y. Shin, S. Will, T. A. Pasquini, M. Saba, W. Ketterle, D. E. Pritchard, M. Vengalattore, and M. Prentiss, Long phase coherence time and number squeezing of two Bose-Einstein condensates on an atom chip, Physical Review Letters 98, 030407 (2007).
- Wang et al. [2005] Y.-J. Wang, D. Z. Anderson, V. M. Bright, E. A. Cornell, Q. Diot, T. Kishimoto, M. Prentiss, R. A. Saravanan, S. R. Segal, and S. Wu, Atom Michelson interferometer on a chip using a Bose-Einstein condensate, Physical Review Letters 94, 090405 (2005).
- Ryu and Boshier [2015] C. Ryu and M. G. Boshier, Integrated coherent matter wave circuits, New Journal of Physics 17, 092002 (2015).
- McDonald et al. [2013] G. D. McDonald, H. Keal, P. A. Altin, J. E. Debs, S. Bennetts, C. C. N. Kuhn, K. S. Hardman, M. T. Johnsson, J. D. Close, and N. P. Robins, Optically guided linear Mach-Zehnder atom interferometer, Physical Review A 87, 013632 (2013).
- Garcia et al. [2006] O. Garcia, B. Deissler, K. J. Hughes, J. M. Reeves, and C. A. Sackett, Bose-Einstein-condensate interferometer with macroscopic arm separation, Physical Review A 74, 031601 (2006).
- Leonard and Sackett [2012] R. H. Leonard and C. A. Sackett, Effect of trap anharmonicity on a free-oscillation atom interferometer, Physical Review A 86, 043613 (2012).
- Jaffe et al. [2018] M. Jaffe, V. Xu, P. Haslinger, H. Müller, and P. Hamilton, Efficient adiabatic spin-dependent kicks in an atom interferometer, Physical Review Letters 121 (2018).
- McGuirk et al. [2002] J. M. McGuirk, G. T. Foster, J. B. Fixler, M. J. Snadden, and M. A. Kasevich, Sensitive absolute-gravity gradiometry using atom interferometry, Physical Review A 65, 033608 (2002).
- Schubert et al. [2021] C. Schubert, S. Abend, M. Gersemann, M. Gebbe, D. Schlippert, P. Berg, and E. M. Rasel, Multi-loop atomic Sagnac interferometry, Scientific Reports 11, 16121 (2021).
- Sidorenkov et al. [2020] L. A. Sidorenkov, R. Gautier, M. Altorio, R. Geiger, and A. Landragin, Tailoring multiloop atom interferometers with adjustable momentum transfer, Physical Review Letters 125, 213201 (2020).
- Hahn [1950] E. L. Hahn, Spin echoes, Physical Review 80, 580 (1950).
- Kotler et al. [2011] S. Kotler, N. Akerman, Y. Glickman, A. Keselman, and R. Ozeri, Single-ion quantum lock-in amplifier, Nature 473, 61 (2011).
- Jaffe et al. [2017] M. Jaffe, P. Haslinger, V. Xu, P. Hamilton, A. Upadhye, B. Elder, J. Khoury, and H. Müller, Testing sub-gravitational forces on atoms from a miniature in-vacuum source mass, Nature Physics 13, 938 (2017).
- Haslinger et al. [2018] P. Haslinger, M. Jaffe, V. Xu, O. Schwartz, M. Sonnleitner, M. Ritsch-Marte, H. Ritsch, and H. Müller, Attractive force on atoms due to blackbody radiation, Nature Physics 14, 257 (2018).
- [22] The Supplemental Material provides details of the experimental system and the interferometer sequence, along with a discussion of mechanisms that cause phase noise and that reduce the fringe contrast. It also presents the data and analysis for the study of cold collisions, and it provides additional information on the quantum lock-in amplification demonstration.
- D’Errico et al. [2007] C. D’Errico, M. Zaccanti, M. Fattori, G. Roati, M. Inguscio, G. Modugno, and A. Simoni, Feshbach resonances in ultracold , New Journal of Physics 9, 223 (2007).
- Fattori et al. [2008] M. Fattori, C. D’Errico, G. Roati, M. Zaccanti, M. Jona-Lasinio, M. Modugno, M. Inguscio, and G. Modugno, Atom interferometry with a weakly interacting Bose-Einstein condensate, Physical Review Letters 100, 080405 (2008).
- Roati et al. [2007] G. Roati, M. Zaccanti, C. D’Errico, J. Catani, M. Modugno, A. Simoni, M. Inguscio, and G. Modugno, Bose-Einstein condensate with tunable interactions, Physical Review Letters 99, 010403 (2007).
- Band et al. [2000] Y. B. Band, M. Trippenbach, J. P. Burke, and P. S. Julienne, Elastic scattering loss of atoms from colliding Bose-Einstein condensate wave packets, Physical Review Letters 84, 5462 (2000).
- Di Carli et al. [2019] A. Di Carli, C. D. Colquhoun, G. Henderson, S. Flannigan, G.-L. Oppo, A. J. Daley, S. Kuhr, and E. Haller, Excitation modes of bright matter-wave solitons, Physical Review Letters 123, 123602 (2019).
- Haller et al. [2009] E. Haller, M. Gustavsson, M. J. Mark, J. G. Danzl, R. Hart, G. Pupillo, and H.-C. Nägerl, Realization of an excited, strongly correlated quantum gas phase, Science 325, 1224 (2009).
- Szigeti et al. [2012] S. S. Szigeti, J. E. Debs, J. J. Hope, N. P. Robins, and J. D. Close, Why momentum width matters for atom interferometry with Bragg pulses, New Journal of Physics 14, 023009 (2012).
- Müller et al. [2008] H. Müller, S.-w. Chiow, and S. Chu, Atom-wave diffraction between the raman-nath and the Bragg regime: Effective Rabi frequency, losses, and phase shifts, Physical Review A 77, 023609 (2008).
- Wu et al. [2005] S. Wu, Y.-J. Wang, Q. Diot, and M. Prentiss, Splitting matter waves using an optimized standing-wave light-pulse sequence, Physical Review A 71, 043602 (2005).
- Niu et al. [2018] L. Niu, X. Guo, Y. Zhan, X. Chen, W. M. Liu, and X. Zhou, Optimized fringe removal algorithm for absorption images, Applied Physics Letters 113, 144103 (2018).
- Ockeloen et al. [2010] C. F. Ockeloen, A. F. Tauschinsky, R. J. C. Spreeuw, and S. Whitlock, Detection of small atom numbers through image processing, Physical Review A 82, 061606 (2010).
- Peters et al. [2001] A. Peters, K. Y. Chung, and S. Chu, High-precision gravity measurements using atom interferometry, Metrologia 38, 25 (2001).
- Gustavsson et al. [2008] M. Gustavsson, E. Haller, M. J. Mark, J. G. Danzl, G. Rojas-Kopeinig, and H. C. Nägerl, Control of interaction-induced dephasing of bloch oscillations, Physical Review Letters 100, 080404 (2008).
- McDonald et al. [2014] G. D. McDonald, C. C. N. Kuhn, K. S. Hardman, S. Bennetts, P. J. Everitt, P. A. Altin, J. E. Debs, J. D. Close, and N. P. Robins, Bright solitonic matter-wave interferometer, Physical Review Letters 113, 013002 (2014).
- Yuge et al. [2011] T. Yuge, S. Sasaki, and Y. Hirayama, Measurement of the noise spectrum using a multiple-pulse sequence, Physical Review Letters 107, 170504 (2011).
- Deissler et al. [2008] B. Deissler, K. J. Hughes, J. H. T. Burke, and C. A. Sackett, Measurement of the ac Stark shift with a guided matter-wave interferometer, Physical Review A 77, 031604 (2008).
- Parinaz et al. [2021] B. Parinaz, M. Adam, A. Bindiya, E. Rudolf, and S. S. Marianna, Portal for high-precision atomic data and computation (version 1.0) (2021).
- Krzyzanowska et al. [2022] K. Krzyzanowska, J. Ferreras, C. Ryu, C. Samson, and M. Boshier, Matter wave analog of a fiber optic gyro, arXiv:2201.12461 [physics.atom-ph] (2022).
- Pandey et al. [2019] S. Pandey, H. Mas, G. Drougakis, P. Thekkeppatt, V. Bolpasi, G. Vasilakis, K. Poulios, and W. von Klitzing, Hypersonic Bose–Einstein condensates in accelerator rings, Nature 570, 205 (2019).
- Moan et al. [2020] E. R. Moan, R. A. Horne, T. Arpornthip, Z. Luo, A. J. Fallon, S. J. Berl, and C. A. Sackett, Quantum rotation sensing with dual Sagnac interferometers in an atom-optical waveguide, Physical Review Letters 124, 120403 (2020).
- Savoie et al. [2018] D. Savoie, M. Altorio, B. Fang, L. A. Sidorenkov, R. Geiger, and A. Landragin, Interleaved atom interferometry for high-sensitivity inertial measurements, Science Advances 4, eaau7948 (2018).
- Graham et al. [2016] P. W. Graham, J. M. Hogan, M. A. Kasevich, and S. Rajendran, Resonant mode for gravitational wave detectors based on atom interferometry, Physical Review D 94, 104022 (2016).
- Landini et al. [2012] M. Landini, S. Roy, G. Roati, A. Simoni, M. Inguscio, G. Modugno, and M. Fattori, Direct evaporative cooling of atoms to Bose-Einstein condensation, Physical Review A 86, 033421 (2012).
- Salomon et al. [2013] G. Salomon, L. Fouché, P. Wang, A. Aspect, P. Bouyer, and T. Bourdel, Gray-molasses cooling of to a high phase-space density, EPL (Europhysics Letters) 104, 63002 (2013).
- Couvert et al. [2008] A. Couvert, T. Kawalec, G. Reinaudi, and D. Guéry-Odelin, Optimal transport of ultracold atoms in the non-adiabatic regime, EPL (Europhysics Letters) 83, 13001 (2008).
- Gross et al. [2016] C. Gross, H. C. J. Gan, and K. Dieckmann, All-optical production and transport of a large quantum gas in a crossed optical dipole trap, Physical Review A 93, 053424 (2016).
- Stamper-Kurn et al. [1998] D. M. Stamper-Kurn, H. J. Miesner, A. P. Chikkatur, S. Inouye, J. Stenger, and W. Ketterle, Reversible formation of a Bose-Einstein condensate, Physical Review Letters 81, 2194 (1998).
- Pinkse et al. [1997] P. W. H. Pinkse, A. Mosk, M. Weidemüller, M. W. Reynolds, T. W. Hijmans, and J. T. M. Walraven, Adiabatically changing the phase-space density of a trapped Bose gas, Physical Review Letters 78, 990 (1997).
- O’Hara et al. [2001] K. M. O’Hara, M. E. Gehm, S. R. Granade, and J. E. Thomas, Scaling laws for evaporative cooling in time-dependent optical traps, Physical Review A 64, 051403 (2001).
- Crosser et al. [2010] M. S. Crosser, S. Scott, A. Clark, and P. M. Wilt, On the magnetic field near the center of Helmholtz coils, Review of Scientific Instruments 81, 084701 (2010).
Supplemental Material
Supplemental Material
I BEC preparation
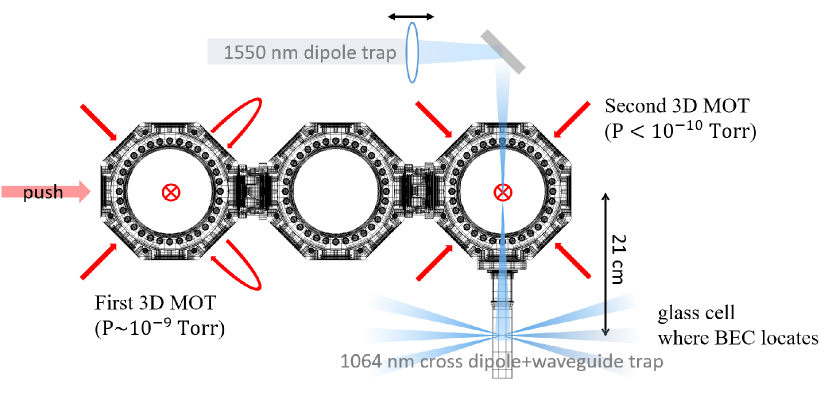
Preparation of nearly pure BEC for the experiment discussed in this paper is achieved in three stages. As shown in Fig. S1, the apparatus consists of two vacuum chambers plus a glass cell where the BEC is prepared. The first stage takes place in a relatively high pressure chamber where 39K cold atoms are continuously loaded into a 3D 2-line magneto-optical trap (MOT) from a vapor provided by commercial getter sources. This high pressure chamber is separated from the rest of the system by a constriction and an empty chamber with an ion pump, enabling differential pumping. Simultaneously, a near-resonance push beam (2 cooling plus repumping light) overlapped with the high pressure MOT continuously pushes atoms towards the second MOT in the low pressure chamber. Atoms are collected in the low pressure MOT for about 5 s, with a loading rate atoms/s.
Once the atomic cloud is formed in the low pressure chamber, the push beam is blocked and the second stage of the preparation begins. It starts with ms 2 compression with field gradient G/cm [45], followed by ms of 1-2 hybrid compression. At this stage the peak density of the atomic cloud is atoms/cm3 with K temperature. Next, the temperature is reduced to K using 1 gray molasses technique with the magnetic field gradient set to near zero for ms [46]. The atoms are optically pumped into the manifold by turning off the 1 repump light for the last ms of gray molasses. The resulting atoms are then captured in a magnetic trap by turning on the MOT anti-Helmholtz coils at a gradient of G/cm which is then ramped linearly to G/cm over ms. Confinement in a tight magnetic trap provides the time needed to overlap a dipole trap beam with the atomic cloud for about 2 s and load a sufficiently high fraction of atoms into the beam.
The dipole trap beam is a 1550 nm single mode laser (IPG photonics, ELR-LP-SF-30) with a total power 20 W and active power stabilization. The beam is focused by a singlet lens with mm and delivered to the low pressure chamber, providing K trap depth and Hz axial trap frequency. Importantly, the dipole trap is slightly displaced from the center of the magnetic trap to hold the spin polarized atoms. Once the dipole trap is loaded from the magnetic trap, the magnetic field is turned off. A typical atom number density and temperature in the dipole trap obtained at this point are and K respectively.
In the final stage of the preparation, the atoms are transferred to the science cell by translating the lens on a linear motor stage (Newport, XML350) at a distance mm during a ms trajectory [47, 48]. The velocity profile of the translation stage has isosceles trapezoid shape of maximum velocity mm/s and acceleration mm/s2. The transfer efficiency is close to without any discernable heating. The transfer time had to be increased to a few seconds recently because wear in the stage after a million transport cycles increased vibration during transport. The Earth’s magnetic field maintains the spin polarization during the transfer. Light-assisted inelastic loss is negligible during the transfer because the trap depth is near the Ramsauer minimum [45].
The transition from thermal cloud to a BEC takes place in the science cell. An additional set of 1064 nm beams is overlapped with the atomic cloud held in 1550 nm dipole trap, as shown in Fig. S1. The s-wave scattering length is set to by the magnetic Feshbach resonance at G [23], and the power of the 1550 nm dipole trap is reduced for s to load the atoms into the 1064 nm cross-dipole trap by the dimple effect [49, 50]. For the next ms an adiabatic compression is applied in the 1064 nm beams by increasing the power by factor of 2 and setting the s-wave scattering length to near zero. Finally, a 5 s step of forced evaporative cooling takes place, when the scattering length is set to and the beams’ intensity is ramped [51] to a final trap frequency Hz.
Next, as shown in Fig. S1, the outer two 1064 nm beams in the crossed dipole trap are slowly turned off, transferring the BEC with minimal excitation to the middle (-axis in Fig. 1) 1064 nm trapping beam which forms the waveguide. The z-axis harmonic potential () is almost entirely due to the inhomogeneity of the field produced by the Helmholtz coils [52]; the 0.3 Hz axial trapping frequency of the guide is negligible. The mismatch in waveguide and trapping potentials excites both center-of-mass motion and a compressional mode (discussed below), but importantly the wavepacket does not disperse during the interferometer interrogation time. Finally, the s-wave scattering length is then set to a desired value by linearly sweeping the magnetic field for ms. The typical BEC preparation time to this point is about 20 s.
II Interferometer sequence
The momentum state of the BEC is manipulated using Bragg scattering from a standing wave of light formed by a 766.5 nm external cavity diode laser detuned 100 GHz blue of the 2 line and delivered to the interaction region with a polarization-maintaining optical fiber and switched with an acousto-optic modulator. The standing wave is created by retro-reflection from a dichroic mirror (Fig. 1(a)) of a beam with waist () at the atoms of m to prevent interference from overlap of internal reflections from the surfaces of the uncoated glass cell. Sub-ms pulses of the standing wave grating impart momentum kicks, where is the wave-vector of the Bragg laser [29, 30, 31]. As shown in Fig. 1(b), a double square pulse [31] acts as a beamsplitter that transforms the initially stationary atoms into a coherent superposition of two momentum states, . Subsequent gaussian pulses [30] act as mirrors, reversing the momentum of the wavepackets, . At the end of the cycle a second beamsplitter pulse with adjustable laser phase relative to the previous pulses recombines the atoms into a superposition of the two output ports of the interferometer. The waveguide and the magnetic field are then turned off, and the atom numbers in each of the momentum states () are measured by absorption imaging after ms of free expansion. Background noise in the absorption images is reduced with a fringe suppression algorithm [33, 32]. We note that the low spontaneous scattering rate of photons from the Bragg laser ( 0.03 Hz) means that process has negligible effect on the interferometer.
The relative phase of the recombination pulse is tuned by changing the frequency of Bragg laser () using its built-in piezo-electric tuning element. The resulting phase shift is , where is the distance from the mirror to the atoms and is the speed of light. In our system where 0.4 m, a frequency shift 100 MHz is enough to change by . The intensity and frequency of the Bragg laser are not actively stabilized. Nor are the position and tilt of the retro-reflector.
III BEC dynamics during the interferometer sequence
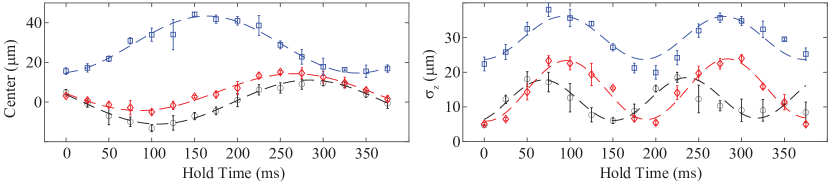
The transfer of the BEC from the crossed-dipole trap to the waveguide beam is designed to be adiabatic. However, imperfections in the system induce a center-of-mass oscillation and excite a compressional mode of the BEC. The resulting dynamics are shown in Fig. S2, where the center-of-mass position (left) and the axial width (right) of BEC are plotted as a function of the hold time in the waveguide. The compressional mode frequency and the axial trap frequency Hz are found from sinusoidal fits for scattering lengths respectively.The axial trap frequency of the guide (0.3 Hz) is negligible; it is the z-axis harmonic potential (Hz) from the inhomogeneity of the Helmholtz coils [52] which induces the compressional mode [27, 28].
The initial center-of-mass momentum can be estimated as , where is the amplitude of the sinusoidal fit. The initial momentum depends on the details of the final steps in the preparation sequence, namely the end of the evaporation and the loading into the waveguide. The center-of-mass position changes as a function of the final s-wave scattering length because the potential minimum moves when the magnetic trap depth is reduced. Since the the BEC is located near the waveguide beam waist, by comparing the minimum position of the combined potential to the measured center-of-mass position for various , we can estimate that the tilt angle between the normal of the waveguide and the gravity direction is mrad.
The implications for the interferometer sequence are as follows. The estimated tilt, which is (), does not affect the phase of the atom interferometer for as long as the magnetic field is static. The excursion of each wavepacket (m at ms) is longer than the wavepacket size m determined by a Gaussian density fit (The wavepacket size is time-dependent due to the compressional mode). Therefore the wave packets are well-separated from each other during the interferometer cycle. Finally, the ratio of compressional mode frequency and the axial trap frequency for the three scattering lengths shows that our system lies between the non-interacting and 1D Thomas-Fermi regimes [27, 28].
IV Phase noise due to retro-reflecting mirror vibration
The interferometer phase () and the phase fluctuation due to technical noise () in shot are given by
| (S1) |
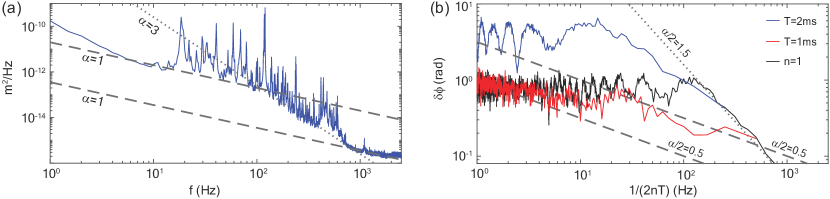
where and are respectively the center-of-mass position of the atoms and the displacement of the reference mirror when the -th pulse hits. Here, is the wavevector of the Bragg light. Note that the -th and -th pulses are splitting pulses. To find , we used a 4-th order Runge-Kutta method to numerically calculate the trajectory of the atoms using including the known guide potential and assuming that the photon momentum transfer is instantaneous. To obtain , we independently measured the reference mirror vibration with an optical Michelson interferometer. The resulting noise amplitude spectrum is shown in the inset of Fig. 3(b) with a fit to the function . For the numerical estimation of the shot-to-shot phase noise , is randomly sampled from the time series of the Michelson interferometer data.
V Noise spectrum and phase noise
The main sources of reference mirror vibration are the flow of cooling water inside the magnetic field coils and movement of the floor supporting the optical table. Note that the mirror vibration measured by the optical Michelson interferometer is re-scaled by to fit the experimental data in Fig. 3(b). In this section, we focus on the reference mirror vibration-induced phase noise and its relation to the noise spectrum. From Eq. (S1), the average laser phase fluctuation becomes
| (S2) |
when the displacement of the reference mirror is assumed to be a random walk-type fluctuation. Note that because the displacement at the start of the cycle is taken to be zero. If is Markovian noise with spectrum , the average value can be deduced. In the case of a multiple-loop interferometer with parameters and , Eq. (S2) becomes for . The corresponding result for a single-loop interferometer with the same interrogation time is . Consequently in the case and the phase noise of the multiple-loop scheme can be smaller than that of the single-loop scheme, as seen in Fig. S3(b) by comparing the red and black curves.
The phase noise calculated using Eq. (S1) applied to the optical interferometer data for ms (red curve in Fig. S3(b)) has scaling exponent close to around Hz, and it shows good agreement with the scaling of from Eq. (S2). The phase noise for (black line) has scaling exponent close to around Hz, which resembles the slope of the noise density in Fig. S3(a) and agrees with Eq. (S2). The phase noise for ms (blue line) also has a similar slope, which explains the rapid loss of the contrast in Fig. 3(b).
The signal-to-noise ratio (SNR) scales as for a single-loop scheme measuring a constant uniform acceleration , when is the dominant noise. The SNR for a multiple-loop scheme measuring a square-modulated acceleration scales as . Therefore the multiple-loop scheme has better SNR when the slope of the phase noise satisfies .
VI Numerical simulation of fringe contrast
Equation (S1) treats the atoms as classical point-like particles. For a more complete simulation using finite size wave packet, the maximum fringe contrast is , where is the probability distribution of combined wavepacket and is the axial position dependent phase from Eq. (S1). The averaged fringe contrast is . Note that for and , which is an inhomogeneous dephasing imprinted along the wave packet due to the axial curvature of the potential. Note that if is even then the inhomogeneous dephasing terms cancel to zero, leaving the next highest order contribution as the leading term. Eq. 26 in Reference [7] has shown that the next order is , which agrees with our numerical estimation of , where is the phase from the classical action [21]; the second order term comes from the energy loss when the atoms climb up the potential while the momentum kicks are always constant.
The blue dashed line in Fig. 2(a) is calculated for , where , , and m is the average size over the hold time. The center-of-mass shift due to the potential curvature is numerically found to be , which is negligible compared to . When the time-varying due to the compressional mode of the BEC is considered, , becoming effectively proportional to as the inhomogeneous dephasing for is only partially canceled out. The blue solid line in Fig. 3(a) takes this into account and shows good agreement with our experiment.
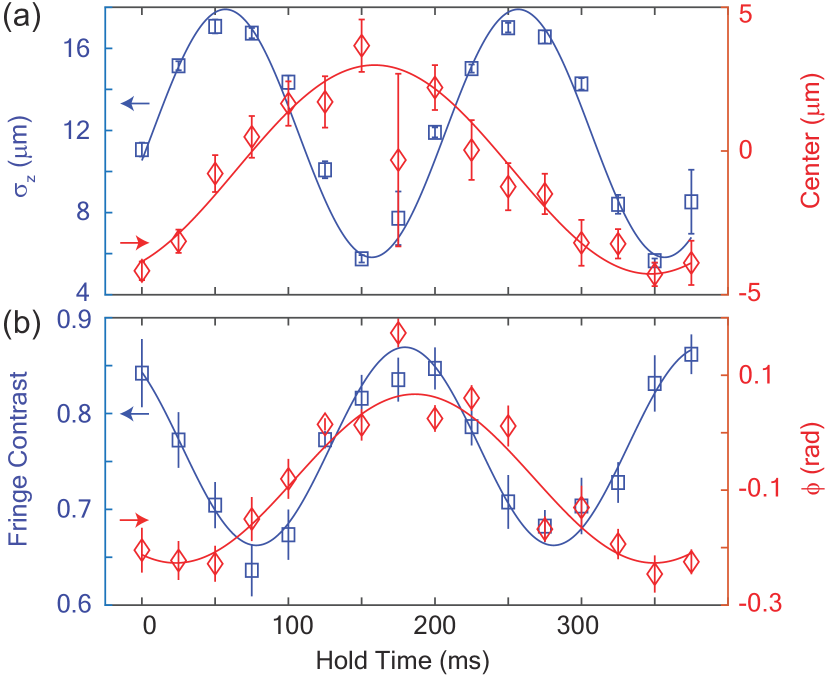
VII n=1 and n=2 interferometer
Fig. S4 shows for the axial width and center-of-mass position (a), and the fringe contrast and phase (b). The amplitude of the phase shift calculated from the center-of-mass oscillation is rad, where and m. The result shows good agreement with the actual interferometer phase measurement rad (red points in Fig. S4(b)). The interferometer phase offset from might be attributable to the asymmetry of the combined waveguide and magnetic potential.
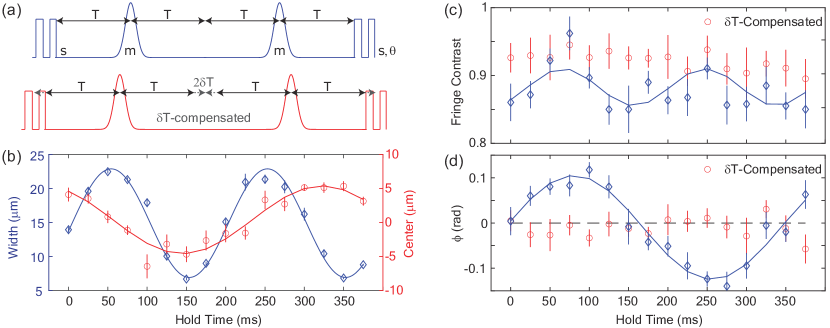
The measured fringe contrast (blue points in Fig. S4(b)) is out-of-phase with the oscillation of the compressional mode (blue points in Fig. S4(a)) as the inhomogeneous dephasing exacerbates the fringe contrast degradation for larger wavepacket size. The wavepacket does not perfectly overlap after the interrogation due to the potential curvature. However, the non-overlapped portion is less than a few percent compared to the wavepacket size for .
Figure S5 presents the corresponding set of data for , ms, . In the case of , the inhomogeneous dephasing and DC acceleration sensitivity for are canceled out by the conjugate path. We observed the modulation of fringe contrast and momentum dependent phase shift (blue diamonds in Fig. S5(c) and (d), respectively) when the pulse time interval did not compensate for the finite length of the splitting pulses (the first scheme in Fig. S5(a)). This effect can be clarified by solving the Schrödinger equation,
| (S3) |
where . Expanding the wave function in the Bloch basis and substituting it in Eq. (S3) gives
| (S4) |
After taking the initial condition to be atoms at rest and assuming a perturbative regime in which and , where is a narrow () momentum distribution centered at and , Eq. (S4) is truncated to the lowest 3 states,
| (S5) |
Note that the kinetic energy associated with has been subtracted by a unitary transformation. Eq. (S5) is numerically solved with an appropriate potential shape as in Fig. S5(a). In Eq. (S5) is the relative phase between the recombination and the splitting pulses, so is set to for all the pulses except the recombination pulse. The initial center-of-mass momentum in Eq. (S5) can cause a phase shift between the left and right atoms at the time of recombination. This happens when the amount of time the atoms spent in the bases and are not equal. The timing compensation s determined numerically was found experimentally to optimize the fringe contrast and to flatten the momentum-dependent phase shift as in Fig S5(c) and (d). Note that the compensation is valid until , which is larger than the initial momentum of our BEC () induced by the loading process.
VIII Scaling behavior of cold collisions
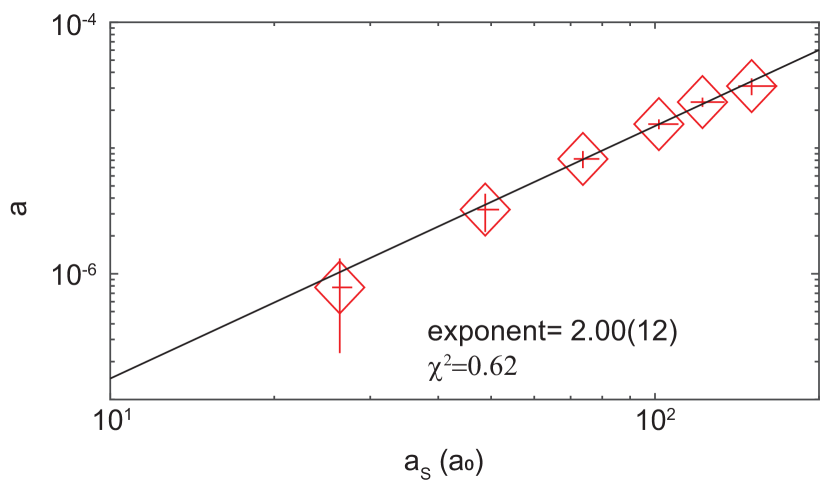
The multiple-loop atom interferometer suffers from cold collision-induced atom loss [26] that can usually be neglected for a small number of loops. As shown in Fig. 1(a), the atomic wave packets pass through each other once for every mirror pulse, and so the chance of a collision scattering an atom out of the coherent wave packet is times larger than the single reflection scheme. It results in a collisional loss that scales as , where , and are the atom number, the number of collisions, and the s-wave scattering length, respectively. As shown in Fig. 2(b), we measured the atom number as a function of collision number for various s-wave scattering lengths. The fitted curves are the analytic solution of the differential equation , which is , where is a constant related to the initial atom number and is treated as a continuous variable for simplicity. The results of the least square fits are listed in Table 1. From the results, the two-body loss coefficient vs. s-wave scattering length is plotted in log-log scale in Fig. S6 and the scaling exponent is extracted as . Note that the first two data points are not shown on the plot. We found that over the wide range of s-wave scattering length fringe contrast remained flat with regardless of , as long as atom numbers were well above the detection noise. However, we emphasize that tuning the s-wave scattering length to near zero is of essential to obtain atomic signal for larger number of loop (c.f. Fig. 2(b)). That result suggests that dephasing from the interatomic interaction is negligible compared to the collisional loss for our interrogation time-scales and atomic density once the s-wave scattering length is set to near zero. Note that the initial mean atomic density at is estimated as , depending on the initial loading condition.
The mirror pulse efficiency has the highest value at , and gradually reduces at larger because of the enlarged interaction-induced momentum width [16, 24, 25]. Note that the initial center-of-mass momentum also degrades the mirror efficiency but the theoretical upper bound for our case is , which is negligible degradation. However, the momentum width from the compressional mode currently limits the mirror efficiency to . An atom number remains after reflections with the current mirror efficiency, which is comparable to the atom and photon shot noise of atoms.
| 1.7 | 0.0065(5) | 2160(163) | 8.36 | |
|---|---|---|---|---|
| 14.0 | 0.0106(3) | 1290(42) | 4.97 | |
| 26.4 | 0.0127(24) | 1020(186) | 9.11 | |
| 48.8 | 0.0151(15) | 811(77) | 7.57 | |
| 73.7 | 0.0154(13) | 751(58) | 5.34 | |
| 102.0 | 0.0143(13) | 741(62) | 6.10 | |
| 150.4 | 0.0161(23) | 640(88) | 14.6 |
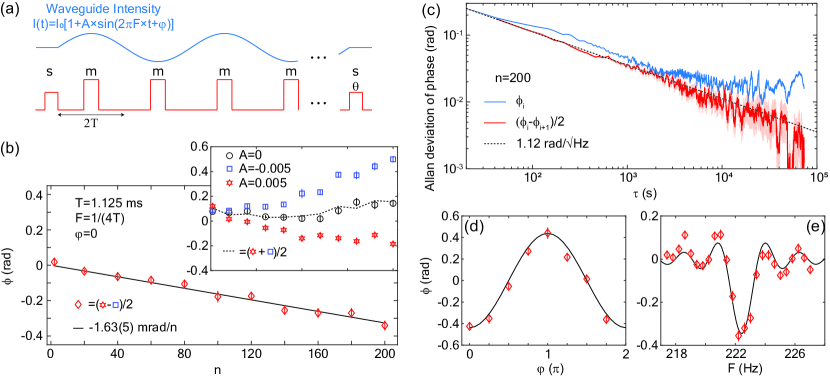
IX Quantum lock-in amplification of atom interferometer
The multiple-round trip scheme allows for phase-synchronous measurement of a suitably-modulated perturbation, a realization of quantum lock-in amplification [19]. To make a proof-of-principle demonstration of this capability, the waveguide intensity was modulated as . Note that since the initial atom position is displaced from the waveguide waist position, the waveguide beam intensity modulation induces a modulated acceleration . The laser phase is for , and . From the data of Fig. S7(b), we estimated . Note that the odd-parity operation of successive shots of alternating (i.e. differential average) mitigates the systematic phase shift. We estimate the beam waist displacement that satisfies , where , K, m, and nm. The beam waist location is estimated as mm away from the atom position, which is smaller than the Rayleigh length mm.
Figure S7(c) shows the Allan deviations of the raw phase and the odd-parity phase, respectively. The odd-parity operation improves long-term stability as the systematic phases were canceled out. The black dotted line consists of atom and photon shot noise, and mirror vibration and laser phase noise.