Identifying Blue Large Amplitude Pulsators from Gaia DR2 & ZTF DR3
Abstract
Blue Large Amplitude Pulsators (BLAPs) are hot, subluminous stars undergoing rapid variability with periods of under mins. They have been linked with the early stages of pre-white dwarfs and hot subdwarfs. They are a rare class of variable star due to their evolutionary history within interacting binary systems and the short timescales relative to their lifetime in which they are pulsationally unstable. All currently known BLAPs are relatively faint ( mag) and are located in the Galactic plane. These stars have intrinsically blue colours but the large interstellar extinction in the Galactic plane prevents them from swift identification using colour-based selection criteria. In this paper, we correct the Gaia -band apparent magnitude and colours of million sources brighter than mag in the Galactic plane with good quality photometry combined with supplementary all-sky data totalling million sources. Selecting sources with colours consistent with the known population of BLAPs and performing a cross-match with the Zwicky Transient Facility (ZTF) DR3, we identify short period candidate variables. Manual inspection of the period-folded light curves reveals candidate BLAPs. Of these targets, are consistent with the observed periods and light curves of the known BLAPs, are within the theoretical period range of BLAPs and are candidate high-gravity BLAPs. We present follow-up spectra of of these candidate sources and propose to classify of them as a BLAP, and tentatively assign an additional of them as BLAPs for future population studies.
keywords:
methods:data analysis – stars:variables:general – stars:oscillations – stars:early-type1 Introduction
Blue Large Amplitude Pulsators (BLAPs) are hot, subluminous variable stars which was first identified in the Optical Gravitational Lensing Experiment IV (OGLE-IV, Udalski et al., 2015)), and subsequently the high-gravity (high-g) BLAPs with the Zwicky Transient Factory (ZTF) survey data (Pietrukowicz et al., 2017; Kupfer et al., 2019, hereafter P17, K19). P17 presented the first BLAPs, which were all detected in OGLE fields towards the Galactic bulge. One of which was previously classified as a peculiar Scuti star (Macfarlane et al., 2017), which is a type of main sequence A-type stars that pulsate (Campbell & Wright, 1900). The BLAPs are of spectral type B and exhibit periods shorter than those of Scuti variables at ( mins) and higher amplitudes for these periods: mag in the -band and mag in the -band. Their light curves resemble those of fundamental-mode Cepheid variables with asymmetry in the brightening and dimming phases. They brighten rapidly from minimum to maximum brightness over a duration of of their period before a slower decline which sometimes exhibits a ‘step’ where the rate of fading abruptly decreases. Their high amplitudes and saw-tooth light curve shape suggest they are pulsating in a low-order radial mode although it is not conclusive. Some BLAP models have been found to be pulsationally unstable in high-order non-radial modes although with a weaker excitation than that of the fundamental mode (Córsico et al., 2018). K19 identified additional variable stars which differed from the previously discovered BLAPs by exhibiting shorter periods ( mins) and lower amplitudes ( mag in the band) classifying them as high-g BLAPs. The OGLE survey also included multiple fields aimed at the Magellanic Clouds and follow-up study of these fields has revealed no BLAPs (Pietrukowicz, 2018), although the distance moduli to these galaxies would make their detection difficult. Thus, they could only have ruled out the lack of foreground BLAPs in our Galaxy. High cadence photometry of OGLE-BLAP-009 and OGLE-BLAP-014 have not revealed any additional periodicity down to periods of s, indicating BLAPs likely only have a single radial pulsation mode (McWhirter et al., 2020). Non-radial gravity modes have not yet been observed in BLAPs. The OGLE BLAP light curves are of sufficient baseline to detect higher-amplitude gravity modes as they would have a longer period than the fundamental or radial overtone modes assuming the visible pulsation is the fundamental mode.
The spectroscopic followup by P17 and K19 confirmed that BLAPs are substantially hotter than Scuti variables with effective temperatures of K, surface gravity of for the OGLE BLAPs and for the high-g BLAPs. The OGLE BLAPs also exhibit moderate helium enrichment. Their spectra are of early B-type/late O-type stars, similar to the hot subdwarfs but with surface gravity ten times lower and higher luminosity, indicating that they are in a giant configuration. The high-g BLAPs are more compact and have luminosity and surface gravity consistent with hot subdwarfs. P17 and K19 show there is a clear periodic colour change as a function of the oscillation phase epoch-folded at the dominant period suggesting pulsation is the cause of the variability. The longer period BLAP light curves demonstrate the characteristic high-amplitude sawtooth in the and bands seen in radially pulsating stars (Madore & Freedman, 1991).
The BLAP variability is theorised to be a result of pulsations due to the -mechanism driven by the partial ionisation of iron-group metals in a shell of elevated abundance due to radiative-levitation (Byrne & Jeffery, 2018). These pulsations occur when stars of given composition and structure expand and contract their outer layers radially to maintain equilibrium (Eddington, 1917); or due to non-radial variations in surface temperature (Unno et al., 1989). They can be used to probe the inner structure of these variable stars (Deubner & Gough, 1984). BLAPs have been linked with the early stages of Extremely Low Mass (ELM) pre-White Dwarfs (pre-WDs) and hot subdwarfs which both evolve through the instability region associated with this type of pulsation (Romero et al., 2018; Byrne & Jeffery, 2018; Wu & Li, 2018; Paxton et al., 2019). They have also been proposed to be the surviving remnants of single-degenerate Type Ia supernovae (Meng et al., 2020). Mixing due to some combination of convection, rotation and shell-flashes can result in the stellar surface containing a mixture of hydrogen and helium explaining the helium surface abundance of the OGLE BLAPs. High-g BLAPs are more compact, and therefore gravitational settling has removed this excess helium from the photosphere. Byrne & Jeffery (2020) produced MESA stellar models for pre-WDs with masses from to with the effects of radiative levitation. They identified an extended region of iron-group instability using a non-adiabatic analysis of the MESA models at high time resolution (see Section 2 of Byrne & Jeffery 2020 for details). The observed periods of the BLAPs from P17 and the high-gravity BLAPs are consistent with the fundamental modes of MESA pre-WD models. The oscillation analysis indicates that pre-WDs with effective temperatures of up to K can exhibit pulsations. Some of these models also show evidence of instability in higher-order pressure modes which would exhibit shorter periods than the fundamental mode.
BLAPs appear to be a rare class of variable star due to their evolutionary history in an interacting binary system and the short timescales in which they transition the instability strip (Byrne & Jeffery, 2020). Binary Population Synthesis modelling has demonstrated that BLAPs form within interacting binary systems and can be both the primary with a main sequence companion or a secondary with a compact companion (Byrne et al., 2021, hereafter BSE21). Within the BSE21 simulated population, a small percentage of binaries also evolved to a type Ia supernova resulting in an isolated BLAP as previously predicted. The remaining BLAPs within the BSE21 population transition the instability strip with a companion with a mass often below with a majority of companions having masses of . Roche-Lobe Overflow is the dominant mechanism of mass transfer resulting in wider orbits with periods of day. The population of BLAPs within the analysis of BSE21 also evolved to form two distinct populations as seen in the OGLE BLAPs and the high-g BLAPs suggesting that this characteristic of these variable stars is not a result of observational bias. BSE21 considers this synthetic BLAP population within a number of models of the Milky Way disk and conclude the number of BLAPs visible in the Milky Way at the present time as .
There is a large discrepancy between the number of BLAPs observed in current surveys and the number predicted by synthetic BLAP populations in Galactic models after considering the magnitude limits of these surveys. All currently known BLAPs are relatively faint ( mag) and are located in the Galactic plane. These stars have intrinsically blue colours but the interstellar extinction due to dust in the Galactic plane prevents these sources from swift identification using colour-based selection criteria. Ramsay (2018) demonstrates a method of correcting this interstellar extinction for the BLAPs in P17 using all-sky dust maps combined with Gaia DR2 astrometry.
We structure the paper as follows. In §2 we define the criteria used in the selection of our initial Gaia DR2 sources. We then detail the method used to correct the interstellar extinction of these sources and detect periodic variability to reveal the population of intrinsically blue, subluminous variable stars. These candidate variable stars are studied for BLAP-like properties and we present these new BLAP candidates. In §3 we describe a follow-up spectroscopic campaign on these BLAP candidates and identify features consistent with spectra from the known BLAP population. Finally, in §4 we discuss and conclude the results of this work and propose further spectroscopic campaigns to reveal the stellar properties of these stars for future theoretical analysis. In this paper, the term amplitude refers to the minimum to maximum variation in magnitude unless otherwise stated.
2 Data Selection Criteria
Gaia DR2 (GDR2; Gaia Collaboration et al., 2018) is a 1.7-billion-source catalogue with an unprecedented astrometric quality accompanied with photometry in three filters, , and . The accuracy in the bright end ( mag) is as high as 0.02 mas in the parallax, while in the faint end ( mag), the precision is about times larger. The high-level pre-processed data can be retrieved via their dedicated archive page111https://gea.esac.esa.int/archive/. Bailer-Jones et al. (2018) computed the distance of 1.33 billion stars from their parallaxes using a weak distance prior that varies smoothly as a function of Galactic longitude and latitude according to a Galaxy model.
Pan-STARRS 1 (PS1)222https://panstarrs.stsci.edu/ is a m wide-field optical imager on the peak of Haleakala on Maui (Chambers et al., 2016). The 3 Survey covers deg2 of the sky north of in declination (Magnier et al., 2020). It imaged thse sky on average times in the , , , , and -band filters over the year survey period. One affiliated product from this enormous ground-based survey is the 3D dust map (Green et al., 2019)333http://argonaut.skymaps.info/. The map was produced using million stars from PS1 and 2MASS (Skrutskie et al., 1997), and included the Gaia parallaxes to improve the distance estimates to nearby stars for more accurate reddening estimation. They also incorporated a spatial prior that correlates the dust density across nearby sightlines to produces a smooth dust map. Their reported reddening uncertainties are typically smaller than those from the GDR2.
Zwicky Transient Facility (ZTF, Bellm et al., 2019) is an optical time-domain survey that uses the Palomar 48-inch Schmidt telescope. Each exposure cover deg2 in one of the , or -band filters. In the DR3, billion sources with more than detections in the northern sky with a survey footprint similar to that of the PS1 3 Survey, have become publicly available444https://irsa.ipac.caltech.edu/Missions/ztf.html with new data release scheduled every six months.
Our data selection starts with queries on the GDR2 archive. To define the quality requirements
for our initial dataset we utilise the treatise defined for astrometric quality in
Lindegren
et al. (2018) and photometric quality in Evans
et al. (2018) with queries
based on those from GDR2. Due to the declination limit of the PS1 3D dustmaps our footprint is limited
to targets with declination . We further constrain this declination to to
ensure optimal placement for observation from northern facilities. GDR2 focused on the production of a
GDR2 Hertzsprung-Russell diagram of nearby stars and require the astrometric signal-to-noise ratio to
be larger than 10. Our selection relaxes this requirement to be greater than as the BLAPs are
expected to be faint and much more distant. We also limit our sample to those with parallaxes less
than or equal to mas yr-1 to remove nearby hot WDs which have a fainter absolute magnitude. For
the photometric quality, we consider the faint nature of our targets. We limit our sample to sources
brighter than mag and apply relaxed constraints relative to GDR2 requiring the mean flux
significance to be and the mean flux significance of and
. The final quality selection criteria are identical to those in GDR2 as per recommendations from Evans
et al. (2018) related to
blending between sources or the background in the and bands. This
blending has been used to calculate a factor named the excess
factor of which fainter sources are more strongly affected. These criteria are an empirically
determined non-linear function of the colours
of the sources:
phot_bp_rp_excess_factor
and
phot_bp_rp_excess_factor
.
The above conditions are applied to the GDR2 archive using Astronomical Data Query Language (ADQL) queries. We apply one final condition to the query for targets within for sources in the Galactic plane. We assume that outside of the Galactic plane, the substantially lower quantity of interstellar dust would result in BLAPs retaining their intrinsically blue colours and therefore being detected with existing surveys for hot, subluminous sources such as those conducted using GDR2 (Geier et al., 2019; Geier, 2020). The resulting dataset consists of sources within the Galactic plane.
After the initial selection of sources, we extended the method to sources outside the Galactic plane and to all-sky sources with parallax-over-error values below 1.0 values to produce two supplementary datasets which are also processed by our method. The dataset of sources outside of the selection of contains sources and the all-sky ‘low astrometric signal-to-noise’ dataset contains sources. This dataset is dominated by faint stars close to the mag limit of the search queries. The combined total of all-sky sources is .
We designate our targets with the unique identification starting with ZGP, which is comprised of the first letter of each of ZTF, Gaia and Pan-STARRS. The unique identifier of the targets is ordered by increasing right ascension.
2.1 Method
By combining the accurate parallaxes from the GDR2 and the 3D dust map from the PS1,
we dereddened the million stars brighter than mag
within the Galactic plane dataset.
The first operation is to transform the parallaxes of the sources in these datasets to distances
from the Earth within the Galaxy. We utilise the computations from Bailer-Jones et al. (2018)
described above which are available as a supplementary table within the GDR2 archive.
We do this by using the ADQL queries for the above quality selection and perform a join onto the
gaiadr2_geometric_distance table which contains the required data.
The resulting data contains an estimated distance (r_est) and a higher and lower bound
(r_hi and r_lo) defined as the distances where the probability of the
targets being within this region is , which is within the 1 standard deviation from
the centre of a “Gaussian distribution”. As the distance posterior is asymmetrical, the difference
between r_hi and r_lo with r_est are unequal.
We take these three distance estimates and compute the interstellar reddening for each distance using the dustmaps package with the PS1 3D dustmaps (Green et al., 2019, hereafter Bayestar2019). This package can be used to compute the reddening locally on the desktop computer or to query an online resource. We chose to query the online data which is performed three times for each source with the distance estimates. The reddening provided by Bayestar2019 are mapped to PS1 passbands and are related to , the reddening in the PS1 and passbands.
To utilise these reddening values on the GDR2 data we must either transform the GDR2 photometry into the PS1 passbands or convert the extinctions to . The first issue with this calculation is a result of the conversion being a function of the intrinsic colour of a source which is an unknown without spectral information. We apply corrections computed for the reddening law from Fitzpatrick (1999) to a K source spectrum shown in Schlafly & Finkbeiner (2011). As a result of using a source spectrum significantly cooler of those of BLAPs, the reddening will be underestimated for BLAPs. We mitigate this issue by defining future selection criteria on known BLAPs subjected to this method. We utilise the first relation in Schlafly & Finkbeiner (2011) to compute , the reddening in the Johnson and passbands as Bayestar2019. We utilise for this conversion as existing dustmaps of the Galactic plane have been used to compute the relation between and . Chen et al. (2019) computed the relation between and to compare their dustmaps to other research determining that . Combining these research findings, we utilise the computation of Bayestar2019 to transform the three reddening estimates into the GDR2 system.
With the computation of and , we compute the absolute magnitude, and the dereddened colour, using equations 1 and 2.
| (1) |
where is the absolute magnitude of a source in , is the apparent magnitude of a source in , is the estimated distance to the source in parsecs and is the interstellar extinction of the source in .
| (2) |
where is the dereddened colour of a source, () is the measured colour of a source from GDR2 and is the interstellar reddening of a source.

The colour and absolute magnitude selection criteria are determined from the known set of BLAPs with good parallaxes in GDR2 and within the PS1 footprint such that all of them can be recovered. This is accomplished by applying our method to the known BLAPs to map them onto our , parameter space. We are primarily concerned with removing contamination from the main sequence so our constraints are only applied to remove the brighter and cooler sources from our dataset. We require mag and mag. The constraints are loose because of (1) the large aggregated uncertainties coming from the combined parallax and extinction correction; (2) the infancy of our understanding of this elusive population of blue faint pulsators. This basic colour and absolute magnitude selection reduce the sample size to of the initial size, giving us subluminous and intrinsically blue stars. These targets are then cross-matched with the ZTF DR3 to obtain epoch photometry to determine if these targets are variable. We conservatively require our targets to have variability mag. Sources with nearby ( if < mag and if mag) bright sources are removed to minimise false positives due to contamination. As a result, only are left as candidate subluminous, intrinsically blue variable sources. This dereddening is also performed on the high Galactic lattitude dataset. The reduced Galactic interstellar extinction for the sources at these high lattitudes results in minimal contamination from main sequence sources with sources identified as candiate subluminous, intrinsically blue variable sources. The dereddened ‘low parallax quality’ dataset has higher uncertainties resulting in selected sources with a higher likelihood of main sequence contamination.
The candidate variable sources may be a result of periodic or non-periodic phenomena or contamination in the ZTF light curves. To identify light curves with high periodicity a periodogram must be utilised. The Conditional Entropy (CE) Periodogram has comparable computing performance to other information-based techniques but is superior for finding periods in light curves with non-sinusoidal behaviour (Graham et al., 2013). It functions by identifying candidate periods where the epoch-folded data points align. This results in a decrease in the entropy of the system as the data points are ordered. As the shape of the alignment has no effect on the entropy, the CE periodogram is robust to a large variety of potential signals. The algorithm computes a unit-square normalised light curve (phase and magnitude values ranging between ). It then subdivides this space into bins and computes the quantity of data points present in each bin for each candidate period. Highly ordered data points will fill a minimum quantity of bins generating a peak in the CE for that frequency. Due to the binning of the data, the CE periodogram has two additional parameters: the number of bins in the phase dimension and in the magnitude dimension. These parameters must be optimised to determine the appropriate values for a specific dataset. By employing a GPU-accelerated CE periodogram for the significant improvement in processing time for large datasets (Katz et al., 2021), these candidates are analysed for periodicity with a period range of mins, as expected from the BLAP-like variability as reported from the theoretical front (Byrne & Jeffery, 2020). We perform a sigma-clipping procedure on the and light curves of the candidate variable stars with to mask outliers from the periodogram. We utilise an oversampling factor of and subdivide the unit-square normalised epoch-folded light curves into bins in the phase dimension and bins in the magnitude dimension as recommended by the authors of this implementation on ZTF data.
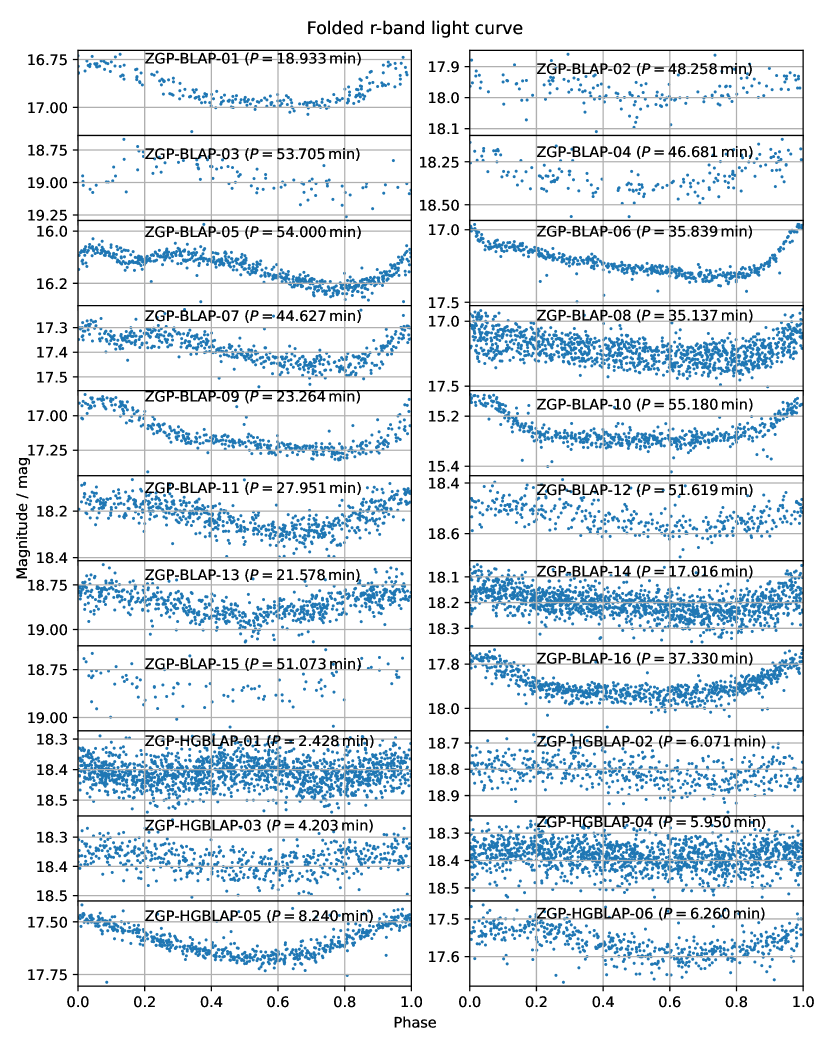
Sources with optimal candidate periods with peak CE values greater than confidence in the periodogram in either the or band observations are selected. This significantly reduces the shortlist to a sample of sources derived from both the Galactic plane dataset and the two supplementary datasets. Manual inspection of the epoch-folded light curves gives us the final candidate BLAPs. Six of them are consistent with the observed periods and light curves of the known BLAPs, ten are considered to be within the theoretical period range of BLAPs, and the last six are candidate high-gravity BLAPs. The dereddened Hertzsprung-Russell diagram of the region selected for this study is shown in Figure 1. Contamination from the main sequence dominates the top right corner of the plot with the highest source density. The over-density centered at (, ) is attributed to the hot subdwarfs on the extreme horizontal branch. The existing BLAPs have been processed by this method and are shown as orange inverted triangles. The 22 new candidate BLAPs are shown as red triangles.
In Figure 2 we display the epoch folded light curves of the 22 new candidates utilising the periods discovered by the CE periodogram as listed in appendix A. Most of the long period candidates show asymmetric light curves similar to those from P17 indicative of their nature as pulsating stars. The remaining sources still demonstrate high amplitude periodic variability which is not explained by binary companions. The High-g BLAP candidates have symmetric light curves similar to those of K19. In this case, we have identified these targets as candidates due to their high amplitude relative to other hot subdwarf pulsators. The coordinates, periods and amplitudes of these stars in the passband used to generate this figure can be found in Appendix A. The target we have named ZGP-BLAP-09 has been previously discovered. It was initially confused with a nearby Red Giant Branch (RGB) star (Ofek et al., 2020). We identified this source as a BLAP candidate and submitted a proposal to obtain spectroscopic observations prior to the selection of this source from GDR2 by our method. The true classification of this source was also independently determined by observers affiliated with the American Association of Variable Star Observers (AAVSO) and this source was uploaded as a BLAP candidate with the identifier ZTF J191440.84+193825.8 to the AAVSO Variable Star Index (VSX). Returning to the study by Ofek et al. (2020), they also detected ZGP-BLAP-08 although they do not make a classification. We returned to the AAVSO VSX to determine if any of our other candidates have been included in this catalogue. ZGP-BLAP-11, 13 and 14 are part of Gabriel Murawski’s MGAB catalogue although they do not have firm classifications. They made a note that MGAB-V3437 (ZGP-BLAP-14) is a ‘possible BLAP type variable’. None of our remaining candidate BLAPs are present on the VSX. Finally, ZGP-HGBLAP-02 has been recently identified as a potential single-mode sdB hot subdwarf pulsator (Kupfer et al., 2021). Due to the similarity between our High-g BLAP candidates, it is possible that the other five candidates may also be members of this recently discovered type of pulsator. We present follow-up spectra of of these candidate sources and propose them as new BLAPs for future population studies.
3 Spectroscopic Follow-up
We carried out spectroscopic observations of ZGP-BLAP-09 using the
Optical System for Imaging and Low-Resolution Integrated
Spectroscopy (OSIRIS; Cepa
et al., 2000) in long-slit mode at the 10.4 m
Gran Telescopio de Canarias (GTC) on the island of La Palma, Spain.
Our program was executed on 13 September 2020 (PI: McWhirter. Program
IDs: GTC2020-159) at an average airmass of 1.02, seeing around 0.7”,
and a waning crescent moon for 960 s and 1200 s with the R1000B and R2500U
gratings, respectively.
Under the proposals CL21A10 and JL21B16, low-resolution spectra
of the 15 BLAP candidates and 6 high gravity BLAP candidates were collected
with the SPRAT spectrograph (Piascik
et al., 2014) mounted on the
Liverpool Telescope (Steele
et al., 2004), also located on the island of
La Palma, Spain. The blue-optimised mode was used to collect the spectra in dark
condition with seeing at around 1” in the summer months of 2021, see
Table 1 and 2 in the Appendix for more details.
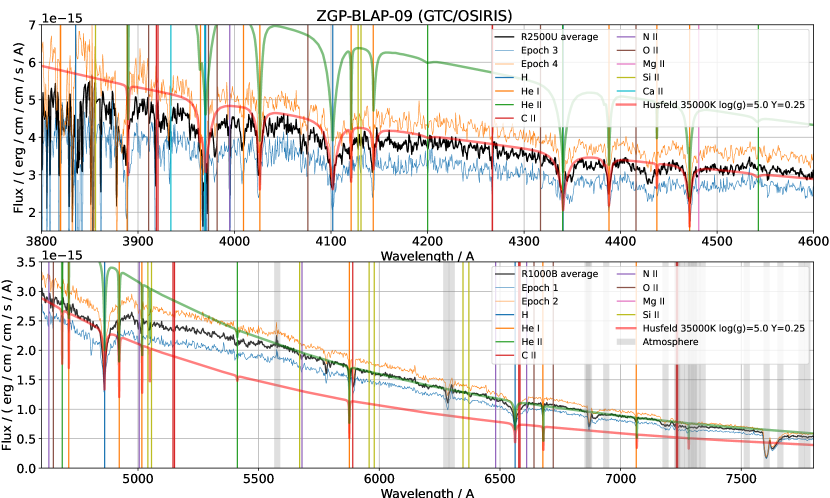
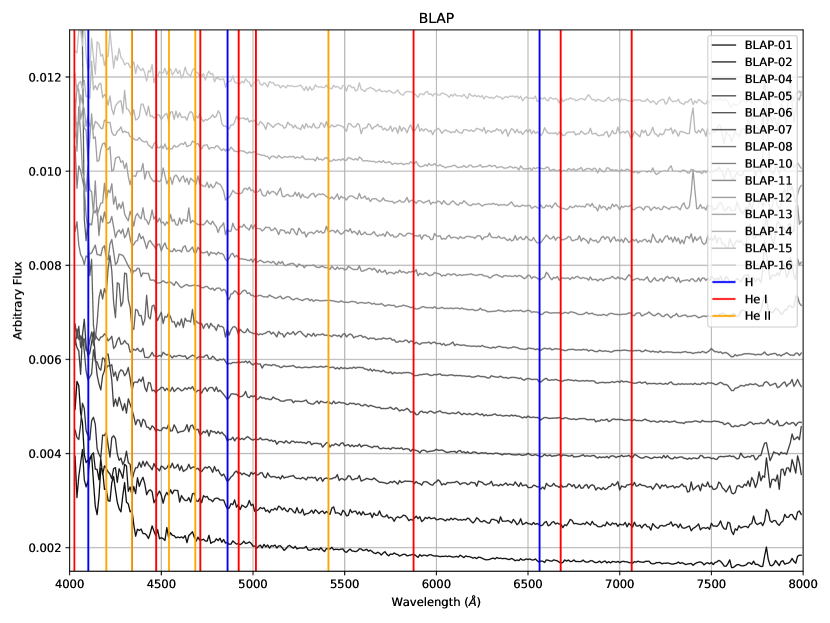
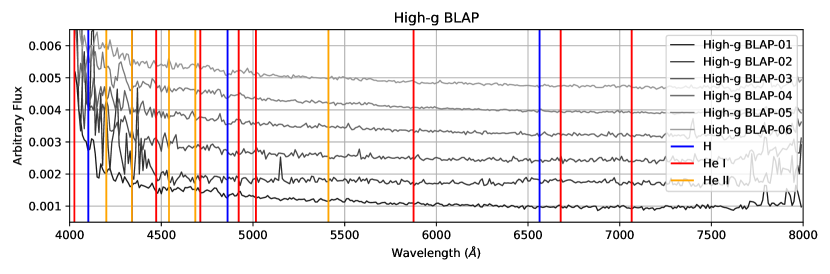
All the data were reduced using the new generation iraf-free ASPIRED (Lam et al., 2021; Lam, 2021; Veitch-Michaelis & Lam, 2020) 555https://github.com/cylammarco/ASPIRED,666https://github.com/jveitchmichaelis/rascal written entirely in Python. Standard procedure of spectral reduction was performed: 2D spectral image reduction, tracing, optimal extraction, wavelength and flux calibration, atmospheric absorption correction. We apply interstellar reddening correction using the values computed in Section §2.1. The reduced spectra from OSIRIS are shown in Figure 3, while those from SPRAT are shown in Figure 4 and 5.
3.1 BLAP candidates
In the BLAP candidate sample, we obtained medium resolution spectra of ZGP-BLAP-09, which we considered as the best candidate as judged from the amplitude and period. It is the only spectrum that is corrected for the interstellar extinction for the purpose of analysis. Low-resolution spectra were collected with LT/SPRAT for 14 of the remaining 15 BLAP candidates. Given their relatively large surface gravity, a grism with is sufficient to resolve the strong H and He features – all the follow-ups show H absorption, most of them also show H, and in a few cases the He I at Å and He II at Å are present. The H absorption was also showing stronger feature in the previous study using the same spectrograph (McWhirter & Lam, 2021).
3.1.1 ZGP-BLAP-09
The blue end is observed with the R2500U grating while the red end is with the R1000B grating such that there is sufficient resolving power to inspect the weaker helium lines. In fact, all the lines in the “Strong line list” on NIST777https://physics.nist.gov/PhysRefData/Handbook/Tables/heliumtable2.htm in the range of Å can be seen. In addition, we have also identified absorption lines from heavier elements in the spectrum, including clear absorption features from C II (, , & Å), N II ( & Å), O II (, , , , , & Å), Mg II ( Å), Si II ( & Å) and Ca II ( Å). We cannot identify iron lines; or forbidden lines that are common in shell ejecta in case the absorption comes from the environment. This is in agreement with the lack of IR excess from the WISE mid-infrared data (Schlafly et al., 2019).
Each individual observation does not cover the same part of a pulsation period, so the normalisations are, as expected, different despite one is taken immediately after another. By comparing with the medium resolution spectrum of OGLE-BLAP-001 in Figure 4 of P17, we have identified a few interesting features, from the blue end to the red end: there are subtle hints of O II lines at Å as well as the same unidentified line at Å. At Å, the unidentified absorption feature looks noise-like, but it appears on both the P17 and our data. Towards the red wing of the H, there could be a C II line at Å. This will allow us to adopt a metallicity more appropriate for BLAPs. In the case of P17, they adopted a metallicity typical of a hot subdwarf: solar abundances for N, S and Fe, and one-tenth solar for C, O and Si.
Without any publicly available models that are immediately available for spectral analysis of BLAPs, the best model grid that is suitable for preliminary fitting is the set provided by Husfeld et al. (1989)888hosted on http://svo2.cab.inta-csic.es/theory/newov2/. Before template fitting, we correct for the interstellar extinction based on the PS1 dust map and the distance from (Bailer-Jones et al., 2018) at kpc, giving us . We use the typical total extinction for the Galaxy, , and correction using the extinction law from Fitzpatrick & Massa (2007) using Barbary (2016) 999https://github.com/kbarbary/extinction and (Wang & Chen, 2019). We find the best fit solution (from the sparsely populated parameter space) a helium rich star () with T K and (see Figure 1). Judging from the shape of the model (thick red line) and the spectra, we believe at the blue end the spectrum is already starting to plateau, a lower temperature should give a better fit. The R1000B (bottom) spectrum is normalised to match the flux of the R2500U (top) spectrum at Å. By fitting the red and blue spectra separately with the normalisation as a free parameter. If we fit with the blue spectrum and extend the model to the red, we find a significant discrepancy in the flux between the model and the spectrum redward of the H absorption line. Given the age of the model, it is possible that the model is scaled to match the (under-subtracted) line-blanketed region of the spectrum (the R2500U spectrum), thus it should be interpreted as that the model agrees with the R1000B spectrum, and there is significant flux deficit in the blue end (thick green line). We also note that the effective temperature of a BLAP can be strongly dependent on the phase, given the high-g BLAP reported to have a temperature variation of K between the minimum and maximum over a period of pulsation. Regarding the He absorption line strengths, some lines are better fitted with as low as model, while some lines are best fitted with the model. We choose to plot the only option between these two abundances, . On the other hand, the broadening of the line shows a good agreement with the fitted surface gravity, the next step down and up are and , so among all the fitted properties, we would tentatively assign to the average spectrum an upper limit of T K, a surface gravity of and an abundant amount of helium that we are unable to constrain it to better than .
3.1.2 ZGP-BLAP-01, 05, 06, 14 and 16
These five candidates have strong blue spectra, but their spectral energy distributions (SEDs) show mild flux deficit around Å. This could be the result of the presence of a cooler unresolved companion. This feature is the most prominent with ZGP-BLAP-14. Should it be coming from a close companion, without considering the potential re-radiation effect from the high energy photons from the hotter component, they are most like late G/K-type main sequence stars. Given the absolute -band magnitudes at around mag, which is about mag fainter than the BLAPs, this translates to about fainter in terms of flux. Furthermore, these hypothetical main sequence companions should dominate the flux in the red end. With the low resolving power of SPRAT, the absorption lines could all be "washed-out" by the unresolved companions leaving these relatively smooth spectra in the red end. With the available photometric and spectroscopic data, it is difficult to determine their natures any further. Despite their strange SEDs, they may reveal more about their past evolution history than the other candidates as they provide additional features as constraints to their past and present evolution scenario.
3.1.3 ZGP-BLAP-02, 04, 07, 08, 10, 11, 12, 13 and 15
The remaining nine BLAP candidates show the typical blue SEDs with strong H absorption and He II at Å. The spectra are noisy in that region, but it is statistically unlikely that all of them show the He II absorption, while all of the five other candidates showing flux deficit do not show this absorption line. Using ZGP-BLAP-09 as a proxy, we know that the Å absorption can be very strong and comparable to the strength of the neighbouring He-I absorption lines. These either candidates appear to be more akin to the “conventional” BLAPs as were first discovered, we recommend further follow-up with higher resolution spectra for this sample that is less likely to have a close companion to complicate studies with additional Physics.
3.2 High-gravity BLAP candidates
All six High-g BLAP candidates are sowing clear H absorption feature. As the gravity gets stronger, the absorption lines should be more broadened and more visible with low-resoluiton spectra. We, however, cannot find the absorption features any more prominent than the BLAP candidates. However, all of them are exhibiting very blue SEDs, with single-mode pulsation period between two and nine minutes, it is difficult to assign them to any stellar type. In the parameter space they occupy, among the existing stellar types, they can only be high-g BLAPs, or some of the of the peculiar hot subdwarfs. We recommend further follow-up observations with a higher resolution spectrograph.
4 Conclusion
We made use of the synergy of the high-level products of (1) accurate parallaxes from Gaia DR2, (2) high cadence survey of the northern sky with the ZTF DR3, (3) the most up-to-date 3D dust map generated using Pan-STARRS 1, 2MASS and Gaia DR2, and (4) finally a GPU-accelerated Conditional Entropy periodogram to allow the identification of the 16 BLAP candidates and 6 high gravity BLAP candidates with a desktop computer. Nine of the BLAP candidates have ZTF light curves clearly exhibiting the asymmetry seen in previously observed BLAPs with periods consistent with current theories. We tentatively classify these candidates as BLAPs based on these observations. Due to the followup spectral observations, we propose to firmly classify ZPG-BLAP-09 as a BLAP. The remaining tentative classifications are for ZPG-BLAP-05, 06, 07, 08, 10, 11 and 14. The remaining seven candidate BLAPs are consistent with the theoretical BLAP population but could also be eccentric binary systems, Scuti or SX Phoenicis pulsators and therefore are too ambiguous for a classification. All the high-gravity BLAP candidates have coherent sinusoidal variability as expected for these objects. ZPG-HGBLAP-02, 03, 04 and 06 have the clearest light curves from these high-gravity candidates. Additional spectral observations are required to determine the nature of these variable objects as this region of the period, amplitude and light curve symmetry feature space is currently occupied by both the high-gravity BLAPs and a new class of radially pulsating sdB hot subdwarfs.
The best candidate, ZPG-BLAP-09, was observed with the GTC/OSIRIS in long-slit mode with grism R1000B and R2500U. This delivered the second medium-resolution spectrum of a BLAP. The spectrum shows moderately broadened hydrogen and helium absorption features, along with a number of metal features that were not reported in the other medium-resolution spectrum of a different BLAP, and certainly would not have appeared in the low-resolution spectra. The detection of strong metal absorption features immediately suggest two scenarios, which can be true at the same time. First, it further reinforces the case that BLAPs have a very recent energetic past where given their large surface gravity, the heavy elements still do not have time to set beneath the photosphere. Second, the outer layer of the envelope is convective, and the convective cells dredge deep enough to keep the photosphere rich in metals. Given the null detection of any emission lines so far in all the available spectra, it is unlikely that these metals are coming from materials being constantly accreted onto the surface.
The surface gravity and surface chemical abundances of the candidate stellar types of BLAPs can differ by over an order of magnitude: from thermally bloated, He-enriched stars with typical surface gravity, to the compact surface H-rich stars similar to hot subdwarfs with moderately high surface gravity. In order to further study BLAPs, models of their synthetic energy distribution have to be computed before we can address the range of stellar parameters of BLAPs. As of the time of writing of this article, there is not any publicly available models that are suitable for the analysis of BLAPs.
In this work, we believe ZGP-BLAP-09 is a genuine BLAP given the acceptable model fitting. There are extra elements in the photosphere that were not observed before, which can be served as a useful constraint in modelling the evolution scenario of its progenitor as well as the mass loss process. Nine of the BLAP candidates show promising blue spectra with clear H and He absorption lines, while other six show flux deficit at around Å. All the high-g BLAP candidates are not showing clear absorption features, yet the spectra are indicating they are genuinely blue objects with no evidence of companions at significantly different temperatures. We recommend further spectral data collection of all these candidates at higher resolution, where the eight BLAPs candidates with clear absorption features should be prioritised.
We suspect additional BLAPs await detection due to the uncertainties involved in the dereddening combined with limited epochs of photometry for some fields. With the continued data releases from both ZTF and Gaia, improvements are expected for both of these constraints offering a potential wealth of additional discoveries in the coming years.
Acknowledgements
PRMW acknowledges financial support from the Science and Technology Facilities Council (STFC).
PRMW thanks the useful discussions with Gavin Ramsay from the Armagh Observatory.
MCL is supported by a European Research Council (ERC) grantunder the European Union’s Horizon 2020 research and innovationprogram (grant agreement number 833031).
Based on observations obtained with the Samuel Oschin 48-inch Telescope at the Palomar Observatory as part of the Zwicky Transient Facility project. ZTF is supported by the National Science Foundation under Grant No. AST-1440341 and a collaboration including Caltech, IPAC, the Weizmann Institute for Science, the Oskar Klein Center at Stockholm University, the University of Maryland, the University of Washington, Deutsches Elektronen-Synchrotron and Humboldt University, Los Alamos National Laboratories, the TANGO Consortium of Taiwan, the University of Wisconsin at Milwaukee, and Lawrence Berkeley National Laboratories. Operations are conducted by COO, IPAC, and UW.
This work has made use of data from the European Space Agency (ESA) mission Gaia (https://www.cosmos.esa.int/gaia), processed by the Gaia Data Processing and Analysis Consortium (DPAC, https://www.cosmos.esa.int/web/gaia/dpac/consortium). Funding for the DPAC has been provided by national institutions, in particular the institutions participating in the Gaia Multilateral Agreement.
Based on observations made with the GTC telescope, in the Spanish Observatorio del Roque de los Muchachos of the Instituto de Astrofísica de Canarias, under Director’s Discretionary Time.
The Liverpool Telescope is operated on the island of La Palma by Liverpool John Moores University in the Spanish Observatorio del Roque de los Muchachos of the Instituto de Astrofísica de Canarias with financial support from the UK Science and Technology Facilities Council.
This research has made use of the Spanish Virtual Observatory (http://svo.cab.inta-csic.es) supported from the Spanish MICINN/FEDER through grant AyA2017-84089
We acknowledge with thanks the variable star observations from the AAVSO International Database contributed by observers worldwide and used in this research.
Data Availability
The data underlying this article will be shared on reasonable request to the corresponding author.
References
- Bailer-Jones et al. (2018) Bailer-Jones C. A. L., Rybizki J., Fouesneau M., Mantelet G., Andrae R., 2018, AJ, 156, 58
- Barbary (2016) Barbary K., 2016, extinction v0.3.0, doi:10.5281/zenodo.804967, https://doi.org/10.5281/zenodo.804967
- Bellm et al. (2019) Bellm E. C., et al., 2019, PASP, 131, 018002
- Byrne & Jeffery (2018) Byrne C. M., Jeffery C. S., 2018, MNRAS, 481, 3810
- Byrne & Jeffery (2020) Byrne C. M., Jeffery C. S., 2020, MNRAS, 492, 232
- Byrne et al. (2021) Byrne C. M., Stanway E. R., Eldridge J. J., 2021, MNRAS, 507, 621
- Campbell & Wright (1900) Campbell W. W., Wright W. H., 1900, ApJ, 12, 254
- Cepa et al. (2000) Cepa J., et al., 2000, in Iye M., Moorwood A. F., eds, Society of Photo-Optical Instrumentation Engineers (SPIE) Conference Series Vol. 4008, Optical and IR Telescope Instrumentation and Detectors. pp 623–631, doi:10.1117/12.395520
- Chambers et al. (2016) Chambers K. C., et al., 2016, arXiv e-prints, p. arXiv:1612.05560
- Chen et al. (2019) Chen B. Q., et al., 2019, MNRAS, 483, 4277
- Córsico et al. (2018) Córsico A. H., Romero A. D., Althaus L. G., Pelisoli I., Kepler S. O., 2018, arXiv e-prints, p. arXiv:1809.07451
- Deubner & Gough (1984) Deubner F.-L., Gough D., 1984, ARA&A, 22, 593
- Eddington (1917) Eddington A. S., 1917, The Observatory, 40, 290
- Evans et al. (2018) Evans D. W., et al., 2018, A&A, 616, A4
- Fitzpatrick (1999) Fitzpatrick E. L., 1999, PASP, 111, 63
- Fitzpatrick & Massa (2007) Fitzpatrick E. L., Massa D., 2007, ApJ, 663, 320
- Gaia Collaboration et al. (2018) Gaia Collaboration et al., 2018, A&A, 616, A1
- Geier (2020) Geier S., 2020, A&A, 635, A193
- Geier et al. (2019) Geier S., Raddi R., Gentile Fusillo N. P., Marsh T. R., 2019, A&A, 621, A38
- Graham et al. (2013) Graham M. J., Drake A. J., Djorgovski S. G., Mahabal A. A., Donalek C., 2013, MNRAS, 434, 2629
- Green et al. (2019) Green G. M., Schlafly E., Zucker C., Speagle J. S., Finkbeiner D., 2019, ApJ, 887, 93
- Husfeld et al. (1989) Husfeld D., Butler K., Heber U., Drilling J. S., 1989, A&A, 222, 150
- Katz et al. (2021) Katz M. L., Cooper O. R., Coughlin M. W., Burdge K. B., Breivik K., Larson S. L., 2021, MNRAS, 503, 2665
- Kupfer et al. (2019) Kupfer T., et al., 2019, ApJ, 878, L35
- Kupfer et al. (2021) Kupfer T., et al., 2021, MNRAS, 505, 1254
- Lam (2021) Lam M. C., 2021, ASPIRED: v0.4.1, doi:10.5281/zenodo.5650127, https://doi.org/10.5281/zenodo.5650127
- Lam et al. (2021) Lam M. C., Smith R. J., Arcavi I., Steele I. A., Veitch-Michaelis J., Wyrzykowski L., 2021, arXiv e-prints, p. arXiv:2111.02127
- Lindegren et al. (2018) Lindegren L., et al., 2018, A&A, 616, A2
- Macfarlane et al. (2017) Macfarlane S. A., et al., 2017, MNRAS, 465, 434
- Madore & Freedman (1991) Madore B. F., Freedman W. L., 1991, PASP, 103, 933
- Magnier et al. (2020) Magnier E. A., et al., 2020, ApJS, 251, 6
- McWhirter & Lam (2021) McWhirter P. R., Lam M. C., 2021, Research Notes of the American Astronomical Society, 5, 131
- McWhirter et al. (2020) McWhirter P. R., Lam M. C., Steele I. A., 2020, MNRAS, 496, 1105
- Meng et al. (2020) Meng X.-C., Han Z.-W., Podsiadlowski P., Li J., 2020, ApJ, 903, 100
- Ofek et al. (2020) Ofek E. O., Soumagnac M., Nir G., Gal-Yam A., Nugent P., Masci F., Kulkarni S. R., 2020, MNRAS, 499, 5782
- Paxton et al. (2019) Paxton B., et al., 2019, ApJS, 243, 10
- Piascik et al. (2014) Piascik A. S., Steele I. A., Bates S. D., Mottram C. J., Smith R. J., Barnsley R. M., Bolton B., 2014, in Ramsay S. K., McLean I. S., Takami H., eds, Society of Photo-Optical Instrumentation Engineers (SPIE) Conference Series Vol. 9147, Ground-based and Airborne Instrumentation for Astronomy V. p. 91478H, doi:10.1117/12.2055117
- Pietrukowicz (2018) Pietrukowicz P., 2018. pp 258–262 (arXiv:1802.04405)
- Pietrukowicz et al. (2017) Pietrukowicz P., et al., 2017, Nature Astronomy, 1, 0166
- Ramsay (2018) Ramsay G., 2018, A&A, 620, L9
- Romero et al. (2018) Romero A. D., Córsico A. H., Althaus L. G., Pelisoli I., Kepler S. O., 2018, MNRAS, 477, L30
- Schlafly & Finkbeiner (2011) Schlafly E. F., Finkbeiner D. P., 2011, ApJ, 737, 103
- Schlafly et al. (2019) Schlafly E. F., Meisner A. M., Green G. M., 2019, ApJS, 240, 30
- Skrutskie et al. (1997) Skrutskie M. F., et al., 1997. p. 25, doi:10.1007/978-94-011-5784-1_4
- Steele et al. (2004) Steele I. A., et al., 2004, in Oschmann Jacobus M. J., ed., Society of Photo-Optical Instrumentation Engineers (SPIE) Conference Series Vol. 5489, Ground-based Telescopes. pp 679–692, doi:10.1117/12.551456
- Udalski et al. (2015) Udalski A., Szymański M. K., Szymański G., 2015, Acta Astron., 65, 1
- Unno et al. (1989) Unno W., Osaki Y., Ando H., Saio H., Shibahashi H., 1989, Nonradial oscillations of stars
- Veitch-Michaelis & Lam (2020) Veitch-Michaelis J., Lam M. C., 2020, in Zenodo Software package. p. 17517, doi:10.5281/zenodo.4117517
- Wang & Chen (2019) Wang S., Chen X., 2019, ApJ, 877, 116
- Wu & Li (2018) Wu T., Li Y., 2018, MNRAS, 478, 3871
Appendix A Observation Summary
| Designation | RA | Dec | l | b | Period / min | Instrument | Night of Obs. | ||
| ZGP-BLAP-01 | 57.931979 | 58.751071 | 144.526097 | 3.656876 | 18.933 | 16.94 | 0.21 | SPRAT/Blue | 2021-08-05 |
| ZGP-BLAP-02 | 82.905144 | 17.536672 | 188.005076 | -8.755367 | 48.258 | 17.98 | 0.09 | SPRAT/Blue | 2021-09-02 |
| ZGP-BLAP-03 | 169.766884 | 13.868316 | 239.917324 | 64.703080 | 53.705 | 18.97 | 0.26 | — | — |
| ZGP-BLAP-04 | 214.459870 | 0.980563 | 344.940403 | 56.633534 | 46.681 | 18.33 | 0.22 | SPRAT/Blue | 2021-07-03 |
| ZGP-BLAP-05∗ | 281.940840 | -10.435027 | 23.214926 | -3.931005 | 54.000 | 16.13 | 0.13 | SPRAT/Blue | 2021-07-01 |
| ZGP-BLAP-06∗ | 283.187948 | -5.179776 | 28.468139 | -2.650761 | 35.839 | 17.25 | 0.24 | SPRAT/Blue | 2021-07-01 |
| SPRAT/Blue | 2021-08-07 | ||||||||
| ZGP-BLAP-07∗ | 285.871177 | -0.083905 | 34.231475 | -2.718417 | 44.627 | 17.38 | 0.14 | SPRAT/Blue | 2021-07-01 |
| SPRAT/Blue | 2021-08-04 | ||||||||
| SPRAT/Blue | 2021-08-08 | ||||||||
| SPRAT/Blue | 2021-09-01 | ||||||||
| ZGP-BLAP-08∗ | 288.286554 | 12.080933 | 46.138307 | 0.752002 | 35.137 | 17.22 | 0.27 | SPRAT/Blue | 2021-07-01 |
| SPRAT/Blue | 2021-08-07 | ||||||||
| ZGP-BLAP-09† | 288.670150 | 19.640445 | 53.017463 | 3.922213 | 23.264 | 17.19 | 0.33 | OSIRIS/R1000B | 2020-09-13 |
| OSIRIS/R2500U | 2020-09-13 | ||||||||
| ZGP-BLAP-10∗ | 294.099409 | 5.084049 | 42.654877 | -7.607390 | 55.180 | 15.28 | 0.16 | SPRAT/Blue | 2021-07-03 |
| ZGP-BLAP-11∗ | 294.693100 | 58.698261 | 90.781022 | 17.144942 | 27.951 | 18.22 | 0.16 | SPRAT/Blue | 2021-07-01 |
| ZGP-BLAP-12 | 305.121190 | 13.476327 | 55.573552 | -12.803831 | 51.619 | 18.52 | 0.14 | SPRAT/Blue | 2021-07-03 |
| ZGP-BLAP-13 | 312.463639 | 33.864752 | 76.342513 | -6.371979 | 21.578 | 18.85 | 0.18 | SPRAT/Blue | 2021-07-03 |
| ZGP-BLAP-14∗ | 317.830989 | 31.979516 | 77.847985 | -11.022891 | 17.016 | 18.20 | 0.13 | SPRAT/Blue | 2021-07-02 |
| SPRAT/Blue | 2021-08-08 | ||||||||
| ZGP-BLAP-15 | 320.570968 | -0.327068 | 52.025137 | -33.160555 | 51.073 | 18.83 | 0.18 | SPRAT/Blue | 2021-07-03 |
| ZGP-BLAP-16 | 333.379362 | 53.665594 | 100.783160 | -2.273963 | 37.330 | 17.90 | 0.16 | SPRAT/Blue | 2021-07-02 |
| Designation | RA | Dec | l | b | Period / min | Instrument | Night of Obs. | ||
|---|---|---|---|---|---|---|---|---|---|
| ZGP-HGBLAP-01 | 282.3082215 | 41.5407333 | 71.034502 | 17.986673 | 2.428 | 18.41 | 0.12 | SPRAT/Blue | 2021-07-02 |
| ZGP-HGBLAP-02∗ | 286.3974935 | -6.9930426 | 28.290674 | -6.316974 | 6.071 | 18.81 | 0.12 | SPRAT/Blue | 2021-07-02 |
| ZGP-HGBLAP-03∗ | 288.6449108 | -7.3016160 | 29.017878 | -8.449546 | 4.203 | 18.38 | 0.11 | SPRAT/Blue | 2021-07-02 |
| ZGP-HGBLAP-04∗ | 295.604068 | 15.3787950 | 52.431269 | -3.920912 | 5.950 | 18.38 | 0.12 | SPRAT/Blue | 2021-07-03 |
| ZGP-HGBLAP-05 | 303.558858 | 41.1414719 | 78.031206 | 3.617501 | 8.240 | 17.60 | 0.18 | SPRAT/Blue | 2021-07-02 |
| ZGP-HGBLAP-06∗ | 327.439845 | 45.9767929 | 93.076885 | -6.099164 | 6.260 | 17.56 | 0.10 | SPRAT/Blue | 2021-07-02 |