Realistic observing scenarios for the next decade of early warning detection of binary neutron stars
Abstract
We describe realistic observing scenarios for early warning detection of binary neutron star mergers with the current generation of ground-based gravitational-wave detectors as these approach design sensitivity. Using Fisher analysis, we estimate that Advanced LIGO and Advanced Virgo will detect one signal before merger in their fourth observing run provided they maintain a 70% duty cycle. 60% of all observations and 8% of those detectable 20 seconds before merger will be localized to . If KAGRA is able to achieve a 25 Mpc horizon, these prospects increase to early detections with 70% of all BNS localized to by merger. As the AHKLV network approaches design sensitivity over the next years, we expect up to 1 (14) detections made 100 (10) seconds before merger. Although adding detectors to the HLV network impacts the detection rate at level, it improves localization prospects and increases the completeness of compact binary surveys. Given uncertainties in sensitivities, participating detectors, and duty cycles, we consider 103 future detector configurations so electromagnetic observers can tailor preparations towards their preferred models.
1 Introduction
Advanced LIGO (Aasi et al., 2015), Advanced Virgo (Acernese et al., 2015), and KAGRA (Akutsu et al., 2019) have enjoyed remarkable success since the first detection of gravitational waves (GWs) from a binary black hole merger in 2015 (Abbott et al., 2016). Since then, analyses by the LIGO-Virgo-KAGRA collaboration (LVK) have uncovered a growing population of binary black holes, binary neutron stars (BNSs), and neutron star - black hole binaries (NSBHs) (Abbott et al., 2019, 2021a, 2021b, 2021c). Analyses of public data (Trovato, 2020) have confirmed many of these detections and hinted at other promising candidates lurking deeper in the noise (Nitz et al., 2019; Magee et al., 2019; Zackay et al., 2019; Venumadhav et al., 2020; Nitz et al., 2020b, 2021; Olsen et al., 2022).
GW observations coincident with other astrophysical signals such as electromagnetic radiation or particles are a highly sought-after subclass of so-called multi-messenger detections. Even before the first detection of GWs, various studies investigated what to expect from electromagnetic follow-up efforts during the Advanced LIGO and Advanced Virgo era (Cannon et al., 2012; Singer et al., 2014). The first multi-messenger detection with GWs, GW170817 (Abbott et al., 2017a, b), was serendipitous in nature, and led to an explosion in works focused on facilitating additional discoveries.
In particular, there has been an increasing focus on early warning (or pre-merger) detection and localization of BNSs and NSBHs (Sachdev et al., 2020; Nitz et al., 2020a; Singh et al., 2021; Yu et al., 2021; Tsutsui et al., 2021; Kovalam et al., 2021). Several of these works, in particular (Sachdev et al., 2020; Nitz et al., 2020a; Singh et al., 2021; Kovalam et al., 2021), focus on BNS detection for the current generation of ground-based detectors, though many optimistically assume a 100% duty cycle and sensitivities that may prove difficult to reach (Akutsu et al., 2019; Washimi et al., 2021). More recently, there has also been a focus on the infrastructure necessary to realize early warning alerts with an emphasis on latencies expected in the LVK’s fourth observing run (O4) (Magee et al., 2021).
In this study, we investigate projected observing scenarios of current generation ground-based detectors for early warning detection using well-established Fisher analysis techniques (Finn & Chernoff, 1993; Finn, 1992; Cutler & Flanagan, 1994; Poisson & Will, 1995; Balasubramanian et al., 1996). We extend previous studies of BNSs in three major ways. First, we estimate the localization for 103 combinations of detectors and detector sensitivities for Advanced LIGO, Advanced Virgo, and KAGRA in O4 as well as at their projected design sensitivity (referred to as O5). Second, we provide the probability density distributions of the 90%-credible sky area as a function of early warning time to enable the consideration of arbitrary network combinations, duty factors, and early warning detection times. We compare our results to similar work previously carried out (Sachdev et al., 2020; Nitz et al., 2020a; Abbott et al., 2020b). Finally, we include the impact that the KAGRA detector would have at three projected and one realized sensitivity in light of recent construction difficulties (Akutsu et al., 2019; Washimi et al., 2021).
2 Methods
Bayesian approaches such as full parameter estimation (Veitch et al., 2015; Ashton et al., 2019) and the bayestar code (Singer & Price, 2016) are presently used to provide the most accurate localizations possible for compact binary mergers. Although full parameter estimation is accurate, it takes . bayestar does not sample over the masses or spins of the binary and is able to provide comparable localizations in when run in parallel (or on a single thread). Singer et al. (2014) showed that the two methods largely agree with each other.
For large trade studies, Fisher analysis methods are often favored since they only depend on the characteristics of the gravitational waveform model and detectors under investigation. They provide a simple and fast way of estimating the information a signal contains on the waveform model’s parameter domain. Here, we use the Fisher analysis-based software package gwbench (Borhanian, 2020) to benchmark the measurement capabilities of 103 detector network configurations detailed in the next section. Since this study is focused on BNS signals which do not merge in the most sensitive bands of current generation detectors, we consistently employ a simple inspiral waveform model, TaylorF2 (Sathyaprakash & Dhurandhar, 1991; Blanchet et al., 1995, 2005; Buonanno et al., 2009) to estimate the expected measurement uncertainties for the following parameters: . These denote the chirp mass, symmetric mass ratio, luminosity distance, coalescence time, coalescence phase, inclination, polarization angle, right ascension, and declination, respectively. Finally, we can estimate the uncertainty in sky localization via the 90%-credible sky area following Cutler (1998) and Barack & Cutler (2004) as
| (1) |
where and are the variances of the right ascension and declination, respectively, and is the covariance between the right ascencion and declination. There are, however, several limitations to Fisher analysis approaches (Vallisneri, 2008; Rodriguez et al., 2013). Most well-known is that they are only valid in the high signal-to-noise ratio (SNR) limit ( per detector) (Vallisneri, 2008). Further, special considerations are necessary while interpreting sky localizations: Fisher analyses estimate the overall uncertainty and therefore cannot estimate proximity of regions of probability in the sky. Additionally, they can exhibit mirror degeneracies (Fairhurst, 2009) and scale differently with the SNR than coherent Bayesian approaches (Berry et al., 2015). As Cannon et al. (2012) noted, Fisher analysis estimates tend to be optimistic. We quantify this bias of our approach in comparison to bayestar in Section 4.1.
We do not impose any single detector SNR thresholds; note that this means low SNRs in one detector can contribute to the network SNR threshold used as a detection criterion. In practice, we expect the bias introduced by this effect to be small. Unless otherwise noted, we assume a network SNR detection threshold of 15. In all cases, we conservatively assume that no localizations can be provided when only one detector is operating.
3 Population and Networks
Binary neutron star population
Although two probable NSBH systems were recently observed by Advanced LIGO and Advanced Virgo (Abbott et al., 2021d), we restrict the analysis here to BNS populations due to uncertainties in the NSBH population and poor early warning and localization prospects for NSBHs. We consider the same astrophysically motivated source population of BNSs as in (Sachdev et al., 2020). The source-frame component masses are drawn from a Gaussian distribution with mean mass and standard deviation . The source-frame masses are further limited such that . This population is modeled after galactic observations of BNS (Özel & Freire, 2016). We note that the masses inferred from GW190425 (Abbott et al., 2020a) are in tension with this population. This could be an indication that galactic measurements are not representative of the broader population of neutron stars. Results from the LVK’s recent population analysis seems to support this claim (Abbott et al., 2021e). We neglect these uncertainties here and naively apply the most recent BNS merger rate estimates (Abbott et al., 2021e) to our population, though we note that (1) our method can be quickly rerun to produce estimates for arbitrary populations, (2) that as pointed out in Nitz et al. (2020a), our results can be scaled to systems of arbitrary mass, and (3) that expected BNS localizations do not appear to significantly depend on the specifics of the population (Pankow et al., 2020).
Networks
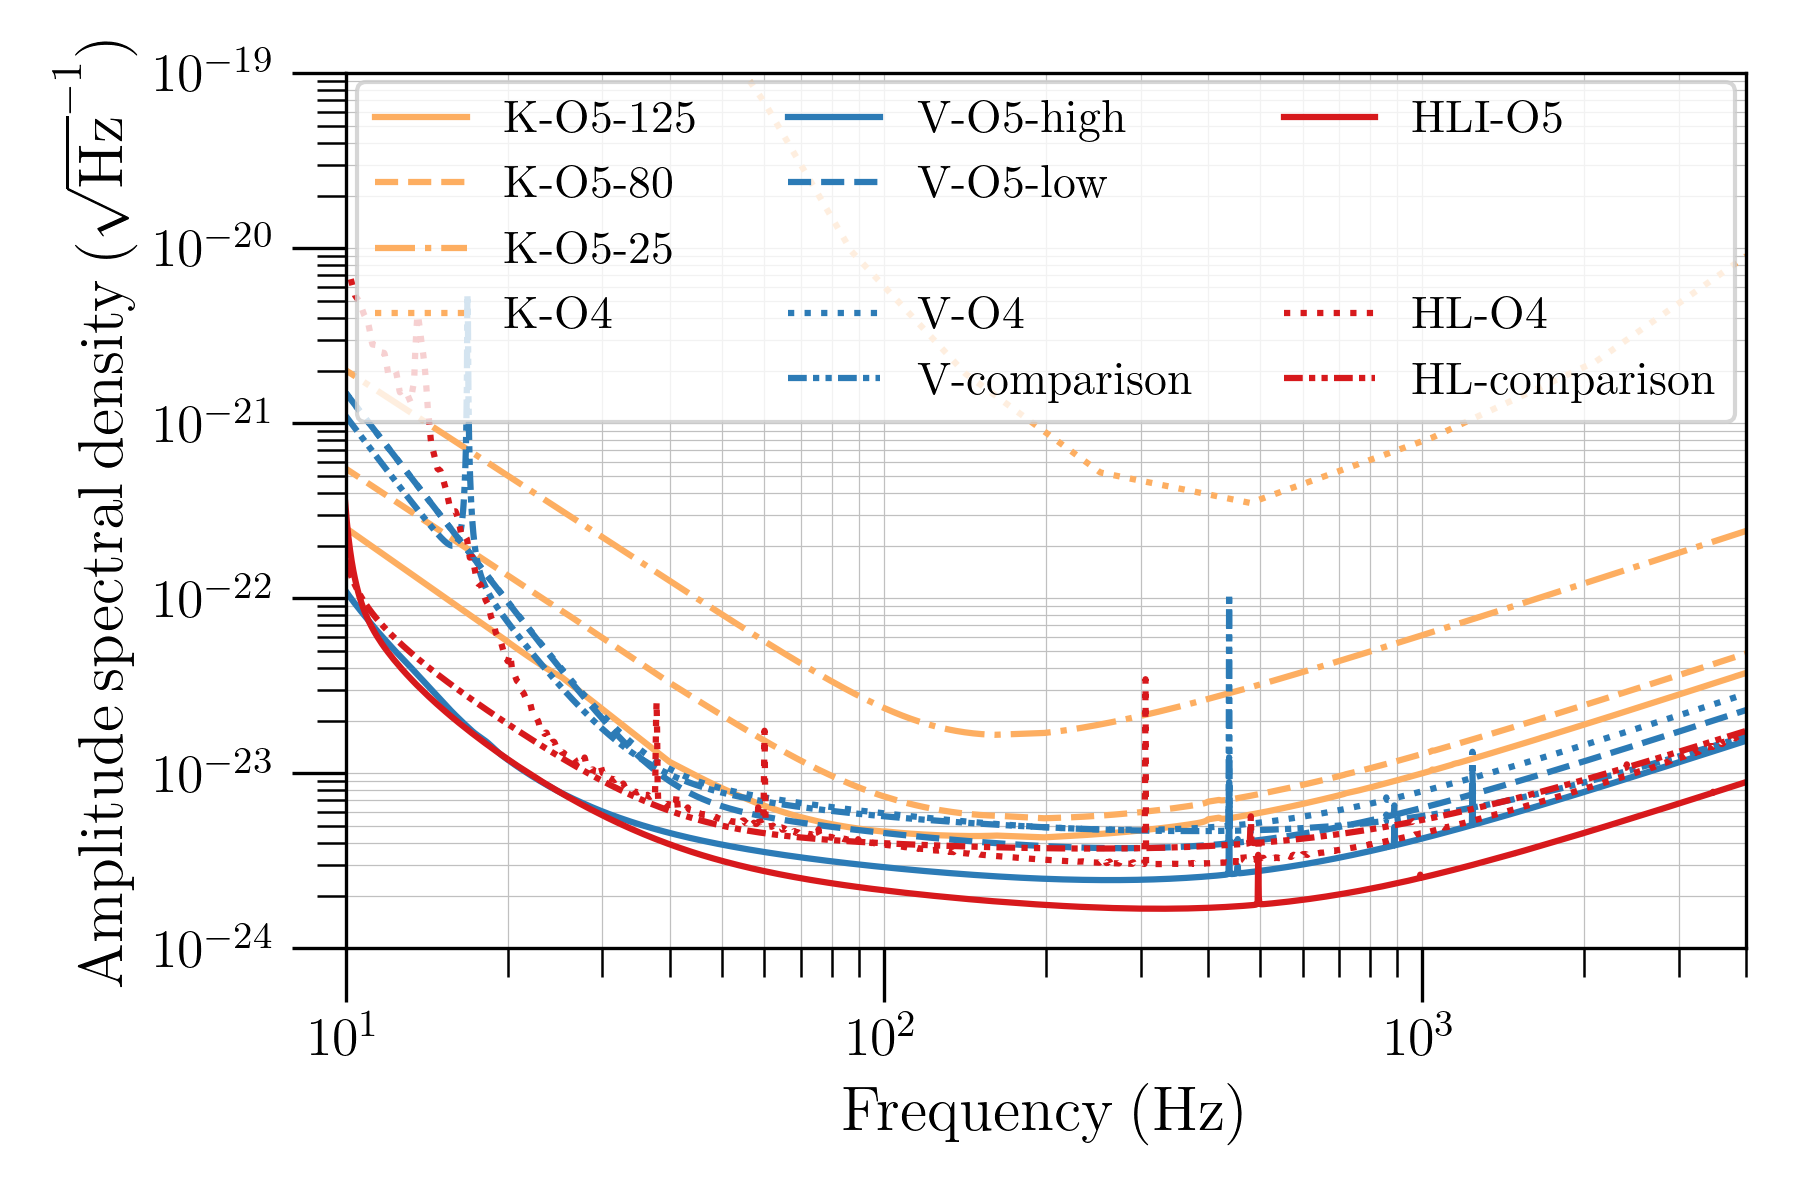
We examine 103 GW detector networks for O4 and O5 that arise from 11 different projected sensitivity curves, summarized in Figure 1. For O4, we consider combinations of Hanford-KAGRA-Livingston-Virgo (HKLV) networks that contain at least two of the HLV detectors, with HLV sensitivities as described in the latest observing scenario111We use the publicly provided PSDs: LIGO-T2000012.. Perhaps the biggest question for O4 is the level to which KAGRA will be able to participate (LVK, 2021). In this work, we consider two possible KAGRA sensitivities for O4 with and BNS detection horizons. We regard this to be a more realistic update to the recent O4 early warning detection and localization estimates provided in Magee et al. (2021) which assumed a horizon of , especially in light of the recent LVK announcement suggesting KAGRA will start O4 with horizon (LVK, 2021). The KAGRA sensitivities were digitized from Figure 1 in Washimi et al. (2021).
For O5, we consider a 5-detector network, AHKLV including LIGO-Aundha (Saleem et al., 2022), previously LIGO-India (Iyer et al., 2011). Following Abbott et al. (2020b), we assume that Aundha, Hanford, and Livingston are all able to achieve comparable sensitivities (e.g. the Advanced LIGO design sensitivity). We compute all network combinations where at least two of the AHLV detectors are operating. We consider two separate, publicly available sensitivities for Virgo, and three sensitivities for KAGRA, assuming that by O5 KAGRA will achieve either , , or BNS detection horizons outlined in the observing scenarios review.
4 Results
4.1 Comparison to known localizations
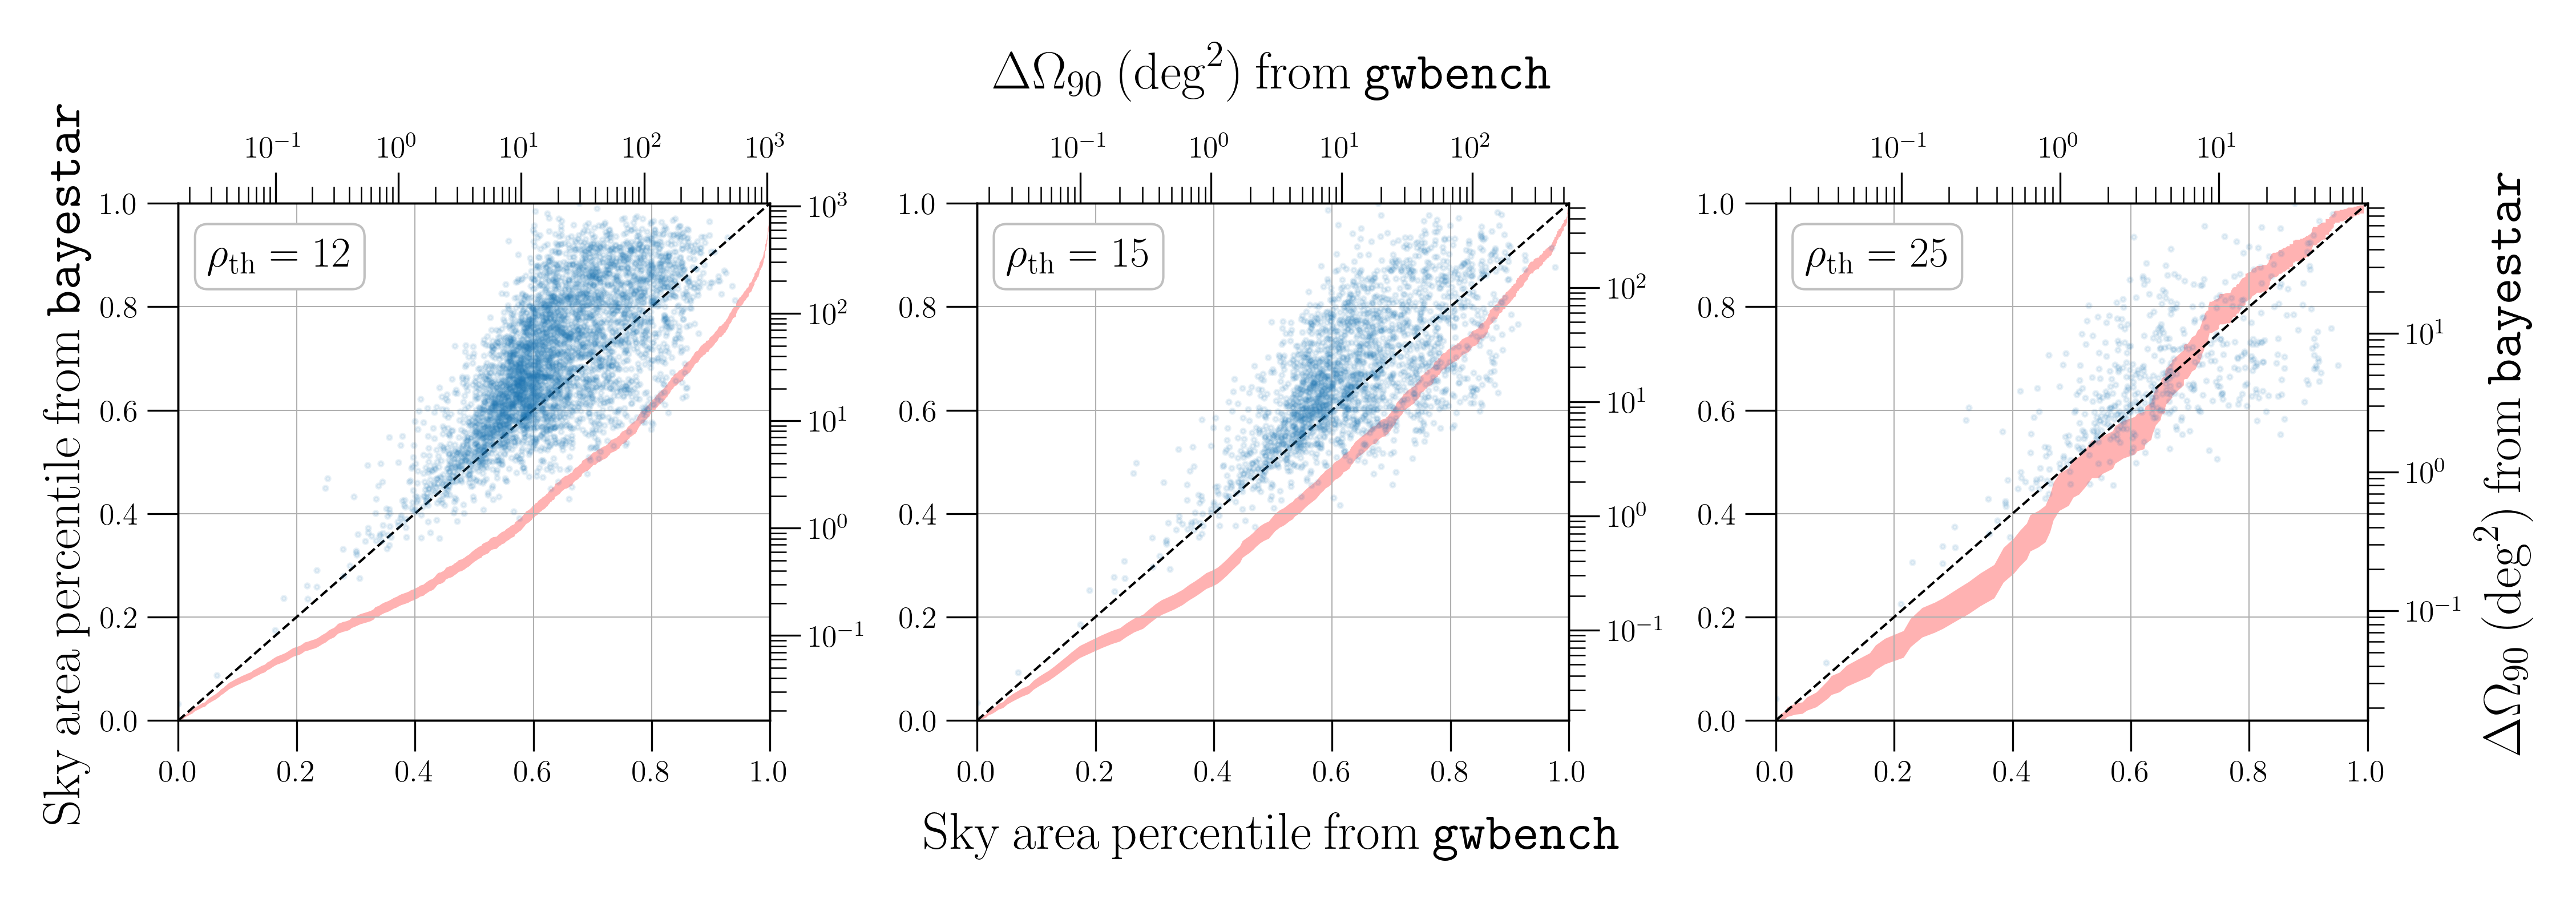
In order to quantify any biases introduced by the Fisher analysis, we compare our localization estimates from gwbench to those computed by bayestar for all simulated signals recovered by the full search presented in Sachdev et al. (2020). Figure 2 shows a comparison of the 90%-credible sky area computed via each method at three network SNRs (right and top axes), together with a -plot comparing the percentiles associated with each localization estimator (left and bottom axes). In general, we find that gwbench and bayestar agree to within a factor of a few depending on the SNR threshold used. At SNR 12, the 50th (90th) percentiles agree to within a factor of (). At SNRs 15 and 25, this improves to () and (), respectively.
Although localizations largely agree on the event-by-event level, we empirically find that at there are significant biases between the expected localization distributions obtained when compared to bayestar. The -plots overlaid in Figure 2 show that, in general, the Fisher analysis systematically underestimates the size of the 90%-credible sky area. This effect lessens in severity as the SNR threshold is increased. For , the bias has mostly disappeared.
We assert that the statistical agreement between the two methods is trustworthy for systems with , and accurate to order of magnitude at lower SNRs. We therefore assume a detection threshold of for the remainder of this work and assume the individual localizations produced are accurate to within a factor of a few.
4.2 O4
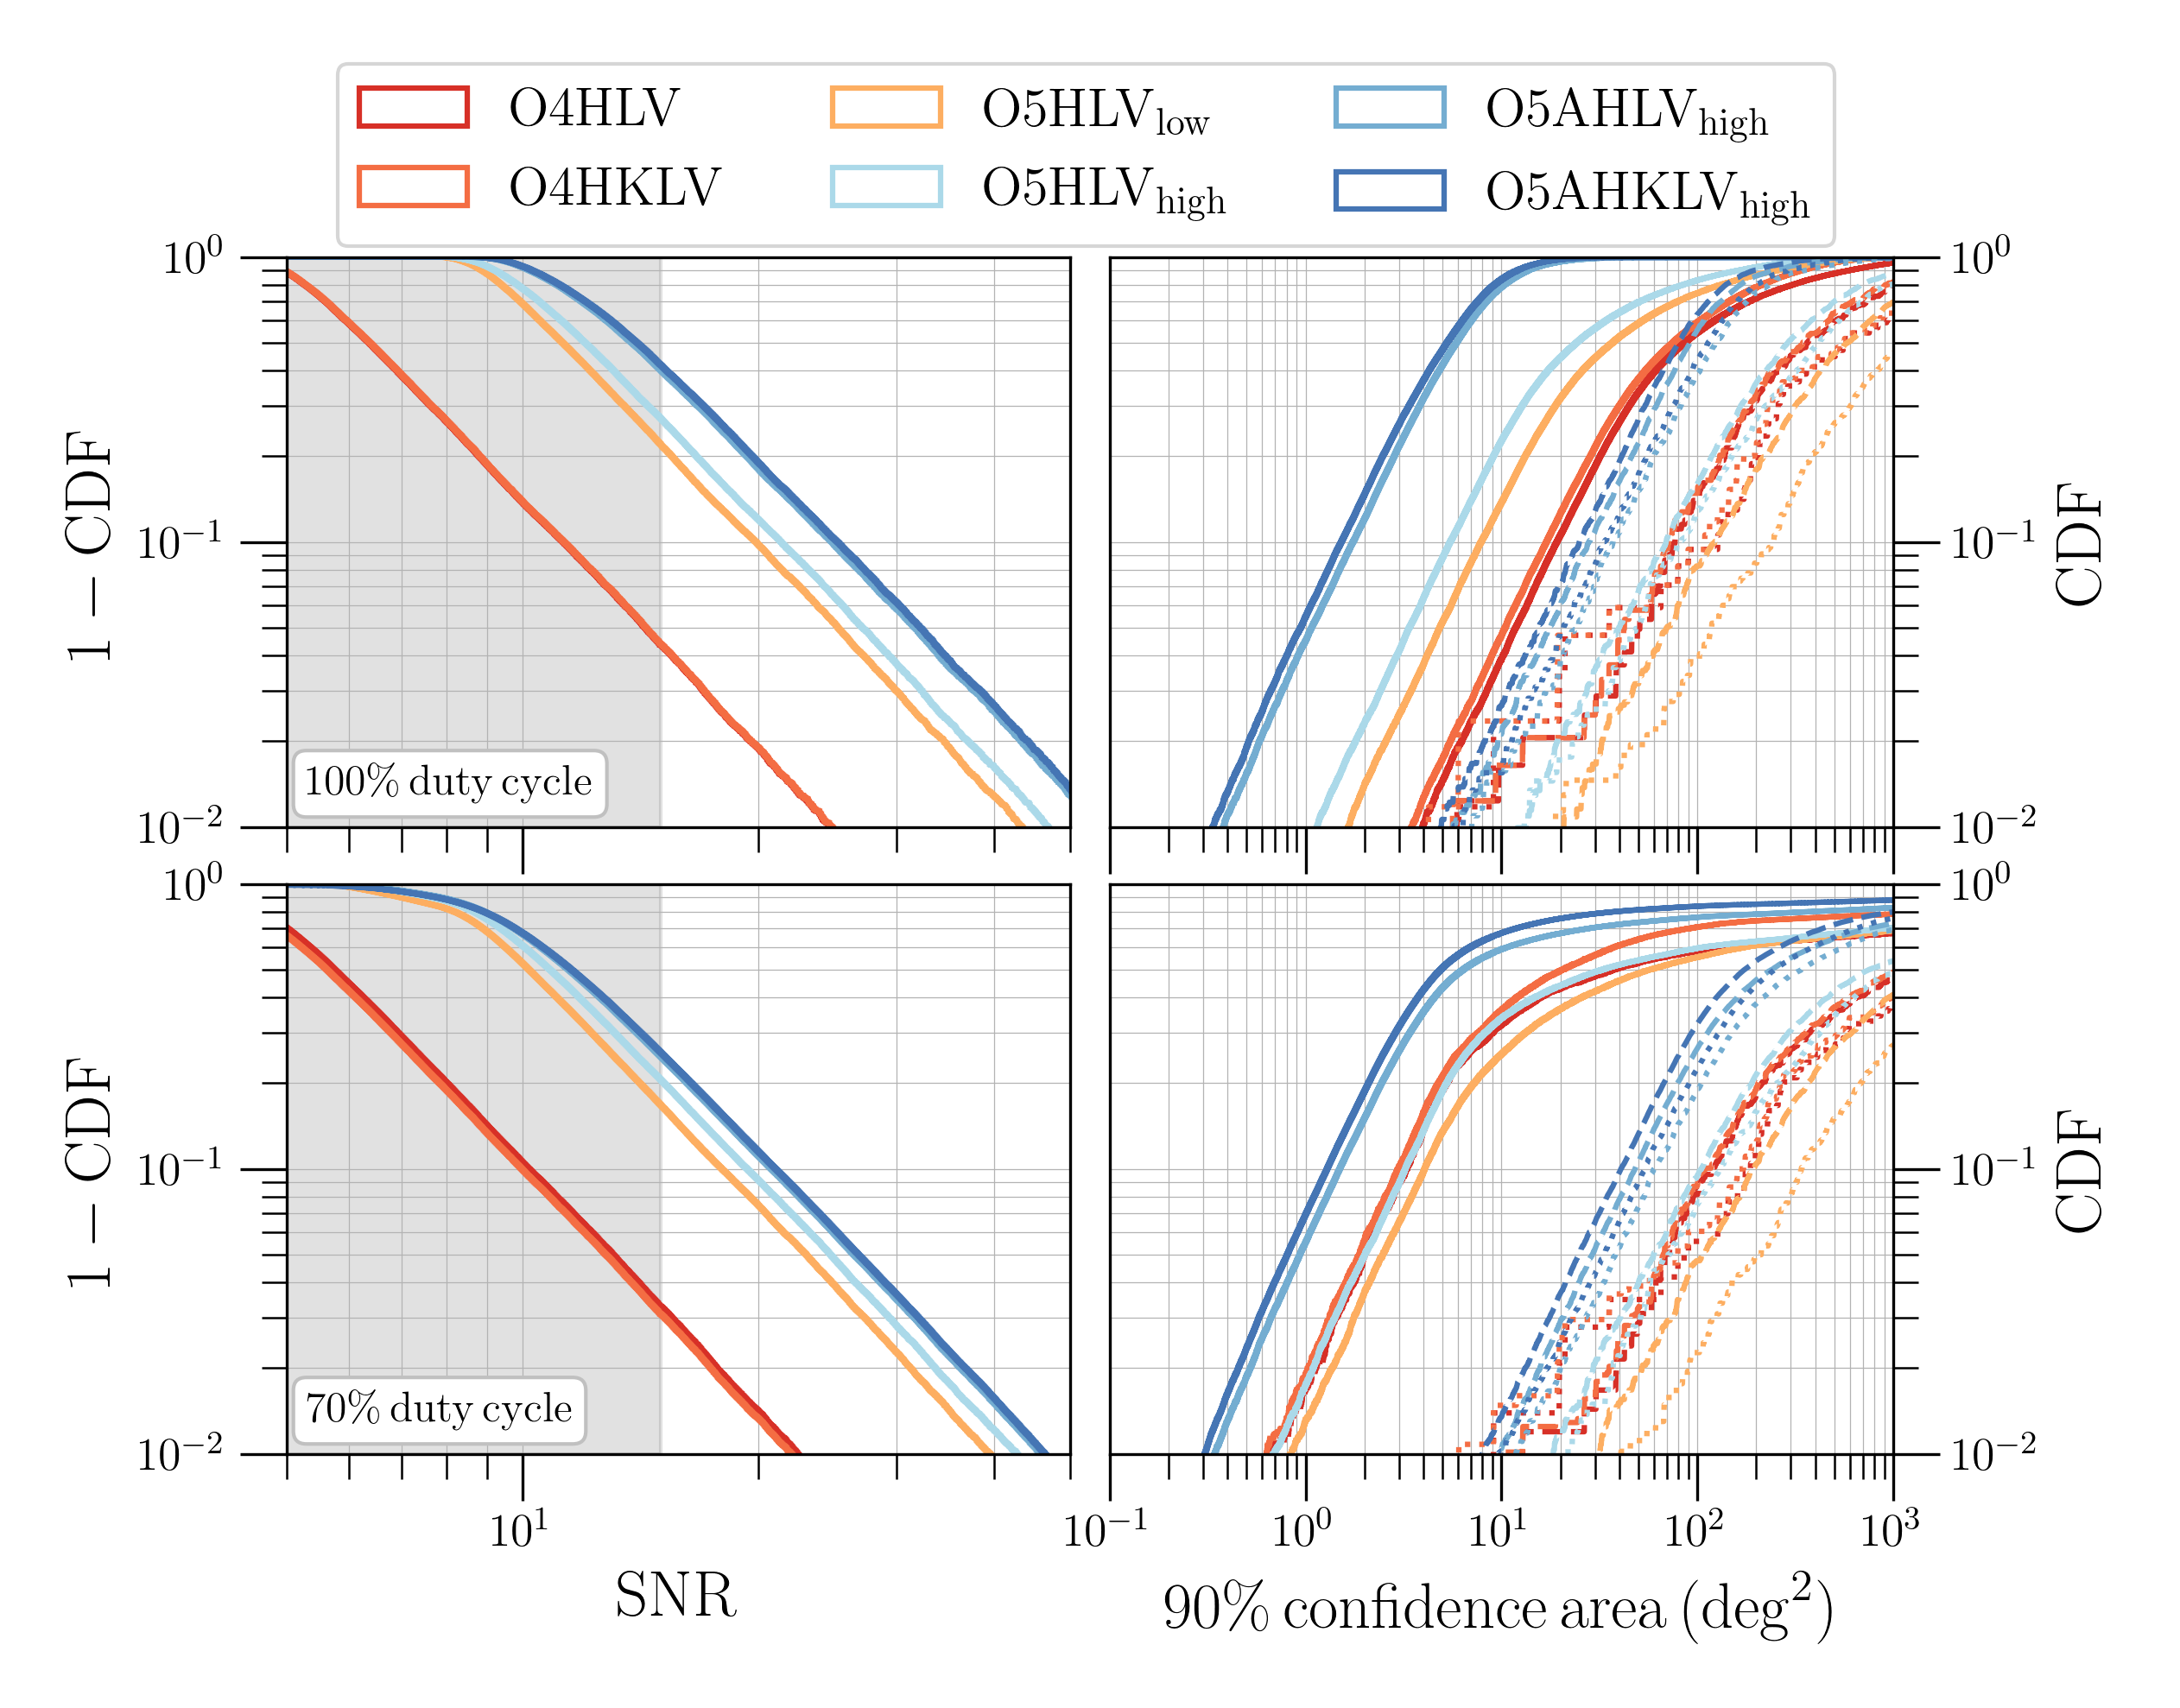
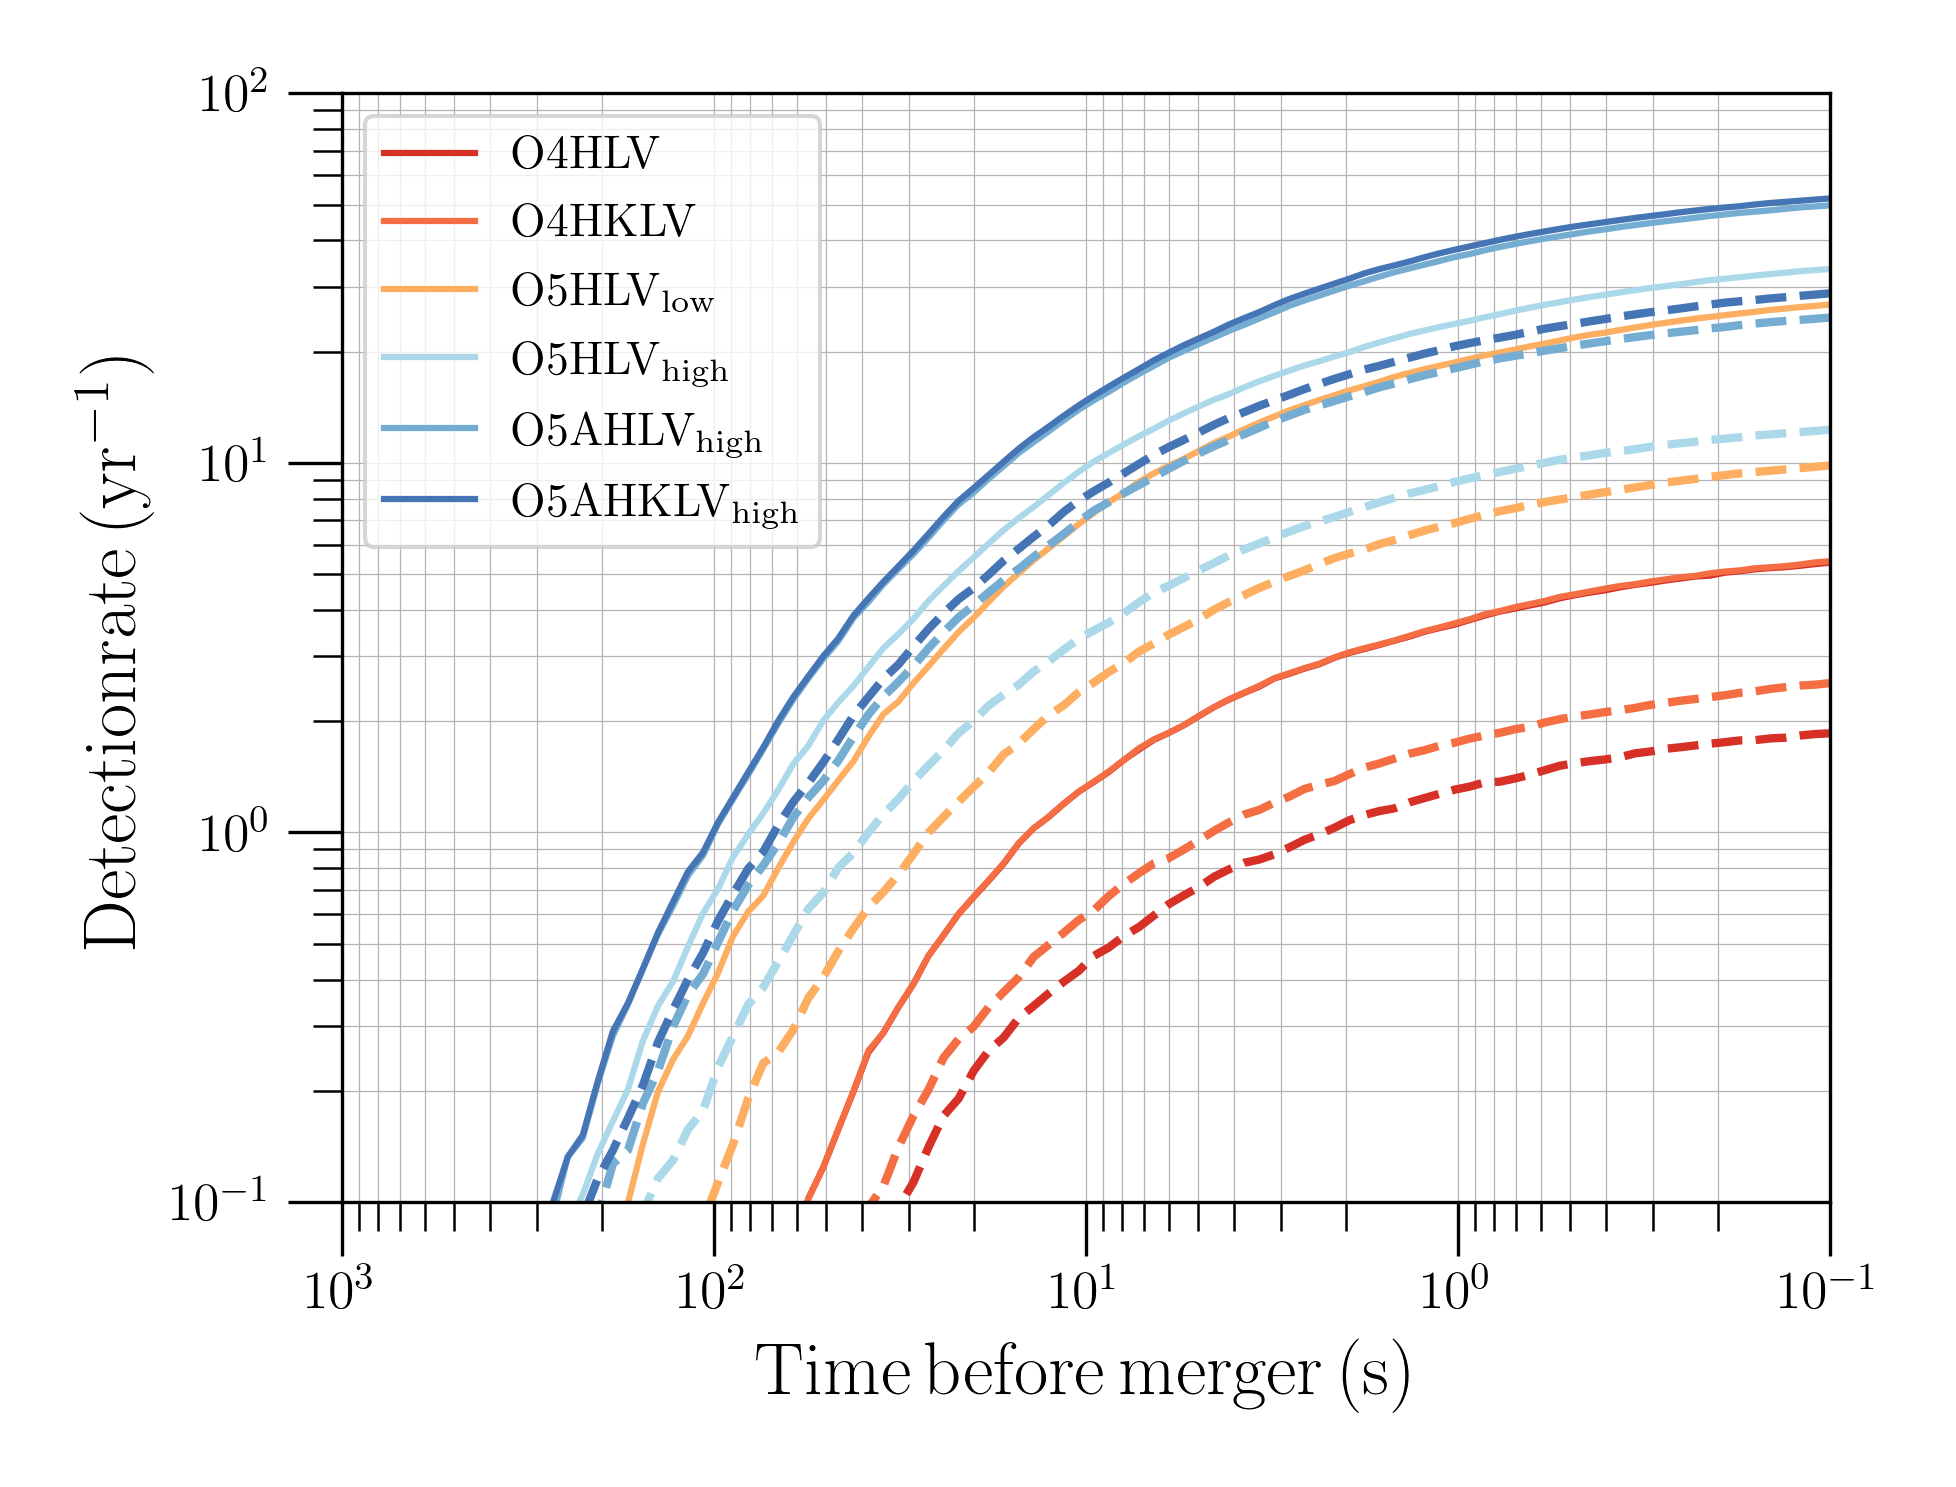
Figures 3 and 4 present the cumulative SNR and localization distributions and the expected yearly early warning detection rates, respectively, for six representative O4 and O5 networks: O4HLV, O4HKLV, , , , and . We highlight two early warning times, and before merger, which are motivated by data analysis latencies (Magee et al., 2021) and approximate slew times.
It was recently announced that KAGRA is expected to join O4 with a horizon of at least (LVK, 2021). As expected, we find that there is no impact on the network sensitivity and negligible impact on the localizations achieved when this HKLV network is compared to HLV. However, if KAGRA is able to reach , we find an average reduction in the 90%-credible sky areas for events with SNR , though the number of expected detections increases at less than the percent level, see Figure 3. Thus while a moderately sensitive KAGRA in O4 will not increase the number of detections, it will greatly improve the localization for existing detections.
As shown in Figure 4, early warning detections in O4 are likely to be exceedingly rare; we expect detection made to be made early enough to overcome analysis latencies (e.g. early) per year. Of these observations, we expect 10 20% to have localizations . The presence/absence of KAGRA has negligible impact on the localization or abundance of early warning detections.
4.3 O5 / Design
For the 3-detector HLV network, we find only a moderate difference in the number of detected events above our SNR threshold as the Virgo sensitivity is varied (left column Figure 3), though the localization distributions noticeably shift. We estimate that up to 20% (13%) of all detected BNS will have 90%-credible sky areas for the high (low) sensitivity Virgo projections. We expect up to 16% (8%) of signals detected early and 13% (%) of signals detected early to be localized to .
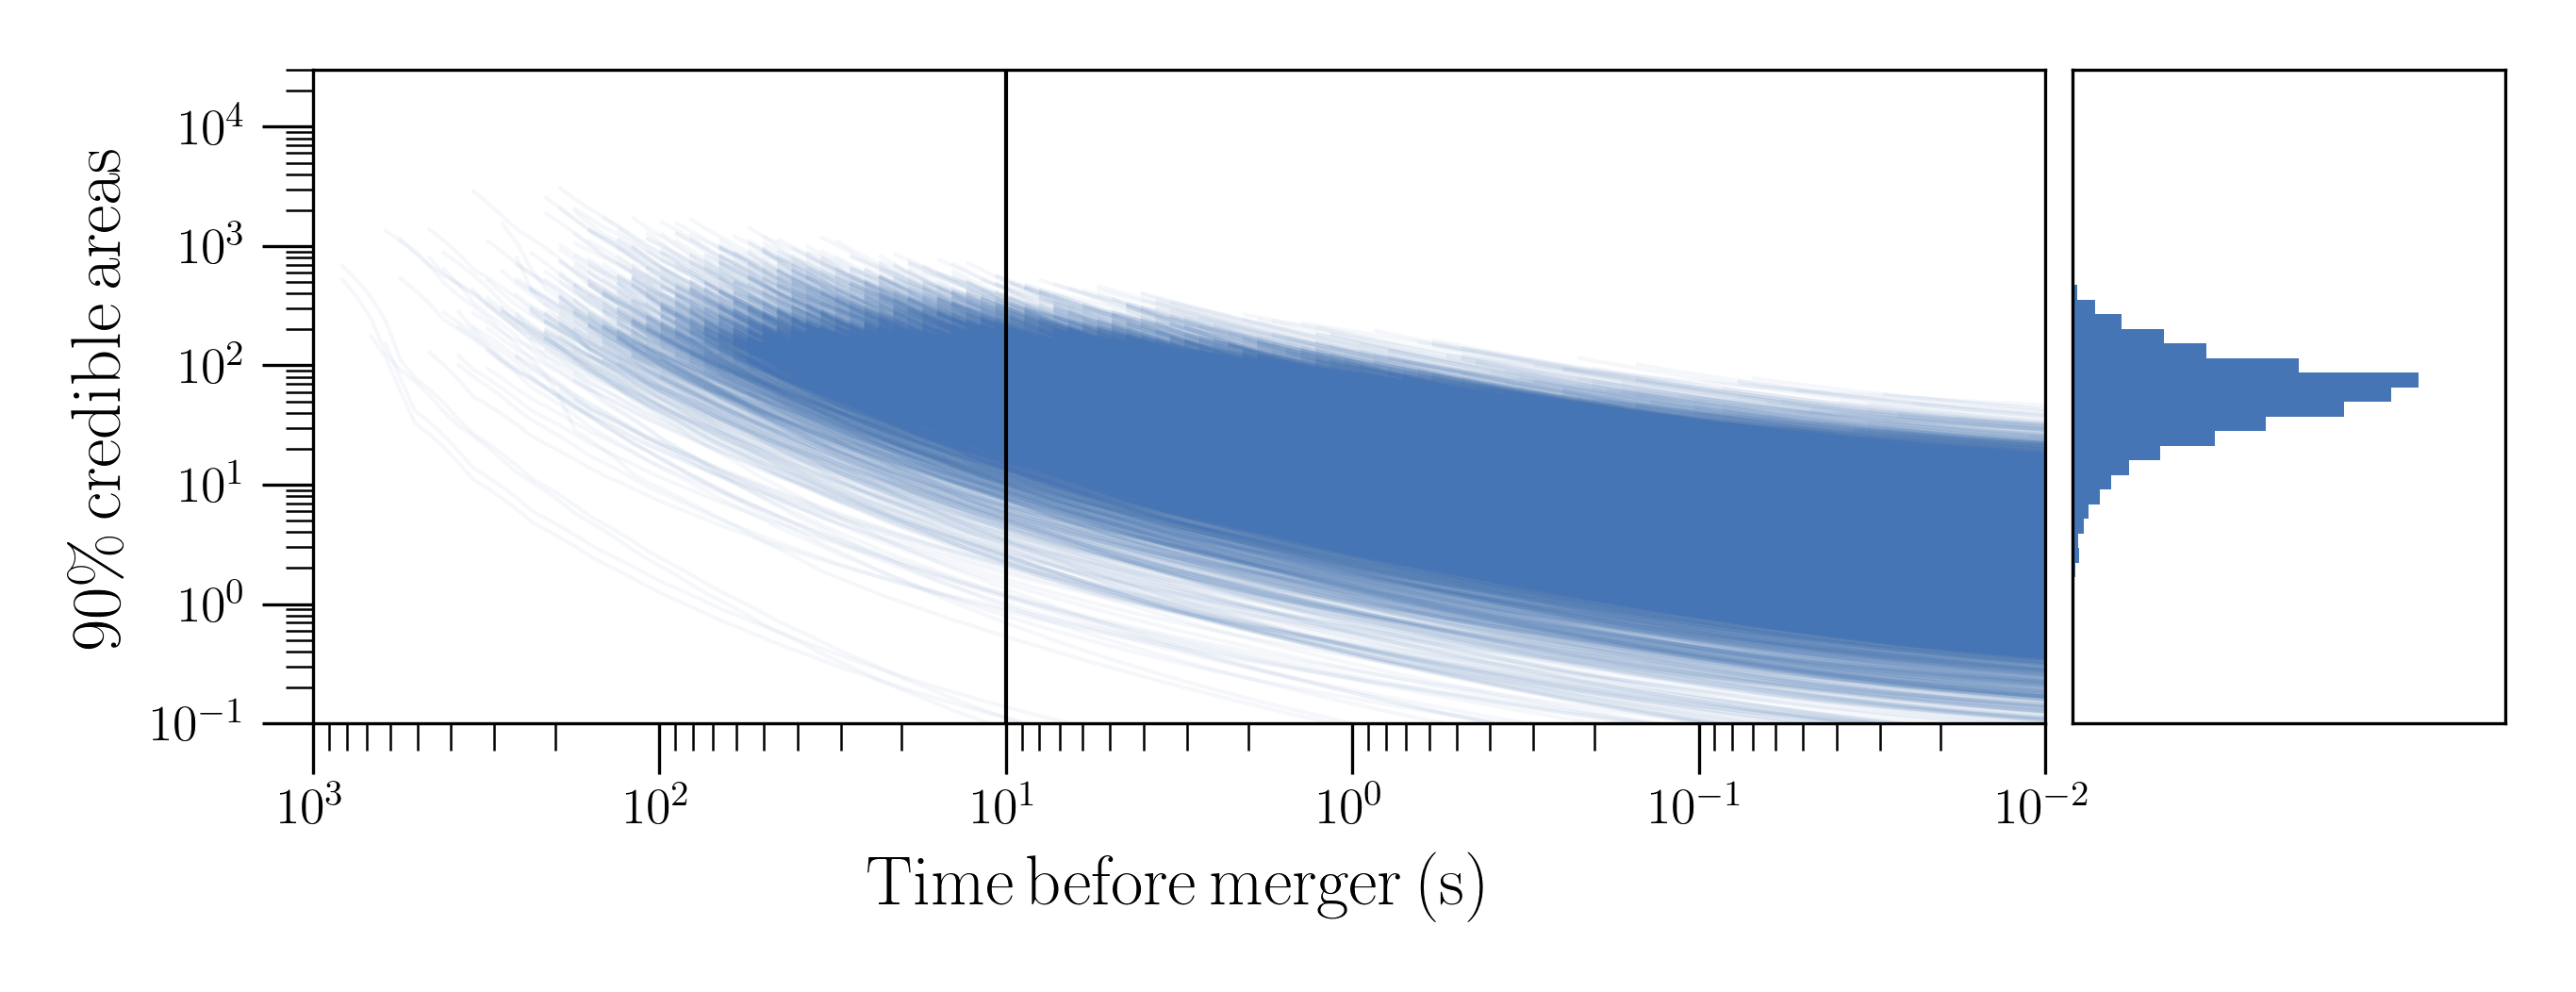
LIGO-Aundha has an even larger impact. Its addition to the HLV network suggests we expect up to 80% of detected BNS to be localized to by merger, dropping to % and %, respectively, and before merger. The addition of KAGRA operating at 125 Mpc has a small impact on both the detection and localization when compared to the AHLV network operating at 100% duty cycle. For this best case network, we also explicitly compute the evolution of the 90%-credible sky areas as a function of time before merger in Figure 5, in addition to the two fiducial early warning times, and , in Figure 3.
4.4 Duty cycle impact on localizations and detections
Included in Figure 3 is a comparison of networks operating at 100% vs 70% duty cycle222Chosen to match the duty cycle in the LVK’s observing scenario document (Abbott et al., 2021e).. The real benefit to networks with a large number of detectors is clear. While at 100% duty cycle there is little difference in localizations produced by 4 and 5-detector networks, there is a large benefit for networks that can only operate at moderate duty cycles. A 4-detector network at 70% duty cycle operates with all 4 detectors only 24% of the time; for a 5-detector network, there are at least 4 detectors active 53% of the time. The extra detector greatly increases the robustness of the global detector network. This effect is well demonstrated by the and curves in the right panels of Figure 3.
The impact on detection is also easily visualized. Figure 4 shows the expected number of detections at a fiducial BNS rate of 470 for networks operating at 100% and 70% duty cycles, respectively. In all scenarios considered, down time decreases the number of expected detections by a factor of a few.
5 Outlook and discussion
Early warning detection will facilitate the capture of prompt, rapidly fading emission associated with BNS mergers. We find that even the most optimistic scenarios for O4 predict BNS detected before merger per year, with localizations . These detections will likely be too poorly localized for optical facilities to follow-up. We expect wide-field observatories such as the Murchinson Wide Field Array (Tingay et al., 2013) and the space-based Fermi Gamma-ray Burst Monitor (Meegan et al., 2009) and Neil Gehrels Swift Observatory (Gehrels et al., 2004) to benefit most from early warning detection with poor localizations. Indeed, new observational modes enabled with the Murchinson Wide Field Array will allow tests of BNSs as possible progenitors of non-repeating fast radio bursts (James et al., 2019), and will probe longstanding predictions tying fast radio bursts to pre-merger magnetosphere interactions (Hansen & Lyutikov, 2001).
Swift’s ability to rapidly localize will facilitate observations of near-merger X-ray emission, and recent Swift/BAT updates (Tohuvavohu et al., 2020) will enable subthreshold gamma-ray burst detections. Prompt X-ray observations could help reveal the immediate aftermath of the coalescing objects, and subthreshold detections could identify off-axis gamma-ray bursts and help probe the jet structure associated with these mergers. Similarly, observations by the Fermi Large Area Telescope would help complete our understanding of high-energy gamma-ray emission; in fact the telescope had powered down just before GRB170817A, which occluded measurements at energies MeV (Kocevski et al., 2017).
By O5, early warning detections will become more common with up to detections made before merger per year. Depending on network configuration and duty cycle, we expect that up to 80% of these will be localized to , making them a prime target for optical facilities that cover , such as the Zwicky Transient Facility (Graham et al., 2019), Dark Energy Camera (Flaugher et al., 2015), and the highly anticipated Vera C. Rubin Observatory (Ivezić et al., 2019). Although previous optical observations were able to capture the kilonova associated with GW170817, it was already fading and clouded a complete understanding of the nature of the blue ejecta (Nicholl et al., 2017; Cowperthwaite et al., 2017). Chase et al. (2021) provides an in depth review of kilonova detectability prospects across multiple observing bands for a selection of current and planned wide field-of-view observatories.
Other works have also estimated sensitivities and localization prospects for early warning detection of BNS for specific sensitivities and 100% duty cycles. We find that when our SNR detection threshold is modified to match those works, we obtain similar results in the 100% duty cycle limit. Sachdev et al. (2020) considered an HLV network operating at design sensitivity, finding that of all detected BNS events will be detected early with localizations . If we impose a detection threshold of SNR 10, corresponding to the top 99% of recovered events in their study, we obtain similar expected localizations. Nitz et al. (2020a) also considered HLV, HKLV, and AHKLV networks from the “design” to “Voyager” eras of ground based detectors. We find that the distributions we present in Figure 3 for the O5HLV and O5AHLV networks are consistent with the distributions they find at SNR 10 in their Figure 3. This is complicated by the fact that we use slightly different sensitivity curves.
The observing scenarios document most recently produced by the LVK (Abbott et al., 2020b) does not consider early warning prospects, but we can compare our early prospects to theirs. Their predictions for O4 considered the same HKLV network at 70% duty cycle with one major difference: KAGRA was assumed to reach 80 Mpc sensitivity. () of detected events were predicted to have 90%-credible sky areas smaller than 20 (5) . We find that this matches our predictions in the bottom right panel of Figure 3 which assumes a detection threshold of SNR 15 and a duty cycle of 70%. If we drop our SNR threshold to 12 to match the observing scenario document, we find slightly poorer constraints, likely attributable to the less sensitive KAGRA used in our network.
Although our results agree with similar studies, we caution that the specifics of the predicted distributions are highly dependent on the SNR threshold used for recovery. As shown in Section 4.1, we expect this method to consistently agree to within a factor of a few at the 50% level though Figure 2 shows that there is bias in the predicted distribution. Our detection threshold of 15 ensures that we 1) conservatively estimate the detection rate and 2) obtain reasonably accurate localization distributions. We have limited our study to the current generation of ground-based detectors, but others have considered early warning prospects for networks that include Cosmic Explorer and the Einstein Telescope (Akcay, 2019; Chan et al., 2018; Nitz & Dal Canton, 2021). We leave further studies of these configurations to future work.
6 Acknowledgments
LIGO was constructed by the California Institute of Technology and Massachusetts Institute of Technology with funding from the National Science Foundation and operates under cooperative agreement PHY-1764464. This paper carries LIGO Document Number LIGO-P2200010. The authors are grateful for computational resources provided by the LIGO Laboratory and supported by National Science Foundation Grants PHY-0757058 and PHY-0823459. SB further acknowledges support from the Deutsche Forschungsgemeinschaft (DFG), project MEMI number BE6301/2-1, and NSF grant PHY-1836779. We thank Surabhi Sachdev for providing a careful review of this manuscript, and BS Sathyaprakash for useful comments. RM gratefully acknowledges productive conversations with Shreya Anand and Derek Davis.
References
- Aasi et al. (2015) Aasi, J., et al. 2015, Class. Quant. Grav., 32, 074001
- Abbott et al. (2016) Abbott, B. P., et al. 2016, Phys. Rev. Lett., 116, 061102
- Abbott et al. (2017a) —. 2017a, Phys. Rev. Lett., 119, 161101
- Abbott et al. (2017b) —. 2017b, Astrophys. J. Lett., 848, L12
- Abbott et al. (2019) —. 2019, Phys. Rev. X, 9, 031040
- Abbott et al. (2020a) —. 2020a, Astrophys. J. Lett., 892, L3
- Abbott et al. (2020b) Abbott, B. P., Abbott, R., Abbott, T., et al. 2020b, Living reviews in relativity, 23, 1
- Abbott et al. (2021a) Abbott, R., et al. 2021a, Phys. Rev. X, 11, 021053
- Abbott et al. (2021b) —. 2021b, arXiv:2108.01045
- Abbott et al. (2021c) —. 2021c, arXiv:2111.03606
- Abbott et al. (2021d) —. 2021d, Astrophys. J. Lett., 915, L5
- Abbott et al. (2021e) —. 2021e, arXiv:2111.03634
- Acernese et al. (2015) Acernese, F., et al. 2015, Class. Quant. Grav., 32, 024001
- Akcay (2019) Akcay, S. 2019, Annalen Phys., 531, 1800365
- Akutsu et al. (2019) Akutsu, T., et al. 2019, Nature Astron., 3, 35
- Ashton et al. (2019) Ashton, G., et al. 2019, Astrophys. J. Suppl., 241, 27
- Balasubramanian et al. (1996) Balasubramanian, R., Sathyaprakash, B., & Dhurandhar, S. 1996, Phys. Rev. D, 53, 3033, [Erratum: Phys.Rev.D 54, 1860 (1996)]
- Barack & Cutler (2004) Barack, L., & Cutler, C. 2004, Phys. Rev. D, 69, 082005
- Berry et al. (2015) Berry, C. P. L., et al. 2015, Astrophys. J., 804, 114
- Blanchet et al. (2005) Blanchet, L., Damour, T., Esposito-Farese, G., & Iyer, B. R. 2005, Phys. Rev., D71, 124004
- Blanchet et al. (1995) Blanchet, L., Damour, T., Iyer, B. R., Will, C. M., & Wiseman, A. 1995, Phys. Rev. Lett., 74, 3515
- Borhanian (2020) Borhanian, S. 2020, arXiv:2010.15202
- Buonanno et al. (2009) Buonanno, A., Iyer, B., Ochsner, E., Pan, Y., & Sathyaprakash, B. S. 2009, Phys. Rev., D80, 084043
- Cannon et al. (2012) Cannon, K., et al. 2012, Astrophys. J., 748, 136
- Chan et al. (2018) Chan, M. L., Messenger, C., Heng, I. S., & Hendry, M. 2018, Phys. Rev. D, 97, 123014
- Chase et al. (2021) Chase, E. A., O’Connor, B., Fryer, C. L., et al. 2021, arXiv:2105.12268
- Cowperthwaite et al. (2017) Cowperthwaite, P. S., et al. 2017, Astrophys. J. Lett., 848, L17
- Cutler (1998) Cutler, C. 1998, Phys. Rev. D, 57, 7089
- Cutler & Flanagan (1994) Cutler, C., & Flanagan, E. E. 1994, Phys. Rev. D, 49, 2658
- Fairhurst (2009) Fairhurst, S. 2009, New J. Phys., 11, 123006, [Erratum: New J.Phys. 13, 069602 (2011)]
- Finn (1992) Finn, L. S. 1992, Phys. Rev. D, 46, 5236
- Finn & Chernoff (1993) Finn, L. S., & Chernoff, D. F. 1993, Phys. Rev. D, 47, 2198
- Flaugher et al. (2015) Flaugher, B., Diehl, H. T., Honscheid, K., et al. 2015, The Astronomical Journal, 150, 150
- Gehrels et al. (2004) Gehrels, N., Chincarini, G., Giommi, P., et al. 2004, The Astrophysical Journal, 611, 1005
- Graham et al. (2019) Graham, M. J., et al. 2019, Publ. Astron. Soc. Pac., 131, 078001
- Hansen & Lyutikov (2001) Hansen, B. M. S., & Lyutikov, M. 2001, Mon. Not. Roy. Astron. Soc., 322, 695
- Ivezić et al. (2019) Ivezić, v., et al. 2019, Astrophys. J., 873, 111
- Iyer et al. (2011) Iyer, B., et al. 2011, LIGO India, Tech. Rep. LIGO-M1100296, https://dcc.ligo.org/LIGO-M1100296/public
- James et al. (2019) James, C. W., Anderson, G. E., Wen, L., et al. 2019, Monthly Notices of the Royal Astronomical Society: Letters, 489, L75
- Kocevski et al. (2017) Kocevski, D., Omodei, N., & Vianello, G. 2017, arXiv:1710.05450
- Kovalam et al. (2021) Kovalam, M., Patwary, M. A. K., Sreekumar, A. K., et al. 2021, arXiv:2112.03597
- LVK (2021) LVK. 2021, O4 Observing Plan Update: https://www.ligo.org/scientists/GWEMalerts.php, ,
- Magee et al. (2019) Magee, R., et al. 2019, Astrophys. J. Lett., 878, L17
- Magee et al. (2021) —. 2021, Astrophys. J. Lett., 910, L21
- Meegan et al. (2009) Meegan, C., Lichti, G., Bhat, P. N., et al. 2009, ApJ, 702, 791
- Nicholl et al. (2017) Nicholl, M., et al. 2017, Astrophys. J. Lett., 848, L18
- Nitz et al. (2019) Nitz, A. H., Capano, C., Nielsen, A. B., et al. 2019, Astrophys. J., 872, 195
- Nitz et al. (2021) Nitz, A. H., Capano, C. D., Kumar, S., et al. 2021, arXiv:2105.09151
- Nitz & Dal Canton (2021) Nitz, A. H., & Dal Canton, T. 2021, Astrophys. J. Lett., 917, L27
- Nitz et al. (2020a) Nitz, A. H., Schäfer, M., & Dal Canton, T. 2020a, Astrophys. J. Lett., 902, L29
- Nitz et al. (2020b) Nitz, A. H., Dent, T., Davies, G. S., et al. 2020b, Astrophys. J., 891, 123
- Olsen et al. (2022) Olsen, S., Venumadhav, T., Mushkin, J., et al. 2022, arXiv:2201.02252
- Özel & Freire (2016) Özel, F., & Freire, P. 2016, Ann. Rev. Astron. Astrophys., 54, 401
- Pankow et al. (2020) Pankow, C., Rizzo, M., Rao, K., Berry, C. P. L., & Kalogera, V. 2020, Astrophys. J., 902, 71
- Poisson & Will (1995) Poisson, E., & Will, C. M. 1995, Phys. Rev. D, 52, 848
- Rodriguez et al. (2013) Rodriguez, C. L., Farr, B., Farr, W. M., & Mandel, I. 2013, Phys. Rev. D, 88, 084013
- Sachdev et al. (2020) Sachdev, S., et al. 2020, Astrophys. J. Lett., 905, L25
- Saleem et al. (2022) Saleem, M., et al. 2022, Class. Quant. Grav., 39, 025004
- Sathyaprakash & Dhurandhar (1991) Sathyaprakash, B. S., & Dhurandhar, S. V. 1991, Phys. Rev., D44, 3819
- Singer & Price (2016) Singer, L. P., & Price, L. R. 2016, Phys. Rev. D, 93, 024013
- Singer et al. (2014) Singer, L. P., et al. 2014, Astrophys. J., 795, 105
- Singh et al. (2021) Singh, M. K., Kapadia, S. J., Shaikh, M. A., Chatterjee, D., & Ajith, P. 2021, Mon. Not. Roy. Astron. Soc., 502, 1612
- Tingay et al. (2013) Tingay, S. J., Goeke, R., Bowman, J. D., et al. 2013, Publications of the Astronomical Society of Australia, 30, e007
- Tohuvavohu et al. (2020) Tohuvavohu, A., Kennea, J. A., DeLaunay, J., et al. 2020, Astrophys. J., 900, 35
- Trovato (2020) Trovato, A. 2020, PoS, Asterics2019, 082
- Tsutsui et al. (2021) Tsutsui, T., Nishizawa, A., & Morisaki, S. 2021, arXiv:2107.12531
- Vallisneri (2008) Vallisneri, M. 2008, Phys. Rev. D, 77, 042001
- Veitch et al. (2015) Veitch, J., et al. 2015, Phys. Rev. D, 91, 042003
- Venumadhav et al. (2020) Venumadhav, T., Zackay, B., Roulet, J., Dai, L., & Zaldarriaga, M. 2020, Phys. Rev. D, 101, 083030
- Washimi et al. (2021) Washimi, T., Yokozawa, T., Tanaka, T., et al. 2021, Class. Quant. Grav., 38, 125005
- Yu et al. (2021) Yu, H., Adhikari, R. X., Magee, R., Sachdev, S., & Chen, Y. 2021, arXiv:2104.09438
- Zackay et al. (2019) Zackay, B., Venumadhav, T., Dai, L., Roulet, J., & Zaldarriaga, M. 2019, Phys. Rev. D, 100, 023007