∎
e1E-mail: alexey.lokhov@wwu.de
Background reduction at the KATRIN experiment by the shifted analysing plane configuration
Abstract
The KATRIN experiment aims at measuring the electron neutrino mass with a sensitivity of 0.2 eV after five years of data taking. Recently a new upper limit for the neutrino mass of 0.8 eV (90% CL) was obtained. To reach the design sensitivity, a reduction of the background rate by one order of magnitude is required. The shifted analysing plane (SAP) configuration exploits a specific shaping of the electric and magnetic fields in the KATRIN main spectrometer to reduce the spectrometer background by a factor of two. We discuss the general idea of the SAP configuration and describe the main features of this novel measurement mode.
Keywords:
neutrino mass KATRIN background1 Introduction
The three neutrinos are the only particles in the standard model of particle physics with unknown absolute masses. The difficulty in measuring the neutrino masses comes from the fact that they are more than five orders of magnitude smaller than the mass of an electron and that neutrinos are neutral particles participating in weak interactions only. Since neutrino oscillation experiments prove that neutrinos have a mass, but only allow determining differences between the squared masses of the different neutrino mass eigenstates, other methods need to be applied. To assess the sum of the three neutrino masses, cosmological observables, mainly from the cosmic microwave background and baryon acoustic oscillation measurements, are investigated ref:Planck . Searches for neutrinoless double beta decay provide a way to define whether the neutrino is a Dirac or Majorana fermion and are also able to determine an effective mass value if neutrinos are Majorana particles ref:CUORE ; ref:GERDA ; ref:EXO ; ref:Kamland . Here are the mixing matrix elements and are the masses of the corresponding eigenstates. Both aforementioned methods are, however, model-dependent. Direct neutrino mass measurements exploit the kinematics of weak processes (-decay, electron capture) enabling a model-independent determination of the effective electron neutrino mass squared ref:Formaggio2021 ; ref:Drexlin2013 .
Such kinematics-based measurements study the shape of the energy spectrum of -decay or electron capture processes and require high statistics and high energy resolution combined with very low experimental background rates. These requirements are fulfilled in the KATRIN experiment, which has recently obtained a new upper limit on the neutrino mass of 0.8 eV (90% CL) after its first two neutrino mass measurement campaigns ref:KNM1PRL ; ref:KNM1PRD ; ref:KNM2 .
The ultimate sensitivity of KATRIN of 0.2 eV (90% CL) within 3 years of total measurement time requires a background rate of mcps ref:TDR while – after multiple rounds of improvements – the current background rate of 220 mcps with 117 out of 148 pixels ref:KNM2 still exceeds this requirement by more than an order of magnitude. Applying the simple scaling laws given in ref:TDR (footnote 34) and in ref:Ott08 (equation 48), the statistical sensitivity to the neutrino mass is reduced due to the higher background by about a factor of 1.4. Therefore, additional background reduction measures are required. An effective approach using the so-called shifted analysing plane (SAP) configuration is discussed in this paper and allows to reduce the background by about a factor two w.r.t. the nominal operating mode.
This paper is structured as follows. Section 2 summarizes briefly the KATRIN experiment, focusing on the working principle of the main spectrometer. In section 3 KATRIN’s main background sources are presented. In section 4 the new SAP configuration is explained and characterised via the electromagnetic field simulations and first measurements of the background rate in this mode. Section 5 discusses briefly the implications of the new measurement mode to the neutrino mass measurements. Our conclusions are given in section 6.
2 KATRIN’s working principle
The KATRIN experiment uses a high-luminosity gaseous molecular tritium source ( Bq) combined with a high-resolution electron spectrometer providing an energy resolution of eV. The beta decay electrons are guided by strong magnetic fields towards the spectrometer while the tritium flow is reduced by 14 orders of magnitude using differential and cryogenic pumping techniques ref:DPS . The spectrometer of MAC-E-Filter (Magnetic Adiabatic Collimation with Electrostatic Filter) type acts as a high pass filter for the electrons. By scanning the retardation voltage of the spectrometer, the filter energy is varied around the tritium beta endpoint of 18.6 keV. The electrons that are transmitted by the spectrometer are counted by a 148-pixel silicon PIN-diode focal plane detector ref:FPD .
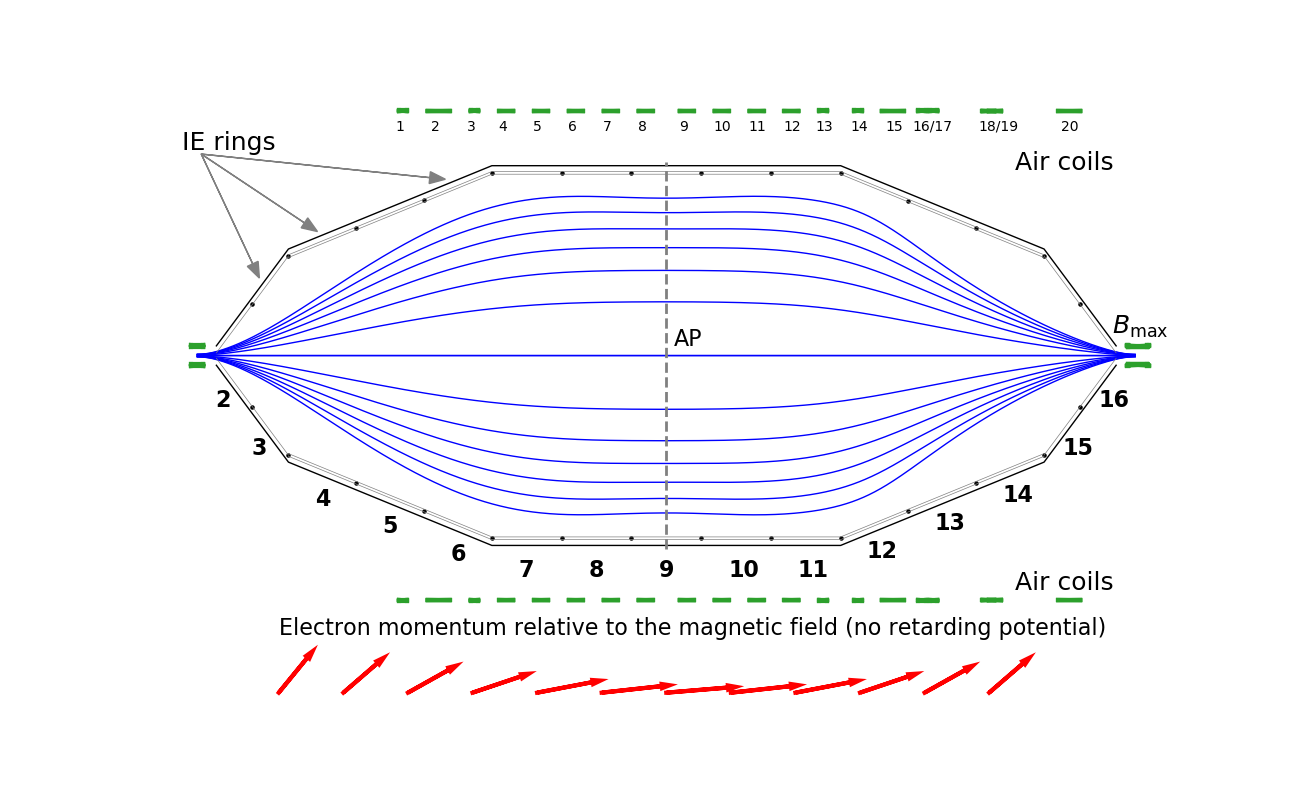
In order to understand the new SAP background reduction method, we have to discuss the working principle of the KATRIN spectrometer in more detail, see Fig. 1. On the way from the spectrometer entrance (left in Fig. 1) to the analysing plane (dashed gray line, AP), where the electric retarding potential for a particle of a charge and a retarding voltage reaches its maximum, the magnetic field, created by two superconducting solenoids at the entrance (left) and the exit (right) of the spectrometer, is reduced by four orders of magnitude (solid blue lines in Fig. 1 show several magnetic field lines). The electrons are guided adiabatically by the magnetic field leading to a constant orbital magnetic moment , which is (in the non-relativistic limit) given by the field strength and the energy due to transverse motion
| (1) |
Therefore, the momenta of the electrons become aligned () with the magnetic field lines in the area of the weak magnetic field (lower part of Fig. 1, red solid arrows), while the total kinetic energy is conserved. Because of the conservation of orbital magnetic moment, see Eq. (1), the maximum electron energy due to transverse motion in the analysing plane and therefore the width of the transmission function (energy or filter width) of the spectrometer amounts to:
| (2) |
where labels the magnetic field in the analysing plane and the maximum magnetic field encountered in the beamline, which is produced by the pinch magnet at the exit of the spectrometer, see Fig. 1.
The electric retarding potential superimposed on the magnetic field reduces the kinetic energy of the electrons and reflects the ones with an insufficient starting kinetic energy. The maximum of the retarding potential and the minimum of the absolute magnetic field define the above-mentioned analysing plane – a virtual surface where the electrons with different starting pitch angles to the magnetic field lines have the smallest , the energy due to the motion in the direction of the magnetic field (solid blue magnetic field lines in Fig.1).
The electric potential profile within the KATRIN main spectrometer is defined by the voltages applied to the spectrometer vessel and the inner electrodes (IE) that consist of several rings of wire modules lining the inside of the vessel and allow for fine-tuning of the electric retarding potential inside the spectrometer ref:IE ; ref:TDR2 . The magnetic flux tube is shaped by the superconducting magnets of the KATRIN beam line and a system of air coils around the main spectrometer ref:FG2013 ; ref:AC . The system of 20 air coils along the beam axis can provide an axially symmetric magnetic field in the range of 0-2 mT and allows for a fine-tuning of the magnetic field at various positions along the axis. In the nominal configuration the analysing plane is located in the middle of the spectrometer (dashed gray line, Fig.1). Using different currents of the air coils and different potentials applied to the IE, the analysing plane can be moved to a different position along the beam axis.
3 KATRIN background sources
The main sources of KATRIN background were extensively studied over the last years. All except one background source are successfully mitigated using passive or active countermeasures.
Background events induced in the vessel walls by cosmic muons are efficiently suppressed by electrostatic and magnetic shielding. The electrostatic shielding is provided by a potential difference of -200 V between the inner electrodes and the spectrometer vessel. Electrons produced near the spectrometer walls are also reflected by the Lorentz force back to the walls ref:muon . With active electrostatic and magnetic shielding the external gamma radioactivity has been proven to make only a minor contribution to the total background rate of KATRIN ref:gamma , at less than mcps.
A contribution of the Penning trap between the main spectrometer and the pre-spectrometer to the background rate was studied in detail and a dedicated electron catcher system is used to remove trapped electrons from the inter-spectrometer region ref:penning . To avoid time-dependent background rate of the Penning trap ref:KNM1PRD ; ref:KNM2 the pre-spectrometer was grounded in the later measurement campaigns. The focal-plane detector of KATRIN contributes mcps to the background rate due to radioactivity and cosmic muons. This background is reduced to mcps by applying stricter energy cuts and by using a muon veto ref:FPD .
A part of the background events is caused by short-lived 220Rn and 219Rn atoms emanating from the material of non-evaporable getter (NEG) pumps mounted inside the pump-ports of the spectrometer and from the walls of the main spectrometer. The neutral radon atoms propagate into the spectrometer volume and decay producing primary electrons with energies in the range of eV ref:wandkowski . The high energy electrons are magnetically trapped between the two superconducting solenoids at the entrance and the exit of the spectrometer. They scatter on the residual gas in the volume, thereby producing secondary electrons that may eventually reach the detector. The radon-induced background component is substantially suppressed by introducing LN2-cooled copper baffles in front of the NEG pumps which prevent radon atoms from reaching the spectrometer volume ref:goerhardt . The baffle system has been shown to have about % efficiency ref:Harms , not quite eliminating this background. The radon-induced background counts do not follow a Poisson distribution due to the time correlation between the secondary events in a cluster of counts produced in a short time by the same primary electron. This non-poissonian behaviour leads additionally to an effective increase of statistical fluctuations and reduces the sensitivity of the neutrino mass measurement ref:KNM1PRL ; ref:KNM1PRD ; ref:KNM2 .
The remaining and thus now dominating component of the main spectrometer background is thought to be related to -decays in the spectrometer walls, causing neutral particles to propagate into the spectrometer volume ref:Rydberg . Under this hypothesis the highly excited (Rydberg) states of atoms (mostly hydrogen) are sputtered from the walls due to -decays of 210Po, the daughter isotope of the long-lived isotope 210Pb ( yr) that had been implanted in the spectrometer vessel walls by 222Rn decays during the installation of the inner electrode inside the spectrometer under ambient air circulation. The -decay of 210Po produces 206Pb recoil ions with high momentum, which can sputter off atoms from the walls creating atoms in excited and ionised states and, thus, also Rydberg states. Being neutral, these atoms can propagate into the volume of the spectrometer. There is a certain probability for the Rydberg states to be ionised by thermal radiation from the vessel walls which are kept at a nominal temperature of C. This mechanism produces electrons with energies of the order of meV, nearly homogeneously distributed within the main spectrometer volume. These “Rydberg electrons” are accelerated by the electric field of the main spectrometer either towards the source or towards the detector, depending whether they are created upstream or downstream of the analysing plane, see Fig. 2. The Rydberg electrons produced near the analysing plane will be accelerated to a kinetic energy of with being the retarding potential in the analysing plane. Therefore, those Rydberg electrons are energetically indistinguishable from the detected signal electrons, which have energies of and slightly above in the scans of the -spectrum.
Assuming a homogeneous distribution of Rydberg atoms within the volume of the main spectrometer, the number of background electrons produced via the ionisation of the Rydberg atoms and counted at the detector is proportional to the volume of the “downstream flux tube”, the volume of the flux tube between analyzing plane and detector, that is mapped to the detector (see Fig. 2).
The next section describes a novel configuration of the electromagnetic field that leads to a substantial reduction of the downstream flux tube volume and therefore a reduction of the background electron rate of the KATRIN main spectrometer.
4 Shifted analysing plane configuration
The total magnetic flux of 134 Tcm2 transported from the tritium source to the spectrometer and the detector of KATRIN is a conserved quantity along the beamline and the profile of the magnetic field (the component in the direction of the spectrometer central axis ) defines the maximal radius of the flux tube at any position in the spectrometer. The basic idea of the shifted analysing plane configuration is to reduce the volume-dependent background rate from Rydberg electrons by reducing the effective volume of the downstream flux tube in the main spectrometer.
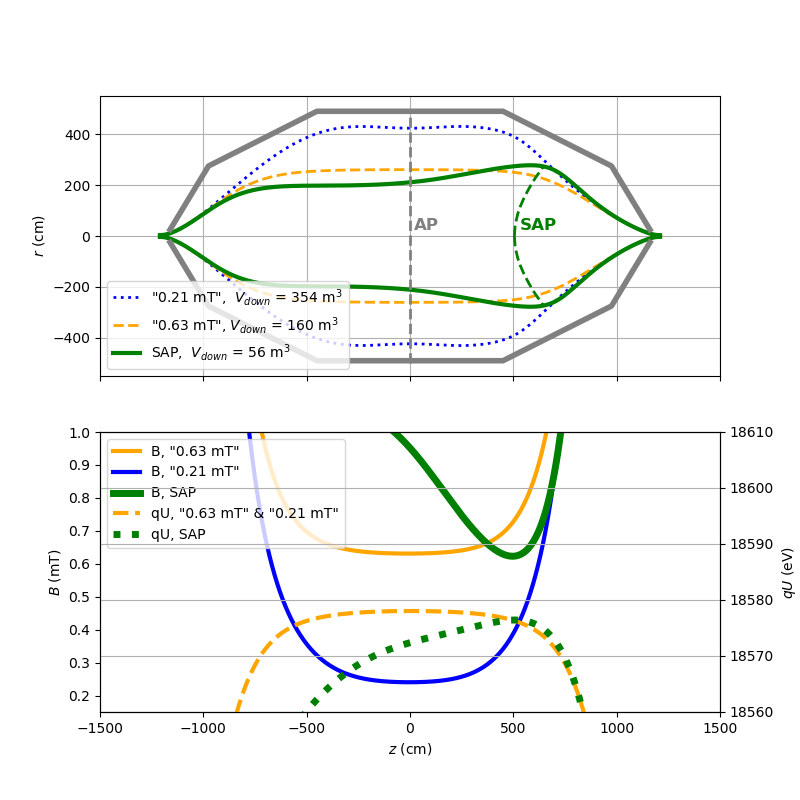
During the first commissioning run of KATRIN ref:FT the magnetic field in the analysing plane was increased from 0.21 mT (Fig. 2, blue) to 0.63 mT (Fig. 2, orange) with the help of the air coil system surrounding the spectrometer vessel ref:Erhard18 in order to reduce the volume of the downstream flux tube from 341 m3 to 160 m3 and, thus, the background rate from about 0.6 cps to a level of about 0.3 cps. This setting was used for the first neutrino mass measurements of KATRIN ref:KNM1PRL ; ref:KNM1PRD ; ref:KNM2 .
The set point of the magnetic field (0.63 mT) in the analysing plane was chosen to balance the statistical uncertainty gain coming from the reduced spectrometer background and the uncertainty increase due to a worse filter width of the spectrometer at higher magnetic fields in the analysing plane, see Eq. 2. The filter width is reduced to eV compared to the design value of 0.93 eV in the nominal setting ref:TDR . An additional constraint comes from the systematic uncertainties of the knowledge of the magnetic fields, derived from a difference between the simulated magnetic field and the one measured by a system of magnetometers ref:Let18 ; ref:TDR2 .
In the nominal configuration of KATRIN the analysing plane is placed in the center of the main spectrometer. This setting provides several advantages ref:TDR ; ref:TDR2 . It allows for the largest possible diameter of the magnetic flux tube and therefore for a small relative filter width and for a small spatial variation of the fields. The nominal configuration provides very shallow minima of the magnetic field and retarding potential stretching over the central part of the spectrometer. Even more importantly, in such a symmetric configuration, the minimum of the magnetic field and the maximum of the absolute retarding potential coincide with the minimum of - the electron’s kinetic energy due to motion in the direction of the magnetic field - for all radii and regardless of the start pitch angle of the electron in the source ref:FG2013 . If the minima are not the same for electrons with different pitch angles , the transmission function will get broadened ref:TDR2 up to the unwanted effect of “too early retardation” ref:Valerius . That effect occurs if the minima of and do not coincide so that the electrons reach the minimum of with a higher residual transverse kinetic energy while the collimation of the electrons’ momenta occurs at a different position with the minimal magnetic field.
With the increase of the magnetic field in the analysing plane from 0.21 mT ref:FG2013 to 0.63 mT, the maximum radius of the transported flux tube is reduced from 4.5 m to 2.6 m and therefore the position of the analysing plane at the center of the spectrometer is no longer strongly constrained by the spectrometer geometry (see Fig. 2). Therefore, we can even go a step further. The segmented inner electrode system of the KATRIN main spectrometer and the large number of air coil magnets around the vessel allow us to shape the fields in a different way: both the position of the maximal absolute retarding potential and that of the minimal magnetic field can be shifted along the -axis of the spectrometer. In the SAP configuration the analysing plane is shifted towards the detector section. Despite the change of the layout of the electromagnetic field, the transmission properties of the KATRIN main spectrometer, high acceptance () and narrow filter width ( eV) as well as the axial symmetry are preserved in the SAP configuration. The analysing plane is not located at a constant -value but is a curved surface, see Fig. 2. Shifting it to the conical part of the spectrometer leads to larger axial and radial inhomogeneities of the electrical retarding potential and the magnetic field. The variation of the electrical potential (magnetic field) across the analysing plane could reach eV ((0.1) mT) compared to eV ( mT) in the nominal setting, see Table 1. This fact has further implications for the neutrino mass measurement (see section 5).
It is important to notice, that besides reducing low energetic background from ionised Rydberg atoms, the SAP mode is expected to reduce the number of ionisations by the primary electrons from the short-lived 219Rn and 220Rn decays in the volume of the spectrometer. Due to the higher inhomogeneity of the electromagnetic field the trapping conditions for the highly energetic primary electrons become less favorable ref:Gar58 ; ref:Roth64 ; ref:KT73 ; ref:Bieringer . Besides, the magnetic mirror effect prevents part of the primary electrons to reach the downstream flux tube volume. These two effects additionally reduce of the number of secondary electrons reaching the detector from the smaller downstream flux tube volume. Therefore, the total amount of radon-induced background events will be reduced. Another benefit of the reduction of radon-induced background by the SAP setting is the fact that the number of time-correlated background events per one primary electron and, therefore, the non-Poisson overdispersion of the background count rate becomes significantly smaller.
4.1 Field optimisations
The optimal SAP configuration is achieved by reducing the flux tube volume while keeping the inhomogeneity of the fields reasonably small and preserving the energy width of the transmission function. Special care has to be taken to avoid “too early retardation” and fulfill the requirement that the minimum of the kinetic energy component parallel to the magnetic field is always the same regardless of the start pitch angle. This requirement limits the position of the SAP. Another restriction is that the dimension of the spectrometer at larger -position gets too small to guide the required flux tube if the magnetic field there is too small. The optimisation procedure contains two steps that are iterated afterwards: first the currents applied to the air coils are optimised with respect to the radial homogeneity at the minimum position, then the electric potential is modified to align the minima of the longitudinal kinetic energy. The spacial distance between the minima and the variation of electric potential across the analysing plane are minimized.
With the help of these extensive simulations of the fields an optimal position of the SAP was found at around 6 m distance from the middle of the vessel towards the detector ref:Bieringer (see Fig. 2 (green)). The simulations are performed using an efficient field calculation software, benchmarked with the standard Kassiopeia package ref:Kassiopeia . Table 1 summarises the main characteristics of the new SAP configuration compared to the symmetric 0.63 mT setting. In SAP configuration the downstream flux tube volume in Fig. 2 is reduced from m3 to m3 so, that the Rydberg component of the background rate is expected to be reduced by a factor of , assuming a spatially homogeneous low-energetic background electron event distribution inside the main spectrometer.
| Setting | (m) | (m3) | (mT) | (eV) | (eV) |
| SAP | 56 | 3 | |||
| “0.63 mT” | 0 | 160 | 0.63 | 0.14 | 2.8 |
Figure 3 shows the matching of the minimum of the magnetic field and the maximum of the absolute retarding potential in the SAP configuration for electrons moving at different radii in the flux tube.
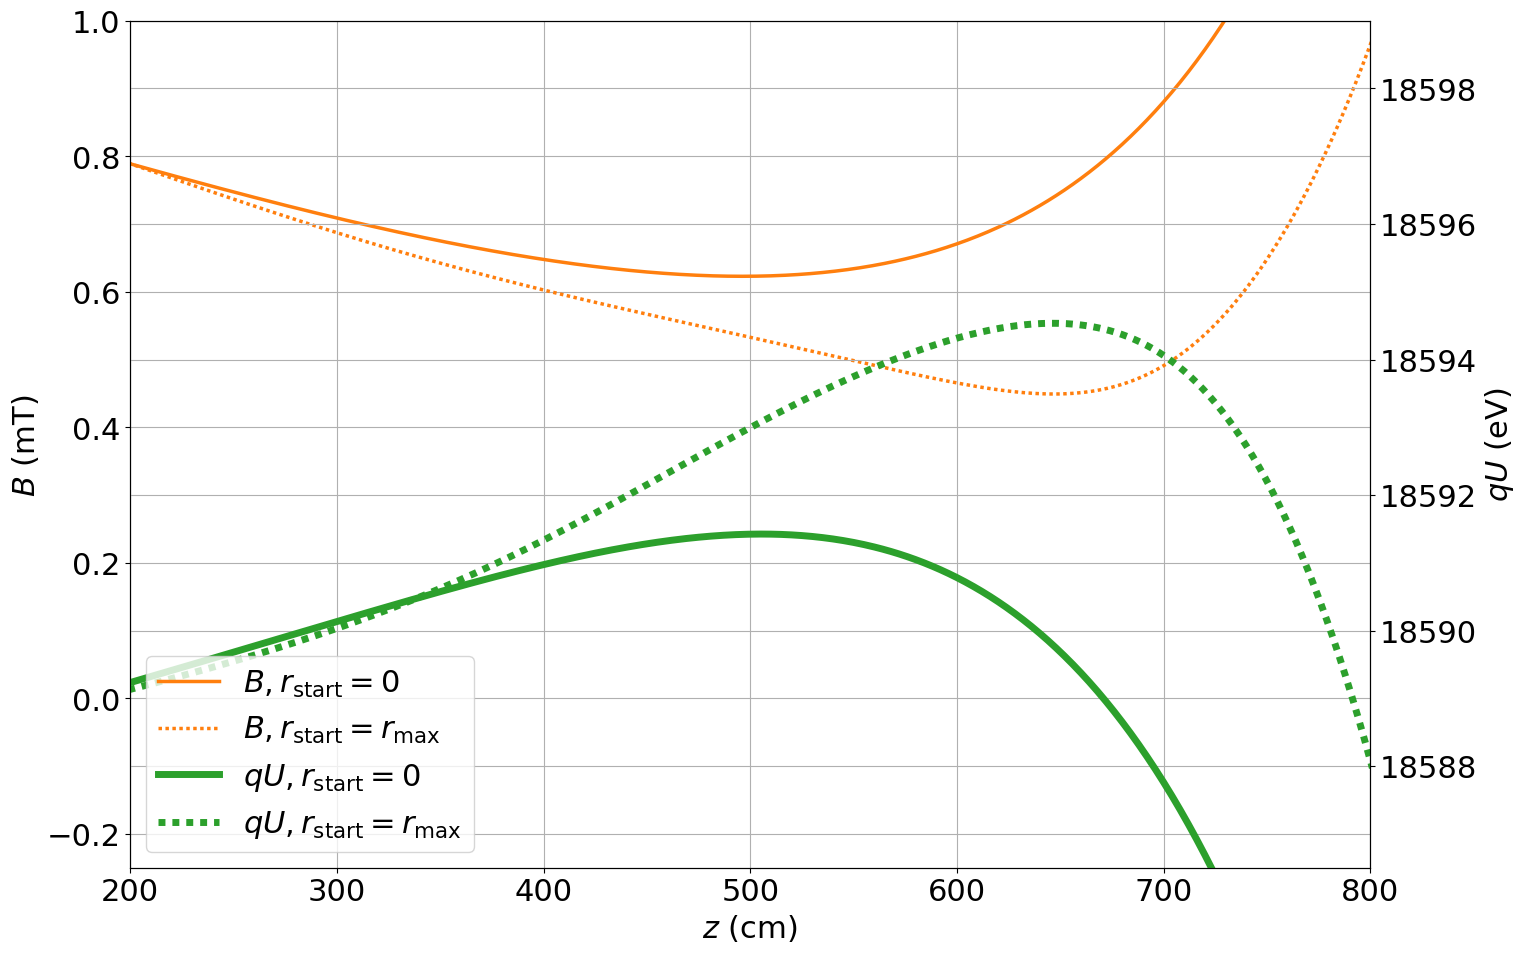
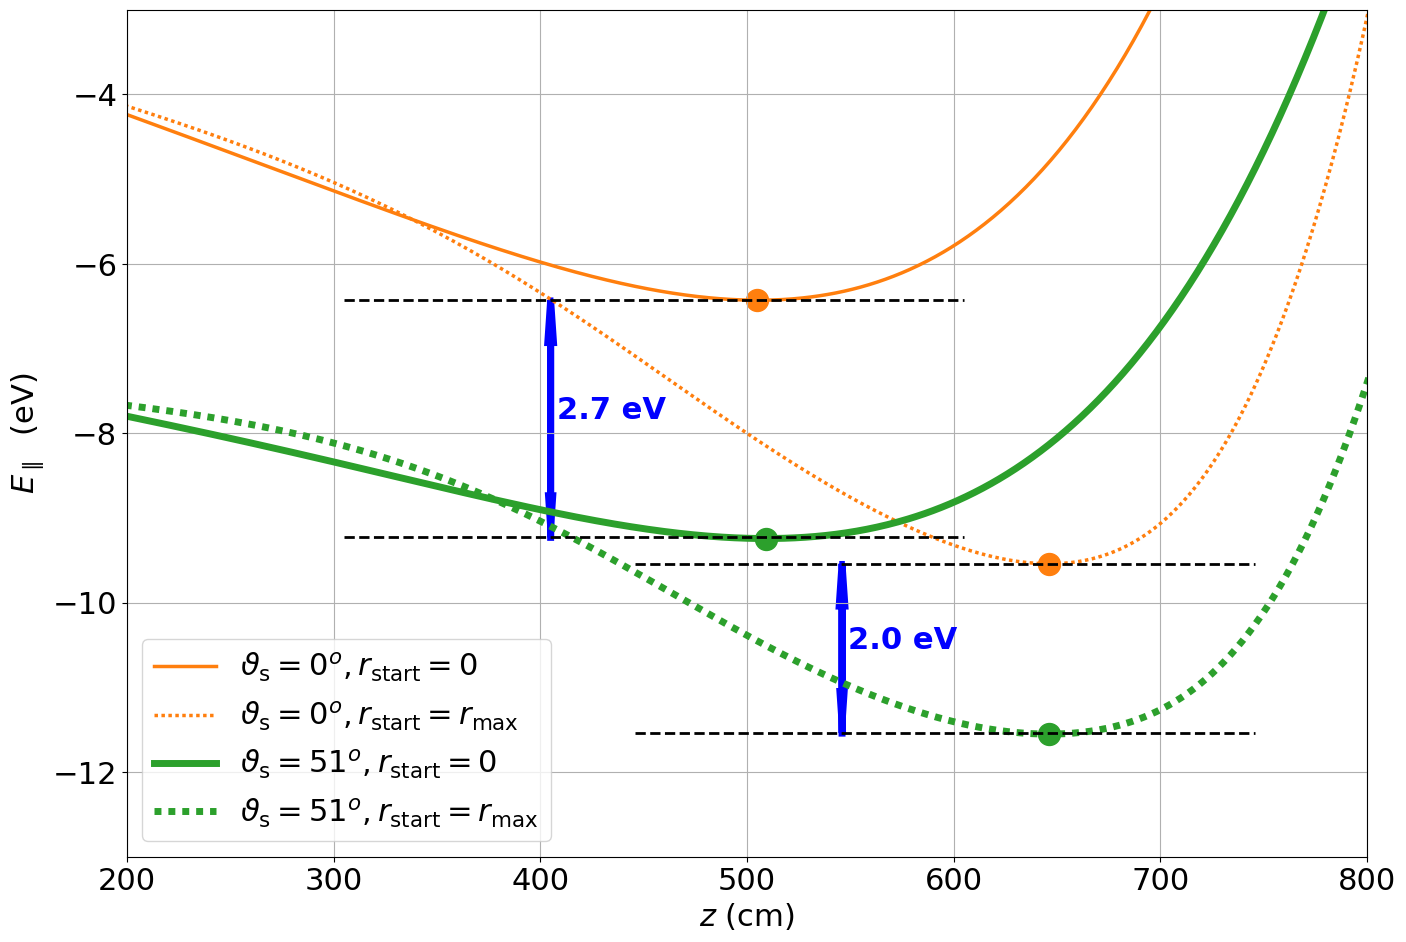
Figure 4 shows that the point of minimal longitudinal energy of electrons starting on the same radius but with different pitch angles varies within an interval of about 5 cm along the -axis. This variation is larger than the design value of 5 mm ref:wandkowski and contributes an additional uncertainty of less than meV to the filter width of the spectrometer. The variation of the longitudinal energy in the analysing plane for different starting angles of the electrons defines the transmission width of the spectrometer for an isotropic source.
Figure 5 shows the transmission function of
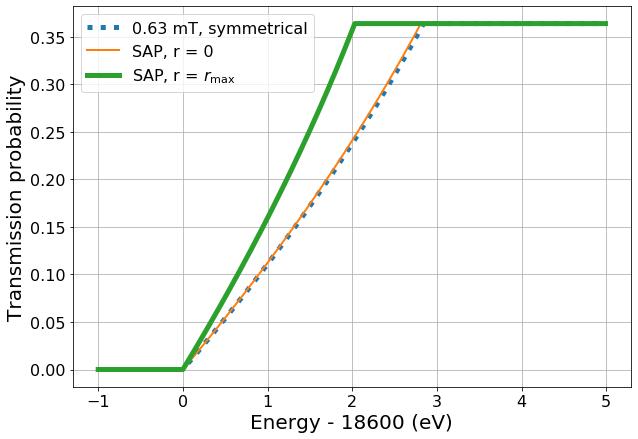
.
the KATRIN spectrometer for the three cases: the symmetric configuration with 0.63 mT magnetic field in the analysing plane averaged over all radii, the SAP configuration for electrons with and the SAP configuration for electrons in the outer radius of the flux tube. An isotropically emitting source and a maximum accepted start angle of at the source are assumed. The comparison of the three transmission functions shows that the SAP configuration provides even narrower transmission for the outer part of the flux tube while preserving the energy width of 2.7 eV for the central part of the flux tube. The measured transmission for each of the detector pixels is given by a convolution of the transmission functions with the potential variation across the pixel.
The technical implementation of the SAP configuration is as follows. The rings of the inner electrode in the flat-cone part of the vessel on the detector side (ring numbers 12 - 14, Fig. 1) get the smallest positive offsets with respect to the other rings, see Table 2.
| IE-ring | 2,3 | 4-6 | 7-11 | 12 | 13 | 14 | 15 | 16 |
|---|---|---|---|---|---|---|---|---|
| Offset, V | +125 | +25 | +10 | +2 | 0 | +2 | +45 | +105 |
| Voltage, V | -18480 | -18580 | -18595 | -18603 | -18605 | -18603 | -18560 | -18500 |
The air coils in the source-side part of the spectrometer (coil numbers 1 - 10, Fig. 1) produce a relatively high magnetic field in this region to shift and shape the magnetic field minimum to the SAP position. One of the challenges of placing the analysing plane closer to the exit of the spectrometer is the stray field of the superconducting pinch magnet (4.2 T) that defines the field near the beam axis. To counteract this field, several air coils (coil numbers 17 - 20) are producing a magnetic field in the opposite direction with their maximum allowed current of -120 A, see Table 3.
| Air coil | 1 | 2 | 3 | 4 | 5 | 6 | 7 | 8 | 9 | 10 |
| Current, A | 120 | -4 | 116 | 70 | 70 | 70 | 70 | 110 | 110 | 110 |
| Air coil | 11 | 12 | 13 | 14 | 15 | 16 | 17 | 18 | 19 | 20 |
| Current, A | -60 | -28 | 58 | 5 | 120 | 120 | -120 | -119 | -120 | -120 |
4.2 Measurement results
The principle of background reduction by an SAP configuration was demonstrated already in 2015 during the commissioning of the KATRIN experiment ref:Dyba . After other background sources were successfully mitigated (see e.g. references ref:penning ; ref:goerhardt ) and the Rydberg background was better understood ref:Rydberg extensive investigations to determine an optimal SAP configuration were performed ref:Bieringer ; ref:Schaller .
The tests described in this paper were performed in autumn 2019 after the first science run of KATRIN and after a bake-out of the spectrometer vessel, which had reduced the background level by about 30%. The main aim of the measurements was to choose an optimal configuration of the electromagnetic field that provides a substantial (factor 2) reduction of the measured background rate while preserving the transmission properties (e.g. transmission width below 2.8 eV) for the neutrino mass measurements.
During these studies the background rate was measured in intervals of 30 minutes to several hours for a series of predefined sets of air coil currents and electric potentials of the inner electrode rings. The settings cover a wide range of volumes of the downstream flux tube, m3, and different variations of the electric potential and magnetic field across the analysing plane. The settings were chosen according to the simulations of the flux tube and transmission properties in the main spectrometer using dedicated software ref:Bieringer .
Figure 6 shows the measured background rates as a function of the estimated
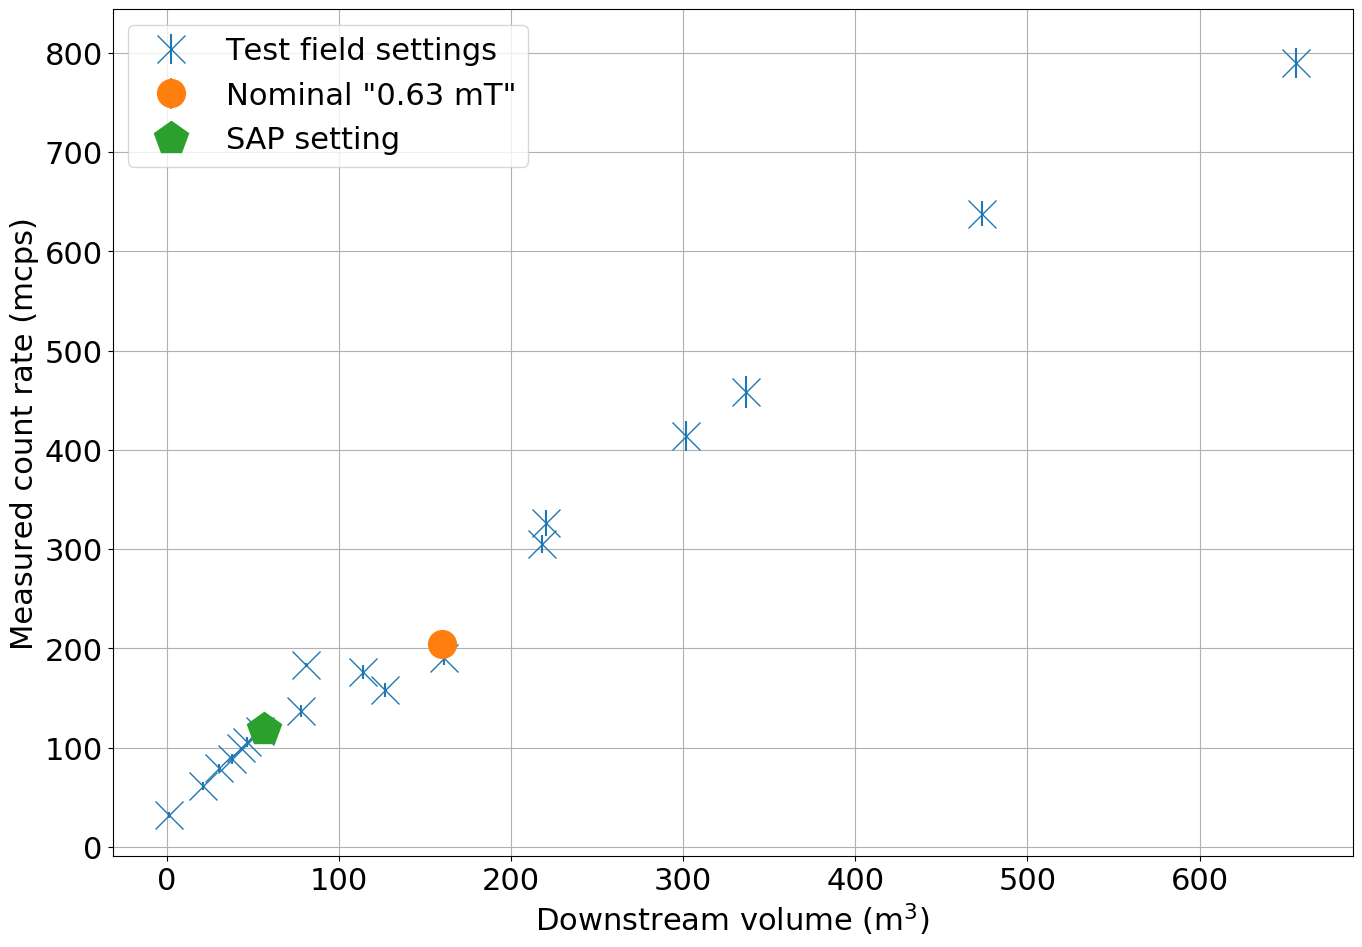
volume of the downstream flux tube. The measured rates exhibit a nearly linear dependence on the downstream flux tube volume. Deviations from this behaviour might be due to an inhomogeneous distribution of the starting points of the Rydberg electrons ref:Bieringer ; ref:Hinz or other background processes like trapped electrons from short-lived 219Rn and 220Rn decays.
Several configurations show a clear reduction of the spectrometer background rate (apart from the detector intrinsic background of mcps). However, a trade-off is required between the remaining background rate, the filter width and the homogeneity of the electric and magnetic fields over the analysing plane to keep systematic uncertainties introduced by the SAP configuration at an acceptable level.
The optimal SAP configuration described in section 4.1 (Fig. 6, green pentagon) possesses a downstream flux tube volume of about 56 m3 (compared to a downstream flux tube volume of 160 m3 in the nominal configuration). The measured total background count rate in this SAP configuration was determined to be () mcps (including mcps of intrinsic detector background rate) compared to a total background rate of () mcps in the nominal configuration at the time of the measurement shortly after the bake-out of the spectrometer vessel. In conclusion a factor of 2 reduction of the volume-related background rate is achieved in the SAP operating mode.
5 Implications for the neutrino mass measurement
As described above, the SAP configuration enables a background reduction of a factor of 2, however, it leads to a much larger magnetic field and electric potential variations across the analysis plane than in the symmetric case. These variations have two main consequences for the neutrino mass analysis.
First, in order to take into account the inhomogeneities of the electric potential and the magnetic field in the analysing plane of the SAP settings, the analysis exploits the radial and azimuthal pixelization of the detector ref:FPD . The detector is segmented in 148 pixels, arranged in concentric rings. Each pixel observes a statistically independent tritium beta decay spectrum. In an ideally aligned system, all detector pixels on one ring would be combined, thus minimising the inhomogeneities. In the real KATRIN experiment with small misalignments, groups of pixels with almost the same electrical potential and almost identical magnetic field defining “patches” can be analysed together. The magnetic field and electric potential variation over a patch amounts to less than mT and eV, respectively. In the neutrino mass analysis these detector patches are fitted simultaneously, but with individual model predictions taking into account the patch-dependent fields, and thus enhancing the needed computation power. As a proof of concept, it was successfully implemented for the second neutrino mass measurement data analysis ref:KNM2 and also tested in a new model calculation technique using a neural network ref:Netrium .
The second consequence of the SAP configuration for the neutrino mass measurement is the need for a precise experimental determination of the magnetic fields and electric potential over the analysing plane. In contrast, in earlier measurements using the symmetric analysing plane the potentials and fields in the analysing plane were based on simulations and the electric potential variation over a single patch could be neglected.
A precise measurement of the fields is possible, for instance, with a gaseous krypton source ref:KrCalibration . By scanning narrow lines of 83mKr (for instance, K-32, L3-32 and N2,3-32 lines) with the MAC-E filter the electric potential, the magnetic field and the effective broadening of the transmission due to and over a patch can be measured directly. Such a measurement was performed and meets the KATRIN design requirement regarding the systematic contribution of the SAP fields to on the level of eV2. The details of this approach will be described in a separate publication ref:KrCalibration ; ref:Block .
6 Conclusion and outlook
To reach the target sensitivity of the KATRIN experiment to the neutrino mass of 0.2 eV (at 90% CL), a reduction of the background rate to values below 0.1 cps is required.
The novel shifted analysing plane (SAP) configuration described in this paper reduces the background rate from the KATRIN main spectrometer by a factor of 2, allowing tritium beta-decay measurements at a background rate of 0.12 cps. The configuration provides a narrow filter width of the KATRIN main spectrometer in the range of 2.0 eV to 2.7 eV at an electron energy of 18.6 keV, surpassing the width of 2.8 eV in the symmetric configuration (0.63 mT) used in the neutrino mass measurements so far.
The minimal magnetic field is varying in the SAP configuration from 0.45 mT to 0.62 mT over the analysing plane and the corresponding electric potential variation is 3 eV. To measure the electromagnetic field in-situ a precise calibration procedure was developed and performed using monoenergetic conversion electrons from a 83mKr source ref:FirstLight ; ref:Krypton and, in addition, monoenergetic electrons from an angular-selective photo-electron source ref:egun ; ref:TDR2 . Along with the determination of the electromagnetic field, test scans of the tritium spectrum were performed in the SAP configuration to assure that the neutrino-mass data-taking is not affected by unexpected side-effects of this measurement mode. The corresponding neutrino mass analysis makes full use of the detector pixelization. The additional systematic uncertainties that occur are marginal ref:KrCalibration ; ref:Block . After the careful calibration the shifted analysing plane was implemented as the new default beta-spectrum scanning mode in KATRIN since 2020.
Several other options of detecting or removing the remaining part of the KATRIN background, Rydberg background electrons, are considered, including time-of-flight spectroscopy ref:tof , the idea of time-focusing time-of-flight measurements ref:tftof or making use of the specific angular distribution of the Rydberg electrons to filter out background events. Should one of these methods be successful, a symmetric configuration of the fields might be considered again because of the improved filter width (e.g. with minimal magnetic field of 0.21 mT reaching the design value eV) and reduced systematics related to the homogeneity of the electromagnetic field.
Acknowledgements.
We acknowledge the support of Helmholtz Association (HGF), Ministry for Education and Research BMBF (05A17PM3, 05A17PX3, 05A17VK2,05A17PDA, 05A17WO3 and 05A20PMA), Helmholtz Alliance for Astroparticle Physics (HAP), the doctoral school KSETA at KIT, and Helmholtz Young Investigator Group (VH-NG-1055), Max Planck Research Group (Max-Planck@TUM), and Deutsche Forschungsgemeinschaft DFG Research Training Groups Grants No., GRK 1694 and GRK 2149, Graduate School Grant No. GSC 1085-KSETA, and SFB-1258 in Germany; Ministry of Science and Higher Education of the Russian Federation under contract 075-15-2020-778. This project has received funding from the European Research Council (ERC) under the European Union Horizon 2020 research and innovation programme (grant agreement No. 852845).References
- (1) Planck Collaboration, N. Aghanim et al., Planck 2018 results. VI. Cosmological parameters, arXiv:1807.06209 (2018)
- (2) CUORE Collaboration, Improved Limit on Neutrinoless Double-Beta Decay in Te-130 with CUORE, Phys. Rev. Lett., 124, 122501 (2020)
- (3) GERDA Collaboration, Probing Majorana neutrinos with double- decay, Science, 365, 1445 (2019);
- (4) EXO-200 Collaboration, Search for Neutrinoless Double- Decay with the Complete EXO-200 Dataset, Phys. Rev. Lett., 123, 161802 (2019);
- (5) KamLAND-Zen Collaboration, Search for Majorana Neutrinos near the Inverted Mass Hierarchy Region with KamLAND-Zen, Phys. Rev. Lett., 117, 082503 (2016);
- (6) J. A. Formaggio, A. L. C. de Gouvêa and R. G. H. Robertson, Direct Measurements of Neutrino Mass, Phys. Rept. 914 1 (2021)
- (7) G. Drexlin, V. Hannen, S. Mertens and C. Weinheimer, Current direct neutrino mass experiments, Adv. High Energy Phys. 2013 293986 (2013)
- (8) M. Aker et al. (KATRIN Collaboration), Improved Upper Limit on the Neutrino Mass from a Direct Kinematic Method by KATRIN, Phys.Rev.Lett., 123, 221802 (2019)
- (9) M. Aker et al. (KATRIN Collaboration), Analysis methods for the first KATRIN neutrino-mass measurement, Phys. Rev. D 104 012005 (2021)
- (10) M. Aker et al. (KATRIN Collaboration), First direct neutrino-mass measurement with sub-eV sensitivity, arXiv:2105.08533 (2021)
- (11) Angrik, J. et al., KATRIN design report, FZKA-7090 (2005)
- (12) E.W. Otten, C. Weinheimer, Neutrino Mass Limit From Tritium Beta Decay, Rep. Prog. Phys., 71 086201 (2008)
- (13) Marsteller, A. et al., Neutral tritium gas reduction in the KATRIN differential pumping sections, Vacuum 184, 109979 (2021)
- (14) Amsbaugh, J. F. et al., Focal-plane detector system for the KATRIN experiment, Nucl. Instrum. Meth. A, 778, 40-60 (2015)
- (15) K. Valerius, Electromagnetic design and inner electrode for the KATRIN main spectrometer, Prog.Part.Nucl.Phys., 57 58 (2006)
- (16) M. Aker et al. (KATRIN collaboration), The Design, Construction, and Commissioning of the KATRIN Experiment, JINST, 16 T08015 (2021)
- (17) F. Glück et al., Electromagnetic design of the large-volume air coil system of the KATRIN experiment, New J. Phys., 15, 083025 (2013)
- (18) M. Erhard et al., Technical design and commissioning of the KATRIN large-volume air coil system, JINST, 13 P02003 (2018)
- (19) K. Altenmüller et al. (KATRIN collaboration), Muon-induced background in the KATRIN main spectrometer, Astropart. Phys., 108, 40-49 (2019)
- (20) K. Altenmüller et al. (KATRIN collaboration), Gamma-induced background in the KATRIN main spectrometer, Eur. Phys. J. C, 79, 807 (2019)
- (21) M. Aker et al. (KATRIN collaboration), Suppression of Penning discharges between the KATRIN spectrometers, Eur. Phys. J. C, 80, 821 (2020)
- (22) N. Wandkowsky et al., Modeling of electron emission processes accompanying radon decays within electrostatic spectrometers, New J. Phys., 15 083040 (2013)
- (23) S. Görhardt et al., Impact of a cryogenic baffle system on the suppression of radon-induced background in the KATRIN Pre-Spectrometer, JINST, 13 T10004 (2018)
- (24) F. Harms, Characterization and Minimization of Background Processes in the KATRIN Main Spectrometer, PhD thesis, Karlsruher Institut für Technologie (2015)
- (25) F. Fränkle et al., KATRIN background due to surface radioimpurities, arXiv:2011.05107 (2020)
- (26) M. Aker et al. (KATRIN collaboration), First operation of the KATRIN experiment with tritium, Eur. Phys. J. C, 80, 264 (2020)
- (27) M. Erhard et al., Technical design and commissioning of the KATRIN large-volume air coil system, JINST, 13 P02003 (2018)
- (28) J. Letnev et al., Technical design and commissioning of a sensor net for fine-meshed measuring of the magnetic field at the KATRIN spectrometer, JINST, 13, T08010 (2018)
- (29) K. Valerius, Spectrometer-related background processes and their suppression in the KATRIN experiment, PhD thesis, University of Münster (2009)
- (30) A. Garren et al., Individual Particle Motion and the Effect of Scattering in an Axially Symmetric Magnetic Field, Proc. 2nd Int. Conf. Peaceful Uses Atom. Energy, 31 65 (1958)
- (31) J.R. Roth, Nonadiabatic Motion of a Charged Particle in an Axisymmetric Magnetic Barrier, Phys.Fluids, 7, 536 (1964)
- (32) C. Kapetonakos and A. Trivelpiece, Numerical studies of charged particle trapping in a time varying magnetic mirror field, Plasma Physics, 15, 317 (1973)
- (33) B. Bieringer, Shifted Analyzing Plane: Field optimization for background reduction of the KATRIN experiment, Master thesis, University of Münster (2020)
- (34) D. Furse et al., Kassiopeia: a modern, extensible C++ particle tracking package, New J. Phys. 19 053012 (2017)
- (35) S. Dyba, Background reduction by the inner wire electrode and set-up of the condensed krypton source at the neutrino mass experiment KATRIN, PhD thesis, University of Münster (2018)
- (36) A. Schaller, Characterization and mitigation of the background in KATRIN, PhD thesis, Technical University Munich (2020)
- (37) D. Hinz, Ionisation mechanisms of 206Pb induced Rydberg atoms, Master thesis, Karlsruhe Institute of Technology (2018)
- (38) K. Altenmüller et al. (KATRIN collaboration), High-resolution spectroscopy of gaseous 83mKr conversion electrons with the KATRIN experiment, J. Phys. G, 47, 065002 (2020)
- (39) M. Arenz et al. (KATRIN collaboration), First transmission of electrons and ions through the KATRIN beamline, JINST, 13, P04020 (2018)
- (40) J. Behrens et al., A pulsed, mono-energetic and angular-selective UV photo-electron source for the commissioning of the KATRIN experiment, Eur. Phys. J. C, 77, 410 (2017)
- (41) N. M. N. Steinbrink, J. D. Behrens, S. Mertens, P. C. O. Ranitzsch and C. Weinheimer, keV-Scale Sterile Neutrino Sensitivity Estimation with Time-Of-Flight Spectroscopy in KATRIN using Self-Consistent Approximate Monte Carlo, Eur. Phys. J. C, 78, 212 (2018)
- (42) A. Fulst, A. Lokhov, M. Fedkevych, N. Steinbrink and C. Weinheimer, Time-Focusing Time-of-Flight, a new method to turn a MAC-E-filter into a quasi-differential spectrometer, Eur. Phys. J. C, 80, 956 (2020)
- (43) Ch. Karl, P. Eller, S. Mertens, Fast and precise model calculation for KATRIN using a neural network, arXiv:2201.04523 (2022)
- (44) KATRIN Collaboration, Calibration of the electromagnetic field in the analysing plane of the KATRIN Main Spectrometer, in preparation
- (45) F. Block, Determination of electromagnetic fields and tritium column density for neutrino mass analysis with KATRIN, PhD Thesis, Karlsruhe Institute of Technology (2021)