Massive Black Hole Binaries from the TNG50-3 Simulation: I. Coalescence and LISA Detection Rates
Abstract
We evaluate the cosmological coalescence and detection rates for massive black hole (MBH) binaries targeted by the gravitational wave observatory Laser Interferometer Space Antenna (LISA). Our calculation starts with a population of gravitationally unbound MBH pairs, drawn from the TNG50-3 cosmological simulation, and follows their orbital evolution from kpc scales all the way to coalescence using a semi-analytic model developed in our previous work. We find that for a majority of MBH pairs that coalesce within a Hubble time dynamical friction is the most important mechanism that determines their coalescence rate. Our model predicts a MBH coalescence rate yr-1 and a LISA detection rate yr-1. Most LISA detections should originate from MBHs in gas-rich galaxies at redshifts , and have a characteristic signal to noise ratio SNR . We however find a dramatic reduction in the coalescence and detection rates, as well as the average SNR, if the effects of radiative feedback from accreting MBHs are taken into account. In this case, the MBH coalescence rate is reduced by (to yr-1), and the LISA detection rate is reduced by (to yr-1), whereas the average SNR is . We emphasize that our model provides a conservative estimate of the LISA detection rates, due to the limited MBH mass range in TNG50-3, consistent with other works in the literature that draw their MBH pairs from cosmological simulations.
1 Introduction
Massive black holes (MBHs) are known to reside at the centers of most massive galaxies (Soltan, 1982; Kormendy & Richstone, 1995; Magorrian et al., 1998), and the hierarchal formation model of galaxy evolution predicts that massive galaxies are built up through a series of mergers (e.g., White & Rees, 1978; White & Frenk, 1991). Thus, it is expected that following a merger of two massive galaxies, the individual MBHs find themselves orbiting in the gravitational potential of the merger remnant galaxy. By interacting with the stellar and gaseous background of the remnant galaxy, the separation of some of these MBH pairs will shrink to the point that they become strong gravitational wave (GW) emitters before eventually coalescing into a single MBH. The GWs emitted by merging MBHs make them important sources for the upcoming Laser Interferometer Space Antenna (LISA; Amaro-Seoane et al., 2017), which will survey the frequency range of Hz – mHz. The expected rate of LISA detections is related not only to the frequency of galaxy mergers, but also to the physical processes within the remnant galaxy that bring the individual MBHs to coalescence. It is therefore important to understand the evolution of MBHs in post-merger galaxies in order to anticipate the GW signals probed by the GW observatories.
Once the MBHs are at separations of kpc in the post-merger galaxy, dynamical friction (DF) by gas and stars will dominate the decay of their orbits (Begelman et al., 1980). This process describes how gravitational deflection of gas (Ostriker, 1999; Kim & Kim, 2007) or collisionless particles (e.g., stars and dark matter; Chandrasekhar, 1943; Antonini & Merritt, 2012) leads to the formation of an overdense wake trailing a moving MBH, exerting a gravitational pull onto the MBH and sapping its orbital energy. The timescale for this stage of the decay is determined by the properties of the two MBHs and their host galaxy. The most important of these include the total mass, mass ratio and initial orbits of the MBHs, and the distribution and kinematics of the gas and stars in the host galaxy.
Other processes are expected to supplant DF in shrinking the orbit at separations pc. For example, in stellar “loss-cone” scattering (e.g., Quinlan, 1996; Quinlan & Hernquist, 1997; Yu, 2002) stars are scattered away from the MBH binary (MBHB111The two MBHs are referred to as a binary when they are gravitationally bound, or as a pair prior to becoming bound. The separation at which the two MBHs become bound depends on the properties of the galaxy and the masses of the MBHs, but is most often at separations pc.), removing orbital energy and hardening the binary. While the scatterings cause many stars to be ejected, the loss-cone can be efficiently refilled due to the triaxiality of most galaxy potentials (Yu, 2002; Khan et al., 2011; Vasiliev, 2014; Gualandris et al., 2017). In addition, if the post-merger galaxy is sufficiently gas rich, drag on the binary by the surrounding circumbinary disk may also play an important role for its orbital evolution at separations pc (e.g., Armitage & Natarajan, 2005; Milosavljević & Phinney, 2005). According to Haiman et al. (2009) and Dotti et al. (2015), MBHBs can sink efficiently towards the galactic center through Type-II migration. When the separation falls below Schwarzschild radii GW emission begins to dominate the orbital decay until coalescence (Thorne & Braginskii, 1976; Begelman et al., 1980).
In earlier work (Li et al., 2020a, b, hereafter LBB20a and LBB20b), we developed a semi-analytic model to study the effects of the galactic and orbital parameters on the inspiral time and eccentricity evolution of MBH pairs due to gaseous and stellar DF at kpc scales. The post-merger galaxies considered in these studies spanned a wide range of properties — from very gas rich to gas poor; bulge-dominated to disk-dominated; rapidly spinning to slowly rotating – which allowed a detailed exploration of how the DF forces affected the evolution of a MBH pair over a wide range of conditions and scenarios. For example, we found that the separation of a MBH pair decays fastest in remnant galaxies with gas fractions and a gas disk rotating near its circular speed. The evolution time is also shortened for MBH pairs with total mass and mass ratios moving in either circular prograde orbits or on very eccentric retrograde orbits. Systems with these properties were more likely to have their MBH separations reach 1 pc in less than a Hubble time, increasing their chances of becoming a strong GW source.
Here, we present a new version of our semi-analytic model that continues the evolution of the MBHB below 1 pc by including the effects of the additional processes mentioned above (i.e., loss-cone scattering, viscous drag and GW emission). These additions allow us to self-consistently compute the evolution time-scale from kpc-scales to coalescence in a model post-merger galaxy. An additional new component of this work is that instead of considering an arbitrary range of possible galaxy properties (as we did in LBB20a and LBB20b), we use the properties and redshifts of post-merger galaxies identified in one of the IllustrisTNG simulations (Naiman et al., 2018) to characterize the model galaxies in which the MBHs evolve. This allows us to place the MBHB evolution in the cosmological context and to evaluate the dependence of the MBH coalescence and LISA detection rates on the properties of merger galaxies and their MBH pairs.
Other groups also predicted the LISA detection rate using cosmological simulations combined with semi-analytic models for the MBHB dynamics below the resolution limit. For example, Salcido et al. (2016) use results from the cosmological simulation suite EAGLE, and assume constant delay times between the galaxy merger and coalescence. They predict the eLISA detection rate to be , largely dominated by coalescences of seed black holes merging at redshifts between 1 and 2. Katz et al. (2020) also estimate the LISA detection rate using the Illustris cosmological simulation, combined with a semi-analytic model presented by Dosopoulou & Antonini (2017) and Kelley et al. (2017), used to evolve MBH orbital dynamics below kpc. They predict a LISA detection rate of for MBHs with masses larger than . More recently, Chen et al. (2021, 2022) used the cosmological simulation ASTRID and found cosmological MBH merger rate in the range . Similar approaches have been used by DeGraf & Sijacki (2020) and Curyło & Bulik (2021), who report that differences in black hole seeding and growth models lead to more than an order of magnitude difference in predicted MBH merger rates.
Crucially, we also explore the effects of radiation feedback on the coalescence and LISA detection rates in this paper. Earlier studies have shown that the radiation produced by each MBH can influence the dynamics of the system (Kim & Kim, 2007; Li et al., 2020b). For MBHs evolving in gas-rich backgrounds, the ionizing radiation emerging from the innermost parts of their accretion flows can affect the gaseous DF wake and render gas DF inefficient for a range of physical scenarios. MBHs in this regime tend to experience a positive net force, speeding them up, contrary to the expectations for gaseous DF without radiative feedback (Park & Bogdanović, 2017a; Gruzinov et al., 2020; Toyouchi et al., 2020). As showed by LBB20b, negative gaseous DF can lengthen the inspiral time of MBHs and significantly reduce the chance of forming close MBH pairs, particularly for lower mass MBHBs, an important source class for the LISA observatory.
This paper is organized as follows. In Sect. 2 we describe the main features of the model used to evolve the MBHs from kpc-scales to coalescence, as well as the IllustrisTNG sample of post-merger galaxies. Section 3 presents the distribution of evolution times from the suite of models, including the contributions spent in each phase of the orbital decay. Section 4 shows how the predicted MBHB coalescence rates and fractions are impacted by the different galactic properties. Section 5 shows the predicted LISA detection rates and the properties of systems that may be detected by LISA. In Section 6 we discuss the effect of radiation feedback on the MBH merger and LISA detection rates. Finally, we discuss the implications of our findings in Sect. 7 and conclude in Sect. 8. In this work, we assume an updated cosmology consistent with that used in the TNG simulation (, , , ), and billion yrs.
2 Methods
In this section, we first review how we parameterize the structure of post-merger galaxies (see LBB20a for full details), and then describe how we identify such galaxies in IllustrisTNG and convert them into our paramertized form. Section 2.3 details the evolution calculations to model the inspiral of a secondary MBH from kpc-scales to coalescence.
2.1 Model of the Remnant Galaxy
We assume a galaxy merger produces a single remnant, with a stellar bulge and gas disk222We omit the stellar disk since its impact on the orbital evolution from DF is negligible (LBB20a)., which includes the MBH pair. The half-mass radii of the bulge and disk are and , respectively. The primary MBH (pMBH; with mass ) is fixed at the center of the galaxy. The non-rotating bulge has a mass and follows a coreless powerlaw density profile (e.g., Binney & Tremaine, 2008) which cuts off at , with the scale parameters proportional to kpc. We consider the orbital evolution of a bare, secondary MBH (sMBH) with mass , which is orbiting in the plane of the gas disk. The total mass of the MBH pair is and the mass ratio is .
The gas disk follows an exponential profile with a scale radius of kpc (e.g., Binney & Tremaine, 2008). As a result, models with larger have gas densities that decrease more slowly with radius, impacting the orbital decay from gaseous DF. The gas densities in the disk are determined by the overall gas fraction (), where is the mass of the gas disk (defined as the mass within ). The disk rotates with velocity , defined in units of the local circular velocity . In our nomenclature if the galaxy disk and sMBH are corotating and if they are counterrotating. Therefore, our model for a merger remnant galaxy containing a pair of MBHs is defined by seven parameters: and for the MBHs, and for the stellar bulge, and , and for the gas disk. As described below, we determine the values of these parameters from the properties of merger remnant galaxies in one of the IllustrisTNG simulations.
2.2 Massive Black Hole Mergers in the TNG50 Simulation
The IllustrisTNG suite includes 18 simulations in total that differ in the physical size of the computational domain, the mass resolution, and the complexity of the included physics (Naiman et al., 2018; Nelson et al., 2018; Marinacci et al., 2018; Pillepich et al., 2018; Springel et al., 2018). There are three physical simulation volumes available: , , and , which are referred to as TNG50, TNG100, and TNG300, respectively. The mass resolution of TNG50 is a few hundred times higher than that of the TNG300 simulation (Nelson et al., 2019a, b; Pillepich et al., 2019) and provides the most detailed look at the structural properties of galaxies. Therefore, we use the TNG50 simulation to identify and characterize post-merger galaxies.
TNG50 itself consists of a series of lower-resolution realizations of the same volume. We specifically use data from TNG50-3 as the gravitational softening of the collisionless component (i.e., stars and dark matter) is kpc which is consistent with the initial separation of the MBHs in the orbital decay calculation (LBB20a). The simulation assumes a heavy-seed MBH formation model (Loeb & Rasio, 1994; Begelman et al., 2006; Latif et al., 2013; Habouzit et al., 2016; Ardaneh et al., 2018; Dunn et al., 2018) with a seed mass of (Nelson et al., 2019b), which sets a firm lower-limit to the mass of the MBHs in the simulation.
The parameters of the MBH pair in a merging galaxy are extracted from the blackhole mergers and details supplementary data catalog of TNG50-3333See https://www.tng-project.org/data/docs/specifications. generated by the Illustris Black Holes Post-Processing Module (Blecha et al., 2016; Kelley et al., 2017), with 2165 ‘mergers’ in total. These ‘mergers’ correspond to MBH pairs that reach the separation of the gravitational softening of the collisionless component ( kpc). For each ‘merger’ we extract the black hole ID of the more massive MBH (pMBH), the masses of each MBH (, ), and the mass ratio (). The redshifts () of each ‘merger’ are determined from the snapshot ID and is converted into cosmic time in Gyr by Gyr. This determines the starting time for the evolution calculations described in Sect. 2.3.
The final galaxy structure data needed for the model are the bulge mass and half-mass radius (, ), the gas disk mass and half-mass radius (, ) and the disk rotation speed (see the previous subsection). The size and mass properties are determined by cross-matching the merger information with the subhalo catalog using the black hole ID of the pMBH to identify the post-merger galaxy. The masses are assigned to the appropriate values listed in the SubhaloMassInRadType catalog entry for each galaxy444This catalog provides the stellar and gas masses within of each TNG50-3 galaxy, yet the radius of the gas disk in our model galaxies is defined as . As is generally larger than , the gas densities of our model will, on average, be underestimated. The lower gas density will decrease the efficiency of gaseous DF and may extend the evolution time of the MBH pairs.. Similarly, the two radii are assigned to the corresponding values from the SubhaloHalfmassRadType catalog entry for each galaxy after converting from comoving to physical units. As the TNG50-3 catalog do not record the rotation of the post-merger galaxies, we randomly assign a value in the range of as the gas disk rotational speed (Rogstad & Shostak, 1972; Allen et al., 1973; Casertano, 1983; Begeman et al., 1991; de Blok et al., 2008; Förster Schreiber et al., 2009; Lindberg et al., 2014; Übler et al., 2021).
Out of 2165 total ’merger’ events recorded in the simulations, there are 45 ‘mergers’ in TNG50-3 with , and 123 ‘mergers’ with both and which are likely misidentified subhalos (Blecha et al., 2016; Kelley et al., 2017; Katz et al., 2020). We omit these 123 ‘empty’ systems from our analysis, but we do simulate the orbital evolution of the 45 ‘mergers’ with only stellar components and find they have no influence on the overall coalescence rate or LISA detection rate since the evolution times of the sMBHs in these models are longer than the Hubble time.
At this point, we have characterized 2042 models of post-merger galaxies from the TNG50-3 data, each with a specific MBH pair with known masses. Each galaxy is also associated with a redshift specifying when the MBH pair is at a separation of kpc. As all these galaxy mergers are extracted from a known cosmological volume, we will be able to compute the rates of MBH mergers from this starting dataset. We are now prepared to dynamically evolve the MBH pair in each galaxy model to determine the times to coalescence.
2.3 Dynamical Evolution of the MBH pairs
The orbital evolution of the sMBH due to gaseous and stellar DF is followed from a separation of kpc until the influence radius of the MBHB (), at which point the orbital decay is dominated by loss-cone (LC) scattering, viscous drag (VD) from a circumbinary disk, and GW emission. The calculation ends when the separation is smaller than the innermost stable circular orbits of the two MBHs ().
The orbit of the sMBH is not closed, but we use the farthest and closest approaches of the MBH to estimate the eccentricity throughout the DF calculation. The procedure to initialize the orbit is described by LBB20a, and can provide a range of initial eccentricities . In addition, the orbit of the sMBH can either be prograde or retrograde with respect to the galaxy rotation. To consider the effects of different orbital geometries, we run the evolution calculation four times for each of the 2042 galaxy models: twice with and twice with . In both cases, we consider a prograde and a retrograde orbit. Our final model suite therefore contains 8168 individual orbital evolutions.
2.3.1 Dynamical Friction
The calculation of the orbital decay due to stellar and gaseous DF is described in detail by LBB20a,b. The stellar DF force exerted by the bulge is calculated using Eqs. (5)-(7) in LBB20a, following the work of Antonini & Merritt (2012). The velocity distribution of stars in the bulge is assumed to be Maxwellian (see LBB20b, Eq. 2). Since gaseous DF depends on the Mach number of the moving body (e.g., Kim & Kim, 2007), the sound speed of the gas disk must be defined. The temperature profile of the disk is taken to be K above the minimum temperature required by the Toomre stability criterion (Toomre, 1964). The gaseous DF force on the sMBH is then computed using Eqs. (10)–(12) of LBB20a, which results in the gaseous DF force that is strongest when the velocity difference between the sMBH and gas disk is close to the sound speed, (Ostriker, 1999; Kim & Kim, 2007). We define the inspiral time of sMBHs from kpc to as .
2.3.2 Loss-Cone Scattering
When the MBH separation reaches and the mass enclosed in the orbit is twice the binary mass555The mass enclosed in the orbit is calculated by integrating the stellar density profile (Eq. (1) of LBB20a) and gas density profile (Eq. (3) of LBB20a)., LC scattering dominates over DF in removing orbital energy (Sesana et al., 2006). The hardening of MBHB orbits by LC scattering can be approximately described by
| (1) |
and
| (2) |
where is the MBHB orbital frequency, is the stellar velocity dispersion of the host galaxy, is the stellar density at , and and are numerical factors from three-body scattering experiments (Quinlan, 1996; Sesana et al., 2006).
2.3.3 Viscous Drag in a Circumbinary disk
When the sMBH enters any gaseous circumbinary disk, VD666Throughout the manuscript we refer to this evolution mechanism as “viscous drag”, for simplicity. Note however that angular momentum transport at the inner edge of the circumbinary disk is mostly driven by gravitational torques from the binary and not the viscous tourques. may significantly contribute or even dominate the evolution of the binary. Haiman et al. (2009) described how the orbit of a MBHB embedded in a circumbinary Shakura & Sunyaev (1973) -disk evolves due to VD, and how this evolution depends on the different physical conditions within the disk. Here, we consider the regime that leads to the most efficient evolution of the binary: a disk that is everywhere supported by gas pressure, with opacity defined by electron scattering, and a radial extent of pc from the pMBH777This is a fiducial choice as the radial extent of MBHB circumbinary disks is not known. To mitigate the uncertainty we tested the impact of this parameter and found that the calculated MBH coalescence and detection rates change by less than 10% for a 10 times smaller circumbinary disk.. In this case the rate of evolution of orbital frequency in the circumbinary disk due to VD is
| (5) |
where is the orbital frequency, is the orbital semi-major axis in units of Schwarzschild radii, , and is the symmetric mass ratio (Haiman et al., 2009). Note that this prescription implies that the MBHB orbit always shrinks under the influence of VD and does not account for a possibility of orbital expansion, investigated in some more recent simulations (Tang et al., 2017; Miranda et al., 2016; Muñoz et al., 2019; Moody et al., 2019; Tiede et al., 2020; Bortolas et al., 2021).
The eccentricity evolution due to VD can be complex and cannot be trivially reduced to a prescription for a single dominant regime. Roedig et al. (2011) shows that if the incoming eccentricity of the MBHB on a prograde orbit is then there is a limiting eccentricity in the range that the binary reaches during its interaction with the circumbinary disk. Thus, if one of our model MBHBs has a prograde orbit with an eccentricity larger than while VD dominates the evolution, we then randomly assign the eccentricity between and after one viscous timescale (measured at the separation where VD begins to dominate the evolution). If however the eccentricity of the orbit is less than when VD takes over the orbital decay, the eccentricity remains fixed until GW emission takes over the orbital evolution.
For MBHBs in retrograde orbits, there are three possibilities for the eccentricity evolution that depend on the value of the eccentricity when the MBH reaches this stage (Roedig & Sesana, 2014). If the sMBH is in a near circular orbit (i.e. ), then its eccentricity will not change due to VD. However, if , the eccentricity then increases as per orbit. Finally, if , a disk-binary interaction causes the binary to leave the disk plane, tilt, and converge to a prograde orbit with limiting eccentricity in the range of . The timescale for this transition corresponds viscous timescales to reach the final steady state due to the reversal of the orbital direction from retrograde to prograde (Roedig & Sesana, 2014). More recent works find qualitatively similar results: that circular binaries remain circular and that eccentric binaries tend to evolve toward a threshold eccentricity, which exact value depends on the thermodynamic properties of the disk and was found to be close to 0.4 by D’Orazio & Duffell (2021) and Zrake et al. (2021).
2.3.4 Gravitational Waves
The last stage of orbital decay is dominated by GW emission, described following Peters (1964)
| (6) |
and
| (7) |
where is the source frame chirp mass. The factors and are
| (8) |
and
| (9) |
2.4 Summary
In summary, for each of the 8168 orbital configurations (4 for each of the TNG50-3 derived galaxy models), the decay of the orbit of the sMBH is computed from DF forces (Sect. 2.3.1) from a starting separation of kpc to the MBHB influence radius . Within that radius, the evolution of the sMBH is calculated from the combination of LC scattering (Sect. 2.3.2), VD forces in a circumbinary disk (Sect. 2.3.3), and GW emission (Sect. 2.3.4). The sum of the latter three processes determines the orbital decay below as 888This approximation is valid because usually one process dominates the evolution of the MBH pair and because the time-step of the calculation ( of the orbital period) is significantly shorter than the inspiral timescale (Fig. 1).. The evolution of the eccentricity in each time step is assumed to be due to the dominant mechanism only (given by the largest in that particular time-step). The calculation ends, and the MBHs are deemed to have coalesced, when the orbital separation reaches . We do not consider the evolution of the MBHB orbit due to the influence of any additional MBHs that may be transported to the galactic nucleus after a subsequent galaxy merger (Hoffman & Loeb, 2007; Amaro-Seoane et al., 2010; Ryu et al., 2018; Bonetti et al., 2019). The impact of this assumption is discussed in Section 7.
3 Timescales for Evolution of MBH Pairs from kpc Scales to Coalescence
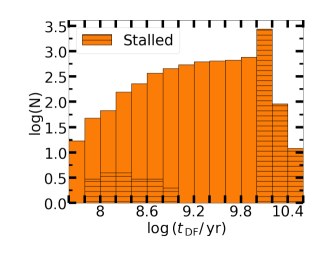
Figure 1 shows the distribution of evolution times found from the suite of 8168 MBH orbits. The histogram in the upper-left panel plots the range of times, , found in the DF stage, when the separation drops from kpc to . The majority of the studied configurations have timescales of Gyrs, consistent with the times found by LBB20a for motions dominated by gaseous DF.
Indeed, we find that % of the models never reach coalescence, with the vast majority of these stalling in the DF phase (the hatched region on the right-hand side of the histograms). These are models in which the gaseous DF force is minimized because of the nature of orbit, leading to very lengthy decay times. This can be seen by examining the stalled fractions for the individual orbital configurations: % (prograde, ), % (prograde, ), % (retrograde, ) and % (retrograde, ). The configurations with the largest stalled fractions are the ones where the sMBH will likely have a large relative velocity relative to the gas disk, diminishing the effectiveness of DF (LBB20a).
The remaining 25 MBHBs that do not merge in a Hubble time, as shown by the hatched bars around in Figure 1, skip the DF-dominated stage and directly enter the LC dominated stage when the calculation starts. Even though they are relatively gas rich (with gas fractions ), their spatially extended gas and stellar distributions have densities too low to extract sufficient orbital energy from the sMBHs within .
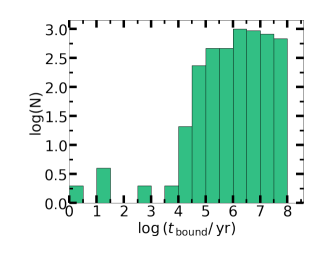
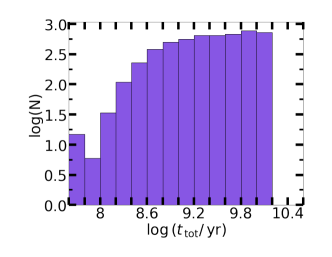
The distribution of timescales from to coalescence, denoted as , is shown in the upper-right histogram. These timescales span four orders of magnitude, from to years, and are thus much shorter than . As a result, the distribution of the total evolution time, from about 1 kpc to coalescence (, shown in the lower-left) looks nearly identical to the distribution. It follows that for a vast majority of systems the DF phase is the most important mechanism in determining the rate of the MBHB coalescences. Stating this differently: the measurement of the rate of MBHB coalescences should provide direct constraints on the rate of evolution of the MBH pairs in merger galaxies due to DF, a point which we discuss in Section 7.1.
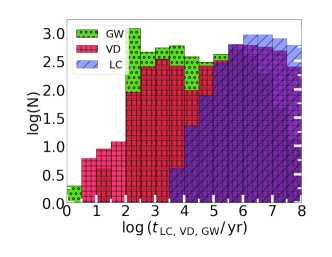
Although the orbital evolution within is actually computed using the combination of three mechanisms (LC, VD and GW), it is interesting to calculate how long would any one of them dominate if it operated by itself (i.e., by neglecting the two sub-dominant mechanisms). These distributions are shown in the lower-right panel of Fig. 1, and we emphasize that this way of separating the different evolution times is only for illustration purposes. The histograms show that time spent in the LC dominated stage is on average longer than that spent in the VD or GW dominated stage.
There are 45 model galaxies ( of the TNG50-3 derived systems) with stellar but no gas components. The evolution times of the sMBHs in these models are longer than since their stellar components do not extend far enough to encompass the sMBH orbit. Without DF from gas disks to transport them, these sMBHs stall at radii outside the stellar bulge. Moreover, there are another 128 galaxies ( of the TNG50-3 derived systems) with very extended gas and stellar distributions and high orbital eccentricities. The initial semi-major axes of the MBHBs in these galaxies are already smaller than , meaning that these sMBHs skip the DF-dominated stage and directly enter either the LC- or VD-dominated stages when the calculation starts. Most of these MBHBs coalesce before , and 25 of them stall at the LC dominated stage, as explained in the third paragraph of this section.
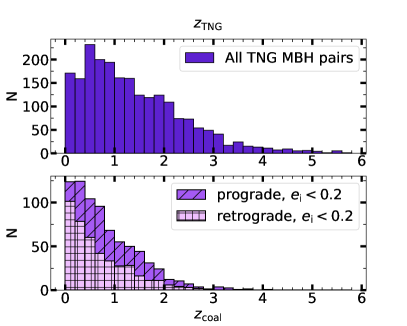
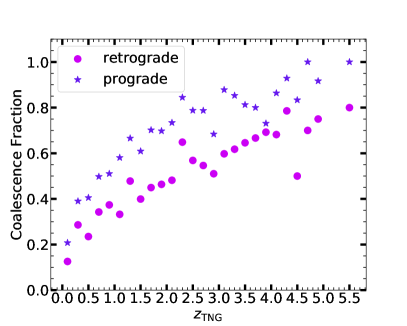
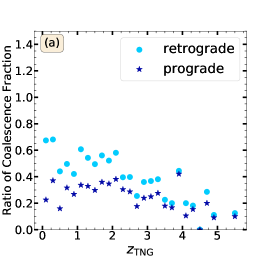
Figure 2 shows how the range in maps onto a redshift distribution of MBH mergers. The redshift distribution shown in the top left panel are in terms of , the redshift of the MBH pair when it reaches the TNG50-3 resolution limit of kpc. This is the parent distribution at the time when the evolution calculations started. This distribution peaks at . The hatched histograms in the bottom left panel represent the coalescence redshift distribution for MBHBs in prograde/retrograde orbits with that coalesce before . The peak of these distributions moves towards indicating that most of the MBH mergers will be at . However, as mentioned above, a large fraction of the simulated MBH pairs will not merge within a Hubble time. The right panel of Fig. 2 shows that the fraction of systems that coalesce before increases significantly as a function of the initial redshift, . In fact, if a prograde MBH pair at has a separation larger than kpc, then it has % chance of reaching coalescence before . This redshift threshold increases to for pairs on retrograde orbits, because of their much longer (LBB20a).
4 The Effect of Galactic Properties on the MBHB Coalescence Rate
Here, we describe how properties of the post-merger galaxy affects the likelihood of MBHB coalescence (Sect. 4.1). The integrated MBHB coalescence rate predicted for the four different orbital configurations is presented in Sect. 4.2.

4.1 MBHB coalescence fraction as a function of , , and
As discussed in the previous section, whether a MBH pair
eventually coalesces following a merger is determined by the time spent in the DF stage
between kpc and . Therefore, the chances that
a coalescence will occur depends most strongly on the properties of the
host galaxy that impact the DF evolution timescale at these
distances. These properties are the gas fraction (), the
mass of the pMBH (), the bulge mass (), and the MBH mass ratio
()999See LBB20a for the effect of these properties on the DF force..
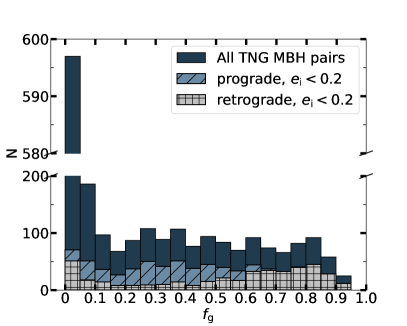
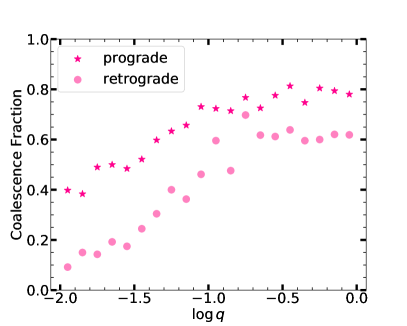
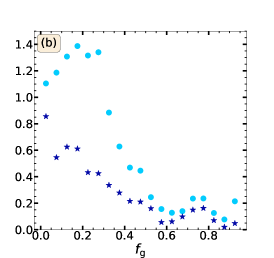
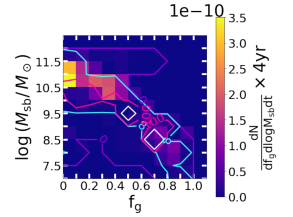
(a) Gas fraction, – The left panel of Figure 3 shows the parent population of in the galaxy models constructed from the TNG50-3 simulation (Sect. 2.2). Overplotted are two distributions of post-merger galaxies that host a sMBH in a low orbit and in which the MBHB merges before . These distributions show that the MBHB mergers are more likely to happen when , especially when the sMBH is on a prograde orbit. This is a consequence of the increased efficiency of gaseous DF forces in decaying the orbit of the sMBH (LBB20a). In particular, retrograde orbits rarely result in a high coalescence fraction because of the high relative velocity between the sMBH and the gas disk lowers the effectiveness of DF (LBB20a).
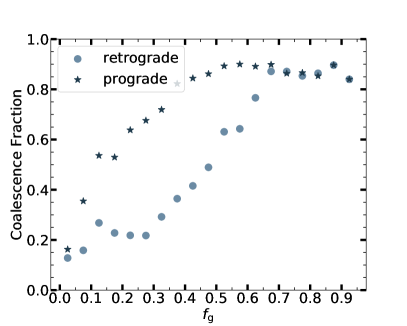
This conclusion is reinforced by examining the coalescence fraction
from all 8168 orbital evolution models as seen in the right panel of
Fig. 3. As increases from zero, the coalescence
fraction for prograde orbits (stars) increases and reaches a maximum at , after which it
becomes roughly flat for larger . At larger , the difference in coalescence fraction caused
by the orbital direction nearly vanishes due to the sMBH moving
subsonically in the high density and high temperature gas.
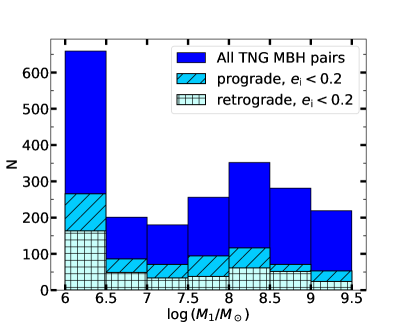
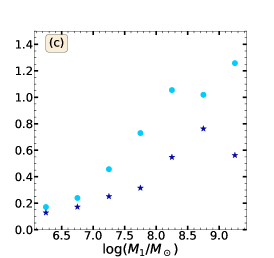
(b) Mass of the primary MBH, –
Figure 4 shows the dependence of the coalescence
fraction on the mass of the
pMBH. The peak of the mass distribution for parent pMBHs from TNG50-3 is at and the coalescence fraction is
highest for galaxies with these pMBHs. This is a result of the fact
that systems with low often have medium to high in the
TNG50-3 simulations. For example, MBH pairs with () tend to have (), and higher values of lead to more efficient evolution
via gaseous DF (Fig. 3).
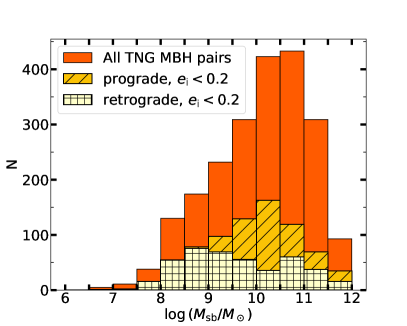
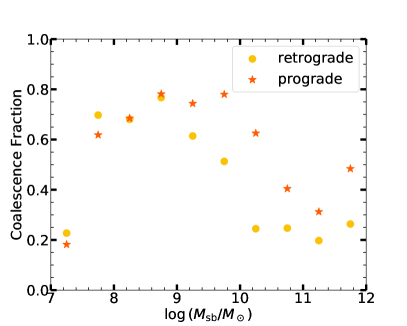
(c) Bulge mass, – Figure 5 shows the dependence of the coalescence
fraction on the mass of the stellar bulge, . The parent distribution peaks at , but the coalescence
fractions are largest for . These merger fractions are largely influenced by the relationship
between and (Sect. 2.1). When the bulge
mass is smaller than , the galaxy models
tend to have high (and thus, high gas densities and sound speeds) on average,
so their sMBHs move subsonically, and experience reduced gaseous DF.
For between and , becomes smaller and gaseous DF efficiently
decays the orbit of the sMBH (see also Fig. 3). When
, falls to low enough
values that gaseous DF again becomes inefficient.
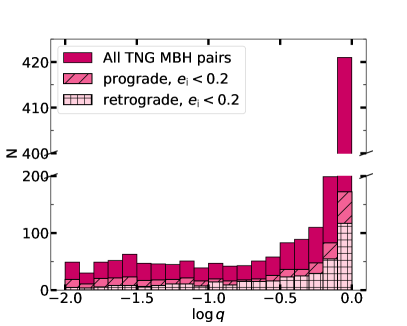
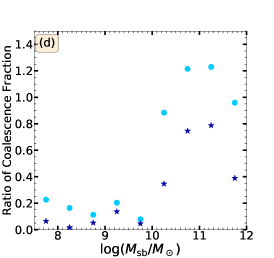
(d) MBHB mass ratio, – Figure 6 shows the dependence of the coalescence fraction on the mass ratio of the MBH pair, . The parent distribution of MBH pairs taken from the TNG-50 simulation peaks at , but the coalescence fraction is roughly constant (at 70-80%) for . These relatively high merger fractions arise because the DF force is larger (and inspiral time shorter) for higher mass sMBHs (LBB20a; their Figure 11). Interestingly, there is a significant fraction of mergers () even at a relatively low mass ratio of when the sMBH is in a prograde orbit. This indicates that secondary MBHs on prograde orbits will have a decent probability of merging before over a very broad range of .
4.2 The MBHB coalescence rate
The results in the previous section can now be used to compute the integrated MBHB coalescence rate from to (the largest ‘merger’ redshift in TNG50-3) for the four different orbital configurations of the sMBH. The integrated coalescence rate () is defined as the total number of MBHBs that reach coalescence before per unit observer time (Haehnelt, 1994),
| (10) |
where is the luminosity distance to redshift and is the comoving number density of merging MBHBs. For each of the four orbital configurations, is calculated from binning all coalescences in unit intervals of and dividing it by the total comoving TNG volume, ( cMpc)3. The resulting values of calculated from Eq. 10 are listed in the second column of Table. 1.
| Orbital Configuration | Coalescence Rate (yr-1) | Detection Rate (yr-1) | Coalescence Rate (yr-1) | Detection Rate (yr-1) |
|---|---|---|---|---|
| (with RF) | (with RF) | |||
| prograde and | 0.45 | 0.34 | 0.1 | 0.02 |
| prograde and | 0.32 | 0.30 | 0.04 | 0.02 |
| retrograde and | 0.2 | 0.14 | 0.09 | 0.02 |
| retrograde and | 0.26 | 0.24 | 0.04 | 0.02 |
The largest predicted coalescence rate, yr-1, occurs if the sMBHs are on prograde orbits with low initial eccentricity . This drops to yr-1 for MBHs on high , prograde orbits. MBHs on high eccentricity orbits spend large fractions of orbital period moving slowly at large distances, where the gas density is low. Thus, gaseous DF forces are less effective in decaying these high eccentricity orbits (LBB20a). MBH pairs where sMBHs are moving on retrograde orbits have the lowest coalescence rate of yr-1 (low ) or yr-1 (high ). These low rates are due to the large relative velocity of the gas disk and the sMBH, which reduces the effectiveness of the gas DF force (LBB20a). MBHs with such orbital configurations tend to stay at large separations for a long time, and many of them do not reach coalescence before .
5 The Effect of Galactic Properties on LISA Detection Rates
The previous section described how the MBH coalescence fractions and rates are impacted by the properties of post-merger galaxies and the orbital configuration of their sMBHs. We now utilize our MBH evolution calculations to predict the LISA detection rates of inspiralling MBHBs as a function of the same properties. The calculation of the signal-to-noise ratio (SNR) for a GW event detected by LISA is presented in Appendix A. In this work we will assume SNR of 8 as the detection threshold for LISA, as by Bonetti et al. (2019).
For each of the four orbital configurations considered in our calculations, we identify the systems with MBHs that coalesce before . We then evaluate the cumulative SNR in the inspiral phase only using Eqs. (1), (2), (5), (6), (7), (A4), and assuming a four year LISA mission lifetime. We neglect the contribution to the SNR from the merger and ringdown phase, as it is relatively small and does not change the predicted LISA detection rates (Bonetti et al., 2019). The resulting LISA detection rates for the four configurations are listed in the 3rd column of Table 1. Unsurprisingly, the detection rates follow the same pattern as the total MBHB coalescence rates with the largest rate ( yr-1) occurring in systems where the secondary is on a prograde orbit with low , and with retrograde configurations giving the lowest rates. Interestingly, there is a small difference between the coalescence and LISA detection rates for MBHBs which began with a large . Thus, almost all coalescing systems with high eccentricity yield a LISA detection.
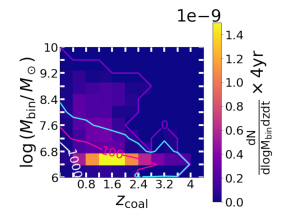
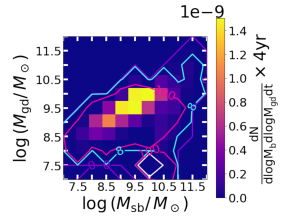
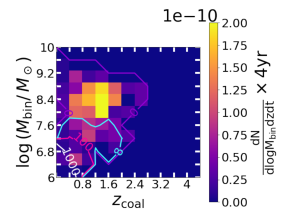
To illustrate how LISA detections are connected to the parameters of the host galaxy models, Figure 7 shows the two-dimensional differential number of all mergers expected in four years of LISA mission time for four different combinations of the galaxy properties. Overplotted on each figure are contours of the LISA SNR. The figure makes use of the prograde, low set of models. The three remaining orbital configurations result in qualitatively similar distributions with different normalizations.
The upper-left panel shows the differential number of mergers as a function of and . The number of coalescences in four years is highest in systems with and . The detected SNR also peaks on the low MBHB mass end and is higher at smaller . MBHBs with total mass are “louder” than others because LISA is most sensitive in the frequency range corresponding to their mass. The SNR of MBHBs at low redshifts is large simply because of their proximity to the Earth. Taking both the coalescence frequency and SNR into account, we expect that most LISA detections should originate from , and have SNR . Detections of sources with SNR and would be extremely rare.
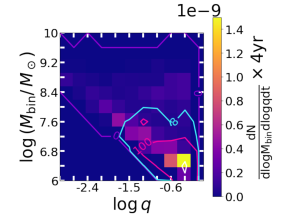
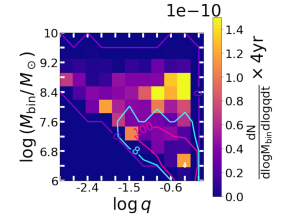
The upper-right panel of Fig. 7 shows the differential number of mergers as a function of and . The number of mergers in four years is the highest in systems with and . The SNR distribution peaks in the same location in the parameter space, hence we expect these MBHBs to be the loudest and most frequently detected LISA sources.
The differential number of mergers as a function of and is shown in the lower-left panel. The number of mergers in four years is highest in systems with and , as seen earlier in Figs. 3 and 5. The LISA SNR contour envelopes all values in this parameter space. Therefore, the probability of a LISA detection is largely independent of the and of the host galaxy.
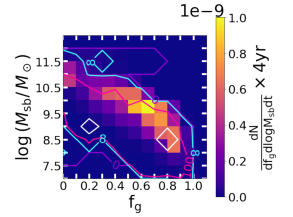
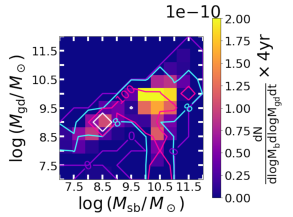
Finally, the differential number of mergers as a function of and is shown in the lower-right panel of Figure 7. The coalescence frequency is the highest in systems with and , as this combination of gas disk and bulge mass leads to the highest and coalescence rates. Again, the SNR contour envelopes these points, indicating that these mergers will nearly all be detected by LISA.
In summary, LISA should detect most of the MBH pairs in the TNG50-3 simulation that form before . This is because the systems that merge this quickly are ones with efficient gaseous DF, which largely depends on the gas fraction of the host galaxy. In the TNG50-3 simulation, higher is typically associated with lower mass MBHs, placing these mergers squarely in the prime sensitivity range of LISA. As a result, we predict that LISA detections of inspiralling MBHBs will be concentrated in systems with binary masses in the range of and mass ratios of , residing in galaxies with , and gas disk and bulge masses of . Furthermore, these detections are expected to be characterized by SNR .
6 The Impact of Radiation Feedback (During the Dynamical Friction Phase)
The results presented above show that the MBH coalescence and LISA detection rates predicted from the TNG50-3 galaxies sensitively depend on the efficiency of the gaseous DF force on the sMBH. It is therefore worth evaluating any effects that arise during the DF driven evolution that could potentially modify the predictions laid out in the earlier sections. One important effect not taken into account in the calculation of the effect of DF up to this point is that the sMBHs residing in gas-rich hosts will accrete from their surroundings, as they move through the inner-kpc, and form a hot, ionized bubble around the MBH. Depending on the velocity of the sMBH relative to its gaseous surroundings, and the properties of the gas, the gaseous bubble may pull the MBH forward in its orbit, diminishing the effect of gaseous drag, as expected in the absence of radiative feedback (Park & Bogdanović, 2017a; Gruzinov et al., 2020; Toyouchi et al., 2020). This effect, dubbed “negative DF”, slows down the inspiral of sMBHs, increases the time they spend at large separations, and therefore potentially reduces the number of MBHB mergers that occur in a Hubble time (LBB20b). Given the significance of gaseous DF for the predicted merger rates (manifested as a dependence on the gas fraction ), we recalculated the evolution for all MBH pairs drawn from TNG50-3, now taking into account the effects of radiation feedback (RF) as described by LBB20b. As seen below, the negative DF significantly alters the expectations for LISA detections.
6.1 The Effects of Radiation Feedback on the Coalescence Rates
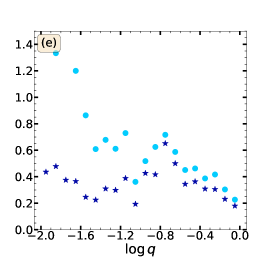
Figure 8 shows how the coalescence fractions presented in Sect. 4.1 change with the inclusion of RF. Each panel shows the ratio of the coalescence fractions (defined as the fraction of coalesced MBHBs in the calculation with RF divided by the fraction of coalesced MBHBs in the calculation without RF) for different properties of the model post-merger galaxies. As in Figs. 2–6, we show results for all four orbital configurations. The panels in Figure 8 illustrate a substantial reduction in the coalescence fraction for MBHs on prograde orbits and in gas-rich galaxies (i.e., high , low , or low ; panels b, c and d). In these cases, the coalescence fractions fall to less than –% of the values found without RF.
This dramatic effect results from the fact that MBHs on prograde orbits are more likely to have relative velocities that are comparable to the local sound speed, a necessary condition for negative DF to operate (LBB20b, their Eq. 1). In contrast, MBHs on retrograde orbits will more likely have large relative velocities and are therefore less impacted by negative DF. Therefore, we find that MBHs on retrograde orbits are more likely to coalesce before in the presence of RF effects (panel a), a reversal from the findings in Sect. 4.1. We emphasize that RF only affects MBHBs during the evolution stages dominated by gaseous DF and is not accounted for in the evolution within . Hence, the drop in coalescence rate of MBHBs is a direct consequence of the increase in caused by the negative DF. The potential impact of RF on the orbital evolution at even smaller separations is discussed in Sect. 7.
Interestingly, Fig. 8 shows that the nominal MBHB coalescence fraction, calculated in the absence of RF, can in some cases be increased in the presence of RF. This is the case for all data points with the value of the ratio of coalescence fraction and happens when the sMBH is on a retrograde orbit and the merger galaxy has (panel b). The enhanced coalescence fractions also correspond to more massive pMBHs that tend to reside in galaxies with large bulge masses (panels c and d; Nelson et al., 2019a, b; Pillepich et al., 2019) and in binaries with low (panel e).
This can be understood as follows. The RF (and negative DF) effects are usually not important for MBHs on retrograde orbits because of the large relative velocity between the MBH and the galactic gas disk. If however the MBH is on a sufficiently eccentric orbit, then its relative velocity can fall into the appropriate range to satisfy the negative DF criteria (LBB20b; their Eq. 1). In the context of the systems considered here, the negative DF criteria are satisfied for lower mass sMBHs orbiting in lower gas density (and lower gas fraction) galaxies. In such systems negative DF accelerates the sMBH at pericenter, leading to a further increase of its orbital eccentricity (LBB20b). As a result, the sMBHs on these orbits reach small pericentric distances and start to interact with the circumbinary disk in the nucleus of the merger galaxy. This causes their eccentricities to grow even more and ultimately, the sMBH to plunge into the pMBH. According to Fig. 8, the coalescence fraction of retrograde sMBHs in host galaxies with a large stellar bulge () is boosted the most. This is because stellar DF helps to shorten the evolution time before the sMBHs enter the circumbinary disk and plunge into the pMBHs. Recall that galaxies with massive bulges also tend to have more massive pMBHs, thus explaining the dependence on this parameter in panel (c) and a preference for low mass ratio systems in panel (e).
The resulting integrated MBHB coalescence rates that include the effects of RF are listed in the 4th column of Table 1. The largest rate is still found for MBHs moving on prograde, low orbits, but it is now yr-1, or of the value calculated in the absence of RF. If the sMBHs are on prograde and high orbits, the RF affected drops to yr-1, of its original value, which is the largest reduction of the four configurations. Radiation feedback has the smallest impact on the coalescence rate for systems with sMBHs on retrograde, low orbits. In this case, yr-1 which is only a 50% reduction. MBHs on these orbits are least affected by the RF due to the large relative velocities of these orbits, which makes them largely immune to the effects of RF.
6.2 The Effects of Radiation Feedback on the LISA Detection Rates
We find that RF significantly reduces the rate of MBHB mergers found in our TNG50-3 derived sample of post-merger galaxies. In addition, the MBHs that do merge are now found in low galaxies. As mentioned in Sect. 5, there is an apparent anti-correlation between and in the TNG50-3 galaxies. Thus, a low typically corresponds to galaxies with larger (Nelson et al., 2019a, b; Pillepich et al., 2019), the mass end more challenging to detect with LISA (see Figure 3). Therefore, we expect that the RF effects will most significantly reduce the merger rates of the lower mass MBHs, that are considered prime targets for LISA.
These effects are illustrated in Figure 9 which shows the two-dimensional differential number of mergers expected in four years overplotted with contours of the LISA SNR, calculated as in Sect. 5. In the presence of RF the largest number of mergers is expected for large larger and low . The top two panels of this Figure show that the majority of mergers now fall outside the SNR detection threshold, in contrast to the outcome of the calculation which does not include the impact of RF (see the corresponding panels in Fig. 7). The bottom two panels show that any detection LISA can make will be tightly confined to high mass and gas-poor host galaxies. Indeed, the effects of RF may make LISA detections in any gas-rich galaxy extremely rare.
The final column of Table 1 shows that the total predicted LISA detection rates from the RF calculations are yr-1, independent of the orbital configuration. Thus, only 20% of the prograde, low mergers would be detectable by LISA, but about half of the high mergers would be detectable. Therefore, as expected, we find that there is a significant reduction in the fraction of merging MBHBs that would be detectable by LISA if RF plays an important role in the DF phase of the orbital decay.
7 Discussion
7.1 Comparison with Results in the Literature
In previous sections we provide predictions for the LISA detection rate and the properties of MBHBs that are most likely to become loud LISA sources using data from the TNG50-3 simulation as input. TNG50-3 data provide a large parameter space of MBH and merger galaxy properties: pMBH masses in the range of , mass ratios , central gas number densities , and redshifts from 0 to 6.
The LISA detection rate predicted by our model ( in the absence of RF, see Section 5) is comparable to but somewhat lower than those found by Salcido et al. (2016) and Katz et al. (2020). Katz et al. (2020) used results from the cosmological simulation Illustris, with evolution times for MBH pairs with separations kpc calculated using semi-analytic models described by Dosopoulou & Antonini (2017) and Kelley et al. (2017).
The model by Dosopoulou & Antonini (2017) treats the host galaxy as a singular isothermal sphere of stars and assumes that the sMBH remains embedded in a core of stars with a mass of times its own mass. The stellar remnant around the sMBH causes it to sink faster towards the galaxy’s center. This model takes into account the stellar DF, LC scattering, and the GW emission, but does not consider the effect of gaseous DF, radiative feedback, and the interaction with the circumbinary disk.
The model by Kelley et al. (2017) numerically integrates orbital evolution of MBH pairs from large separations until coalescence. In this model, the stellar DF is implemented following Chandrasekhar (1943), and thus assumes that the perturber is moving in a uniform stellar environment and only stars that are moving slower than the perturber contribute to the DF. However, depending on the bulge properties, the stars that are moving faster than the sMBH can also contribute to the stellar DF (Antonini & Merritt, 2012). After the DF stage, the LC scattering and the interaction with the circumbinary gas disk, the GW emission continues to harden the binary until coalescence. This model does not take into account the stellar DF from fast moving stars, the gaseous DF, and the effect of radiative feedback.
Overall, Katz et. al. predict a LISA detection rate of for MBHBs with masses larger than . Their prediction is slightly larger than ours, which is as expected, since the minimum mass in Illustris simulation is . Thus, their work includes a broader range of binary mass, especially at the lower end, which makes their prediction for the LISA detection rate higher.
Salcido et al. (2016) use results from the cosmological hydrodynamic simulation suite EAGLE. They assume constant delay times between the galaxy merger and MBH coalescence, based on the gas content of the merger remnant galaxy. If the galaxy is gas-rich they assume a delay of 0.1 Gyr, or, if the galaxy is gas-poor, the delay is set to 5 Gyr. They also consider a variation of the evolution model where a prescription for the expected delays has been included after their host galaxies merge, and find that the merger rate is similar in all models. The MBH pair evolution time however depends on many more properties besides the gas fraction, hence, an assumption of constant evolution times makes the uncertainty in the LISA detection rate relatively large. Salcido et al. (2016) predict the LISA detection rate to be , six to seven times higher than ours, because their assumed time delays are on average shorter than the ones we calculate. Furthermore, the potential LISA detections by Salcido et al. (2016) are mostly contributed by coalescences between seed mass black holes merging at redshifts between and . This indicates that the detection rate they calculate is mainly for MBHs with masses less than , which also explains their higher predicted detection rate.
More recently, Volonteri et al. (2020) used the cosmological simulations HORIZON-AGN (Dubois et al., 2014) and NEWHORIZON (Dubois et al., 2021), to estimate the merger rate of MBHBs. Both simulations use the MBH seed mass of , similar to TNG50, but represent different cosmological volume sizes that provide more complete census for either the high mass galaxies hosting MBHs (HORIZON-AGN) or the lower mass galaxies with MBHs (NEWHORIZON). Similar to this work, Volonteri et al. (2020) use a semi-analytic model to follow the evolution of MBH pairs below the spatial resolution of each simulation. For HORIZON-AGN, Volonteri et al. (2020) predict the cumulative MBHB coalescence rate measured by an observer at of yr-1, based on a model most closely comparable to ours. This is similar to the rate calculated in this work, in the scenario when RF is not taken into account. The cumulative MBHB coalescence rate for NEWHORIZON is yr-1, about two times larger than our prediction for MBH coalescence rate in the absence of RF.
From fully semi-analytic models, that rely on their own MBH seeding prescriptions instead on those of cosmological simulations, Klein et al. (2016) and Berti et al. (2016) predict LISA detection rates yr-1. This rate corresponds to the physical scenario where MBHs form from heavy seeds. We focus on this seeding prescription in our comparisons because it most closely corresponds to the MBH seeding prescription in TNG. The models in both mentioned studies include dynamical friction, stellar scattering, viscous drag, gravitational wave emission, and take into account a possibility of triple MBH systems. The model by Klein et al. (2016) is adopted from Barausse (2012), which was subsequently improved by Sesana et al. (2014), Antonini et al. (2015a) and Antonini et al. (2015b). We are using the same gas disk and stellar bulge density profiles as Klein et al. (2016) but neglect the DF from the stellar disk, which we showed is negligible relative to the stellar bulge and gas disk (LBB20a).
It is interesting to note that predictions for the LISA detection rates are generally higher when calculated from models that use semi-analytic heavy MBH seed prescriptions as a starting point instead of cosmological simulations. This is caused by the differences in the MBH seeding approaches. Namely, the seeding in semi-analytic prescriptions is not limited by numerical resolution and they can generate arbitrarily small MBH seeds (usually in the heavy-seed scenarios). Therefore, semi-analytic prescriptions can populate with MBHs the low mass end of host galaxies, that are the major sources of coalescences at high redshift, where dwarf galaxies frequently merge into larger central galaxies. Cosmological simulations like EAGLE, Illustris and TNG are limited by their mass resolution and can only produce MBH seeds with mass at redshifts smaller than those in semi-analytic prescriptions. As a result, the studies relying on cosmological simulations miss coalescences of low mass galaxies at high redshift, and this is the major reason for their comparatively low LISA detection rates.
7.2 Impact of Radiative Feedback on the LISA Detection Rate
An aspect unique to this study is the calculation of the cosmological MBHB coalescence and LISA detection rates when the effects of radiative feedback are taken into account. If negative gaseous DF operates in real galaxies as described in the literature so far (Park & Bogdanović, 2017a; Gruzinov et al., 2020; Toyouchi et al., 2020), this should result in longer inspiral times from kpc scales and reduction of the MBHB coalescence rate by and the LISA detection rate to . While the quoted rate worrisomely implies less than one detection in 4 years of nominal LISA mission time, we emphasize that our model provides a conservative estimate of the LISA detection rates, due to the limited MBH mass range in TNG50-3. The relative reduction of the MBHB coalescence rate however is a robust prediction, as long as theoretical models capture how DF operates in the presence and absence of RF.
This is interesting in light of the finding discussed earlier, that to the first order, the DF alone is sufficient to determine the distribution of total evolution time for a population of MBH pairs (as illustrated by Figure 1). In other words, for a population of MBH pairs, the approximate distribution for can be recovered even if the evolution due to the loss cone scattering, viscous drag and gravitational wave emission is neglected. Because is closely related to the rate of the MBHB coalescences, the measurement of the latter should provide direct insights in how DF operates in mergers. This is important because, although widely embraced as a mechanism for orbital evolution of MBH pairs, DF is still a theoretical concept and is yet to be verified in observations.
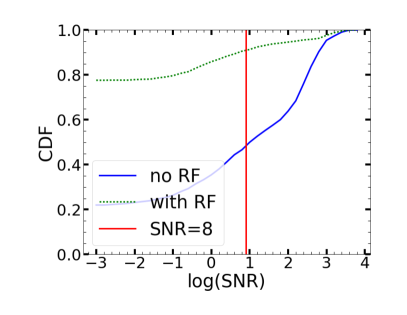
For example, low MBHB coalescence rates inferred from LISA measurements would necessitate consideration of the effects of radiative feedback. As shown in Figure 10, in the absence of RF nearly of all MBHBs from TNG50-3 have . Alternatively, in the presence of RF only of events can be detected by LISA. Intriguingly, we also find that in the presence of RF nearly the same percentage () of LISA detections correspond to each of the four orbital configurations in our study, if all are equally represented (see Section 6). This means that if the importance of RF is established for the observed GW events, it should also be possible to recover the underlying distribution of orbital eccentricities, given that in that case orbits of all eccentricities are equally likely to result in the coalescence and detection.
7.3 Impact of Simplifying Assumptions
The advantage of our semi-analytic model is the ability to run simulations quickly over a wide range of galaxy and MBH orbital properties at the cost of making some simplifying assumptions. The potential impact of our assumptions on the dynamical aspects of MBHB evolution is discussed in our previous works (LBB20a,b). In this section, we consider the possible effects of these assumptions on the LISA detection rates.
In this work, we assume the pMBH is fixed at the center of the host galaxy. If the motion of the pMBH and its orbital decay due to DF forces are included in the simulations, the resulting would be shorter, consequently increasing the coalescence rate and LISA detection rate. This effect would be strongest in comparable mass MBH pairs and weaker in those with small . Allowing the pMBH to move around the center of mass would also increase the number of high redshift LISA detections since MBHBs at high redshifts tend to have larger mass ratios.
We furthermore posit that the orbit of the sMBH is always in the midplane of the galaxy. For the sMBH on an inclined orbit, that takes it outside of the gas disk, generally increases since the gaseous DF force is less efficient. This results in lower coalescence and LISA detection rates independent of the presence of RF.
In our simulation, we assume there is no stellar remnant around the sMBH. The pertinent question is what fraction of the remnant nuclear star cluster is still bound to the sMBH when it reaches the starting point for our simulations (a separation of kpc). The answer to this question differs, depending on the specific study and model used. For example, this question was examined by Kelley et al. (2017), who assumed that the mass of the sMBH and the remnant cluster decreases as a power law. They find that after a dynamical time, the stellar enhancement runs out and the hardening rate approaches that of a bare sMBH by kpc. In another model (Dosopoulou & Antonini, 2017), the mass of the remnant stellar cluster around the sMBH can be significant at kpc separation. If so, the orbital evolution time of the sMBH would be shorter than calculated in our work.
Another assumption adopted in this work is that MBHs do not grow in mass during their orbital evolution from kpc scales toward coalescence. The mass ratios of MBH pairs in the calculations change, on average, by during the DF dominated stage (Li et al., 2021). However, the change in mass ratio during the evolution in the circumbinary disk depends sensitively on the binary accretion model. Many simulations have shown that the accretion occurs preferentially onto the smaller MBH in a binary because being closer to the inner rim of the circumbinary disk allows it to more easily capture gas (Artymowicz & Lubow, 1994; Gunther & Kley, 2002; Hayasaki et al., 2007; Roedig et al., 2011; Nixon et al., 2011; Farris et al., 2014). This phenomenon speeds up orbital decay in the disk as the sMBH may grow at a higher rate and the mass ratio of the binary may become larger (Siwek et al., 2020). By assuming a fixed mass ratio throughout the evolution, we effectively provide a more conservative coalescence rate and the LISA detection rate. If the accretion driven mass growth of MBHs by accretion is taken into account, we expect both rates to increase.
We assume that the DF does not contribute to the orbital decay when the separation between the two MBHs is smaller than the influence radius. This potentially leads us to underestimate the rate of orbital inspiral, since DF (and especially the stellar DF exerted by the bulge on the sMBH) can be of the same importance as the the loss cone scattering or viscous drag at separations where one mechanism transitions to another. If instead we took into account the contribution of DF to the orbital decay below the influence radius, the coalescence rate and the LISA detection rate would be higher. We expect this to be the case regardless of the presence or absence of the effects of radiative feedback.
We do not account for the DF generated by the stellar disk in the merger remnant galaxy, since in our previous study we found it to be negligible in most cases (Li et al., 2020a). Bonetti et al. (2021) have shown however that in some situations (i.e., when the gas fraction is low) the DF from the stellar disk could be important. Thus, taking the DF from stellar disks into account would result in shorter time to coalescence for MBH pairs in such galaxies and would consequently boost the coalescence and LISA detection rates. This is especially true for systems affected by radiative feedback, in which the DF from stellar disks could counter the negative DF from the gas.
We neglect the dynamical evolution and coalescences that arise as a consequence of the formation of MBH triplets. At high redshift, where the merger rate of galaxies is higher, it is possible for a third MBH to inspiral and join the orbital decay of a MBHB. The system may undergo the Kozai-Lidov oscillations, which could boost the eccentricity of the central binary and in such way speed up its coalescence (Kozai, 1962). Besides the Kozai-Lidov oscillations, the chaotic three-body interactions can also boost the coalescence rate (Blaes et al., 2002; Hoffman & Loeb, 2007; Amaro-Seoane et al., 2010; Kulkarni & Loeb, 2012; Bonetti et al., 2016; Ryu et al., 2018). Consequently, the three-body interactions can bring a sizeable number of stalled MBHBs to coalescence when other mechanisms fail to work (Bonetti et al., 2018, 2019). According to Bonetti et al. (2019), the interaction between MBH triplets can increase the coalescence rate by in the case of the heavy-seed model.
The description of RF used here is based on idealized simulations that assume an isolated MBH moving on a linear trajectory in a uniform gas density and an infinite background medium (Park & Bogdanović, 2017b; Toyouchi et al., 2020). It is possible that the non-uniform environment in the aftermath of the galactic merger will perturb the smooth orbital decay of the sMBH (Fiacconi et al., 2013) and weaken the effects of RF, in particular the acceleration due to negative DF. Similarly, when the radius of the HII region around the sMBH exceeds the half thickness of the gas disk, radiation can escape the disk plane, reducing the impact of RF. However, three-dimensional simulations of MBH evolution that include both gaseous DF and RF also show a weakening of the DF force (Sijacki et al., 2011; Souza Lima et al., 2017). Thus, current work indicates that relaxing the assumptions in the RF model will reduce but not erase the negative DF effects of RF. We conclude that future studies of MBH coalescence rates should carefully consider the potential impact of RF during the DF decay phase of the sMBH.
In this work, we considered the effect of RF on DF only, but studies have shown that the RF can also affect the dynamical evolution of sMBHs in the circumbinary disks. According to del Valle & Volonteri (2018), when there is no tidal cavity in the disk, the sMBHs can accrete at high rates. The resulting strong winds collide against the disk, pushing the gas away from the binary which stalls the binary migration. On the other hand, when there is already a gap in the disk opened by the sMBH, the RF does not affect the evolution of the binary and the structure of the disk since the wind launched from the sMBH can escape perpendicularly to the disk though the tidal cavity without further disturbing the disk (del Valle & Volonteri, 2018). Our model assumes the gap-opening regime, thus taking into account the RF in the circumbinary disks should not affect our results.
The TNG simulation, and consequently our study, do not capture MBHs with mass lower than about . This leads to an underestimate of the coalescence and detection rates, particularly on the low mass end. This seems to be a limitation shared by multiple models that use cosmological simulations as their input, as discussed in Section 7.1. It is worth noting that our rates are in broad agreement with other such models (Salcido et al., 2016; Katz et al., 2020), even if our detailed approaches differ.
Overall, we expect that our model provides a conservative estimate for the MBHB coalescence rate and the LISA detection rate, and we expect these values to be higher if the above assumptions are relaxed.
8 Conclusions
In this work we evaluate the cosmological coalescence rate and the detection rate of MBHBs targeted by the LISA GW observatory. Our calculation starts with a population of initially gravitationally unbound MBH pairs, with separation of about 1 kpc, drawn from the TNG50-3 cosmological simulation. We then follow their dynamical evolution all the way to coalescence under the influence of the stellar and gaseous dynamical friction and at smaller separations – stellar scattering, viscous drag from the circumbinary disk and the GW emission. We also explore the effects of radiative feedback from the accreting MBHs on their coalescence and detection rates. The main results of this study are summarized below.
-
1.
We find that for a majority of modeled MBH pairs DF determines the total evolution time (see Figure 1), and hence their cosmological coalescence rate, whereas the impact of the physical mechanisms that operate at smaller orbital separations is small. This means that the MBHB coalescence rate, obtained from the GW measurements, will first and foremost provide statistical constraints on the efficiency of DF in merger galaxies. This is an important opportunity to verify the importance of DF in observations which, although widely embraced as a mechanism for orbital evolution of MBH pairs, is still a theoretical concept.
-
2.
Based on our models that do not account for the MBH radiative feedback we find that the MBHB coalescence rate is yr-1, and the LISA detection rate is yr-1. Most LISA detections should have a characteristic SNR and originate from galaxies at redshifts . They will correspond to binaries with masses and comparable mass ratios, , located in gas-rich galaxies with gas fractions in the range . In this case, high gas fractions bode well for a chance to detect the associated electromagnetic counterparts.
-
3.
We find a significant reduction in the number of merging MBHBs if RF plays an important role in the DF phase of the orbital decay. In the presence of RF, the MBHB coalescence rate is reduced by (to yr-1), and the LISA detection rate is reduced by (to yr-1). In this case, we expect most LISA detections to have a lower characteristic SNR and to originate from galaxies at a comparatively lower redshift, . They will correspond to binaries with high masses, , and , located in relatively gas-poor galaxies with gas fractions . Combined with the low GW detection rates, such low gas fractions could make the detection of the associated electromagnetic counterparts difficult, making this observationally the most challenging scenario.
-
4.
In the absence of RF, the MBHB systems that become LISA sources are more likely to evolve in prograde orbital configurations, with either low or high eccentricity. For example, if prograde and retrograde configurations were initially equally represented, we expect of LISA detections to come from MBHBs in prograde orbits. In the presence of RF, we expect equal fractions () of LISA detections to come from MBHBs in prograde and retrograde, low or high initial eccentricity orbits, if all were equally represented initially. Thus, if the importance of RF is established for the observed GW events, it should be possible to recover the underlying distribution of orbital orientations and eccentricities.
We emphasize that our model provides a conservative estimate of the LISA detection rates, due to the limited MBH mass range in TNG50-3. In the case when the effects of RF are not taken into account, our predicted rates are comparable to the models in the literature that draw their MBH pairs from cosmological simulations. Thus, predictions from this class of models seem to be relatively robust against the differences in cosmological simulations and individual model assumptions. The striking reduction of the MBHB coalescence rate in the presence of RF is a prediction unique to this work, without a readily available comparison in the literature. We expect it to be robust, as long as current theoretical models capture the salient properties of DF in the presence of RF.
Further advances in understanding the efficiency of DF on MBHs in merger galaxies, and thus their coalescence rate, can also be made with electromagnetic observations. The current and future X-ray (e.g., eROSITA, Merloni et al. 2012; Athena, Nandra et al. 2013), radio (e.g., ngVLA, Francesco et al. 2019; SKA; Prandoni & Seymour 2014), and optical/IR observatories (e.g., JWST, Gardner et al. 2006) will dramatically increase the population of known dual AGNs. Dual AGNs at separations kpc in particular can provide a test of DF models and timescales, where an overabundance of systems on these scales would be consistent with expectations for the negative DF. On the other hand, some of these systems are progenitors of the LISA sources that will merge within a Hubble time and can therefore be used to predict the LISA detection rate of MBH mergers. In order to do so, one needs to know what types of merger remnant galaxies are most likely hosts to electromagnetically bright dual AGNs and later on, MBH coalescences detectable by LISA. We defer this investigation to our upcoming publication.
References
- Allen et al. (1973) Allen, R. J., Goss, W. M., & van Woerden, H. 1973, A&A, 29, 447
- Amaro-Seoane et al. (2010) Amaro-Seoane, P., Sesana, A., Hoffman, L., et al. 2010, MNRAS, 402, 2308
- Amaro-Seoane et al. (2017) Amaro-Seoane, P., Audley, H., Babak, S., et al. 2017, arXiv e-prints, arXiv:1702.00786
- Antonini et al. (2015a) Antonini, F., Barausse, E., & Silk, J. 2015a, ApJ, 806, L8
- Antonini et al. (2015b) —. 2015b, ApJ, 812, 72
- Antonini & Merritt (2012) Antonini, F., & Merritt, D. 2012, ApJ, 745, 83
- Ardaneh et al. (2018) Ardaneh, K., Luo, Y., Shlosman, I., et al. 2018, MNRAS, 479, 2277
- Armitage & Natarajan (2005) Armitage, P. J., & Natarajan, P. 2005, ApJ, 634, 921
- Artymowicz & Lubow (1994) Artymowicz, P., & Lubow, S. H. 1994, ApJ, 421, 651
- Baes & Dejonghe (2002) Baes, M., & Dejonghe, H. 2002, A&A, 393, 485
- Barack & Cutler (2004) Barack, L., & Cutler, C. 2004, Phys. Rev. D, 70, 122002. https://link.aps.org/doi/10.1103/PhysRevD.70.122002
- Barausse (2012) Barausse, E. 2012, MNRAS, 423, 2533
- Begelman et al. (1980) Begelman, M. C., Blandford, R. D., & Rees, M. J. 1980, Nature, 287, 307
- Begelman et al. (2006) Begelman, M. C., Volonteri, M., & Rees, M. J. 2006, MNRAS, 370, 289
- Begeman et al. (1991) Begeman, K. G., Broeils, A. H., & Sanders, R. H. 1991, MNRAS, 249, 523
- Berti et al. (2016) Berti, E., Sesana, A., Barausse, E., Cardoso, V., & Belczynski, K. 2016, Phys. Rev. Lett., 117, 101102
- Binney & Tremaine (2008) Binney, J., & Tremaine, S. 2008, Galactic Dynamics: Second Edition (Princeton University Press)
- Blaes et al. (2002) Blaes, O., Lee, M. H., & Socrates, A. 2002, ApJ, 578, 775
- Blecha et al. (2016) Blecha, L., Sijacki, D., Kelley, L. Z., et al. 2016, MNRAS, 456, 961
- Bonetti et al. (2021) Bonetti, M., Bortolas, E., Lupi, A., & Dotti, M. 2021, MNRAS, 502, 3554
- Bonetti et al. (2016) Bonetti, M., Haardt, F., Sesana, A., & Barausse, E. 2016, MNRAS, 461, 4419
- Bonetti et al. (2018) Bonetti, M., Sesana, A., Barausse, E., & Haardt, F. 2018, MNRAS, 477, 2599
- Bonetti et al. (2019) Bonetti, M., Sesana, A., Haardt, F., Barausse, E., & Colpi, M. 2019, MNRAS, 486, 4044
- Bortolas et al. (2021) Bortolas, E., Franchini, A., Bonetti, M., & Sesana, A. 2021, ApJ, 918, L15
- Casertano (1983) Casertano, S. 1983, MNRAS, 203, 735
- Chandrasekhar (1943) Chandrasekhar, S. 1943, ApJ, 97, 255
- Chen et al. (2022) Chen, N., Ni, Y., Tremmel, M., et al. 2022, MNRAS, 510, 531
- Chen et al. (2021) Chen, N., Ni, Y., Holgado, A. M., et al. 2021, arXiv e-prints, arXiv:2112.08555
- Curyło & Bulik (2021) Curyło, M., & Bulik, T. 2021, arXiv e-prints, arXiv:2108.11232
- de Blok et al. (2008) de Blok, W. J. G., Walter, F., Brinks, E., et al. 2008, AJ, 136, 2648
- DeGraf & Sijacki (2020) DeGraf, C., & Sijacki, D. 2020, MNRAS, 491, 4973
- Dehnen (1993) Dehnen, W. 1993, MNRAS, 265, 250
- del Valle & Volonteri (2018) del Valle, L., & Volonteri, M. 2018, MNRAS, 480, 439
- D’Orazio & Duffell (2021) D’Orazio, D. J., & Duffell, P. C. 2021, ApJ, 914, L21
- Dosopoulou & Antonini (2017) Dosopoulou, F., & Antonini, F. 2017, ApJ, 840, 31
- Dotti et al. (2015) Dotti, M., Merloni, A., & Montuori, C. 2015, MNRAS, 448, 3603
- Dubois et al. (2014) Dubois, Y., Pichon, C., Welker, C., et al. 2014, MNRAS, 444, 1453
- Dubois et al. (2021) Dubois, Y., Beckmann, R., Bournaud, F., et al. 2021, A&A, 651, A109
- Dunn et al. (2018) Dunn, G., Bellovary, J., Holley-Bockelmann, K., Christensen, C., & Quinn, T. 2018, ApJ, 861, 39
- Farris et al. (2014) Farris, B. D., Duffell, P., MacFadyen, A. I., & Haiman, Z. 2014, ApJ, 783, 134
- Fiacconi et al. (2013) Fiacconi, D., Mayer, L., Roskar, R., & Colpi, M. 2013, ApJ, 777, L14
- Förster Schreiber et al. (2009) Förster Schreiber, N. M., Genzel, R., Bouché, N., et al. 2009, ApJ, 706, 1364
- Francesco et al. (2019) Francesco, J. D., Chalmers, D., Denman, N., et al. 2019, The Next Generation Very Large Array, , , arXiv:1911.01517
- Gardner et al. (2006) Gardner, J. P., Mather, J. C., Clampin, M., et al. 2006, Space Science Reviews, 123, 485–606. http://dx.doi.org/10.1007/s11214-006-8315-7
- Gruzinov et al. (2020) Gruzinov, A., Levin, Y., & Matzner, C. D. 2020, MNRAS, 492, 2755
- Gualandris et al. (2017) Gualandris, A., Read, J. I., Dehnen, W., & Bortolas, E. 2017, MNRAS, 464, 2301
- Gunther & Kley (2002) Gunther, R., & Kley, W. 2002, A&A, 387, 550
- Habouzit et al. (2016) Habouzit, M., Volonteri, M., Latif, M., Dubois, Y., & Peirani, S. 2016, MNRAS, 463, 529
- Haehnelt (1994) Haehnelt, M. G. 1994, MNRAS, 269, 199
- Haiman et al. (2009) Haiman, Z., Kocsis, B., & Menou, K. 2009, ApJ, 700, 1952
- Hayasaki et al. (2007) Hayasaki, K., Mineshige, S., & Sudou, H. 2007, PASJ, 59, 427
- Hoffman & Loeb (2007) Hoffman, L., & Loeb, A. 2007, MNRAS, 377, 957
- Katz et al. (2020) Katz, M. L., Kelley, L. Z., Dosopoulou, F., et al. 2020, MNRAS, 491, 2301
- Kelley et al. (2017) Kelley, L. Z., Blecha, L., & Hernquist, L. 2017, MNRAS, 464, 3131
- Khan et al. (2011) Khan, F. M., Just, A., & Merritt, D. 2011, ApJ, 732, 89
- Kim & Kim (2007) Kim, H., & Kim, W.-T. 2007, ApJ, 665, 432
- Klein et al. (2016) Klein, A., Barausse, E., Sesana, A., et al. 2016, Phys. Rev. D, 93, 024003
- Kormendy & Richstone (1995) Kormendy, J., & Richstone, D. 1995, ARA&A, 33, 581
- Kozai (1962) Kozai, Y. 1962, AJ, 67, 591
- Kulkarni & Loeb (2012) Kulkarni, G., & Loeb, A. 2012, MNRAS, 422, 1306
- Latif et al. (2013) Latif, M. A., Schleicher, D. R. G., Schmidt, W., & Niemeyer, J. C. 2013, MNRAS, 436, 2989
- Li et al. (2021) Li, K., Ballantyne, D. R., & Bogdanović, T. 2021, ApJ, 916, 110
- Li et al. (2020a) Li, K., Bogdanović, T., & Ballantyne, D. R. 2020a, ApJ, 896, 113 (LBB20)
- Li et al. (2020b) —. 2020b, ApJ, 905, 123
- Lindberg et al. (2014) Lindberg, J. E., Jørgensen, J. K., Brinch, C., et al. 2014, A&A, 566, A74
- Loeb & Rasio (1994) Loeb, A., & Rasio, F. A. 1994, ApJ, 432, 52
- Magorrian et al. (1998) Magorrian, J., Tremaine, S., Richstone, D., et al. 1998, AJ, 115, 2285
- Marinacci et al. (2018) Marinacci, F., Vogelsberger, M., Pakmor, R., et al. 2018, MNRAS, 480, 5113
- Merloni et al. (2012) Merloni, A., Predehl, P., Becker, W., et al. 2012, eROSITA Science Book: Mapping the Structure of the Energetic Universe, , , arXiv:1209.3114
- Milosavljević & Phinney (2005) Milosavljević, M., & Phinney, E. S. 2005, ApJ, 622, L93
- Miranda et al. (2016) Miranda, R., Muñoz, D. J., & Lai, D. 2016, Monthly Notices of the Royal Astronomical Society, 466, 1170. https://doi.org/10.1093/mnras/stw3189
- Moody et al. (2019) Moody, M. S. L., Shi, J.-M., & Stone, J. M. 2019, ApJ, 875, 66
- Muñoz et al. (2019) Muñoz, D. J., Miranda, R., & Lai, D. 2019, ApJ, 871, 84
- Naiman et al. (2018) Naiman, J. P., Pillepich, A., Springel, V., et al. 2018, MNRAS, 477, 1206
- Nandra et al. (2013) Nandra, K., Barret, D., Barcons, X., et al. 2013, The Hot and Energetic Universe: A White Paper presenting the science theme motivating the Athena+ mission, , , arXiv:1306.2307
- Nelson et al. (2018) Nelson, D., Pillepich, A., Springel, V., et al. 2018, MNRAS, 475, 624
- Nelson et al. (2019a) Nelson, D., Springel, V., Pillepich, A., et al. 2019a, Computational Astrophysics and Cosmology, 6, 2
- Nelson et al. (2019b) Nelson, D., Pillepich, A., Springel, V., et al. 2019b, MNRAS, 490, 3234
- Nixon et al. (2011) Nixon, C. J., Cossins, P. J., King, A. R., & Pringle, J. E. 2011, MNRAS, 412, 1591
- Ostriker (1999) Ostriker, E. C. 1999, ApJ, 513, 252
- Park & Bogdanović (2017a) Park, K., & Bogdanović, T. 2017a, ApJ, 838, 103
- Park & Bogdanović (2017b) —. 2017b, ApJ, 838, 103
- Peters (1964) Peters, P. C. 1964, Phys. Rev., 136, B1224. https://link.aps.org/doi/10.1103/PhysRev.136.B1224
- Pillepich et al. (2018) Pillepich, A., Nelson, D., Hernquist, L., et al. 2018, MNRAS, 475, 648
- Pillepich et al. (2019) Pillepich, A., Nelson, D., Springel, V., et al. 2019, MNRAS, 490, 3196
- Prandoni & Seymour (2014) Prandoni, I., & Seymour, N. 2014, Revealing the Physics and Evolution of Galaxies and Galaxy Clusters with SKA Continuum Surveys, , , arXiv:1412.6512
- Quinlan (1996) Quinlan, G. D. 1996, New A, 1, 35
- Quinlan & Hernquist (1997) Quinlan, G. D., & Hernquist, L. 1997, New A, 2, 533
- Robson et al. (2019) Robson, T., Cornish, N. J., & Liu, C. 2019, Classical and Quantum Gravity, 36, 105011
- Roedig et al. (2011) Roedig, C., Dotti, M., Sesana, A., Cuadra, J., & Colpi, M. 2011, MNRAS, 415, 3033
- Roedig & Sesana (2014) Roedig, C., & Sesana, A. 2014, MNRAS, 439, 3476
- Rogstad & Shostak (1972) Rogstad, D. H., & Shostak, G. S. 1972, ApJ, 176, 315
- Ryu et al. (2018) Ryu, T., Perna, R., Haiman, Z., Ostriker, J. P., & Stone, N. C. 2018, MNRAS, 473, 3410
- Salcido et al. (2016) Salcido, J., Bower, R. G., Theuns, T., et al. 2016, MNRAS, 463, 870
- Sesana et al. (2014) Sesana, A., Barausse, E., Dotti, M., & Rossi, E. M. 2014, ApJ, 794, 104
- Sesana et al. (2006) Sesana, A., Haardt, F., & Madau, P. 2006, ApJ, 651, 392
- Shakura & Sunyaev (1973) Shakura, N. I., & Sunyaev, R. A. 1973, A&A, 500, 33
- Sijacki et al. (2011) Sijacki, D., Springel, V., & Haehnelt, M. G. 2011, MNRAS, 414, 3656
- Siwek et al. (2020) Siwek, M. S., Kelley, L. Z., & Hernquist, L. 2020, MNRAS, 498, 537
- Soltan (1982) Soltan, A. 1982, MNRAS, 200, 115
- Souza Lima et al. (2017) Souza Lima, R., Mayer, L., Capelo, P. R., & Bellovary, J. M. 2017, ApJ, 838, 13
- Springel et al. (2018) Springel, V., Pakmor, R., Pillepich, A., et al. 2018, MNRAS, 475, 676
- Tang et al. (2017) Tang, Y., MacFadyen, A., & Haiman, Z. 2017, MNRAS, 469, 4258
- Thorne & Braginskii (1976) Thorne, K. S., & Braginskii, V. B. 1976, ApJ, 204, L1
- Tiede et al. (2020) Tiede, C., Zrake, J., MacFadyen, A., & Haiman, Z. 2020, ApJ, 900, 43
- Toomre (1964) Toomre, A. 1964, ApJ, 139, 1217
- Toyouchi et al. (2020) Toyouchi, D., Hosokawa, T., Sugimura, K., & Kuiper, R. 2020, MNRAS, arXiv:2002.08017
- Turner (1977) Turner, M. 1977, ApJ, 216, 610
- Übler et al. (2021) Übler, H., Genel, S., Sternberg, A., et al. 2021, MNRAS, 500, 4597
- Vasiliev (2014) Vasiliev, E. 2014, Classical and Quantum Gravity, 31, 244002
- Volonteri et al. (2020) Volonteri, M., Pfister, H., Beckmann, R. S., et al. 2020, MNRAS, 498, 2219
- White & Frenk (1991) White, S. D. M., & Frenk, C. S. 1991, ApJ, 379, 52
- White & Rees (1978) White, S. D. M., & Rees, M. J. 1978, MNRAS, 183, 341
- Yu (2002) Yu, Q. 2002, MNRAS, 331, 935
- Zrake et al. (2021) Zrake, J., Tiede, C., MacFadyen, A., & Haiman, Z. 2021, ApJ, 909, L13
Appendix A Gravitational Wave Emission and Detection
A.1 LISA Sensitivity Curve
We use the sky-averaged LISA sensitivity curve presented in the “LISA Strain Curves” document (LISA-LCST-SGS-TN-001),
where the LISA arm-length is m, and mHz, with single-link optical metrology noise
| (A1) |
and single test mass acceleration noise
| (A2) |
Furthermore, we account for the average confusion noise from galactic compact binaries, (Robson et al., 2019),
| (A3) |
where , , , , , and Hz in a four year mission time.
A.2 Calculation of SNR
We calculate the SNR accumulated during the inspiral stage of MBHBs following Barack & Cutler (2004)
| (A4) |
where is the frequency of the -th harmonic in the GW spectrum, and is the power spectral density of LISA averaged over sky-inclination-polarization. The characteristic strain of the -th harmonic
| (A5) |
where is the luminosity distance to the GW source, and is the amount of power in the -th harmonic given by Turner (1977)
| (A6) |
and
| (A7) |
Here is the -th order Bessel function of the first kind.