A Comparative User Study of Human Predictions in Algorithm-Supported Recidivism Risk Assessment
Abstract.
In this paper, we study the effects of using an algorithm-based risk assessment instrument to support the prediction of risk of criminal recidivism. The instrument we use in our experiments is a machine learning version of RiskEval (name changed for double-blind review), which is the main risk assessment instrument used by the Justice Department of Country (omitted for double-blind review). The task is to predict whether a person who has been released from prison will commit a new crime, leading to re-incarceration, within the next two years. We measure, among other variables, the accuracy of human predictions with and without algorithmic support. This user study is done with (1) general participants from diverse backgrounds recruited through a crowdsourcing platform, (2) targeted participants who are students and practitioners of data science, criminology, or social work and professionals who work with RiskEval. Among other findings, we observe that algorithmic support systematically leads to more accurate predictions from all participants, but that statistically significant gains are only seen in the performance of targeted participants with respect to that of crowdsourced participants. We also run focus groups with participants of the targeted study to interpret the quantitative results, including people who use RiskEval in a professional capacity. Among other comments, professional participants indicate that they would not foresee using a fully-automated system in criminal risk assessment, but do consider it valuable for training, standardization, and to fine-tune or double-check their predictions on particularly difficult cases.
1. Introduction
Since the 1970s the use of Risk Assessment Instruments (RAI) in high stakes contexts such as medicine or criminal justice, together with their risks and benefits, have been a subject of debate across various disciplines. RAIs may increase the accuracy, robustness, and efficiency in decision making (Kleinberg et al., 2018); however, they can also lead to biased decisions and, consequently, to discriminatory outcomes (Angwin et al., 2016; Skeem et al., 2016).
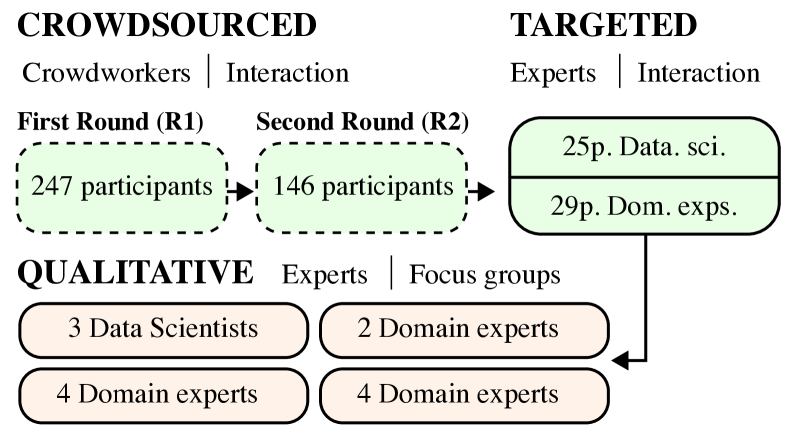
The figure shows the three experimental studies (one targeted and two crowdsourced) and the different focus groups made during our study.
| Crowd. (R1) | Crowd. (R2) | Dom.Exp | Data.Sci | ||
| N=247 | N=146 | N=29 | N=25 | ||
| Gender | Male | 61.0% | 54.3% | 20.7% | 40.0% |
| Female | 48.4% | 45.7% | 79.3% | 56.0% | |
| Other | 0.6% | 0.0% | 0.0% | 4.0% | |
| Education | Secondary | 19.3% | 15.5% | 3.5% | 20.0% |
| Undergraduate | 57.5% | 68.2% | 48.2% | 56.0% | |
| Postgraduate | 22.3% | 15.5% | 48.3% | 24.0% | |
| Age | 18-25 | 44.3% | 53.5% | 55.2% | 76.0% |
| 26-33 | 25.2% | 24.8% | 10.3% | 20.0% | |
| 34-45 | 19.6% | 12.4% | 13.8% | 4.0% | |
| 45-75 | 10.9% | 9.2% | 20.7% | 0.0% | |
| Numeracy | 0 (lowest) | 11.2% | 18.5% | 17.2% | 4.0% |
| 1 | 15.0% | 20.5% | 24.1% | 0.0% | |
| 2 | 24.0% | 22.0% | 6.9% | 28.0% | |
| 3 (highest) | 49.8% | 39.0% | 51.7% | 68.0% |
Understanding the performance of a RAI requires looking beyond the statistical properties of a predictive algorithm, and considering the quality and reliability of the decisions made by humans using the RAI (Green, 2021). This is because high-stakes decisions are rarely made by algorithms alone, and humans are almost invariably “in-the-loop,” i.e., involved to some extent in the decision making process (Binns and Veale, 2021). Indeed, the General Data Protection Regulation (GDPR)111Available online: https://eur-lex.europa.eu/legal-content/EN/TXT/?uri=CELEX%3A32016R0679. Accessed Jan 2022. in Europe gives data subjects the right “not to be subject to a decision based solely on automated processing” (Article 22), and the proposed Artificial Intelligence Act222Available online: https://eur-lex.europa.eu/legal-content/EN/TXT/?uri=CELEX:52021PC0206. Accessed Jan 2022. published in April 2021, considers criminal risk assessment a “high-risk” application subject to stringent human oversight.
Our work involves a sequence of studies outlined in Figure 1 and described in the next sections. We develop and test different user interfaces of a machine learning version of RiskEval, the main RAI used by Country’s criminal justice system.333Name of instrument changed and name of country omitted for double-blind review. We ask participants to predict the re-incarceration risk based on the same factors used by RiskEval, such as criminal history, which empirically affect the recidivism risk of individuals. Some participants are additionally shown the risk that the RAI predicts using the same factors. Our primary goal is to assess how the interaction with the studied RAI affects human predictions, their accuracy, and their willingness to rely on a RAI for this task.
As most previous studies on this topic, we partially rely on crowdsourcing (Dressel and Farid, 2018; Grgic-Hlaca et al., 2019; Green and Chen, 2020; Fogliato et al., 2021a). Controlled in-lab/survey experiments and crowdsourced experiments have the limitation that participants do not face the real world consequences that professional decisions have on the lives of inmates. In addition, untrained crowdworkers may exhibit different decision making behaviour than trained professionals. The former limitation can only be addressed through studies that analyze the real-world adoption of a RAI through observational methods (Berk, 2017; Stevenson, 2018; Stevenson and Doleac, 2021). However, these studies usually face the difficulty of isolating the effect of RAI adoption from other changes that co-occur in the study period. The latter can be addressed in an experimental setting by recruiting professional participants, as we do in this paper. To the best of our knowledge, most studies focus on crowdsourced participants. This might be the first study that, in addition to a crowdsourced study, runs a targeted study. We recruited students and professionals of data science as well as domain experts (with a background in criminology and social work), including people who work within Country’s criminal justice system and use RiskEval in a professional capacity. Finally, we conducted a qualitative study with small sub-groups of the targeted user study, particularly professionals within the Justice Department of Country, as well as data scientists. Our main contributions are:
-
•
We confirm previous results that show how accuracy in decision making slightly improves with algorithmic support, how participants adjust their own predictions in the direction of the algorithmic predictions, and how different scales in risk communication yield different levels of accuracy.
-
•
We describe differences between targeted participants and crowdsourced workers. Despite identical experimental conditions and tasks, we find that the predictions differ between these groups and targeted participants outperform crowdsourced participants in terms of accuracy.
-
•
We provide insights into how professionals use RAIs in real-world applications from our focus groups. Our interviewees would not foresee using a fully automated system in criminal risk-assessment, but they see benefits in using algorithmic support for training and standardization, and for fine-tuning and double-checking particularly difficult cases.
The remainder of this paper is structured as follows. First, we give an overview of related work (§2). Next, we describe our approach, including the variables of our study (§3), as well as the materials and procedures we employ (§4). We present the experiment setup for crowdsourced and targeted participants (§5), and the obtained results from both groups (§6). Then we present the results from the focus groups (§7). Finally, we discuss our findings (§8), as well as the limitations of this study and possible directions for future work (§9).
2. Related work
2.1. Risk Assessment Instruments (RAI) for Criminal Recidivism
Law enforcement systems increasingly use statistical algorithms, e.g., methods that predict the risk of arrestees to re-offend, to support their decision making (Goel et al., 2019; Chiusi et al., 2020). RAIs for criminal recidivism risk are in use in various countries including Austria (Rettenberger et al., 2010), Canada (Kröner et al., 2007), Germany (Dahle et al., 2014), Spain (Andrés-Pueyo et al., 2018), the U.K. (Howard and Dixon, 2012), and the U.S. (Desmarais and Singh, 2013). There are ethical and legal aspects to consider, as algorithms may exhibit biases, which are sometimes inherited from the data on which they are trained (Barocas and Selbst, 2016). However, some argue that RAIs bear the potential for considerable welfare gains (Kleinberg et al., 2018). The literature shows that decisions based on RAIs’ scores are never made by an algorithm alone. Decisions in criminal justice are made by professionals (e.g., judges or case workers) (Bao et al., 2021), sometimes using RAIs (Stevenson and Doleac, 2021). Consequently, algorithms aimed at supporting decision processes, especially in high-risk contexts such as criminal justice, cannot be developed without taking into account the influences that institutional, behavioural, and social aspects have on the decisions (Selbst et al., 2019). Furthermore, human factors such as biases, preferences and deviating objectives can also influence the effectiveness of algorithm-supported decision making (Jahanbakhsh et al., 2020; Mallari et al., 2020).
Experienced decision makers may be more inclined to deviate from an algorithmic recommendation, relying more on their own cognitive processes (Green and Chen, 2020). Moreover, trained professionals, such as probation officers, may prefer to rely on their own decision and not just on a single numerical RAI prediction. Any additional information that they consider may be used as a reason to deviate from what a RAI might recommend for a case (McCallum et al., 2017). There are other reasons why humans disagree with an algorithmic recommendation. For instance, the human’s objectives might be misaligned with the objective for which the algorithm is optimized (Green, 2020), or the context may create incentives for the human decision maker not to follow the algorithm’s recommendation (Stevenson and Doleac, 2021). Sometimes humans are unable to evaluate the performance of themselves or the risk assessment, and engage in ”disparate interactions” reproducing biased predictions by the algorithm (Green and Chen, 2019a). Another reason could be algorithm aversion, e.g., human decision makers may discontinue the use of an algorithm after observing a mistake, even if the algorithm is on average more accurate than them (Dietvorst et al., 2015; Burton et al., 2020). In contrast, controlled user studies in criminal risk assessment indicate that crowdsourced participants tend to exhibit automation bias, i.e., a tendency to over-rely on the algorithm’s prediction (Dressel and Farid, 2018; Bansak, 2019).
Effective human-algorithm interaction depends on users’ training with the tool, on the experience of the human decision maker with the algorithm, and on the specific professional domain in which the decision is made. Therefore, some researchers have studied the impact of the adoption of RAIs in criminal justice decision-making in real-world applications (Berk, 2017; Stevenson, 2018; Stevenson and Doleac, 2021). These observational studies yield valuable insights, but the conditions of adoption as well as the design of the RAI cannot be controlled, making it difficult to isolate the effect of the RAI on the studied outcome.
2.2. Controlled User Studies and Interaction Design of RAIs
Algorithm-supported human decision making has also been studied in controlled experiments (Dressel and Farid, 2018; Green and Chen, 2019b, a; Grgić-Hlača et al., 2019; Lin et al., 2020; Fogliato et al., 2021a). Among these, an influential study by Dressel and Farid in 2018 (Dressel and Farid, 2018), showed how crowdsourced users recruited from Amazon Mechanical Turk (AMT) were able to outperform the predictions of COMPAS, a RAI that has been subject to significant scrutiny since the seminal work of Angwin et al. (Angwin et al., 2016). Follow-up studies criticized Dressel and Farid’s study, noting that participants were shown the ground truth of each case (i.e., whether or not the person actually recidivated) immediately after every prediction they make, which does not correspond to how these instruments are used in practice. Without this feedback, human predictions that were not supported by algorithms performed worse than the algorithm under analysis (Lin et al., 2020).
The way risk assessments are communicated and integrated in the decision process plays a crucial role in the quality of the predictions. For instance, criminal forensics clinicians have a preference for (non-numerical) categorical statements (such as “low risk” and “high risk”) over numerical risk levels. However, an experimental survey showed that a RAI providing numerical information elicits better predictive accuracy than if categorical risk levels are used (Zoe Hilton et al., 2008). One issue with categorical expressions is that professionals tend to disagree about the limits of the categories and how these categories represent different numerical risk estimations (Hilton et al., 2015). However, numerical expressions introduce other challenges. For instance, participants in a study perceived violence risk as higher when the risk was presented in a frequency format instead of a percentage format (Hilton et al., 2015). Another question is whether numerical risks should be presented on an absolute or a relative scale. A study with clinicians showed that participants hardly distinguish between absolute probability of violence and comparative risk (Zoe Hilton et al., 2008). Furthermore, besides showing only risk levels, risk assessments could include additional information about the nature of the crime, the factors of the RAI and other factors that may have preventive effects on future re-offense (Heilbrun et al., 1999). Complementary and graphical information can improve the understanding of risk evaluations (Hilton et al., 2017). However, it can also increase the overestimation of risk factors while ignoring other contextual information (Batastini et al., 2019). Nevertheless, the use of different visualization methods is mainly unexplored.
Given the experience from previous work, we build our user interface to test and measure the performance of participants using different categorical risk levels and numerical expressions for risk, specifically absolute and relative risk scales. We conduct a recidivism prediction experiment with crowdsourced participants, but also complement it with targeted participants. One of the main novelties of our study resides in assessing how targeted participants, including domain experts and data scientists, perform differently than crowdsourced participants. Additionally, focus groups and interviews with professionals provide valuable insights into how RAIs are perceived and used in practice.
3. Approach and research questions
This paper takes an experimental approach. Participants in our experiments are asked to determine the probability that an inmate will be re-arrested, based on a list of criminologically relevant characteristics of the case. We focus on three main outcome variables (§3.1): the accuracy of predictions, the changes that participants make to their predictions when given the chance to revise them after seeing the RAI’s recommendation, and their willingness to rely on similar RAIs. The main independent variables (§3.2) are the background of the participants, and the type of risk scale used. Our research questions (§3.3) are about the interaction of these variables.
3.1. Outcome variables
3.1.1. Predictive accuracy
The performance of predictive tools including RAIs is often evaluated in terms of the extent to which they lead to correct predictions. Due to the inherent class imbalance in this domain, as most people do not recidivate, most studies (e.g., experimental (Dressel and Farid, 2018; Harris et al., 2015; Green and Chen, 2019b)) do not use the metric accuracy, which is the probability of issuing a correct prediction. Instead, it is more common to measure the area under the receiver operating characteristic (AUC-ROC or simply AUC). The AUC can be interpreted as the probability that a randomly drawn recidivist obtains a higher score than a randomly drawn non-recidivist.
3.1.2. Prediction alignment with the RAI
In this work, we observe users’ reliance on the algorithmic support system indirectly by looking at changes in their predictions after observing an algorithmic prediction. We assume that if users change their initial predictions to align them with those of a RAI, they are implicitly signaling more reliance on that RAI than if they would have stuck to their initial prediction. In general, the extent to which people are willing to trust and rely on a computer system is related to people’s engagement and confidence in it (van Maanen et al., 2007; Chancey et al., 2017; Lee and See, 2004), and in the case of predictive algorithms, to their perceived and actual accuracy (Yin et al., 2019). Different types of information disclosure can elicit different levels of trust and reliance (Du et al., 2019). Performing joint decisions, i.e., being the human in the loop (De-Arteaga et al., 2020), can increase willingness to rely on a system (Zhang et al., 2020).
3.1.3. Preferred level of automation
The experience of interacting with an algorithm-based RAI may also affect the acceptability of similar algorithms in the future. Algorithm-based RAIs may operate in ways that differ by their level of automation (Cummings, 2004). At the lowest level of automation, the human makes all decisions completely disregarding the RAI; at the highest level of automation, the RAI makes all decisions without human intervention; intermediate levels represent various types of automated interventions. In general, the level of automation chosen by a user should be proportionate to the performance of the automated system. Both algorithm aversion (Burton et al., 2020) or under-reliance, as well as automation bias (Mosier et al., 1998) or over-reliance, negatively affect the predictive accuracy of users.
3.2. Participant groups and conditions
In this section we describe the main independent variables that we tested in the experiments.
3.2.1. Participant’s educational and professional background
Most user studies on recidivism risk prediction rely on crowdsourced participants from online platforms. The background of participants may change the way they interact with a RAI. Data scientists and statisticians have training on statistics, probability, and predictive instruments. Domain experts with a background in psychology, criminology, or who work within the prison system, have a deeper knowledge of factors driving criminal recidivism. Additionally, domain experts who use RAIs receive training on their usage, and they often have a fair amount of training in applied statistics.
Naturally, in real-world applications case worker decisions are far more consequential than the consequences faced by crowdworkers in their lab-like decision scenarios. Similar to previous work (Green and Chen, 2019a; Cheng et al., 2019; Yu et al., 2020; Dressel and Farid, 2018), we add an incentive (in the form of a bonus payment) for correct predictions in the crowdsourced studies. However, this is to encourage appropriate effort, not to simulate a high-stakes scenario.
We consider three participant groups: (1) crowdsourced workers from unspecified backgrounds, (2) students and practitioners of data science, and (3) students of criminology and people with expertise in the prison system. Recruitment procedures are described in §4.3.
3.2.2. Risk scales
The literature on risk communication suggests that both numerical and categorical information are useful for different purposes (Zoe Hilton et al., 2008; Jung et al., 2013; McCallum et al., 2017; Storey et al., 2015). Categories alone can be misleading when similar cases are assigned to different categories despite only small differences in their risk (Jung et al., 2013). In our research, we initially used only a categorical scale,444We group probabilities using a five-level, empirically-grounded recommendation developed by the US Department of Justice and the US National Reentry Resource Center (Hanson et al., 2017). but then switched to scales that combine both categorical and numerical values; further, we test two different types of numerical scales. The first scale is based on the probability of recidivism, which we denote “absolute scale” as it expresses a probability in absolute terms. The second scale we use is based on quantiles of the risk distribution in the data, and we call it the “relative scale” since it is relative to the risk levels of other cases in the data. We also use five categories, for easier comparison with the absolute scale.
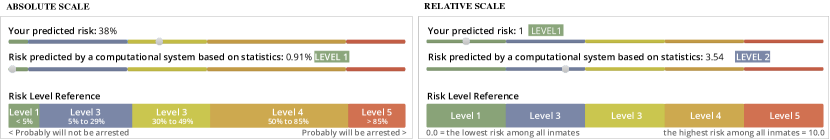
Shows two different images with the interface where participants can set their prediction. Each image corresponds to different treatment group.
Both scales are depicted in Figure 2. Other elements in that figure are discussed in the following sections.
3.2.3. Additional variables
Many additional variables could have been included but we were mindful of survey length and wanted to minimize survey drop-out. We included three additional variables: numeracy, decision-making style, and current emotional state. Numeracy is the ability to understand and manage numerical expressions. The decision confidence and the type of information that professionals rely on when using RAIs depends on their numerical proficiency (Scurich, 2015). Ideally, professionals working with RAIs should have a fairly high level of numerical literacy, as interpreting RAIs requires the understanding of probabilities, which is not common knowledge. Other factors that have been shown to affect people’s decision making behaviour are their decision-making style and current emotional state (Beale and Peter, 2008; Lee and Selart, 2012).
3.3. Research questions
Based on the variables we have presented, we pose the following research questions:
-
RQ1
Under which conditions do participants using a RAI to predict recidivism achieve the highest predictive accuracy?
-
RQ2
To what extent do participants rely on the RAI to predict recidivism?
4. Materials and methods
In this section, we describe the materials (§4.1) for our user study which consist of a risk prediction instrument based on RiskEval (4.1.1) and a selection of cases used for assessment (4.1.2). Next, we present a description of the procedure followed by participants (4.2), and the way in which they were recruited (4.3).
4.1. Materials
4.1.1. RiskEval
This is one of several risk assessment tools used by the Justice Department of Country since 2010 [reference omitted for double-blind review]. This tool is applied multiple times during an inmate’s time in prison; in most cases, once every six months.
RiskEval consists of 43 items that are completed by professionals based on an inmate’s record and suitable interviews. Then, a team of professionals (with some overlaps with the various interviewers) makes a decision based on the values of the items and the output of RiskEval’s algorithm. RiskEval’s algorithm predicts the risks of four different outcomes: committing further violent offenses (violent recidivism), violence in the prison facilities to other inmates or prison staff, self-injury, and breaking of prison permits. We focus on violent recidivism, which is computed based on 23 of the 43 risk factors, including criminal/penitentiary record, biographical factors, family/social factors, clinical factors, and attitude/personality factors.
The original RiskEval uses integer coefficients determined by a group of experts; instead, we use a predictor of violent recidivism created using logistic regression that has a better AUC (0.76) than the original RiskEval (0.72) and is more accurate than models created using other ML methods such as random forests or neural networks [reference omitted for double-blind review]. This is done to reduce any effects of potential shortcomings of RiskEval originating from using hand-picked integer coefficients, instead using a state-of-the-art predictor based on the same items.
4.1.2. Cases
In this study, we use a dataset of cases used in previous work [reference omitted for double-blind review]. It consists of the RiskEval protocol items for the inmates released between 2010 and 2013, and for which recidivism was evaluated by the Department of Justice of Country. Upon recommendation of our Ethics Review Board, we do not show participants the data of any individual inmate, but instead created semi-synthetic cases using a cross-over of cases having similar features and similar risk levels (for details, see Supplementary Material A.3).
We selected 14 cases which contain a mixture of recidivists and non-recidivists, combining cases in which the majority of humans make correct predictions and cases in which they tend to err, and cases in which the algorithm makes a correct prediction and cases in which it errs. In our first crowdsourcing experiment (referred to as R1 in the following) we observed that these cases were not representative of the performance of the algorithm on the overall dataset. Hence, for the second crowdsourcing experiment (R2 in the following) we exchanged 2 cases to bring the AUC from 0.61 to 0.75 which is closer to the AUC of the algorithm on the original data (0.76). Out of the 14 cases, 3 were used as examples during the “training” phase of the experiments, while participants were asked to predict recidivism for the remaining 11 cases. All participants evaluate the same 11 cases, but in randomized order.
4.2. Procedure
The study obtained the approval of our university’s Ethics Review Board in December, 2020. All user studies were conducted between December, 2020 and July, 2021, and done remotely due to the pandemic caused by the SARS-COVID-19 virus. The survey is designed to be completed in less than 30 minutes and used an interface hosted in our university’s server created using standard web technologies (Python and Flask). The survey is structured as follows:
4.2.1. Landing page and consent form
The recruitment (§4.3) leads potential participants from different groups to different landing pages, which record which group the participant belongs to. There, participants learn about the research and we ask for their explicit consent for participating.
4.2.2. Demographics and additional variables
Consenting participants are asked three optional demographic questions: age (range), gender, and educational level. Then, three sets of questions are asked to capture the following additional variables (described in §3.2.3):
- Numeracy: We use a test by Lipkus (Lipkus et al., 2001), which has been used in previous work (Hilton et al., 2017). It consists of three questions about probabilities, proportions, and percentages, such as “If a fair dice is rolled 1,000 times, how many times it will come even (2, 4, or 6)?” (Answer: 500). We measure “numeracy” as the number of correct answers (0 to 3).
- Decision making style: The General Decision Making Style (GDMS) (Scott and Bruce, 1995) is a well known survey that identifies five types of individual decision making style: rational, intuitive, dependent, avoidant, and spontaneous.
- Current emotional state: We used a Visual Analogue Scale (VAS) to account for 7 attitudes (happiness, sadness, anger, surprise, anxiety, tranquility, and vigor). This survey has been used in previous work (Portela and Granell-canut, 2017).
4.2.3. Past experience and attitudes towards RAIs
Participants are asked about their knowledge about and experience with RAIs, as well as what they consider as the three most determining features to predict recidivism, out of the ones used by RiskEval. The final question of this part is about the level of automation they would prefer for determining the risk of recidivism (see Supplementary Material B.1).
4.2.4. Training
The training part consists of the risk assessment of three cases (two non-recidivists and one recidivist). The purpose of this part is to prepare participants for the actual evaluations and to calibrate their assessment to a ground truth reference. Therefore, unlike the actual risk assessments of the evaluation tasks, participants are shown the ground truth (recidivism or no-recidivism) after each one.
4.2.5. Evaluation tasks
The evaluation tasks are the core part of the study and ask participants to predict the probability of violent recidivism for eleven cases. Participants see a list of 23 items that are used by RiskEval to predict violent recidivism (see Supplementary Material B.3 for an illustrated reference), and they are asked to select a number, which can be a recidivism probability or a risk level, depending on the condition (see Figure 2). Additionally, they are asked to select from the list of items the three items that they considered most important in their evaluation, and to indicate their confidence with their prediction on a 5-points scale.
Participants in the control group are shown just one screen per case to enter their prediction, while participants in a treatment group are shown a second screen for each case, displaying the algorithm’s prediction. This second screen also shows participants their initial prediction for comparison, and allows them to optionally change it. In both screens, participants indicate the confidence in their prediction before continuing.
4.2.6. Closing survey
The experiment ends with a final questionnaire and an evaluation of the entire process. This questionnaire repeats some of the questions made in the beginning, such as the preferred level of automation, the emotional state, and the three features they consider most important in predicting recidivism. Additionally, participants can leave a comment or feedback about the study.
4.3. Participant recruitment
A summary of the participants’ demographics is shown in Table 1. The crowdsourced study consisted of two rounds (R1 and R2) for which we recruited participants via Prolific.555Prolific is a crowdsourcing platform specialized in supporting scientific research. It is available at: https://www.prolific.co/ We selected residents of Country, between 18 to 75 years old, and with more than 75% of successful completion of other studies in the platform. Participants were payed a platform-standard rate of 7.5 GBP666Prolific is a UK-based company that uses British pounds as main currency. We follow their advice for average payment per hour. per hour for participating in the survey. They took an average of 2025 minutes to complete the survey. Additionally, we offered a bonus payment of 1 GBP to those who achieved an AUC greater than 0.7. This is common practice and incentivizes conscientious completion of the survey (see, e.g., (Green and Chen, 2019a; Cheng et al., 2019; Yu et al., 2020; Dressel and Farid, 2018)).
For the targeted studies, participants were recruited through students’ mailing lists from two universities in Country, as well as social media groups of professionals of data science in countries having the same official language as Country. Additionally, we invited professionals from the Justice Department of Country to participate; the invitation to participate was done by their Department of Research and Training. The number of participants in previous crowdsourced user studies is usually a few hundred: 103 in (Grgic-Hlaca et al., 2019), 202 in (Cheng et al., 2019), 400 in (Lin et al., 2020), 462 in (Dressel and Farid, 2018) and 600 in (Green and Chen, 2019a). In line with the previous studies, we had 449 participants in total (393 crowdsouced and 54 targeted).
5. Participants and experimental setup
5.1. Crowdsourced: First Round (R1)
In the first round (R1) we compared two experimental groups. The treatment group was shown the machine prediction and the control group was not. In treatment group G1 machine predictions are shown only as categorical information, while in G2 machine predictions are shown as categorical and numerical information. In this round, 247 participants completed the evaluation: 48 in the control group, 100 in treatment group G1, and 99 in treatment group G2. Additionally, 74 participants were excluded, either because they did not complete the survey or did not evaluate all of the eleven cases, or finished the experiment either too fast (less than five minutes) or too slowly (more than one hour).
As described in §4.1.2, we used in R1 a set of cases for which the AUC of the machine predictions was 0.61. To bring this more in line with the observed AUC in the entire dataset (0.76), we exchanged two cases for the second round (R2), and the AUC measured on the new set of cases became 0.75.
5.2. Crowdsourced: Second Round (R2)
In the second round (R2) we compared two experimental groups, where the treatment group was shown the machine prediction and the control group was not. In treatment group G1 machine predictions are shown on an absolute scale as categorical and numerical information, while in G2 machine predictions are shown on a relative scale as categorical and numerical information.
In this round, 146 participants completed the evaluation: 17 in the control group, 66 in treatment group G1, and 63 in treatment group G2. Additionally, 137 participants were excluded for the same reasons as in R1.
5.3. Targeted Study
The targeted study seeks to establish the effect (if any) of the participant’s background when interacting with the RAI. We used the same experimental setup and treatment groups from crowdsourcing (R2). Due to the limited number of participants, we considered as a baseline the control group of R2.
We considered both students and professionals with a background either in data science, or in a field relevant to the prison system and the application of RiskEval, such as psychology, criminology, or social work. For data science, we recruited 14 students at the undergraduate and graduate level, and 11 professionals. For a domain-specific background, we recruited 4 students at the graduate level (Master in Criminology students), and 25 professionals. A summary of all experimental groups is shown in Table 2.
6. Results
6.1. Outcome variables
6.1.1. Predictive accuracy
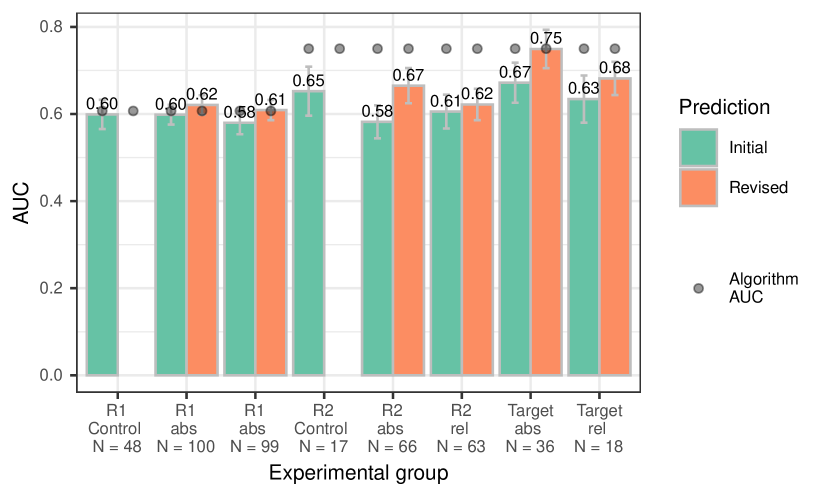
Shows a bar plot comparing each of the experimental groups, comparing their AUC-ROC before presenting the algorithm prediction and after.
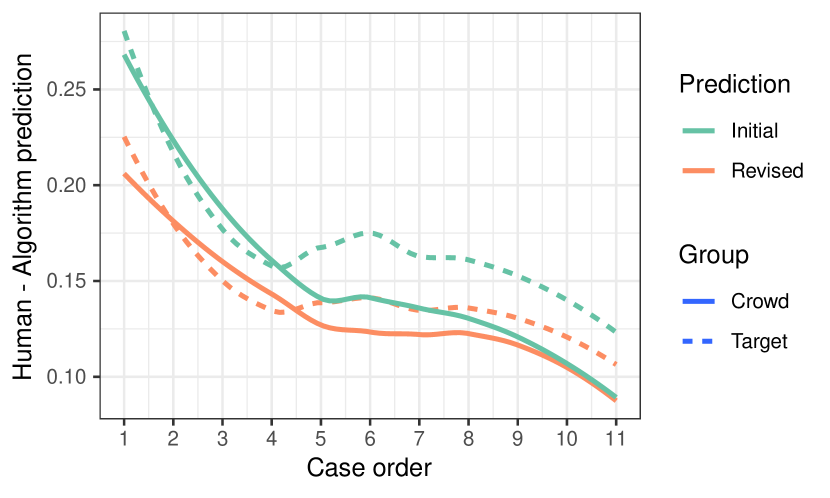
Shows a line graph where the initial prediciton made by humans is compared with the afterwards, lines are also split between crowdsourced and targeted studies.
Figure 4 shows the average AUC and corresponding confidence intervals777Confidence intervals in Figure 4 are computed under normal assumption but we test statistical significance of the differences using a permutation t-test (see Table 4) for each experimental group. This data can also be found in Supplementary Material C.1. For R1 we observe no difference in the initial predictions across control and treatment groups, which have AUC between 0.58 and 0.61. However, for R2 we find a significant difference (p¡0.1) with a higher AUC for the control group (0.65) than for the initial prediction of treatment group G1 (0.58) with the absolute scale.
Despite the small number of participants in the targeted group, we observe important differences compared to the previous groups. The predictive accuracy of the initial prediction is higher (+0.02 to +0.09 AUC points) than any crowdsourced group. For the targeted group G1 (absolute scale) this difference is significant at against R2’s G2 and even at against the initial predictions of the other crowdsourced groups (see Supplementary Material C.1). Participants from a data science background and domain experts have similar initial AUCs.
6.1.2. Prediction changes due to the RAI
The observed probability of a participant changing a prediction after observing the machine prediction is 20% (19% in G1 and 21% in G2). Crowdsourced participants revised their prediction in about 26% of the cases they examined (27% in G1, 25% in G2). Domain experts revised their prediction in 37% of the cases, and data scientists in only 13% of the cases.
Figure 4 shows the average difference in risk predictions by human and algorithm for each case. Targeted participants started with predictions that were in general as high as those of the crowdsourced groups and equally far from those of the RAI. As they progress through the evaluation tasks, participants tend to align more and more their predictions with the machine predictions (even in their initial predictions) and the difference between initial and revised predictions diminishes. For the last three cases, the crowdsourced group’s predictions, which are already close to the machine predictions, do not change, while the targeted group maintains a larger difference between initial and revised predictions.
By comparing the average AUC in Figure 4 and Table 3, we can see that revised predictions from crowdsourced groups tend to be more accurate than their initial ones in terms of AUC. This difference is significant for R1’s G2 () and for R2’s G1 (), as shown in Table 4 (in Supplementary Material C.1). For the targeted groups, we see an improvement in the range from +0.01 to +0.09 AUC points on average. In almost all cases, revised predictions by the treatment groups are more accurate than those of the control groups. However, few of these differences are statistically significant.
In general, the average self-reported confidence is in the range 3.5-3.9 out of 5.0 (1.0=least confident, 5.0=most confident), and basically does not change from the initial to the final prediction. The self-reported confidence of crowdworkers is, by a small but statistically significant margin (), higher than the one of targeted participants (see Supplementary Material C.3).
6.1.3. Preferred level of automation
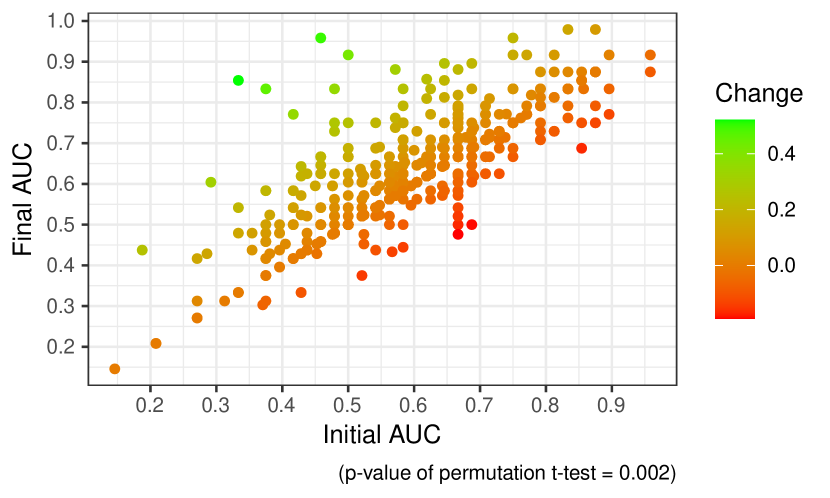
Shows a scatterplot with individual accuracy, both for initial and final prediction (after algorithm suggestion).
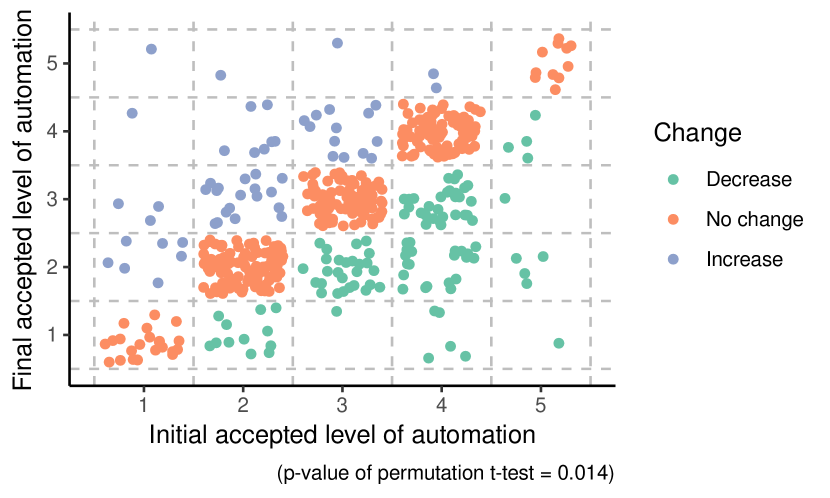
Shows a scatterplot divided in sections regarding their answer for the level of automation survey. In the plot, the initial values and the final values are compared.
As shown in Figure 6, most participants prefer an intermediate level of automation, between levels 2-4 on a scale of 5 levels. While data scientists had an initial level of acceptance with a broader range (levels 1-4), domain experts limited their answers to a more narrow set of choices in intermediate levels of acceptance (levels 2-3). The same figure also shows that most of the treated groups reduce their preferred level of automation after the experiment, meaning they prefer more expert involvement and less reliance on machine predictions.
On average, however, the desired level of acceptance for targeted groups concentrated in the middle-low part of the scale: 32% of the data scientists and 48% of the domain experts selected level 3 (“the computational system suggests one option, but the expert can provide an alternative option”). Level 2 (“the computational system suggests some options, but it is the expert who defines the risk level”), was the option selected by 36% of the surveyed data scientists and 38% of the domain experts. Details can be found in Supplementary Material C.2, and the description of the automation levels can be found in Supplementary Material B.1.
6.2. Independent variables
6.2.1. Self-reported importance of risk items
Having asked to select the top 3 items (risk factors) that participants considered in their risk prediction, we find that crowdsourced and targeted participants tend to select the same 10-11 (out of 23) items as more important than the rest. However, among these top 10 items we find that domain experts prefer dynamic factors (i.e., factors that can change), such as “limited response to psychological treatment”, while data scientists and crowdsourced participants refer more often than domain experts to static factors (i.e., factors that cannot change), such as “history of violence” (details are in Figure 11 and Table 9 in Supplementary Material C.5).
6.2.2. Numerical information (R1)
According to Figure 4, adding numerical values to the categorical scale does not change the AUC. In G1, where only categorical information is shown, the AUC of revised predictions is slightly higher than the revised predictions in G2, where categorical and numerical values are shown: 0.62 against 0.61 AUC.
6.2.3. Risk scales (R2 and Targeted)
The results of R2 show that for the initial prediction, the absolute scale (G1) leads to slightly lower AUC compared to the relative scale (G2) (0.58 against 0.61 AUC). However, with algorithmic support, the absolute scale leads to higher AUC than the relative scale (0.67 against 0.62 AUC). Neither of these differences is statistically significant. Additionally, the average AUC of the R2 control group (0.65) is fairly high, and the only higher AUC observation is in the revised predictions using the absolute scale (0.67). The revised and some initial predictions of the targeted participants using the absolute scale significantly outperform all the R1 groups, as well as the R2 groups (, see Table 4 in Supplementary Material C.1).
6.2.4. Additional variables
With respect to numeracy, over 60% of the crowdsourced participants answered correctly 2 or 3 out of the 3 test questions. The targeted group had more respondents answering all 3 numeracy questions correctly than crowdworkers, as shown in Table 1: 96% of data scientists obtained results in the highest scores (68% in the top score), while only 59% of domain experts obtained similar results (52% in the top score). We find no correlation between participants’ numeracy and their accuracy. The correlation between decision making style and emotional state with accuracy is not significant either (results are in Supplementary Material C.4).
7. Qualitative study
The last study is a qualitative study using focus groups, i.e., groups of participants having a focused discussion on a particular topic (Morgan et al., 1998). The focus groups help us interpret the quantitative results from the targeted study, by listening to and learning from participants’ experiences and opinions.
7.1. Participants and procedure
Participants (9 women, 4 men) were recruited from the targeted experiment, and due to their busy schedules, divided into four groups (FG1-FG4) as follows: FG1 (N=3) data scientists; FG2 (N=4) domain experts, students from criminology in undergraduate and master levels; FG3 (N=2) and FG4 (N=4) domain experts working with the Department of Justice, most of them psychologists.
While we did not want to give too much structure to the conversation, to try to uncover new perspectives that we had not thought about, we did prepare a series of questions to stimulate a discussion (available in Supplementary Material B.2). The questions address participants’ experience with algorithmic predictions and RAIs, their opinion about different scales and categorical/numerical presentation, their understanding of risk factors, and their desired level of automation. Each session lasted between 60 and 90 minutes and was held online. Following the protocol approved by our Ethics Review Board, participants were asked for their consent to participate and to have the meeting recorded and transcribed. The language of the focus group was the local language spoken in Country; the quotes we present in the next section were taken from our transcriptions and paraphrased in English.
7.2. Findings
We focus on our research questions, but note that there were many other insightful comments during the focus groups.
7.2.1. Professional background
All participants were aware that some demographics are over/under represented among prison populations, and thus expected that a RAI trained on such data may lead to discriminatory outcomes. However, the way in which data science participants approached risk prediction was to a large extent based on considering a set of “anchors” or prototypes (Scurich et al., 2012, p. 13): “I think about a maximum and a minimum risk. The minimum would be like a person who stole for the first time […] the maximum would be a killer” (FG1.1). In general, data scientists did not question the presented case characteristics, but domain experts did. Participants in FG3 and FG4 indicated that the risk items, which in RiskEval only have three levels (Yes/Maybe/No), do not accurately represent the reality of inmates and they were missing the ability to explore or negotiate the risk items during the case evaluations. Furthermore, they indicated that, during the assignment of levels to risk factors, they sometimes “compensate” higher values in one item with lower values in other items, such that the final risk score matches what they would consider appropriate for the evaluated person. One participant (FG4.1) said that personal biases may also affect the coding of items, as some professionals adopt a more punitive approach, while others take a more protective or rehabilitative approach. Other domain experts agreed with this perspective. Therefore, most professionals expressed the need for teams reviews and validation mechanisms for risk factor codings.
Among domain experts, the psychologists we interviewed were the most concerned about the evidence they collect and the representation of the actual risk. To them, RAIs are tools that add objectivity to their case reports, but their focus was on how to present evidence to judges, since these might discard professional reports in favor of the RAI’s outcome. Overall, for domain experts RAIs such as RiskEval should be used by a group of experienced evaluators checking one another, and not by one professional alone.
7.2.2. Interpreting numbers
All participants had some training in statistics, and stated that they understand numerical expressions well. Generally, participants preferred a relative scale (e.g., 3.7/10.0) over an absolute scale (e.g., 37%).
It is noteworthy how domain experts interpret probabilities. First, extremely low risks were considered unlikely in practice, since almost everyone can commit a crime at some point. Second, all interviewed domain experts stated that recidivism risk cannot be eliminated but it could be reduced to an acceptably low level (e.g., reducing the risk from 37% to 20%). This emphasis on risk reduction is in line with the “interventions over predictions” debate in the literature (Barabas et al., 2018). Third, domain experts consider a recidivism risk of above 30% as high, and a reason for concern. A risk above 50% was considered difficult -but not impossible- to reduce by treatment/interventions. Overall, domain experts thought of different ranges on the risk spectrum along which inmates are placed. Data scientists, too, considered different risk ranges, and for some of them even a 50% recidivism risk was not considered “high.”
7.2.3. Interaction with machine predictions and calibration
Many participants admitted that they went quickly, and without giving it much thought, through the first few evaluations. However, they also noticed that they slowed down to rethink when they felt contested by the algorithm, i.e., when their risk assessment was far from the algorithm’s prediction. Data scientists indicated that they reacted to such differences by simply adjusting the risk to half-way between their initial prediction and the one of the algorithm. Domain experts indicated to react similarly in some cases, but they also stressed that they kept their initial prediction when they felt confident about it.
Some of the domain experts believed that they were interacting with exactly the same RiskEval algorithm they use, despite a clear indication in the introduction of the study that this was another algorithm. We believe their experience with the real RiskEval affected their disposition to rely on the machine predictions we presented.
7.2.4. Preferred level of automation
Overall, domain experts and data scientists differed in the level of automation they would prefer, with data scientists being more open to automation. For instance, participant FG1.2 believed that an algorithm could improve enough to make almost-autonomous decisions “in the future.” This participant considered the errors that could be made by the algorithm were “acceptable.” In contrast, e.g., FG1.3 was sceptical about using an algorithm for automated decision-making because of the impossibility to solve all algorithm-specific errors.
All participants agreed that algorithmic support is useful in many instances, e.g., to contrast their own predictions, to give them a chance to rethink them, or to provide reassurance about them. Domain experts also considered them useful to train new case workers in writing evaluations. In that regard, participants from FG1 and FG2, expressed that the “objectivity” of the algorithm could help reduce the effect of the “emotional” response to the evidence by the professional who is evaluating.
Participants also acknowledged the risk of “relying too much” on the algorithm, leading to reduced professional responsibility: “The decision you make is yours, it is yours with your biases and everything, which also brings experience because it sometimes helps you to be aware and review your own prejudices” (FG2.1). Another drawback of using a RAI noted by participants was the concern that it may reproduce potentially outdated societal prejudices. To address this concern, domain experts expected frequent updates to the algorithms.
8. Discussion
RQ1: Under which conditions do participants using a RAI to predict recidivism achieve the highest predictive accuracy?
Overall, our findings suggest that human decision makers achieve higher accuracy for their risk-assessment when they are supported by an algorithm. Almost all treatment groups achieve a higher AUC than their corresponding control group after the treatment, although some of these differences are not statistically significant, particularly in the case of crowdsourced participants (Figures 4 and 6). The algorithm also influences human predictions for each decision and over time, as shown in Figure 4. This further suggests that algorithmic support establishes reference points to human predictions. The lower accuracy of the initial predictions of treatment group participants compared to control group participants is noteworthy. One possible explanation for this is that treated participants put less effort in their initial predictions in anticipation of algorithmic support and a potential opportunity to revise their initial prediction.
The finding that targeted participants (domain experts and data scientists) outperform crowdsourced participants contradicts the idea that crowdsourced participants are comparable to domain experts or professionals when testing RAIs. This highlights the importance of testing RAIs in the context of professional knowledge, training and usage.
Finally, using an absolute rather than a relative scale leads to more accurate predictions. The focus group further confirmed the preference of professionals for the absolute scale as the one closer to the real application. Our findings agree with Hilton et al. (Zoe Hilton et al., 2008), who found that risk categories are generally hard to agree upon across professions and individuals, and also with Hanson et al. (Hanson et al., 2017), who found that categories can be effective following a common agreement in correspondence to ranges of the absolute probability of recidivism. Thus, further studies should focus on the underlying support of numerical information in helping ground categorical distinctions for predictive risk assessment.
RQ2: To what extent do participants rely on the RAI to predict recidivism?
In line with previous studies (e.g., (Tan et al., 2018)) humans and algorithms tend to agree on very low and very high risk cases (see Supplementary Material A.3, particularly Figure 7), but there are cases that are difficult to predict for humans, for algorithms, or for both. A promising next step would be to identify cases that are clearly difficult for the machine, and or are potentially difficult to humans. In these cases one could more safely defer to humans, or ask them to invest more time in a specific evaluation, improving efficiency in the design of human-algorithm decision processes.
Our findings show that participants prefer a partially automated assistance with a large degree of human discretion. In addition, all experimental groups tend to downgrade the acceptable level of automation after the experiment (see Figure 6). Explanations for this could be that the differences between human and machine predictions caused the participants to realize strong human oversight was more necessary than what they initially thought.
Finally, the focus group discussions revealed that professionals’ reliance in an algorithm could be increased when the algorithm providers ensure good prediction performance and frequent system updates corresponding to new societal and institutional developments. This suggests that RiskEval and possibly other RAIs are elements of negotiation that should be taken with care and without assuming its outcome as objective, and that need frequent updates and audits.
9. Limitations and Future Work
This paper has to be seen in light of some limitations. First, the dataset used for training the algorithm has some drawbacks. It has only about 597 cases, which may affect the algorithm’s accuracy; however, we note that its AUC-ROC is in line with that of most recidivism prediction tools. We also note that in this dataset the ground-truth label is re-arrest and not re-offense, and re-arrest is not necessarily a good proxy for re-offense and further exhibits racial and geographical disparities (Fogliato et al., 2021b). Since the focus of this study is the assessment of user behaviour (not the algorithm), we do not expect these drawbacks to notably affect our main results. Second, in line with previous work, this study focuses on accuracy as a measure of algorithmic performance. However, decision support algorithms can be evaluated in many different ways (Sambasivan et al., 2021). Third, Figure 4 shows that participants are still calibrating their predictions after the training phase as they progress through the evaluation tasks, suggesting that the initial training phase may have been to short. The impact should be limited as the majority of the cases are evaluated after this learning curve has flattened.
The generalization of this work to other contexts is restricted by other factors. As usual in experimental user studies, the crowdsourced participants are not representative of the overall population. Table 1 shows that most have university-level education and good numeracy. Further, we only recruited participants in a single country. Thus, the pool of users might not exhibit a large cultural diversity, a factor that could bias outcomes (Beale and Peter, 2008; Lee and Selart, 2012). However, we also remark that crime and recidivism is different in different criminal systems and jurisdictions, and hence RAIs should be evaluated with careful attention to their context (Selbst et al., 2019). Sample size may be another limitation. While the size of our participant pool in the crowdsourced study (N=247, N=146) is in line with previous work, the number of participants in the targeted study (N=54) is relatively small. Despite these limitations in sample size, our results suggest consistent and in some cases statistically significant differences in the outcomes between crowdsourced and targeted participants.
Future research is needed to explore the reasons and conditions of these differences. This is particularly important in the public sector, where there is a lack of evidence on how algorithms affect public policies (Zuiderwijk et al., 2021). There is a clear need to pay attention to the usage contexts and the ways in which RAIs are deployed, to reduce the risks of automation and understand better in which conditions the assistance of an algorithm can be most helpful.
Acknowledgements.
This work has been partially supported by the HUMAINT programme (Human Behaviour and Machine Intelligence), Centre for Advanced Studies, Joint Research Centre, European Commission through the Expect contract CT-EX2019D347180. We thanks the collaboration from Prof. Antonio Andres Pueyo from Universitat de Barcelona (Spain), the Justice Department of Catalonia and the CEJFE. We thanks Emilia Gomez from the Joint Research Centre, European Commission; Alexandra Chouldechova and Riccardo Fogliato from Carnegie Mellon University, for their invaluable contributions and support. The research project was approved by the University’s ethical committee (CIREP) certifying that complies with the data protection legal framework, namely, with European General Data Protection Regulation (EU) 2016/679 -GDPR- and Spanish Organic Law 3/2018, of December 5th, on Protection of Personal Data and digital rights guarantee -LOPDGDD-.References
- (1)
- Andrés-Pueyo et al. (2018) Antonio Andrés-Pueyo, Karin Arbach-Lucioni, and Santiago Redondo. 2018. The RisCanvi: a new tool for assessing risk for violence in prison and recidivism. Recidivism Risk Assessment: A Handbook for Practitioners (2018), 255–268.
- Angwin et al. (2016) Julia Angwin, Jeff Larson, Surya Mattu, and Lauren Kirchner. 2016. Machine Bias: There’s Software Used across the Country to Predict Future Criminals and It’s Biased against Blacks. ProPublica (2016). Retrieved from https://www.propublica.org/article/machine-bias-risk-assessmentsin-criminal-sentencing.
- Bansak (2019) Kirk Bansak. 2019. Can nonexperts really emulate statistical learning methods? A comment on ”the accuracy, fairness, and limits of predicting recidivism”. Political Analysis (2019), 370–380. https://doi.org/10.1017/pan.2018.55
- Bao et al. (2021) Michelle Bao, Angela Zhou, Samantha Zottola, Brian Brubach, Sarah Desmarais, Aaron Horowitz, Kristian Lum, and Suresh Venkatasubramanian. 2021. It’s COMPASlicated: The Messy Relationship between RAI Datasets and Algorithmic Fairness Benchmarks. arXiv preprint arXiv:2106.05498 (2021).
- Barabas et al. (2018) Chelsea Barabas, Madars Virza, Karthik Dinakar, Joichi Ito, and Jonathan Zittrain. 2018. Interventions over predictions: Reframing the ethical debate for actuarial risk assessment. In Conference on Fairness, Accountability and Transparency. PMLR, 62–76.
- Barocas and Selbst (2016) Solon Barocas and Andrew D Selbst. 2016. Big data’s disparate impact. California Law Review 104 (2016), 671. https://heinonline.org/HOL/P?h=hein.journals/calr104&i=695
- Batastini et al. (2019) Ashley B. Batastini, Camden E. Hoeffner, Michael J. Vitacco, Robert D. Morgan, Lauren C. Coaker, and Michael E. Lester. 2019. Does the Format of the Message Affect What Is Heard? A Two-Part Study on the Communication of Violence Risk Assessment Data. Journal of Forensic Psychology Research and Practice 19, 1 (2019), 44–71. https://doi.org/10.1080/24732850.2018.1538474
- Beale and Peter (2008) Russell Beale and Christian Peter. 2008. The role of affect and emotion in HCI. Lecture Notes in Computer Science (including subseries Lecture Notes in Artificial Intelligence and Lecture Notes in Bioinformatics) 4868 LNCS (2008), 1–11. https://doi.org/10.1007/978-3-540-85099-1_1
- Berk (2017) Richard Berk. 2017. An impact assessment of machine learning risk forecasts on parole board decisions and recidivism. Journal of Experimental Criminology 13, 2 (2017), 193–216.
- Binns and Veale (2021) Reuben Binns and Michael Veale. 2021. Is That Your Final Decision? Multi-Stage Profiling, Selective Effects, and Article 22 of the GDPR. International Data Privacy Law 00, 0 (2021), 1–14.
- Burton et al. (2020) Jason W Burton, Mari-Klara Stein, and Tina Blegind Jensen. 2020. A systematic review of algorithm aversion in augmented decision making. Journal of Behavioral Decision Making 33, 2 (2020), 220–239.
- Chancey et al. (2017) Eric T. Chancey, James P. Bliss, Yusuke Yamani, and Holly A.H. Handley. 2017. Trust and the Compliance-Reliance Paradigm: The Effects of Risk, Error Bias, and Reliability on Trust and Dependence. Human Factors 59, 3 (2017), 333–345. https://doi.org/10.1177/0018720816682648
- Cheng et al. (2019) Hao-Fei Cheng, Ruotong Wang, Zheng Zhang, Fiona O’Connell, Terrance Gray, F. Maxwell Harper, and Haiyi Zhu. 2019. Explaining Decision-Making Algorithms through UI. In Proceedings of the 2019 CHI Conference on Human Factors in Computing Systems - CHI ’19. ACM Press, New York, New York, USA, 1–12. https://doi.org/10.1145/3290605.3300789
- Chiusi et al. (2020) Fabio Chiusi, Sarah Fischer, Nicolas Kayser-Bril, and Matthias Spielkamp. 2020. Automating Society Report 2020. Technical Report. AlgorithmWatch. https://automatingsociety.algorithmwatch.org
- Cummings (2004) M. L. Cummings. 2004. Automation bias in intelligent time critical decision support systems. Collection of Technical Papers - AIAA 1st Intelligent Systems Technical Conference 2 (2004), 557–562. https://doi.org/10.4324/9781315095080-17
- Dahle et al. (2014) Klaus-Peter Dahle, Jürgen Biedermann, Robert JB Lehmann, and Franziska Gallasch-Nemitz. 2014. The development of the Crime Scene Behavior Risk measure for sexual offense recidivism. Law and human behavior 38, 6 (2014), 569.
- De-Arteaga et al. (2020) Maria De-Arteaga, Riccardo Fogliato, and Alexandra Chouldechova. 2020. A Case for Humans-in-the-Loop: Decisions in the Presence of Erroneous Algorithmic Scores. In Proceedings of the 2020 CHI Conference on Human Factors in Computing Systems. ACM, New York, NY, USA, 1–12. https://doi.org/10.1145/3313831.3376638 arXiv:2002.08035
- Desmarais and Singh (2013) Sarah Desmarais and Jay Singh. 2013. Risk assessment instruments validated and implemented in correctional settings in the United States. Lexington, KY: Council of State Governments (2013).
- Desmarais et al. (2016) Sarah L Desmarais, Kiersten L Johnson, and Jay P Singh. 2016. Performance of recidivism risk assessment instruments in US correctional settings. Psychological Services 13, 3 (2016), 206.
- Dietvorst et al. (2015) Berkeley J Dietvorst, Joseph P Simmons, and Cade Massey. 2015. Algorithm aversion: People erroneously avoid algorithms after seeing them err. Journal of Experimental Psychology: General 144, 1 (2015), 114.
- Douglas et al. (2003) Kevin S Douglas, James RP Ogloff, and Stephen D Hart. 2003. Evaluation of a model of violence risk assessment among forensic psychiatric patients. Psychiatric Services 54, 10 (2003), 1372–1379.
- Dressel and Farid (2018) Julia Dressel and Hany Farid. 2018. The accuracy, fairness, and limits of predicting recidivism. Science Advances 4, 1 (2018), 1–6. https://doi.org/10.1126/sciadv.aao5580
- Du et al. (2019) Na Du, Kevin Y. Huang, and X. Jessie Yang. 2019. Not All Information Is Equal: Effects of Disclosing Different Types of Likelihood Information on Trust, Compliance and Reliance, and Task Performance in Human-Automation Teaming. Human Factors (2019). https://doi.org/10.1177/0018720819862916
- Fogliato et al. (2021a) Riccardo Fogliato, Alexandra Chouldechova, and Zachary Lipton. 2021a. The Impact of Algorithmic Risk Assessments on Human Predictions and its Analysis via Crowdsourcing Studies. arXiv preprint arXiv:2109.01443 (2021).
- Fogliato et al. (2021b) Riccardo Fogliato, Alice Xiang, Zachary Lipton, Daniel Nagin, and Alexandra Chouldechova. 2021b. On the Validity of Arrest as a Proxy for Offense: Race and the Likelihood of Arrest for Violent Crimes. arXiv preprint arXiv:2105.04953 (2021).
- Goel et al. (2019) Sharad Goel, Ravi Shroff, Jennifer L. Skeem, and Christopher Slobogin. 2019. The Accuracy, Equity, and Jurisprudence of Criminal Risk Assessment. SSRN Electronic Journal (2019), 1–21. https://doi.org/10.2139/ssrn.3306723
- Green (2020) Ben Green. 2020. The false promise of risk assessments: Epistemic reform and the limits of fairness. FAT* 2020 - Proceedings of the 2020 Conference on Fairness, Accountability, and Transparency (2020), 594–606. https://doi.org/10.1145/3351095.3372869
- Green (2021) Ben Green. 2021. The Flaws of Policies Requiring Human Oversight of Government Algorithms. SSRN Electronic Journal (2021), 1–42. https://doi.org/10.2139/ssrn.3921216 arXiv:2109.05067
- Green and Chen (2019a) Ben Green and Yiling Chen. 2019a. Disparate Interactions. In Proceedings of the Conference on Fairness, Accountability, and Transparency. ACM, New York, NY, USA, 90–99. https://doi.org/10.1145/3287560.3287563
- Green and Chen (2019b) Ben Green and Yiling Chen. 2019b. The principles and limits of algorithm-in-the-loop decision making. Proceedings of the ACM on Human-Computer Interaction 3, CSCW (2019). https://doi.org/10.1145/3359152
- Green and Chen (2020) Ben Green and Yiling Chen. 2020. Algorithmic risk assessments can alter human decision-making processes in high-stakes government contexts. (2020). arXiv:2012.05370 http://arxiv.org/abs/2012.05370
- Grgic-Hlaca et al. (2019) Nina Grgic-Hlaca, Christoph Engel, and Krishna P. Gummadi. 2019. Human decision making with machine advice: An experiment on bailing and jailing. Proceedings of the ACM on Human-Computer Interaction 3, CSCW (2019). https://doi.org/10.1145/3359280
- Grgić-Hlača et al. (2019) Nina Grgić-Hlača, Christoph Engel, and Krishna P Gummadi. 2019. Human decision making with machine assistance: An experiment on bailing and jailing. Proceedings of the ACM on Human-Computer Interaction 3, CSCW (2019), 1–25.
- Hanson et al. (2017) R. Karl Hanson, Guy Bourgon, Robert J. McGrath, Daryl G. Kroner, David A. D’Amora, Shenique S. Thomas, and Lahiz P. Tavarez. 2017. A five-level risk and needs system: Maximizing assessment results in corrections through the development of a common language. January (2017). https://csgjusticecenter.org/wp-content/uploads/2017/01/A-Five-Level-Risk-and-Needs-System_Report.pdf
- Harris et al. (2015) Grant T. Harris, Christopher T. Lowenkamp, and N. Zoe Hilton. 2015. Evidence for Risk Estimate Precision: Implications for Individual Risk Communication. Behavioral Sciences & the Law 33, 1 (feb 2015), 111–127. https://doi.org/10.1002/bsl.2158
- Heilbrun et al. (1999) Kirk Heilbrun, Joel Dvoskin, Stephen Hart, and Dale Mcniel. 1999. Violence risk communication: Implications for research, policy, and practice. Health, Risk and Society 1, 1 (1999), 91–105. https://doi.org/10.1080/13698579908407009
- Hilton et al. (2017) N. Zoe Hilton, Elke Ham, Kevin L. Nunes, Nicole C. Rodrigues, Cairina Frank, and Michael C. Seto. 2017. Using Graphs to Improve Violence Risk Communication. Criminal Justice and Behavior 44, 5 (2017), 678–694. https://doi.org/10.1177/0093854816668916
- Hilton et al. (2015) N. Zoe Hilton, Nicholas Scurich, and Leslie-Maaike Helmus. 2015. Communicating the Risk of Violent and Offending Behavior: Review and Introduction to this Special Issue. Behavioral Sciences & the Law 33, 1 (feb 2015), 1–18. https://doi.org/10.1002/bsl.2160
- Howard and Dixon (2012) Philip D Howard and Louise Dixon. 2012. The construction and validation of the OASys Violence Predictor: Advancing violence risk assessment in the English and Welsh correctional services. Criminal Justice and Behavior 39, 3 (2012), 287–307.
- Jahanbakhsh et al. (2020) Farnaz Jahanbakhsh, Justin Cranshaw, Scott Counts, Walter S Lasecki, and Kori Inkpen. 2020. An Experimental Study of Bias in Platform Worker Ratings: The Role of Performance Quality and Gender. In Proceedings of the 2020 CHI Conference on Human Factors in Computing Systems. 1–13.
- Jung et al. (2013) Sandy Jung, Anna Pham, and Liam Ennis. 2013. Measuring the disparity of categorical risk among various sex offender risk assessment measures. Journal of Forensic Psychiatry and Psychology 24, 3 (2013), 353–370. https://doi.org/10.1080/14789949.2013.806567
- Kleinberg et al. (2018) Jon Kleinberg, Himabindu Lakkaraju, Jure Leskovec, Jens Ludwig, and Sendhil Mullainathan. 2018. Human decisions and machine predictions. The quarterly journal of economics 133, 1 (2018), 237–293.
- Kröner et al. (2007) Carolin Kröner, Cornelis Stadtland, Matthias Eidt, and Norbert Nedopil. 2007. The validity of the Violence Risk Appraisal Guide (VRAG) in predicting criminal recidivism. Criminal Behaviour and Mental Health 17, 2 (2007), 89–100.
- Lee and See (2004) John D Lee and Katrina A See. 2004. Trust in Automation: Designing for Appropriate Reliance. Human Factors: The Journal of the Human Factors and Ergonomics Society 46, 1 (jan 2004), 50–80. https://doi.org/10.1518/hfes.46.1.50_30392
- Lee and Selart (2012) Wing Shing Lee and Marcus Selart. 2012. The impact of emotions on trust decisions. Handbook on Psychology of Decision-Making: New Research (2012), 235–248.
- Lin et al. (2020) Zhiyuan Jerry Lin, Jongbin Jung, Sharad Goel, and Jennifer Skeem. 2020. The limits of human predictions of recidivism. Science Advances 6, 7 (feb 2020), 1–8. https://doi.org/10.1126/sciadv.aaz0652
- Lipkus et al. (2001) Isaac M. Lipkus, Greg Samsa, and Barbara K. Rimer. 2001. General performance on a numeracy scale among highly educated samples. Medical Decision Making 21, 1 (2001), 37–44. https://doi.org/10.1177/0272989X0102100105
- Mallari et al. (2020) Keri Mallari, Kori Inkpen, Paul Johns, Sarah Tan, Divya Ramesh, and Ece Kamar. 2020. Do I Look Like a Criminal? Examining how Race Presentation Impacts Human Judgement of Recidivism. In Proceedings of the 2020 CHI Conference on Human Factors in Computing Systems. ACM, New York, NY, USA, 1–13. https://doi.org/10.1145/3313831.3376257 arXiv:2002.01111
- McCallum et al. (2017) Katherine E. McCallum, Marcus T. Boccaccini, and Claire N. Bryson. 2017. The Influence of Risk Assessment Instrument Scores on Evaluators’ Risk Opinions and Sexual Offender Containment Recommendations. Criminal Justice and Behavior 44, 9 (2017), 1213–1235. https://doi.org/10.1177/0093854817707232
- Morgan et al. (1998) D L Morgan, R A Krueger, and J A King. 1998. The Focus Group Guidebook. SAGE Publications. https://books.google.es/books?id=5q3k3No59OcC
- Mosier et al. (1998) Kathleen L. Mosier, Linda J. Skitka, Susan Heers, and Mark Burdick. 1998. Automation bias: Decision making and performance in high-tech cockpits. International Journal of Aviation Psychology 8, 1 (1998), 47–63. https://doi.org/10.1207/s15327108ijap0801_3
- Portela and Granell-canut (2017) Manuel Portela and Carlos Granell-canut. 2017. A new friend in our Smartphone ? Observing Interactions with Chatbots in the search of emotional engagement. In Proceedings of Interacción ’17. https://doi.org/10.1145/3123818.3123826
- Rettenberger et al. (2010) Martin Rettenberger, Michael Mönichweger, Elvira Buchelle, Frank Schilling, and Reinhard Eher. 2010. Entwicklung eines Screeninginstruments zur Vorhersage der einschlägigen Rückfälligkeit von Gewaltstraftätern [The development of a screening scale for the prediction of violent offender recidivism]. Monatsschrift für Kriminologie und Strafrechtsreform 93, 5 (2010), 346–360.
- Sambasivan et al. (2021) Nithya Sambasivan, Shivani Kapania, Hannah Highfill, Diana Akrong, Praveen Paritosh, and Lora M Aroyo. 2021. “Everyone wants to do the model work, not the data work”: Data Cascades in High-Stakes AI. In Proceedings of the 2021 CHI Conference on Human Factors in Computing Systems. ACM, New York, NY, USA, 1–15. https://doi.org/10.1145/3411764.3445518
- Scott and Bruce (1995) Susanne G. Scott and Reginald A. Bruce. 1995. Decision-Making Style: The Development and Assessment of a New Measure. Educational and Psychological Measurement 55, 5 (oct 1995), 818–831. https://doi.org/10.1177/0013164495055005017
- Scurich (2015) Nicholas Scurich. 2015. The Differential Effect of Numeracy and Anecdotes on the Perceived Fallibility of Forensic Science. Psychiatry, Psychology and Law 22, 4 (2015), 616–623. https://doi.org/10.1080/13218719.2014.965293
- Scurich et al. (2012) Nicholas Scurich, John Monahan, and Richard S. John. 2012. Innumeracy and unpacking: Bridging the nomothetic/idiographic divide in violence risk assessment. Law and Human Behavior 36, 6 (2012), 548–554. https://doi.org/10.1037/h0093994
- Selbst et al. (2019) Andrew D. Selbst, Danah Boyd, Sorelle A. Friedler, Suresh Venkatasubramanian, and Janet Vertesi. 2019. Fairness and abstraction in sociotechnical systems. FAT* 2019 - Proceedings of the 2019 Conference on Fairness, Accountability, and Transparency (2019), 59–68. https://doi.org/10.1145/3287560.3287598
- Singh et al. (2011) Jay P Singh, Martin Grann, and Seena Fazel. 2011. A comparative study of violence risk assessment tools: A systematic review and metaregression analysis of 68 studies involving 25,980 participants. Clinical psychology review 31, 3 (2011), 499–513.
- Skeem et al. (2016) Jennifer Skeem, John Monahan, and Christopher Lowenkamp. 2016. Gender, risk assessment, and sanctioning: The cost of treating women like men. Law and human behavior 40, 5 (2016), 580.
- Stevenson (2018) Megan Stevenson. 2018. Assessing risk assessment in action. Minnesota Law Review 103 (2018), 303. https://heinonline.org/HOL/P?h=hein.journals/mnlr103&i=313
- Stevenson and Doleac (2021) Megan T Stevenson and Jennifer L Doleac. 2021. Algorithmic Risk Assessment in the Hands of Humans. (2021). https://doi.org/10.2139/ssrn.3489440
- Storey et al. (2015) Jennifer E. Storey, Kelly A. Watt, and Stephen D. Hart. 2015. An Examination of Violence Risk Communication in Practice Using a Structured Professional Judgment Framework. Behavioral Sciences & the Law 33, 1 (feb 2015), 39–55. https://doi.org/10.1002/bsl.2156
- Tan et al. (2018) Sarah Tan, Julius Adebayo, Kori Inkpen, and Ece Kamar. 2018. Investigating Human + Machine Complementarity for Recidivism Predictions. (aug 2018). arXiv:1808.09123 http://arxiv.org/abs/1808.09123
- van Maanen et al. (2007) Peter-Paul van Maanen, Tomas Klos, and Kees van Dongen. 2007. Aiding Human Reliance Decision Making Using Computational Models of Trust. In 2007 IEEE/WIC/ACM International Conferences on Web Intelligence and Intelligent Agent Technology - Workshops. IEEE, 372–376. https://doi.org/10.1109/WI-IATW.2007.108
- Yin et al. (2019) Ming Yin, Jennifer Wortman Vaughan, and Hanna Wallach. 2019. Understanding the effect of accuracy on trust in machine learning models. Conference on Human Factors in Computing Systems - Proceedings (2019), 1–12. https://doi.org/10.1145/3290605.3300509
- Yu et al. (2020) Bowen Yu, Ye Yuan, Loren Terveen, Zhiwei Steven Wu, Jodi Forlizzi, and Haiyi Zhu. 2020. Keeping Designers in the Loop: Communicating Inherent Algorithmic Trade-offs Across Multiple Objectives. In DIS’20. 1245–1257. https://doi.org/10.1145/1235 arXiv:1910.03061
- Zhang et al. (2020) Yunfeng Zhang, Q. Vera Liao, Rachel K.E. E. Bellamy, Q. Vera Liao, and Rachel K.E. E. Bellamy. 2020. Efect of confidence and explanation on accuracy and trust calibration in AI-assisted decision making. FAT* 2020 - Proceedings of the 2020 Conference on Fairness, Accountability, and Transparency (jan 2020), 295–305. https://doi.org/10.1145/3351095.3372852 arXiv:2001.02114
- Zoe Hilton et al. (2008) N. Zoe Hilton, Angela M. Carter, Grant T. Harris, and Amilynn J. B. Sharpe. 2008. Does Using Nonnumerical Terms to Describe Risk Aid Violence Risk Communication? Journal of Interpersonal Violence 23, 2 (2008), 171–188. https://doi.org/10.1177/0886260507309337
- Zuiderwijk et al. (2021) Anneke Zuiderwijk, Yu Che Chen, and Fadi Salem. 2021. Implications of the use of artificial intelligence in public governance: A systematic literature review and a research agenda. Government Information Quarterly May 2020 (2021), 101577. https://doi.org/10.1016/j.giq.2021.101577
SUPPLEMENTARY MATERIAL
Appendix A Additional information about our approach
A.1. Experimental groups
The number of participants in each experimental group is shown in Table 2.
| Type | Crowdsourced | Crowdsourced | Targeted | |||
|---|---|---|---|---|---|---|
| Group | N | Round 1 | N | Round 2 | N | |
| Control | 48 | Abs. scale | 17 | Abs. scale | - | - |
| G1 | 100 | Abs. scale / categorical | 66 | Abs. scale / cat. and num. | 36 | Abs. scale / cat. and num. |
| G2 | 99 | Abs. scale / cat. and num. | 63 | Rel. scale / cat. and num. | 18 | Rel. scale / cat. and num. |
| Total | 247 | 146 | 54 | |||
A.2. Designing the algorithm
We use logistic regression to predict violent recidivism. The features given as input are the 23 items that determine the REVI score in RiskEval, plus three demographic features (age, gender, and nationality). The evaluation was done by -fold cross-validation, i.e., dividing the data into parts, training on parts and evaluating on the remaining part. The accuracy of the model is 0.76 in terms of AUC-ROC which is the average result over the runs. Finally, the logistic regression estimates were calibrated, which means that they were transformed to correspond to an estimate of the probability of the outcome.
A.3. Datasets
An original dataset with 597 cases was used for creating the algorithm as described above. The dataset is anonymized and shared through a formal collaboration agreement between our university and the Department of Justice of Country. This agreement indicates that no personal data is shared with the university.
A.3.1. Semi-synthetic case pool (90 cases)
Although the original dataset did not include personal information, we wanted to make sure that participants never had access to the features of one person. Hence, we created 90 semi-synthetic cases by doing a cross-over of features within a group of similar cases. Each group of cases was selected so that the difference in computed RiskEval between the highest and lowest risk was at most 0.1. The generated case differs by a minimum of one and a maximum of three features from any case in the group, and has a RiskEval risk level within the same risk range of the cases in each group. A preliminary experiment with 31 crowdsourced participants, in which no machine assistance was shown, was used to estimate the difficulty of human risk assessment (i.e., how distant was the prediction from the ground truth) for each case.
A.3.2. Case selection (11 cases)
From 90 semi-synthetic cases, 11 cases were selected to be evaluated by participants. This selection was done by sampling 8 non-recidivists and 3 recidivists to have a recidivism rate close to what is observed in Country. To perform this sampling, we stratified the cases by human difficulty and machine difficulty into three groups (easy, medium, hard). “Difficulty” means how far, on average, is the prediction from the ground truth. This yields nine classes of difficulty (e.g., “easy” for humans and “hard” for the model) from which we sampled the 11 cases. As we explained in Section 4, we exchanged two cases to increase the general AUC-ROC of the entire dataset.
The resulting 11 cases are depicted in Figure 7, where cases are grouped by ground truth and their risks are predicted by crowdsourced (R2) and targeted studies combined. It can be noticed that the accuracy of human predictions differs for different cases, and that in some cases, answers are more spread.
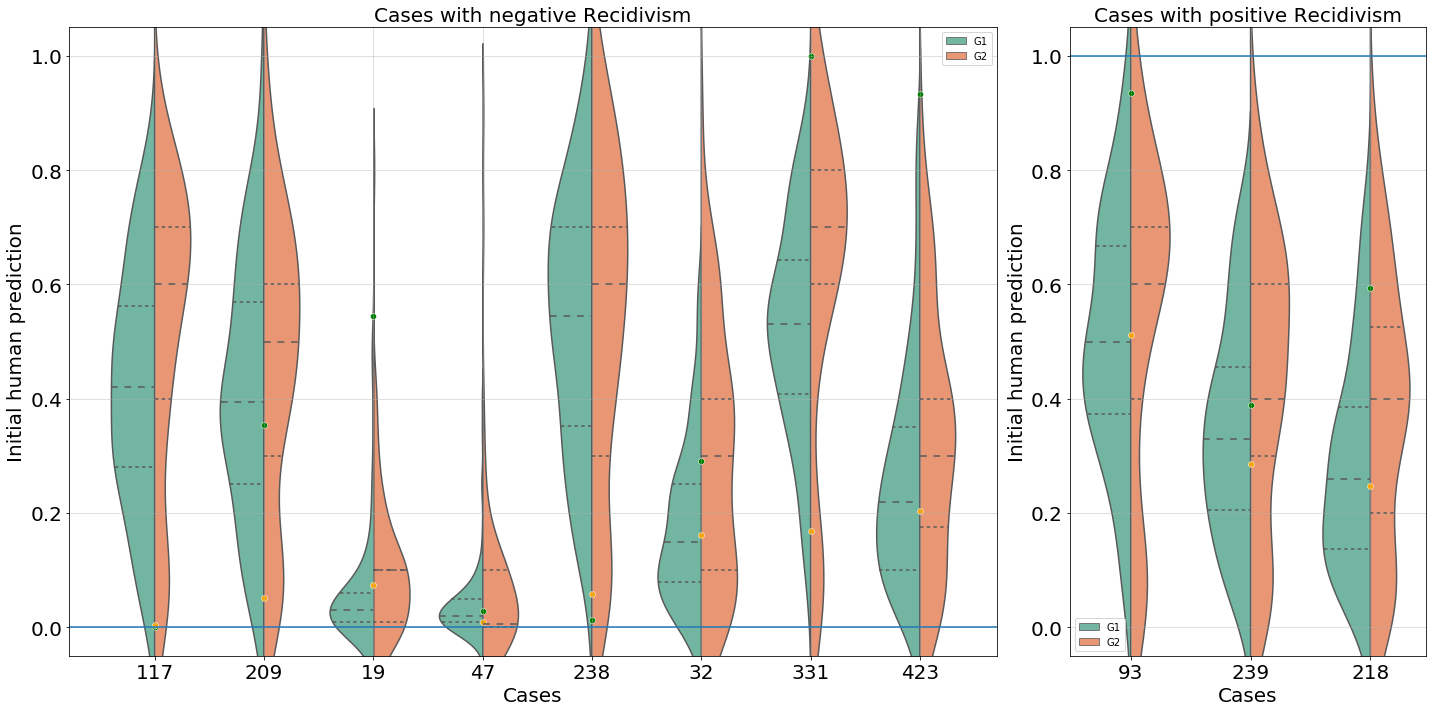
Appendix B Surveys
B.1. Level of automation survey
This survey was based on the levels of automation proposed by Cummings (Cummings, 2004). Cummings proposed ten levels going from “the computer decides everything and acts autonomously, ignoring the human” (level 10) to “the computer offers no assistance: a human must take all decisions and actions” (level 1). We reduced the ten levels to five, to make it more understandable and easier to answer for participants.
Question: Would you use a computer system, developed at a university, and based on statistics, to predict the level of risk of violent criminal recidivism?
-
•
Level 1: No, the expert should decide the risk level by himself/herself
-
•
Level 2: Only if the computational system suggests some options, but it is the expert who defines the risk level
-
•
Level 3: Only if the computational system suggests one option, but the expert can provide an alternative option
-
•
Level 4: Only if the computational system suggests one option and the expert can decide to take it or not
-
•
Level 5: Yes, the computational system should decide the risk level by itself
B.2. Questions for the focus groups
Questions were used to stimulate the discussion, but we invited participants to comment on any aspect of the experiment.
-
•
Q1: What is your general opinion on Risk Assessment Instruments [explain to participants] in criminal justice settings?
-
•
Q2: How do you think the machine prediction in this study works? Could you explain it?
-
•
Q3: Do you think that one of these two scales [show them to participants] would be better than the other? Why?
-
•
Q4: From the list of case characteristics [show to participants], which were the ones that helped you the most to make a decision about the risk of recidivism?
-
•
Q5: Explain, why do you think that these features can help define the prediction of these cases?
-
•
Q6: What does a 10% risk mean to you in the context of this study?
-
•
Q7: What does a 2 over 10 risk mean for you in the context of the study?
-
•
Q8: Despite an improvement in the accuracy, participants tended to rely less on the machine prediction after the experiment, why do you think that it happens? What was your experience?
-
•
Q9: Suppose that you can decide to use an algorithm-supported decision making system in this context. What would be the advantages and disadvantages of it?
B.3. Assessment Interface
Figure 9 shows the first page of each evaluation, which is the same for the control and treatment groups. Participants can see each of the risk factors with their variables and select those 3 that they believe are more important to define their prediction. They are asked to define their probability moving the marker on the bar, having as a reference the five levels of risk that depend on the type of scale used. Before moving to the next page they have to assign a value to their confidence in their answer. Figure 9 shows the second page with the machine assistance, which only the treatment groups see. It shows the algorithm prediction in a similar bar/scale, compared to the participant’s prediction. Then, the participant has the possibility to change their own prediction and provide a confidence score.
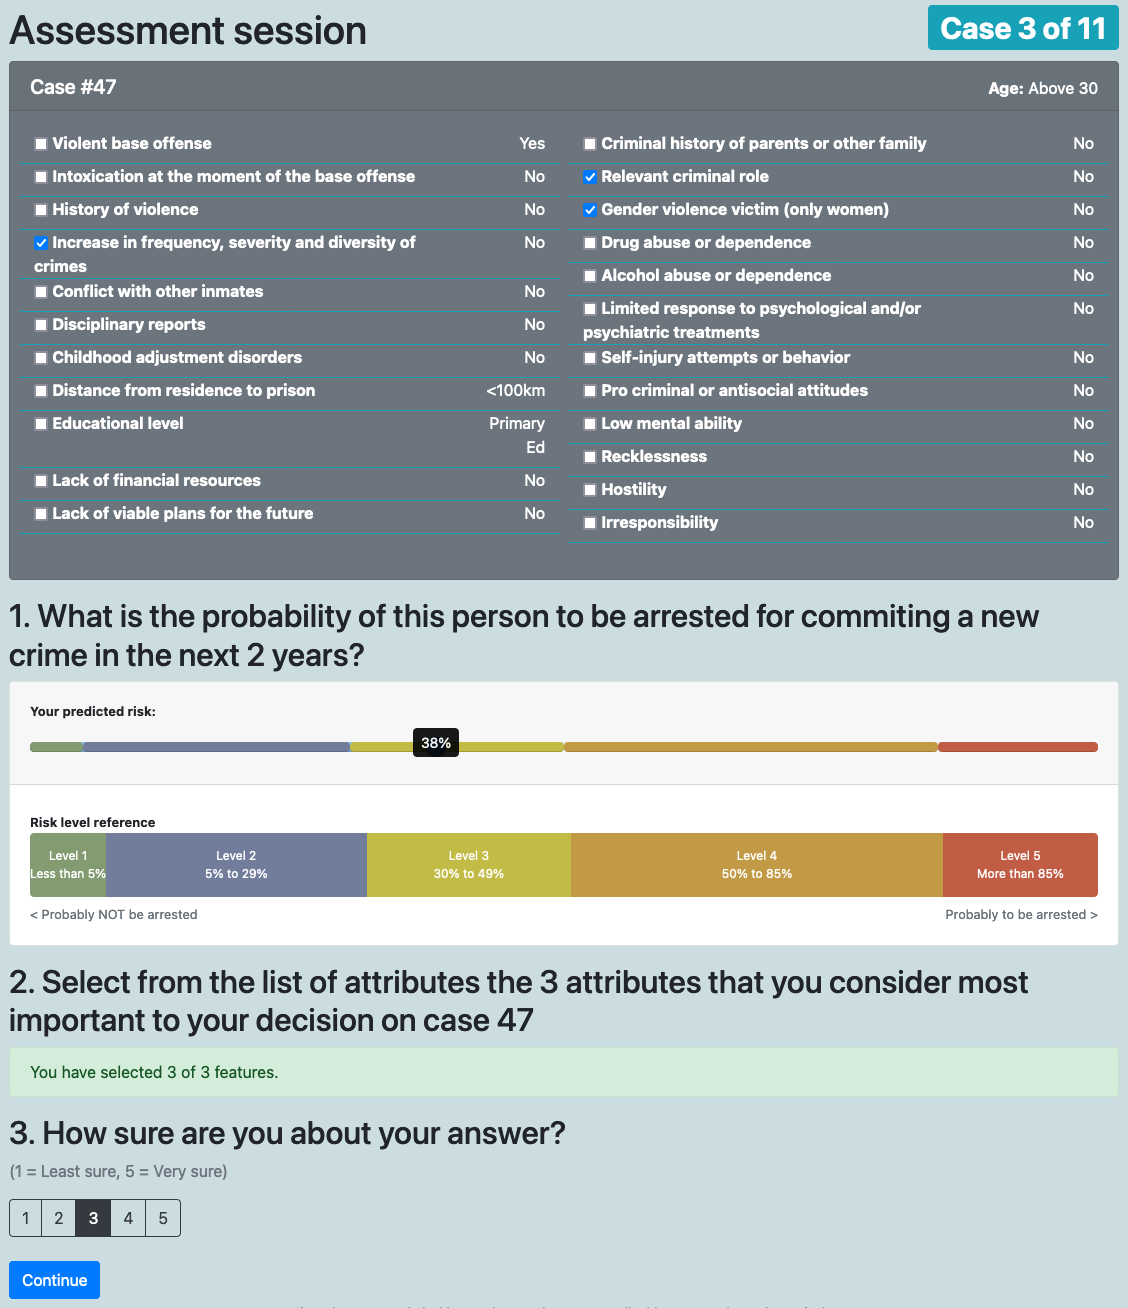
First page of evaluation.
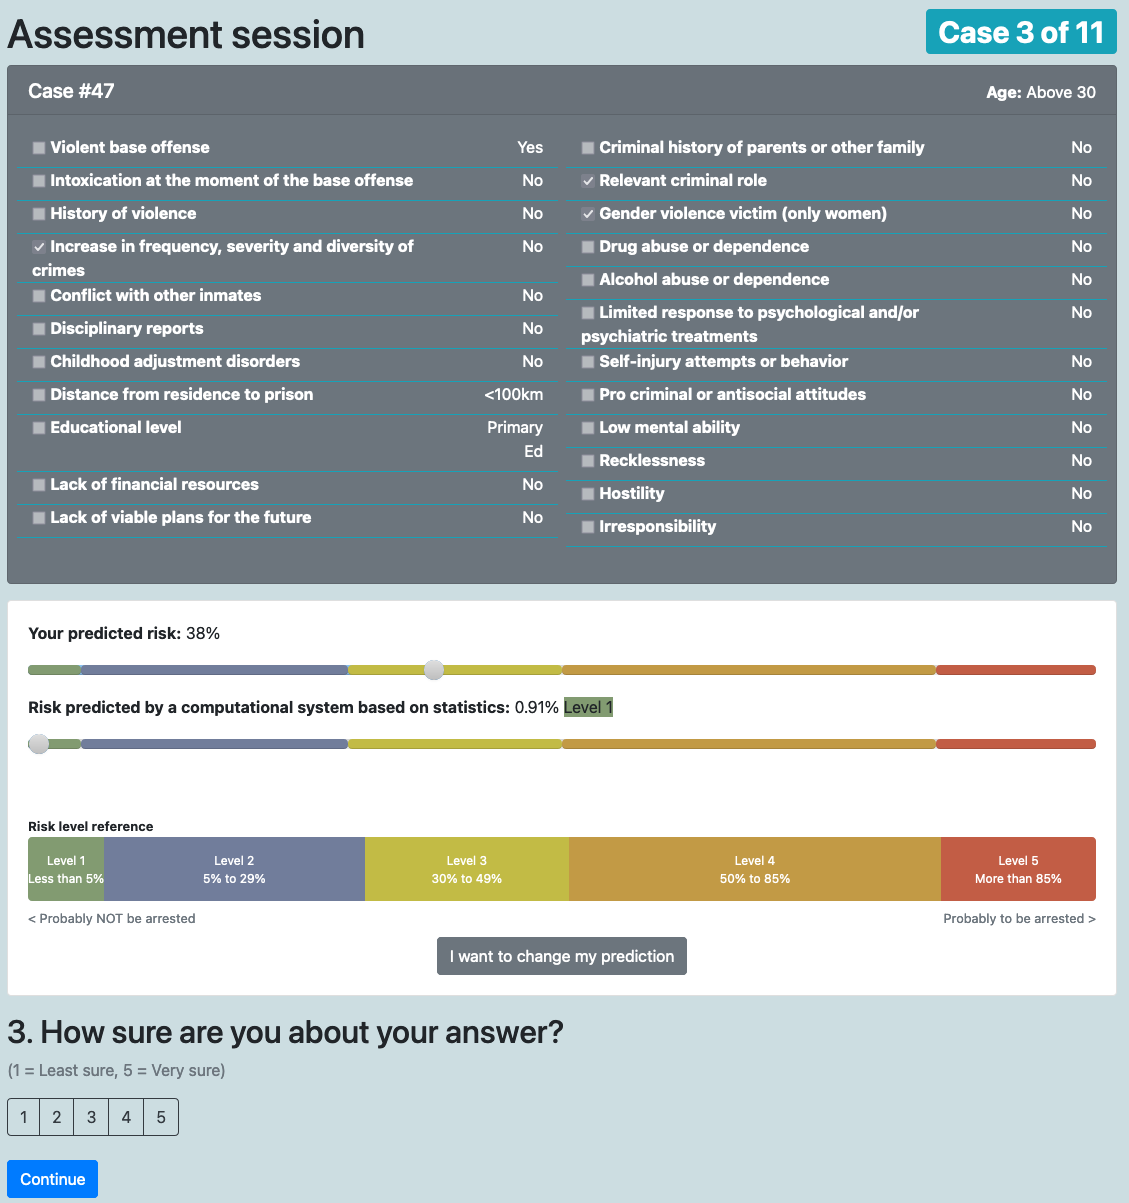
Second page of evaluation.
Figure 10 shows the alternatives in the crowdsourced R1 study. The control group only sees their own prediction without any feedback. The G1 (bottom) is able to see their prediction compared with the algorithm’s prediction, while G2 (middle) is able to see also the most important features that defines the algorithm’s prediction (explainers).
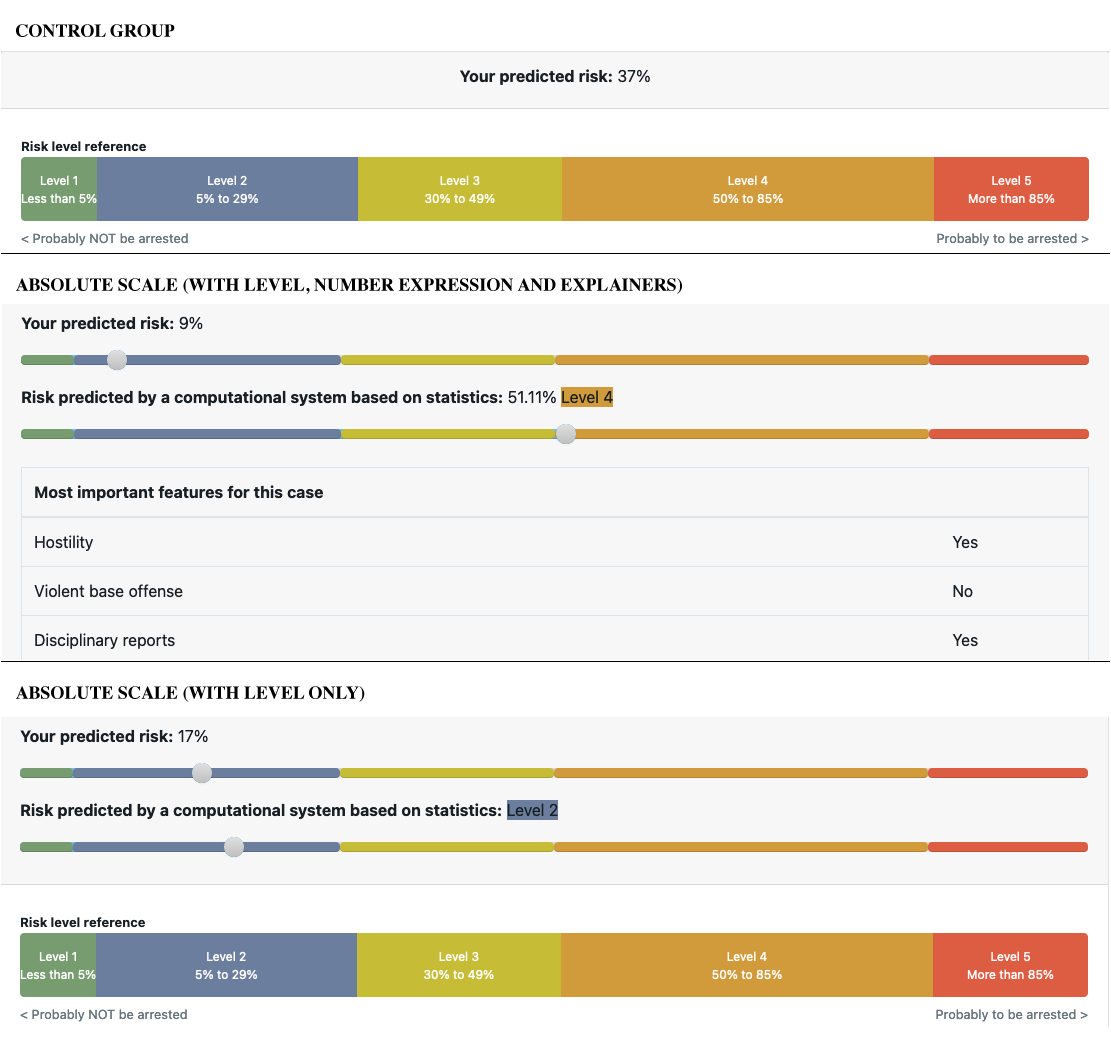
A woman and a girl in white dresses sit in an open car.
Appendix C Additional results
C.1. Accuracy results per sub-group
| Groups | Control | R1G1 | R1G2 — R2G1 — TG1 | R2G2 — TG2 | |||
|---|---|---|---|---|---|---|---|
| Treatment | Absolute | Absolute & non-numerical | Absolute & percentage | Relative & score | |||
| Participant type | Before | After | Before | After | Before | After | |
| Crowdsourced R1 - N=247 | 0.599 (0.277) | 0.598 (0.273) | 0.621 (0.271) | 0.576 (0.291) | 0.607 (0.280) | - | - |
| Crowdsourced R2 - N=146 | 0.652 (0.262) | - | - | 0.582 (0.265) | 0.665 (0.240) | 0.606 (0.271) | 0.622 (0.269) |
| Data science (students) - N=14 | - | - | - | 0.652 (0.229) | 0.690 (0.203) | 0.589 (0.269) | 0.667 (0.266) |
| Data science (professionals) - N=11 | - | - | - | 0.736 (0.219) | 0.729 (0.218) | 0.667 (0.269) | 0.719 (0.267) |
| Domain experts (students) - N=4 | - | - | - | 0.771 (0.211) | 0.833 (0.169) | 0.750 (0.264) | 0.729 (0.264) |
| Domain experts (professionals) - N=25 | - | - | - | 0.636 (0.236) | 0.773 (0.191) | 0.637 (0.270) | 0.673 (0.267) |
In Table 3 we present the results from different groups, including targeted groups of data scientists and domain experts, separating students and professionals. In the table we also include the Brier Score (lower is better), which is consistent with the AUC-ROC results (higher is better).
In addition, in Table 4 we show results from a t-test to show differences between crowdsourced and targeted groups.
| Group 1 | Relation | Group 2 | p-value |
|---|---|---|---|
| Crowd R1- Control | ¡ | Targeted - G1 Before | 0.018 |
| Crowd R1- Control | ¡ | Targeted - G1 After | 0.002 |
| Crowd R1- Control | ¡ | Targeted - G2 After | 0.016 |
| Crowd R1 - G1 Before | ¡ | Targeted - G1 Before | 0.002 |
| Crowd R1 - G1 Before | ¡ | Targeted - G1 After | 0.002 |
| Crowd R1 - G1 Before | ¡ | Targeted - G2 After | 0.006 |
| Crowd R1 - G2 Before | ¡ | Targeted - G1 Before | 0.004 |
| Crowd R1 - G2 Before | ¡ | Crowd R1 - G1 After | 0.020 |
| Crowd R1 - G2 Before | ¡ | Crowd R1 - G2 After | 0.092 |
| Crowd R2- Control | ¿ | Crowd R2 - G1 Before | 0.082 |
| Crowd R2- Control | ¡ | Targeted - G1 After | 0.010 |
| Crowd R2 - G1 Before | ¡ | Targeted - G1 Before | 0.004 |
| Crowd R2 - G1 Before | ¡ | Crowd R2 - G1 After | 0.012 |
| Crowd R2 - G1 Before | ¡ | Targeted - G1 After | 0.002 |
| Crowd R2 - G1 Before | ¡ | Targeted - G2 After | 0.018 |
| Crowd R2 - G2 Before | ¡ | Targeted - G1 Before | 0.042 |
| Crowd R2 - G2 Before | ¡ | Crowd R2 - G1 After | 0.044 |
| Crowd R2 - G2 Before | ¡ | Targeted - G1 After | 0.002 |
| Crowd R2 - G2 Before | ¡ | Targeted - G2 After | 0.034 |
| Targeted - G1 Before | ¿ | Crowd R2 - G2 After | 0.088 |
| Targeted - G1 Before | ¡ | Targeted - G1 After | 0.026 |
| Targeted - G2 Before | ¡ | Targeted - G1 After | 0.004 |
| Crowd R2 - G1 After | ¡ | Targeted - G1 After | 0.020 |
| Crowd R2 - G2 After | ¡ | Targeted - G1 After | 0.002 |
| Targeted - G1 After | ¿ | Targeted - G2 After | 0.058 |
C.2. Preferred level of automation and experience
In addition to the level of automation question, we asked participants about their previous experience with Risk Assessment Instruments (RAI) on a scale from 1 (This is the first time I heard or read about risk assessment instruments) to 5 (I have used this kind of tools more than one time). In Table 5 we can see that targeted participants report more previous experience than crowdsourced participants. We can also see that the preferred level of automation is in general lower at the end of the experiment than at the beginning, in all cases except for the control groups.
| Experimental Groups | Experience | Preferred level of automation | |
|---|---|---|---|
| (1=least, 5=most) | (1=no automation, 5=fully automated) | ||
| Start | End | ||
| Crowd R1 - Control | 1.62 0.76 | 2.88 1.02 | 2.96 1.03 |
| Crowd R1 - G1 | 1.79 0.99 | 3.08 1.07 | 3.01 1.05 |
| Crowd R1 - G2 | 1.70 0.82 | 3.01 1.08 | 2.87 1.10 |
| Crowd R2 - Control | 1.29 0.47 | 2.82 1.07 | 2.59 1.00 |
| Crowd R2 - G1 | 1.48 0.67 | 2.61 1.03 | 2.48 1.06 |
| Crowd R2 - G2 | 1.70 0.85 | 3.00 1.03 | 2.60 0.91 |
| Targeted G1 | 3.02 1.43 | 2.75 0.90 | 2.68 0.84 |
| Targeted G2 | 3.16 1.44 | 3.11 0.83 | 3.05 0.87 |
C.3. Self-reported confidence
We observe that self-reported confidence is stable across all subgroups. For each case evaluation, participants had to answer their level of confidence on a likert scale (1 to 5). After seeing the algorithm prediction and with the opportunity to change their prediction or not, they are asked about their confidence level again. Results are shown in Table 7.
| Study | Group | Before | After |
|---|---|---|---|
| Crowd (R2) | G1 | 3.89 0.89 | 3.82 0.98 |
| Crowd (R2) | G2 | 3.90 0.77 | 3.82 0.95 |
| Targeted | G1 | 3.48 0.71 | 3.45 0.85 |
| Targeted | G2 | 3.57 0.81 | 3.52 0.97 |
| Targeted | Domain Experts | 3.47 0.73 | 3.52 0.82 |
| Targeted | Data Scientists | 3.55 0.76 | 3.43 1.04 |
| Group 1 | Group 2 | p-value |
|---|---|---|
| Crowd R2 - G1 Initial | Targeted - G1 Initial | 0.001**** |
| Crowd R2 - G2 Initial | Targeted - G2 Initial | 0.001**** |
| Crowd R2 - G2 Initial | Targeted - G1 Initial | 0.001**** |
| Crowd R2 - G2 Initial | Targeted - G2 Initial | 0.001**** |
| Crowd R2 - G2 Initial | Targeted - G2 Final | 0.001**** |
| Crowd R2 - G1 Initial | Targeted - G1 Final | 0.001**** |
| Crowd R2 - G1 Initial | Targeted - G2 Final | 0.001**** |
| Crowd R2 - G2 Initial | Targeted - G1 Final | 0.001**** |
C.4. Decision-making style and emotional state results
During the survey we included two surveys to measure the current emotional state (e.g., joyful, sad, anger) and decision making style (e.g., rational, intuitive). We used VAS (Portela and Granell-canut, 2017) for the emotional state, and GDMS (Scott and Bruce, 1995) for the decision making style.
Results reflected in Table 8 are similar across subgroups. Common emotional states reported are joyful, relaxed, and energized. In general, intuitive and spontaneous decision making appears with higher levels than rational.
| Survey | Crowd. (R1) | Crowd. (R2) | Targeted | |||||
|---|---|---|---|---|---|---|---|---|
| GC | G1 | G2 | GC | G1 | G2 | G1 | G2 | |
| VAS | ||||||||
| Joy | 3.27 | 3.51 | 3.45 | 3.59 | 3.55 | 3.92 | 3.89 | 3.72 |
| Sad | 2.29 | 2.08 | 2.24 | 2.29 | 2.17 | 1.63 | 1.97 | 2.11 |
| Angry | 1.60 | 1.65 | 1.59 | 1.71 | 1.83 | 1.46 | 1.56 | 1.22 |
| Surprise | 1.75 | 1.77 | 1.86 | 1.71 | 1.86 | 2.13 | 1.72 | 2.06 |
| Relax | 3.79 | 3.59 | 3.74 | 3.47 | 3.55 | 3.94 | 3.33 | 3.50 |
| Energy | 2.94 | 3.05 | 2.80 | 2.88 | 3.09 | 3.32 | 3.31 | 3.00 |
| GDMS | ||||||||
| Rational | 0.61 | 0.61 | 0.64 | 0.63 | 0.60 | 0.62 | 0.58 | 0.59 |
| Intuitive | 0.72 | 0.72 | 0.71 | 0.72 | 0.75 | 0.74 | 0.71 | 0.68 |
| Dependent | 0.59 | 0.59 | 0.64 | 0.55 | 0.58 | 0.59 | 0.57 | 0.53 |
| Avoidant | 0.59 | 0.59 | 0.64 | 0.61 | 0.59 | 0.61 | 0.57 | 0.54 |
| Spontaneous | 0.68 | 0.69 | 0.71 | 0.68 | 0.69 | 0.71 | 0.71 | 0.70 |
C.5. RiskEval items considered as most important
As explained in subsection 6.2.1, the top items (features) selected as important for most participants tend to be the same (Figure 11). Targeted groups of data scientists and domain experts selected the same top five items, albeit in a different ordering, and their top items overlap to some extent with those of crowdsourced participants (Table 9).
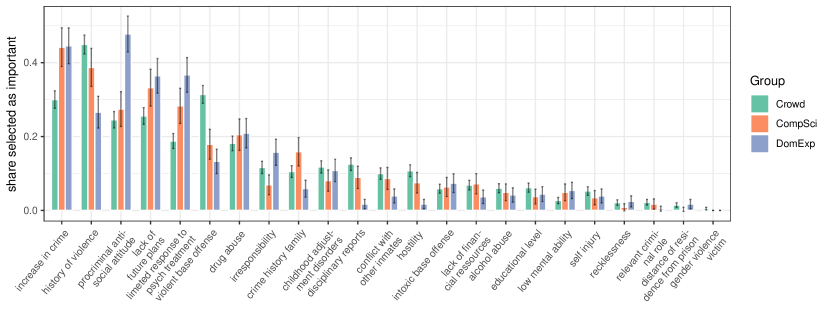
| Crowdsourced | Targeted: Data Science | Targeted: Domain Experts | |
|---|---|---|---|
| History of violence | Increase in frequency, severity and diversity of crimes | Pro criminal or antisocial attitude | |
| Violent base offense | History of violence | Increase in frequency, severity and diversity of crimes | |
| Increase in frequency, severity and diversity of crimes | Lack of viable plans for the future | Limited response to psychological/psychiatric treatment | |
| Lack of viable plans for the future | Limited response to psychological/psychiatric treatment | Lack of viable plans for the future | |
| Pro criminal or antisocial attitude | Pro criminal or antisocial attitude | History of violence |