Response of the Fe K line emission to the X-ray continuum variability in the changing-look active galactic nucleus NGC 1566
Abstract
NGC 1566 is a changing look AGN known to exhibit recurrent X-ray outbursts with each lasting for several years. The most recent X-ray outburst is observed on 2018, with a substantial increase of 2–10 keV flux by a factor of 24 than the historical minimum. We re-analyze the XMM-Newton and NuSTAR observations covering the pre-outburst, outburst and post-outburst epochs, and confirm the discovery of the broad feature in the 5–7 keV band during the period of outburst that could be interpreted as a relativistic Fe K emission line. Our analysis suggests that its flux has increased in tandem with the 2–10 keV continuum, making it the second changing look AGN in which the broad Fe K line responds to the X-ray continuum variability. This behavior strongly supports the idea that X-rays originates in a corona above the accretion disk, and disk reflection produces the relativistic Fe K line. In addition, we find the response of narrow Fe K emission line to the changes in the X-ray continuum on a time-scale as short as four months, allowing to put the location of line-emitting region at 0.1 pc, comparable to the size of optical BLR. By comparing to the changing look AGN NGC 2992, the Fe K variation rate (the ratio of Fe K variation to luminosity variation) in NGC 1566 appears greater, which could be possibly explained by larger amount of gas or Fe abundance responsible for producing the Fe K line for the latter. The strength of variable broad Fe K line as well as the soft X-ray excess emission appears to be correlated with the accretion rate, which could be explained as due to the state transition associated with the changing-look phenomenon.
Keywords:
galaxies:active–galaxies:Seyfert–line:profiles–X-ray:individual (NGC 1566)1 Introduction
The relativistic Fe K emission line in Active Galactic Nuclei (AGNs) is believed to originate from the innermost region of accretion disk by reflecting the illuminating X-ray continuum, for which the line profile is significantly broadened and skewed towards lower energies due to the relativistic Doppler effect and strong gravitational redshift (e.g., Fabian et al. 1989; Laor 1991). Therefore, proper modeling the Fe K line profile allows for constraining the inclination angle of the disk, the emissivity of the disk and its ionization state, as well as the spin of the supermassive black hole (SMBH) (e.g., Nandra et al. 2007; de La Calle Pérez et al. 2010; Patrick et al. 2012; Reynolds 2014; Tan et al. 2012). While there are plenty of studies investigating the broad Fe K component by modeling of the time-averaged spectrum in literature (see the reviews by Fabian et al. 2000; Miller 2007; Reynolds 2021), spectral studies on the long-term variability of the broad Fe K line on timescale of years are relatively limited (e.g., Iwasawa et al. 2004; Petrucci et al. 2007; de Marco et al. 2009; Nardini et al. 2016; Marinucci et al. 2020). In principle, the variability of the line profile, especially its relation to the variability of the continuum, can provide critical information on the accretion disk and black hole parameters in more model-independent ways (Turner et al. 2006; Tombesi et al. 2007; Marinucci et al. 2018). On shorter timescale of minutes, X-ray reverberation mapping has been proven possible and provided a dynamic view of the inner accretion region (e.g., Zoghbi et al. 2010; Parker et al. 2014; Alston et al. 2020; Wilkins et al. 2021). Kara et al. (2016) presented a statistical study of X-ray time lags in a sample of 43 Seyfert galaxies, and found that approximately 50 per cent of sources exhibit Fe K reverberation in which the X-ray emission in Fe K band (6-7 keV) responds to rapid variability in the continuum. While the Fe K reverberation is powerful to spatially map the geometry of the inner accretion flow, only the time-lag information of emission between different bands can be obtained.
On longer timescales of days to years, very few sources have been reported in which the variability behavior of the broad Fe K line relative to the X-ray continuum has been investigated, e.g., MCG-6-30-15 (Ballantyne & Ross 2002; Marinucci et al. 2014), NGC 4051 (Wang et al. 1999; Ponti et al. 2006), 1H 0707-495 (Fabian et al. 2004, 2012), IRAS 13224-3809 (Fabian et al. 2013; Jiang et al. 2018) and NGC 2992 (Murphy et al. 2007). Among them, NGC 2992 is the only source which shows the unambiguous evidence that the broad Fe K line flux is responding to the long-term continuum variation over decades (Shu et al. 2010a; Marinucci et al. 2018, 2020). In some AGNs, the disk reflection component and the broad Fe K line (if present) are found to vary with much smaller amplitude than the continuum (Markowitz et al. 2003), which can be interpreted in the context of the light-bending model. In such a model, physical motion of the X-ray source causes variability in the X-ray continuum but the illumination of the disk (and therefore the Fe K line flux) can remain relatively unaffected in some regimes (Fabian et al. 2004; Miniutti & Fabian 2004). The observation of broad Fe K variability in response to the large-amplitude continuum variability in NGC 2992 suggests that the light-bending scenario may not be relevant for at least this AGN. The mechanisms that cause large-amplitude X-ray continuum variability in AGNs remains further explored.
The time-domain spectral observations have revealed a class of AGNs which can change their types on time scales of years, characterized by transient emergence or disappearance of broad emission lines (e.g., Shappee et al. 2014; LaMassa et al. 2015; MacLeod et al. 2016). These objects are so-called changing-look (CL) AGNs. Follow-up studies of these systems suggested that a dramatic change in the accretion rate, rather than change in the obscuration, is the most likely explanation of their spectral transitions (Runnoe et al. 2016; Sheng et al. 2017). Large amplitude X-ray variability has also been observed to correlate with the CL phenomenon (Denney et al. 2014; Husemann et al. 2016; Mathur et al. 2018; Guolo et al. 2021). In this case, the accretion disk can be subject to large variability in illumination by the X-ray continuum and therefore produces an variable Fe K emission, providing us with a unique testbed to study the response of the broad Fe K emission line to the changes in the X-ray continuum.
![[Uncaptioned image]](/html/2201.11050/assets/x1.png)
NGC 1566 is a nearby AGN at a redshift 0.00502 (Koribalski et al. 2004). Oknyansky et al. (2019) classified it as a new CL AGN based on the type changes in optical spectra and flux variations in the past few decades. In the X-ray band, the studies before 2013 mainly focused on the spectral properties below 6 keV (Elvis et al. 1990; Baribaud et al. 1992). Kawamuro et al. (2013) performed the first broadband X-ray spectral analysis based on the data taken with Suzaku and Swift/BAT. There is a strong narrow Fe K line component (EW 240 eV) in the broadband spectra, but no obvious broad Fe K line (EW 32 eV) emission is detected. Since its discovery as a CL AGN, Oknyansky et al. (2019) reported the huge UV/optical outbursts from the coincident Swift observations. More importantly, the X-ray continuum flux increased by nearly 50 times from the lowest state in 2014 to the highest state recorded in July 2018. The quasi-simultaneous XMM-Newton and NuSTAR observations have revealed complex components in the X-ray spectrum (Parker et al. 2019), including a strong and variable soft excess, warm absorption, Compton hump and reflection components, and Fe K emission. Jana et al. (2021) suggested that the increase in the accretion rate is responsible for the sudden rise in luminosity, and NGC 1566 might harbour a pair of merging supermassive black holes. Although the broadband spectral properties have been investigated in previous works (Parker et al. 2019; Jana et al. 2021), to the best of our knowledge no study has yet explored the link of the variability of Fe K line with the X-ray continuum, nor attempted to investigate in detail the behaviour of Fe K line variability by decomposing it into broad and narrow components. These are our goals in this paper. According to the criteria proposed by Shu et al. (2010a), NGC 1566 may represent one of few AGNs with large accretion rate change, in which the Fe K line emission in response to the large amplitude continuum variability can be studied, thanks to its identification as a new CL AGN with intensive multi-wavelength outbursts. The paper is organized as follows. In Section 2 we describe the observations and data reduction. In Section 3, we present the X-ray spectral analysis and the detailed results of the Fe K line variability by comparing the data between different X-ray states. In Section 4, we discuss some general implications of our findings and present our conclusions.
2 Observations and Data Reduction
In order to investigate the broad Fe K line and its variability behaviors, sensitive X-ray observations are required to obtain time-sliced spectra with sufficient signal-to-noise ratio. This is crucial to detect the broad Fe K line and constrain the line profile parameters with sufficient accuracy. Although NGC 1566 has been observed intensively by Swift/XRT, in this paper we focus mainly on the data taken from the XMM-Newton observations, and quasi-simultaneous NuSTAR observations if available. Details of the XMM-Newton and NuSTAR observations are presented in Table 1. As shown in Figure 1, there are four XMM-Newton observations, which cover the periods of X-ray low state, outburst state and decline state111There are totally five archival XMM-Newton observations, but only four have sufficient spectral quality to perform the analysis of Fe K line emission. . Therefore, the observations are suitable for our study.
| Missiona | Obs No. | ObsID | Obs Dateb | Exposure |
|---|---|---|---|---|
| XMM | Obs-1 | 0763500201 | 2015-11-05 | 91.9ks |
| XMM | Obs-2 | 0800840201 | 2018-06-26 | 94.2ks |
| XMM | Obs-3 | 0820530401 | 2018-10-04 | 108ks |
| XMM | Obs-4 | 0840800401 | 2019-06-05 | 94.0ks |
| Nu | Obs-1 | 80301601002 | 2018-06-26 | 56.84ks |
| Nu | Obs-2 | 80401601002 | 2018-10-04 | 75.4ks |
![[Uncaptioned image]](/html/2201.11050/assets/x2.png)
2.1 XMM-Newton
We reduced the data from XMM-Newton observations following the standard procedures using the XMM-Newton Science Analysis System (SAS) v18.0.0. For the raw event files of EPIC pn and MOS detectors, we produced clean event files by using EPCHAIN and EMCHAIN respectively. Science products were then produced using XMMSELECT. The source spectra were extracted from a circular region with radius centered on the source position and the extent of pile-up effect was assessed by using the SAS task epateplot. We found that the last three observations from both XMM-Newton EPIC pn and MOS data at the core of the point-spread function for NGC 1566 were affected by photon pile-up.
We then used epatplot to compare the spectra of the last three observations that were extracted in annular regions with different inner radius, while the outer radius was fixed at . Therefore, by effectively mitigating the pile-up effect, the extraction region of the source spectrum is: circle (), annuli (-), annuli (-), annuli (-) for Obs-1, Obs-2, Obs-3, Obs-4, respectively. The background was extracted from two circular regions of blank sky on the same detector for pn, while it was from four circular regions for MOS detector, with each circle having a radius of . Instrumental response files were generated with RMFGEN and ARFGEN for each detector. After performing the spectral extraction separately for MOS1 and MOS2, we combined the data into a single spectrum using ADDASCASPEC. Figure 2 shows the comparison of pn spectrum observed at different epochs.
2.2 NuSTAR
The NuSTAR data were processed using v.1.6.0 of the NuSTARDAS pipeline with CALDB v20160303. For each observation, we extracted source counts from a circular region with radius centered on the source position, and background counts from a source-free circular region with a radius of on the same chip. The spectra were generated using the NUPRODUCTS task and grouped to have at least 40 counts in each bin for following spectral analysis.
3 Spectral Analysis
3.1 Preliminary Spectral Fitting
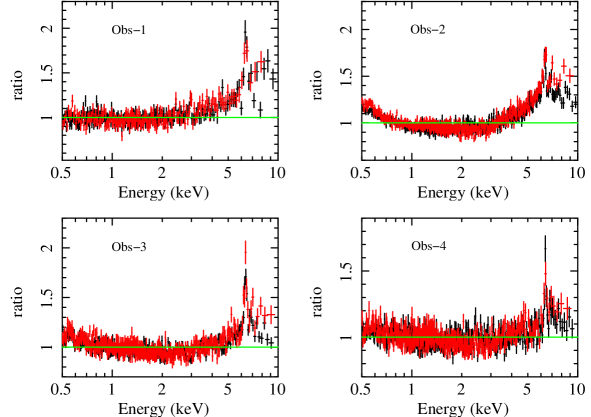
In order to characterize the main spectral components of the X-ray spectra, we first fitted the four XMM-Newton pn spectra between 0.5-10.0 keV using the spectral fitting software XSPEC (Version 12.11.1, Arnaud 1996), by adopting a simple absorbed power-law model with the photon index allowed to float. We grouped the spectra to have at least 40 counts in each bin so as to adopt the statistic for the spectral fits. The Galactic column density at is fixed during all the model fitting processes. All statistical errors of spectral model parameters are reported at the confidence 90 for one parameter (). We will give spectral parameters and statistical errors below, when the complete fitting results to the data are obtained. As shown in Figure 3, the ratios of the data to model show that the spectra display a variable soft X-ray excess below 2 keV which strongest in strength during the second XMM-Newton observation (2018 Jun 26). Meanwhile there is also a considerable curvature in the spectrum between 4-8 keV. We know from previous observations of NGC 1566 that the residuals in the range of 4-8 keV can be interpreted as the prominent Fe K line emission(Kawamuro et al. 2013; Parker et al. 2019). Figure 3 also shows the ratio of the summed MOS1 and MOS2 data to the same model. It can be seen that the MOS data are consistent with the pn data within the statistical errors, though there is a small discrepancy between the MOS and pn at high energies in Obs-2 and Obs-3. This is possibly due to the imperfect correction for the effects of pile-up, as the effects are worse for the MOS than the pn. Since we used principally the pn data, which have much higher sensitivity, such effects on the MOS data would not affect the following spectral analysis.
3.2 Baseline Model
Next, we performed more detailed spectral fittings, in order to investigate the Fe K line complex in detail. As shown in Figure 3(a), the data to model ratio from a simple absorbed powerlaw model suggests an excess emission towards higher energies, which is likely due to the reflection component (e.g., Fabian & Ross 2010). We added a standard reflection model (pexrav in XSPEC, (Arnaud 1996)) to account for the Compton reflection emission in the XMM-Newton data (Magdziarz & Zdziarski 1995). Although the effective energy band of XMM-Newton (0.2-10.0 keV) does not constrain the reflection component well, it may have effect on the modelling of the Fe K emission lines. pexrav model calculates the reflected spectrum produced by an X-ray source illuminated onto an optically-thick neutral disk. During the spectral fittings, all model parameters were fixed to their canonical values except the reflection fraction (), which defines the strength of the reflection component relative to that expected from a slab subtending 2 solid angle. The reflection continuum in our baseline model is only an empirical parameter, as the pexrav model ignores fluorescence and the geometry is limited to a planar disk. In Section 3.4, we will present a more self-consistent modeling of the refection component as well as the Fe K emission lines.
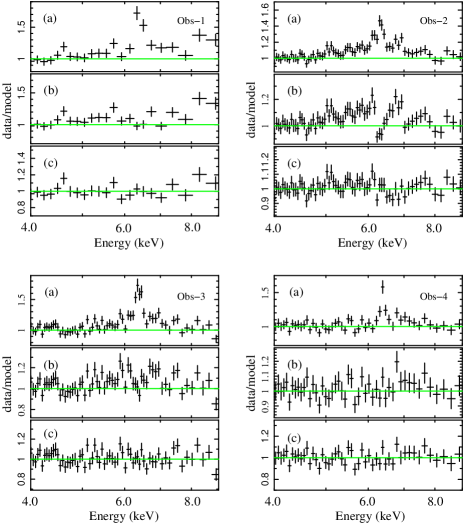
In addition to the reflection model, we added another power-law component to account for the variable soft X-ray excess emission for the last three XMM-Newton observations. Figure 4 (a) shows the ratio of data to model between 4-9 keV. If the data in the 5.0-7.5 keV band were ignored, where the Fe K line profile would dominate, the fitting results are acceptable for the four observations with , , , and , respectively. However, the fittings become poorer when the data in the 5.0-7.5 keV band were noticed (, , , ). This indicates the presence of excess emission the Fe K band. Then we added two Gaussian components to account for narrow Fe K and Fe K line emission from the distant matter, which is ubiquitous in the X-ray spectra of AGNs (e.g., Shu et al. 2010b, 2011). We tied the intrinsic line width of Fe K for Fe K and fixed it at 5 eV, which is unresolved with XMM-Newton (150 eV at 6 keV). The centroid energy and the intensity of Fe K were allowed to vary. The Fe K line energy was fixed at 7.058 keV with the line flux equal to 13.5 of the Fe K as expected for neutral Fe (Kallman et al. 2004). The overall fit results of the four observations have been significantly improved (101.5, 117.81, 158.34 and 54, respectively) for two extra free parameters.
| Observation Date | 2015-11-05 | 2018-06-26 | 2018-10-04 | 2019-06-05 |
|---|---|---|---|---|
| Parameters | value | |||
| /d.o.f | 166/197 | 450/430 | 448/394 | 350.4/345 |
| power-law, | …… | |||
| pexrav, | ||||
| Reflection fraction, R | ||||
| Inner radius of disk, | 6.86 | |||
| (degrees) | ||||
| ) | ||||
| 0.15 | 5.31 | 1.00 | 0.61 | |
| 0.25 | 5.99 | 1.71 | 1.14 | |
| 0.084 | 2.96 | 0.56 | 0.34 | |
| 0.138 | 3.33 | 0.95 | 0.64 |
-
1
Notes: Statistical errors and upper limits correspond to 90 confidence for one interesting parameter (= 2.706). f The parameter was frozen to its most probable value as it can not be constrained in the spectral fittings. aObserved-frame fluxes, not corrected for Galactic and intrinsic absorption. bIntrinsic, rest-frame luminosities, corrected for all absorption components.
Figure 4 (b) shows that there is still some residual emission in the Fe K band, even if we have added two Gaussian lines to fit the narrow Fe K and Fe K lines, revealing that the spectral fittings should take into account the broader component. The broader component could be the relativistic Fe K line originating from the line radiation in the inner area of the accretion disk. Alternatively, other factors can also lead to similar excess emission, such as complex absorption with different ionization states (e.g., Miller et al. 2009; Patrick et al. 2012). Considering the data quality of XMM-Newton and the fact that NGC 1566 is a bare AGN with little absorption along the line of sight (Reunanen et al. 2002; Kawamuro et al. 2013), the excess emission is unlikely to be caused by the complex absorption, and likely related to the relativistic Fe K line component.
Therefore, we added a disk line (diskline model in XSPEC) to account for the broad Fe K emission line from the relativistic accretion disk around a Schwarzschild black hole (see Fabian et al. 1989). The model consists of six free parameters: the line energy , the power-law index of the line emissivity , the inner and outer radius ( and , in units of ), the inclination angle between the normal direction of the disc and the observer (), and the integrated intensity of the line (). As did in Shu et al. (2010a), we fixed the at 6.4 keV in the rest frame, the emissivity at , and the outer radius at 1000. Considering that the broad Fe K line originates from the inner region of the accretion disk, we set the inner radius as a free parameter. The inclination () and line intensity () were also allowed to vary in the fittings. For consistence, we included an Fe K component without any additional free parameters, and assume the same ratio as the Fe of the narrow Fe K line. If the ionization degree of Fe is less than FeXVII, Fe K will be produced (e.g., Shu et al. 2010a). Note that we fixed the inclination and/or inner radius of the Obs-1 and the Obs-4 at the mean value from the best-fit parameters of Obs-2 and Obs-3, because the broad Fe K line emission becomes relatively weak in the lower states, hence the above parameters cannot be well constrained. In summary, our baseline model can be written as:
constant*wabs*(pexrav+zgauss+zgauss+diskline+disk
-line) (for Obs-1)
constant*wabs*(pexrav+zpowerlaw+zgauss+zgauss+d
-iskline+diskline) (for Obs-2, 3 and 4)
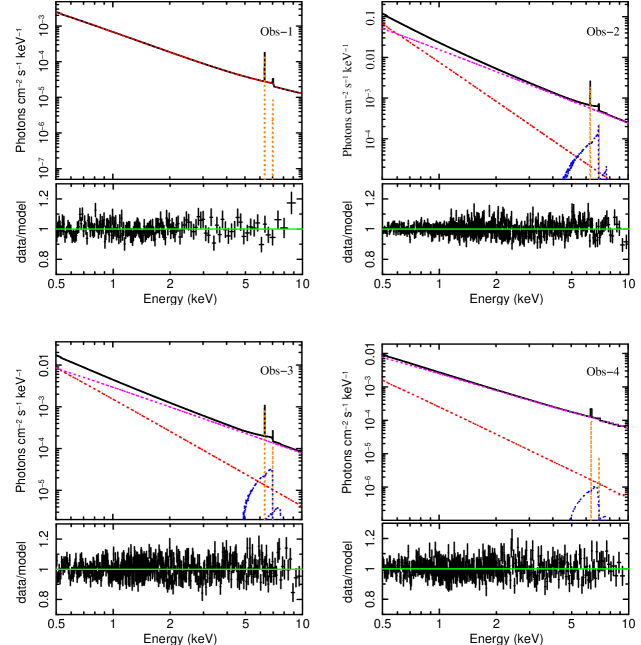
The best-fitting parameters and their statistical errors are shown in Table 2, and will be discussed in detail in the following Section. Note that for XMM Obs-4, the photon index for the hard X-ray powerlaw component becomes extremely flat () when the extra powerlaw component is added to account for the soft-excess emission. Such a flat photon index appears not physical as it is not confirmed by the NuSTAR data (Section 3.4), and likely caused by the model degeneracy between the two powerlaw components. Therefore, in our baseline model for Obs-4, we fixed the hard X-ray powerlaw component at , the best-fit value from the NuSTAR observations (Table 3). Figure 5 shows the best-fitting baseline models for the four XMM-Newton observations, along with the data to model residuals. The data/model residuals for the same model are also shown in Figure 4 (c) for just the 4-9 keV band in order to display the Fe K region more clearly.
3.3 Broad versus Narrow Fe K Line
![[Uncaptioned image]](/html/2201.11050/assets/x6.png)
Following the work of Shu et al. (2010a), we also investigated the extent to which the broad Fe K disk-line component and the narrow, distant-matter Fe K line may be decoupled based on the best-fitting models (see Figure 5) for the four XMM-Newton observations. Figure 3.3 shows the contour plots between the narrow-line intensity ( ) and the disk-line intensity (). The line from inside to outside represents 68, 90, and 99 confidence level, respectively. It can see that the narrow Fe K line intensity in all the XMM-Newton observations is required to be non-zero at a high level of significance. Notably, in the context of the baseline model fitted here, the narrow K line intensity in the highest X-ray state appears to increase by a factor of 9 relative to that in the lowest state. The relativistic broad Fe K line is also stronger in the high state. Although the broad Fe K line was significantly detected () in only two XMM-Newton observations (Obs-2 and Obs-3), their 99% confidence contours are mutually exclusive, indicating a strong variability of the broad Fe K line component as well. For the remaining two observations, the broad Fe K intensity could be formally be zero at a 99 confidence level. Taking into account the 99% upper limit on the broad Fe K intensity, the variability might be even larger. Before the X-ray outburst, NGC 1566 has also been observed by Suzaku on May 2012 when the X-ray continuum was in a historical low-flux state (Figure 1). While the Suzaku data gave sensitive measurements of the narrow Fe K flux, the broad Fe K component was not significant detected at 90% confidence (Kawamuro et al. 2013). The red dot in Figure 3.3 represents narrow and broad Fe K flux constrained by the Suzaku data, which are consistent with our measurements within the statistical errors from Obs-1 which was in the similar low-flux state.
From the baseline model, we could not place constraint on the inner radius() for the broad Fe K line emission. Only the upper limit can be obtained as shown in Table 2. With two XMM-Newton observations in which the relativistic Fe K line was detected, the inclination angles () for the accretion disk can be tightly constrained with a value of deg and deg, respectively. Next, we investigated the sensitivity of the broad Fe K line flux in the XMM-Newton data to the Compton-reflection continuum. The XMM-Newton data did not constrain the reflection component well except for the first observation (), and only the upper limit on the strength of the reflection component can be obtained for the other three observations when the X-ray continuum was higher (see Table 2). This would be expected since the XMM-Newton data cover only a small portion of the Compton reflection continuum. In the next Section, we will present a joint fit to the XMM-Newton and NuSTAR spectra. This is important in view of the extended sensitivity to higher energies provided by NuSTAR ((3–80 keV, Harrison et al. 2013), which allows us to put better constraint on the baseline model as well as the Compton reflection continuum.
| Observation Date | 2018-06-56 | 2018-10-04 | |
| Comp | Parameter | Value | Value |
| relxill | |||
| xillver | |||
| const | |||
| 2.61 | 0.776 | ||
| /d.o.f | 1195/1148 | 774/772 |
-
1
Notes:Statistical errors and upper limits correspond to 90 confidence for one interesting parameter (= 2.706). Frozen parameters are indicated by “(f)”. a Intrinsic, rest-frame luminosities, corrected for all absorption components.
3.4 Constraint on the Reflection Spectrum by Including the NuSTAR Data
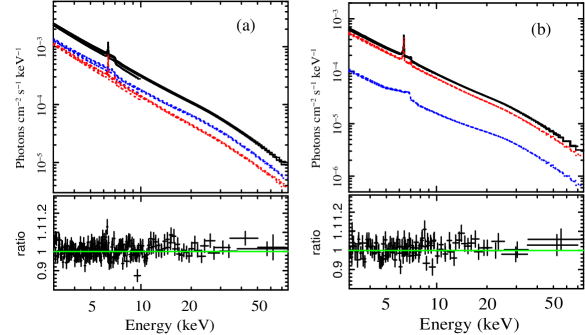
Under the assumption that both the broad Fe K line and the reflection continuum originate from reprocessing the same intrinsic X-ray continuum, a change in the Fe K line flux should be accompanied by a corresponding change in the Compton reflection continuum. In this Section, we performed joint spectral fittings to the XMM-Newton data (Obs-2 and Obs-3) and quasi-simultaneous NuSTAR data. We have applied the relxill model (García et al. 2013) that is capable to calculate the disk reflection continuum and the associated relativistic Fe K emission lines self-consistently. To model the distant reflection emission and the associated narrow component of Fe K line, we have applied the xillver model (without relativistic effect) (Dauser et al. 2014; García et al. 2014) independently. The parameters of xillver were tied to those of relxill, except for the flux normalization. We fixed the disk emissivity index, , the value typical for a Shakura-Sunyaev disk (Laor 1991; Dauser et al. 2013). The black hole spin was fixed at the default value of 0.998 (the maximum spin parameter) as it cannot be well constrained 222When the black hole spin was allowed to vary in the fittings, it always approached to the value of 0.998.. The outer disk radius , was fixed at the default model value of 400 ( is the gravitational radius), and the inclination was fixed at the best-fit value derived from the phenomenological model, . The free model parameters are the power-law index, , and the high energy cutoff, , the inner disk radius , the ionization parameter, , the iron abundance, , and the reflection fraction, . The model, constant*wabs*(relxill+xillver), describes the data well, leaving no systematic data/model residuals with = 1195/1148 and = 774/772, for Obs-2 and Obs-3, respectively (see Figure 7). This suggests the fits are as good as the previous spectral fits with the baseline model (Section 3.2). The best fitting parameters are listed in the Table 3.
We obtained and for the power-law photon index for Obs-2 and Obs-3, respectively, indicating a flattening of intrinsic continuum as the flux decreases. The high energy cutoff () is consistent with each other, which was measured to be keV and keV for the two observations. For the ionization parameters of the accretion disk in the two observations, only upper limit can be obtained, with log()1.44 and log()2.03, indicating a low to medium ionization disk. The Fe element abundance() in the accretion disk material and the inclination of the disk also play an important role in describing the reflection spectrum of type I AGNs (Crummy et al. 2006; García et al. 2014). In our study, the inferred Fe abundance is consistent with each other between the two observations. The reflection fraction was well constrained with and , respectively, which is consistent with the result of Kawamuro et al. (2013) (=). This suggests that only a small amount of continuum flux illuminates accretion disk, explaining the low-to-medium ionization state of the disk. These values are consistent with that obtained in other AGNs (Marinucci et al. 2019; Ghosh & Laha 2020). We could only obtain loose constraints of for Obs-2 (June 2018), and = for Obs-3 (Oct 2018). By constructing the contour plot between the inner radius () and the normalization of relxill model, we found that the 99% confidence contours for the inner disk radius cannot be constrained. At only 68% confidence, the contours are mutually exclusive between the two observations, suggesting that the variation is not significant.
Finally, we also investigated whether the relativistic reflection spectrum (continuum plus broad Fe K line) and distant reflection spectrum (continuum plus narrow Fe K line) are both following the change in continuum flux between the two XMM-Newton observations. We found that the flux of the relativistic reflection component has decreased from to , while distant reflection component has decreased from to . Considering the decrease in the continuum luminosity from to between the two XMM-Newton observations, both data sets are indeed consistent with the reflection spectra that followed the intrinsic continuum variability.
![[Uncaptioned image]](/html/2201.11050/assets/x8.png)
4 Discussion
4.1 Response of the Fe K emission to the long-term X-ray continuum variability
As shown in Figure 3.3, the intensity of broad and narrow Fe K components in NGC 1566 appears to change between different epochs. In this section, we will investigate in detail the relation of the Fe K line variability with the continuum. Figure 3.4 (a) shows the relation between the FWHM of Fe K line derived from the spectral fittings with a single Gaussian model and the 2–10 keV luminosity. It can be seen that at erg s-1 the FWHM of Fe K line cannot be measured with an 90% upper limit of 10000 km s-1, while the FWHM reaches 0.3 c when the X-ray luminosity increased to erg s-1, indicating that the responsivity and/or structure of inner disk may have changed during the period of X-ray outburst. Figure 3.4 (b) shows that the EW of relativistic Fe K line component is also correlated with the X-ray luminosity. By fitting the XMM-Newton and NuSTAR data with the reflection model relxill, we found that the reflection fraction and is consistent with each other within errors between the two-epoch observations despite the 3–10 keV flux varies by a factor of 3 (Section 3.4). This is in contrast to other AGNs where the reflection fraction has an inverse relation with the hard X-ray flux, which could be potentially explained by the light-bending effects (Parker et al. 2014; Jiang et al. 2018). In the lamp post geometry for the X-ray source, the lack of change in the reflection fraction in NGC 1566 suggests that the coronal height may have not changed during the period of X-ray outburst. The large amplitude X-ray variability is likely intrinsic, possibly caused by large change in the mass accretion rate, and the light-bending scenario appears not relevant for this AGN. Note that besides NGC 1566, the only AGN that has been reported on the response of the broad Fe K to continuum variations is NGC 2992 (Shu et al. 2010a; Marinucci et al. 2020), which also displays the luminosity-dependent spectral CL phenomenon (Guolo et al. 2021).
In Figure 4.1 (a), we plot the intensity of relativistic Fe K line versus the 2–10 keV continuum luminosity observed at different epochs. NGC 1566 is shown with red circles, while black circles represent NGC 2992 for comparison. We adopted the power-law function to analyze the emission line response to the change of continuum: , where is the power-law slope and is the intercept. The best-fitted slope is and for NGC 1566 and NGC 2992, respectively. Albeit with large errors, the variation rate of relativistic Fe K line (the ratio of Fe K variation to luminosity variation, characterized by the slope ) seems different between the two AGNs. At the same X-ray luminosity, the strength of relativistic Fe K line in NGC 1566 is larger than that in NGC 2992. This suggests the complex dependencies of the relativistic line emission on the geometry and physical properties of the line-emitting material. The behaviour could be possibly explained by larger amount of gas or Fe abundance responsible for producing the Fe K line in NGC 1566. Due to the lack of sensitive NuSTAR observations of NGC 2992 in the high state, we cannot constrain the Fe abundance from the X-ray spectral fittings, and hence test for the above latter scenario.
Interestingly, we found the same trend of narrow Fe K intensity in response to the continuum variation in NGC 1566, as shown in In Figure 4.1 (b). The best-fitted slope from the power-law function is . The narrow Fe K line intensity can change by a factor of 1.5 for the corresponding continuum variation within a time interval as short as four months. This allows us to put the material responsible for producing the narrow Fe K line at a distance scale to 0.1pc, comparable to the size of BLR which is 0.01pc inferred for NGC 1566 (Alloin et al. 1985; da Silva et al. 2017). The rapidly variable narrow Fe K line have also been reported in the AGN NGC 4151 (Zoghbi et al. 2019), which can be explained as originating from the inner BLR. Although the variale narrow Fe K line is detected in the AGN Mrk 841 (Petrucci et al. 2002), the X-ray continuum remains constant during observations, hence it may have a different origin from NGC 1566. On the other hand, we also found a relatively weaker response of the narrow Fe K line to the continuum variation in NGC 2992 (). Ghosh & Pal (2021) has suggested that the narrow Fe K line could originate from the reprocessor at a distance of 0.3–1.0 pc, consistent with that of torus reflection.
![[Uncaptioned image]](/html/2201.11050/assets/x9.png)
It is well known that the EW of the narrow Fe K line is anti-correlated with X-ray continuum luminosity for a sample of AGNs, so-called X-ray Baldwin Effect (e.g., Jiang et al. 2006; Bianchi et al. 2007; Shu et al. 2011). In Figure 4.1, we plot the X-ray observations of NGC 1566 and NGC 2992, and find a clear decrease in the narrow Fe K EW as the luminosity increases, with and , respectively. Therefore, the anti-correlation between EW and continuum luminosity is much stronger in NGC 2992. This result could be explained by the fact that the narrow Fe-K line emission in NGC 2992 originates from a region farther from the nucleus, so has a weaker response to the continuum variation within several years. By comparing with the AGN sample with the Chandra high-energy grating observations (Shu et al. 2010b), both NGC 1566 and NGC 2992 have steeper slope for the anti-correlation between EW and continuum luminosity, suggesting that the observed X-ray Baldwin Effect could partially be attributed to the intrinsic continuum variation in AGNs (e.g., Jiang et al. 2006; Shu et al. 2012). It should be noted that most previous studies on the X-ray Baldwin Effect did not perform the detailed deconvolution of the narrow and broad Fe K line component, so the results could be affected by the variability of underlying broad Fe K line if presents. X-ray monitoring observations of intensely varying AGNs, especially those CL AGNs, on timescales of days to years, are crucial to study the response of both the relativistic and narrow Fe K line emission to the changes in the X-ray continuum, which can provide new insight into the properties and origins of all of the Fe K emission line, as well as the circumnuclear structures for producing them.
![[Uncaptioned image]](/html/2201.11050/assets/x10.png)
4.2 Implications on the AGN state transition by the X-ray spectral variability
As shown in Figure 3, there is a variable soft X-ray excess emission (below keV) between the four XMM-Newton observations. If modelled by a power-law component, we obtained a photon index of in the highest state observed on June 2018. The strength of soft X-ray excess appears to be correlated with the X-ray continuum luminosity. The origin of soft X-ray excess is still a controversial topic. One popular possibility is that there are two Comptonizing regions. The Comptonization by an optically thick warm corona could account for, at least partially, the observed soft X-ray excess emission in AGNs (e.g., Done et al. 2012; Shu et al. 2017; Jin et al. 2021), and the Comptonization by high-temperature optically thin corona describes the standard X-ray power-law emission above 2 keV. In this model, the soft X-ray excess is related to the disk emission, so its strength can be powered by mass accretion. We calculated the Eddington ratio (=) for the four XMM-Newton observations using the luminosity in the 2-10 keV band and a black hole mass of (Woo & Urry 2002). A bolometric correction factor of 20 (Vasudevan et al. 2009) was assumed to extrapolate the X-ray luminosity to the bolometric luminosity. For Obs-1 and Obs-2, we obtained the same Eddington ratios as reported in Parker et al. (2019). To investigate the -dependence of the soft-excess emission, we quantified the strength of the soft excess as the ratio of flux at soft X-ray band () to the powerlaw extrapolation of hard X-ray component to the same band (). Since the soft excess emission is variable in flux, we parametrized the strength of the soft excess at three soft X-ray bands, namely, 0.5–1.0 keV, 0.5–1.5 keV and 0.5–2.0 keV, respectively.
Figure 4.2 (upper panel) displays the correlation of soft excess (/) with the Eddington ratios. It can be seen that the strength of soft X-ray excess is strongly dependent of Eddington ratio. At , there is no or little soft excess emission at energies below 2 keV. Conversely, soft excess emission is observed at all epochs when the accretion rate is across a critical value of . This could be explained as due to a state change associated with the spectroscopic changing-look phenomenon (Oknyansky et al. 2019, 2020), similar to that observed in CL AGN Mrk 1018 (Parker et al. 2019) and Mark 590 (Denney et al. 2014). Our results are broadly consistent with the recent study by Jana et al. (2021), confirming the variable soft excess emission and its dependence on the Eddington ratios. The observations of NGC 1566 seem to support the scenario proposed by Noda & Done (2018) that AGNs will likely experience changing-look phenomenon when their luminosity variations cross the state transition boundary of at a few percent.
![[Uncaptioned image]](/html/2201.11050/assets/x11.png)
Figure 4.2 (lower panel) shows that the intensity of the broad Fe K line is also dependent of Eddington ratio, if the bolometric luminosity can be traced by the X-ray luminosity. In the model of Noda & Done (2018), if AGNs cross a few per cent in their , they would show state transition due to disk evaporation/condensation associated with the decrease/increase in accretion rate. This appears similar to the soft-to-hard state transition in black hole binaries at , below which the inner disk could evaporate into an advection dominated accretion flow (Done et al. 2007). Indeed, evidence of disk truncation at low accretion states has been found with recent XMM and NuSTAR observations of black hole binaries (Xu et al. 2020a, b). In this context, an increase in the flux of broad Fe K line emission during the outburst of NGC 1566 could be explained by the condensation of the inner accretion disk and its intensified illumination by an X-ray corona. Unfortunately, we could only obtain loose constraints on the radius of inner disk () from spectral fittings (Section 3.4), hence only marginal evidence for the decrease in the inner disk during the outburst state could be inferred.
Finally, it should be noted that though variable soft X-ray excess has been observed in many CL AGNs, the observation of variable broad, relativistic Fe K line emission is rare. NGC 1566 and NGC 2992 are the two CL AGNs known so far in which broad Fe K line emission in response to large amplitude X-ray continuum variability is observed. The obscuration seems not be the reason for the non-detections of broad Fe K line in other CL AGNs, as NGC 2992 has shown variable absorption along the light of sight with cm-2 (Shu et al. 2010a). It is possible that EW of broad Fe K line is not large enough so that its contrast against the continuum is not high enough to constrain the line profiles (Giustini et al. 2017). In fact, it still remains unclear why only a faction of AGNs have shown broad Fe K line in their X-ray spectra, even with sufficient signal-to-noise ratio (e.g., Nandra et al. 2007; Mantovani et al. 2016). As shown in Appendix, we performed the time-lag analysis for NGC 1566, based on the lightcurve in Obs-2 which shows the source is variable on a time-scale as short as a few kilosecond. Although we found a hard lag at low-frequency which can be understood with the propagating fluctuations model, no reverberation signal is observed at higher frequency. Therefore, the Fe K reverberation commonly observed in AGNs may probe the disk reflection at much different time-scales from the long-term variability of relativistically broadened Fe K line emission in response to the continuum variations in NGC 1566. We propose that NGC 1566 and similar changing-look AGNs with both variable soft X-ray excess and broad Fe K line emission provide a unique laboratory to probe the central engine of AGN, and future X-ray monitoring observations with higher cadence are encouraged.
5 Acknowledgments
This research has made use of data obtained from XMM-Newton, an ESA science mission with instruments and contributions directly funded by ESA and NASA, and from the NuSTAR, a mission managed by the Jet Propulsion Laboratory, and funded by NASA. This research has made use of the HEASARC online data archive services, supported by NASA/GSFC. This work is supported by Chinese NSF through grant Nos. 11822301, 12192220, 12192221, 12033006, and 11833007.
References
- Alloin et al. (1985) Alloin, D., Pelat, D., Phillips, M., et al. 1985, ApJ, 288, 205.
- Alston et al. (2020) Alston, W. N., Fabian, A. C., Kara, E., et al. 2020, Nature Astronomy, 4, 597.
- Arnaud (1996) Arnaud, K. A. 1996, Astronomical Data Analysis Software and Systems V, 101, 17
- Baribaud et al. (1992) Baribaud, T., Alloin, D., Glass, I., et al. 1992, A&A, 256, 375
- Ballantyne & Ross (2002) Ballantyne, D. R. & Ross, R. R. 2002, MNRAS, 332, 777
- Bianchi et al. (2007) Bianchi, S., Guainazzi, M., Matt, G., et al. 2007, A&A, 467, L19
- Crummy et al. (2006) Crummy, J., Fabian, A. C., Gallo, L., et al. 2006, MNRAS, 365, 1067.
- da Silva et al. (2017) da Silva, P., Steiner, J. E., & Menezes, R. B. 2017, MNRAS, 470, 3850.
- de La Calle Pérez et al. (2010) de La Calle Pérez, I., Longinotti, A. L., Guainazzi, M., et al. 2010, A&A,, 524, A50
- de Marco et al. (2009) de Marco, B., Iwasawa, K., Cappi, M., et al. 2009, A&A, 507, 159.
- Dauser et al. (2013) Dauser, T., Garcia, J., Wilms, J., et al. 2013, MNRAS, 430, 1694.
- Dauser et al. (2014) Dauser, T., Garcia, J., Parker, M. L., et al. 2014, MNRAS, 444, L100.
- Denney et al. (2014) Denney, K. D., De Rosa, G., Croxall, K., et al. 2014, ApJ, 796, 134.
- Done et al. (2007) Done, C., Gierliński, M., & Kubota, A. 2007, A&A Rv., 15, 1
- Done et al. (2012) Done, C., Davis, S. W., Jin, C., et al. 2012, MNRAS, 420, 1848.
- Elvis et al. (1990) Elvis, M., Fassnacht, C., Wilson, A. S., et al. 1990, ApJ, 361, 459.
- Fabian et al. (1989) Fabian, A. C., Rees, M. J., Stella, L., et al. 1989, MNRAS, 238, 729.
- Fabian et al. (2000) Fabian, A. C., Iwasawa, K., Reynolds, C. S., et al. 2000, PASP, 112, 1145
- Fabian et al. (2004) Fabian, A. C., Miniutti, G., Gallo, L., et al. 2004, MNRAS, 353, 1071.
- Fabian & Ross (2010) Fabian, A. C. & Ross, R. R. 2010, SSR, 157, 167.
- Fabian et al. (2012) Fabian, A. C., Zoghbi, A., Wilkins, D., et al. 2012, MNRAS, 419, 116
- Fabian et al. (2013) Fabian, A. C., Kara, E., Walton, D. J., et al. 2013, MNRAS, 429, 2917.
- García et al. (2013) García, J., Dauser, T., Reynolds, C. S., et al. 2013, ApJ, 768, 146.
- García et al. (2014) García, J., Dauser, T., Lohfink, A., et al. 2014, ApJ, 782, 76.
- Ghosh & Laha (2020) Ghosh, R. & Laha, S. 2020, MNRAS, 497, 4213.
- Ghosh & Pal (2021) Ghosh, R. & Pal, M. 2021, Research Notes of the American Astronomical Society, 5, 35.
- Giustini et al. (2017) Giustini, M., Costantini, E., De Marco, B., et al. 2017, A&A, 597, A66.
- Guolo et al. (2021) Guolo, M., Ruschel-Dutra, D., Grupe, D., et al. 2021, MNRAS.
- Harrison et al. (2013) Harrison, F. A., Craig, W. W., Christensen, F. E., et al. 2013, MNRAS, 770, 103.
- Husemann et al. (2016) Husemann, B., Urrutia, T., Tremblay, G. R., et al. 2016, A&A, 593, L9.
- Iwasawa et al. (2004) Iwasawa, K., Miniutti, G., & Fabian, A. C. 2004, MNRAS, 355, 1073.
- Jana et al. (2021) Jana, A., Kumari, N., Nandi, P., et al. 2021, MNRAS, 507, 687.
- Jiang et al. (2006) Jiang, P., Wang, J. X., & Wang, T. G. 2006, ApJ, 644, 725.
- Jiang et al. (2018) Jiang, J., Parker, M. L., Fabian, A. C., et al. 2018, MNRAS, 477, 3711.
- Jin et al. (2021) Jin, C., Done, C., & Ward, M. 2021, MNRAS, 500, 2475.
- Kara et al. (2016) Kara, E., Alston, W. N., Fabian, A. C., et al. 2016, MNRAS, 462, 511.
- Kawamuro et al. (2013) Kawamuro, T., Ueda, Y., Tazaki, F., et al. 2013, ApJ, 770, 157.
- Kallman et al. (2004) Kallman, T. R., Palmeri, P., Bautista, M. A., et al. 2004, ApJS, 155, 675.
- Koribalski et al. (2004) Koribalski, B. S., Staveley-Smith, L., Kilborn, V. A., et al. 2004, AJ, 128, 16.
- Laor (1991) Laor, A. 1991, ApJ, 376, 90.
- LaMassa et al. (2015) LaMassa, S. M., Cales, S., Moran, E. C., et al. 2015, ApJ, 800, 144
- MacLeod et al. (2016) MacLeod, C. L., Ross, N. P., Lawrence, A., et al. 2016, MNRAS, 457, 389.
- Marinucci et al. (2014) Marinucci, A., Matt, G., Miniutti, G., et al. 2014, ApJ, 787, 83
- Marinucci et al. (2018) Marinucci, A., Bianchi, S., Braito, V., et al. 2018, MNRAS, 478, 5638.
- Marinucci et al. (2019) Marinucci, A., Porquet, D., Tamborra, F., et al. 2019, A&A, 623, A12.
- Marinucci et al. (2020) Marinucci, A., Bianchi, S., Braito, V., et al. 2020, MNRAS, 496, 3412.
- Magdziarz & Zdziarski (1995) Magdziarz, P. & Zdziarski, A. A. 1995, MNRAS, 273, 837.
- Mantovani et al. (2016) Mantovani, G., Nandra, K., & Ponti, G. 2016, MNRAS, 458, 4198.
- Markowitz et al. (2003) Markowitz, A., Edelson, R., & Vaughan, S. 2003, ApJ, 598, 935
- Mathur et al. (2018) Mathur, S., Denney, K. D., Gupta, A., et al. 2018, ApJ, 866, 123.
- Miller (2007) Miller, J. M. 2007, ARA&A, 45, 441
- Miller et al. (2009) Miller, L., Turner, T. J., & Reeves, J. N. 2009, MNRAS, 399, L69
- Miniutti & Fabian (2004) Miniutti, G. & Fabian, A. C. 2004, MNRAS, 349, 1435.
- Murphy et al. (2007) Murphy, K. D., Yaqoob, T., & Terashima, Y. 2007, ApJ, 666, 96.
- Nandra et al. (2007) Nandra, K., O’Neill, P. M., George, I. M., et al. 2007, MNRAS, 382, 194.
- Nardini et al. (2016) Nardini, E., Porquet, D., Reeves, J. N., et al. 2016, ApJ, 832, 45.
- Noda & Done (2018) Noda, H. & Done, C. 2018, MNRAS, 480, 3898.
- Nowak et al. (1999) Nowak, M. A., Vaughan, B. A., Wilms, J., et al. 1999, ApJ, 510, 874.
- Oknyansky et al. (2019) Oknyansky, V. L., Winkler, H., Tsygankov, S. S., et al. 2019, MNRAS, 483, 558.
- Oknyansky et al. (2020) Oknyansky, V. L., Winkler, H., Tsygankov, S. S., et al. 2020, MNRAS, 498, 718
- Parker et al. (2014) Parker, M. L., Wilkins, D. R., Fabian, A. C., et al. 2014, MNRAS, 443, 1723.
- Parker et al. (2019) Parker, M. L., Schartel, N., Grupe, D., et al. 2019, MNRAS, 483, L88.
- Patrick et al. (2012) Patrick, A. R., Reeves, J. N., Porquet, D., et al. 2012, MNRAS, 426, 2522.
- Petrucci et al. (2007) Petrucci, P. O., Ponti, G., Matt, G., et al. 2007, A&A, 470, 889.
- Petrucci et al. (2002) Petrucci, P. O., Henri, G., Maraschi, L., et al. 2002, A&A, 388, L5.
- Ponti et al. (2006) Ponti, G., Miniutti, G., Cappi, M., et al. 2006, MNRAS, 368, 903.
- Reunanen et al. (2002) Reunanen, J., Kotilainen, J. K., & Prieto, M. A. 2002, MNRAS, 331, 154.
- Reynolds (2014) Reynolds, C. S. 2014, Space Science Reviews, 183, 277
- Reynolds (2021) Reynolds, C. S. 2021, ARA&A, 59, 117
- Runnoe et al. (2016) Runnoe, J. C., Cales, S., Ruan, J. J., et al. 2016, MNRAS, 455, 1691
- Shappee et al. (2014) Shappee, B. J., Prieto, J. L., Grupe, D., et al. 2014, ApJ, 788, 48
- Sheng et al. (2017) Sheng, Z., Wang, T., Jiang, N., et al. 2017, ApJL, 846, L7.
- Shu et al. (2010a) Shu, X. W., Yaqoob, T., Murphy, K. D., et al. 2010a, ApJ, 713, 1256.
- Shu et al. (2010b) Shu, X. W., Yaqoob, T., & Wang, J. X. 2010b, ApJS, 187, 581.
- Shu et al. (2011) Shu, X. W., Yaqoob, T., & Wang, J. X. 2011, ApJ, 738, 147.
- Shu et al. (2012) Shu, X. W., Wang, J. X., Yaqoob, T., et al. 2012, ApJL, 744, L21.
- Shu et al. (2017) Shu, X. W., Wang, T. G., Jiang, N., et al. 2017, ApJ, 837, 3.
- Shu et al. (2018) Shu, X. W., Wang, S. S., Dou, L. M., et al. 2018, ApJL, 857, L16.
- Shu et al. (2020) Shu, X., Zhang, W., Li, S., et al. 2020, Nature Communications, 11, 5876.
- Tan et al. (2012) Tan, Y., Wang, J. X., Shu, X. W., et al. 2012, ApJL, 747, L11.
- Tombesi et al. (2007) Tombesi, F., de Marco, B., Iwasawa, K., et al. 2007, A&A, 467, 1057.
- Turner et al. (2006) Turner, T. J., Miller, L., George, I. M., et al. 2006, A&A, 445, 59.
- Uttley et al. (2014) Uttley, P., Cackett, E. M., Fabian, A. C., et al. 2014, aapr, 22, 72.
- Vasudevan et al. (2009) Vasudevan, R. V., Mushotzky, R. F., Winter, L. M., et al. 2009, MNRAS, 399, 1553.
- Wang et al. (1999) Wang, J. X., Zhou, Y. Y., Xu, H. G., et al. 1999, ApJL, 516, L65
- Wilkins et al. (2021) Wilkins, D. R., Gallo, L. C., Costantini, E., et al. 2021, Nature, 595, 657.
- Woo & Urry (2002) Woo, J.-H. & Urry, C. M. 2002, ApJ, 579, 530.
- Xu et al. (2020a) Xu, Y., Harrison, F. A., Tomsick, J. A., et al. 2020a, ApJ, 893, 30.
- Xu et al. (2020b) Xu, Y., Harrison, F. A., Tomsick, J. A., et al. 2020b, ApJ, 893, 42
- Yaqoob et al. (2007) Yaqoob, T., Murphy, K. D., Griffiths, R. E., et al. 2007, PASJ, 59, 283.
- Zoghbi et al. (2010) Zoghbi, A., Fabian, A. C., Uttley, P., et al. 2010, MNRAS, 401, 2419.
- Zoghbi et al. (2019) Zoghbi, A., Miller, J. M., & Cackett, E. 2019, ApJ, 884, 26.
6 Appendix
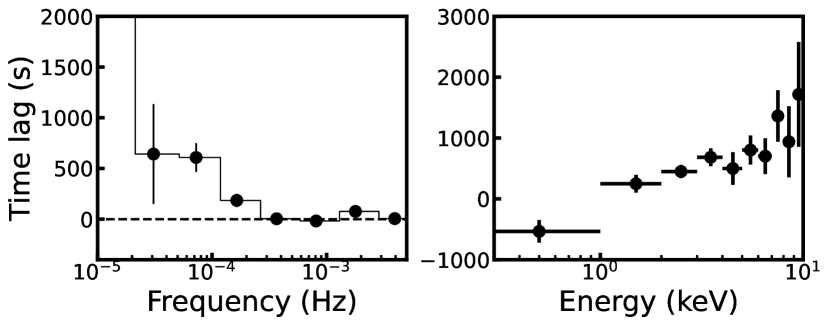
6.1 X-ray time lag analysis

Figure 12 shows the 0.3–10 keV light curve for the data taken from the four XMM-Newton observations. All the light curves were background-subtracted, using the same region as that to extract spectra, and then corrected for instrumental effects using the SAS tool epiclccorr. The data are grouped into bins with interval widths of 500s. The light curve shows variability by a factor of 2 with a time-scale of tens of kiloseconds. It can be seen that the source is relatively more variable during the period of outburst (XMM Obs-2) on a shorter time-scale of kiloseconds. Therefore, we used the lightcurve from Obs-2 to perform the Fourier time lag analysis, following the standard procedures (Uttley et al. 2014; Nowak et al. 1999). We first constructed the lag–frequency spectrum between 0.3–1 keV and 1-4 keV to search for characteristic frequency at which the time lag might be present. These two energy bands are chosen because the X-ray emission between 0.3-1 keV usually characterizes soft X-ray excess, while that at 1-4 keV is dominated by the harder power-law component. The result is shown in the left panel of Figure 13. We find a clear evidence of positive lags, i.e., the hard band emission lags behind the soft band emission below the frequency Hz. No negative lags at higher frequency were found which can trace the variability information on the inner region of accretion flows. In order to get a lag-energy spectrum, the light curves were constructed in ten energy bins between 0.3 and 10 keV with 1 keV bin width (0.3-1keV is used as one energy bin). The time lag was then computed for the light curve in each energy bin of interest relative to the reference light curve between 0.3–10 keV. The 0.3–10 keV light curve was used as a reference because it helps to maximize the signal to noise. In order to eliminate the correlated errors, we removed the band of interest from the reference band when computing the time lags. The resulting lag-energy spectrum is shown in right of panel of Figure 13. It can be seen that there is a hard lag that increases with increasing energy. Such a hard lag at low-frequency is commonly seen in Seyfert galaxies (Kara et al. 2016), which can be understood within the framework of the propagating fluctuations model. Therefore, our time lag analysis suggests no X-ray reverberation signal arising from gravitationally redshifted Fe K photons reflected off the inner accretion flow for NGC 1566.