Joint liver and hepatic lesion segmentation in MRI using a hybrid CNN with transformer layers
Abstract
Backgound and Objective: Deep learning-based segmentation of the liver and hepatic lesions therein steadily gains relevance in clinical practice due to the increasing incidence of liver cancer each year. Whereas various network variants with overall promising results in the field of medical image segmentation have been successfully developed over the last years, almost all of them struggle with the challenge of accurately segmenting hepatic lesions in magnetic resonance imaging (MRI). This led to the idea of combining elements of convolutional and transformer-based architectures to overcome the existing limitations. Methods: This work presents a hybrid network called SWTR-Unet, consisting of a pretrained ResNet, transformer blocks as well as a common Unet-style decoder path. This network was primarily applied to single-modality non-contrast-enhanced liver MRI and additionally to the publicly available computed tomography (CT) data of the liver tumor segmentation (LiTS) challenge to verify the applicability on other modalities. For a broader evaluation, multiple state-of-the-art networks were implemented and applied, ensuring a direct comparability. Furthermore, correlation analysis and an ablation study were carried out, to investigate various influencing factors on the segmentation accuracy of the presented method. Results: With Dice similarity scores of averaged for liver and lesion segmentation on the MRI dataset and and , respectively on the CT dataset, the proposed SWTR-Unet proved to be a precise approach for liver and hepatic lesion segmentation with state-of-the-art results for MRI and competing accuracy in CT imaging. Conclusion: The achieved segmentation accuracy was found to be on par with manually performed expert segmentations as indicated by inter-observer variabilities for liver lesion segmentation. In conclusion, the presented method could save valuable time and resources in clinical practice.
keywords:
\KWDdeep learning-based segmentation , liver and hepatic lesions , hybrid network architecture , segmentation, multimodal imaging data1 Introduction
Following cardiovascular diseases, cancer constitutes the second major cause of death, accounting for about 8.8 million deaths worldwide in 2015, with the liver being one of the most common sites for the development of primary and metastatic lesions [37]. Besides metastatic lesions, which often originate from primary breast, colon and pancreas cancer, the liver is also site of primary tumor development [14]. The Hepatocellular carcinoma (HCC) is among the most frequent tumor variants and causes the third-most cancer-related deaths worldwide with a growing incidence over the last decades [14]. In terms of diagnosis and therapy planning, medical imaging of the liver plays a vital role, either during the routinely performed tumor staging of primary lesions outside of the liver or if the clinical anamnesis points towards primary hepatic cancer diseases. For such imaging purposes, magnetic resonance imaging (MRI) and computed tomography (CT) are obligatory, each with its own benefits and disadvantages.
The precise identification and segmentation of hepatic lesions in medical imaging could support radiologists in tumor staging and therapy decision-making. In current clinical routine it is common that such segmentation procedures are performed manually, which represents the gold standard or semi-automatically with algorithmical support. Either way, both strategies and particularly manually contouring, are time-consuming, cumbersome, operator-dependent and subjective. Even more automated approaches, which have been developed in the past, require manual initialization and their segmentation accuracy often heavily rely on the precision of said initial user interactions. Despite that, it has been shown that precisely segmenting hepatic lesions is a highly challenging task on its own due to the vast variability of shape, texture, size, location and number of liver lesions per patient case [36]. The tissue image contrast between liver and lesion highly varies depending on the used acquisition protocols or the application of contrast-agents. Thus, it is hardly possible to define a model-based segmentation approach based on crafted features by a priori knowledge. Such approaches include graph cuts, level sets or clustering techniques, that have been applied almost exclusively to liver CT data [20, 19, 21]. With respect to the imaging modality, the same holds true for machine or deep learning-based methods, which were almost exclusively applied to liver CT images. Nevertheless, learning-based approaches seem to be the most promising strategy to deal with the sheer appearance variability of liver lesions [2]. In recent years various works focused on CT-based liver and liver lesion segmentation using fully convolutional neural networks (FCNN) [13, 18, 41], especially since the liver tumor segmentation (LiTS) challenge publicly provided patient CT scans, which are otherwise hard to compromise in reasonable numbers. In terms of MRI-based hepatic lesion segmentation, there currently are, to the best of the authors’ knowledge, only a few works of direct relevance, such as from [11], [3], [43] and [15]. [11] presented a fully automatic approach consisting of a cascaded convolutional neural network, that first segments the liver outline and subsequently the hepatic lesions within the resulting liver mask images. The two-step strategy was applied to both, liver CT and a few MR images [11]. [3] applied an U-net with post-processing to minimize the false positive rate to multiphasic contrast-enhanced MR images. [43] presented a united adversial learning framework for hepatic lesion segmentation and detection of multimodalty non-contrast-enhanced MRI. Their network consists of a multimodal feature extraction encoder of three parallel convolutional channels, each incorporating a specific MRI sequence, followed by a feature fusion and selection step, whereas the paths of both sub-tasks, i.e., segmentation and detection share coordinates. The results of both paths are subsequently fed into a multiphase radiomics guided discriminator to improve performance by adversial learning. [15] applied an anisotropic 3D Unet with multi-model training to contrast-enhanced liver MRI. In order to avoid unfavourable random weight initiations of the network, the multi-model approach started to train models in parallel, dismissing half of it according to the validation Jaccard scores after a fix number of iterations. Most of the above-mentioned works utilized convolutional neural networks (CNN) in some form, which proved to be superior to many methodological alternatives with respect to their representational performance. However, their ability to model long-range relations showed limitation due to the locality of convolutional operations [6]. This may be crucial when it comes to structures with high appearance variations like hepatic lesions. In that regard, techniques like attention mechanisms were introduced to support CNN-based architectures [29, 6] or widely replace convolutional blocks in form of transformer elements [5].
The aim of this work was to develop a fully automatic deep learning-based joint liver and hepatic lesion segmentation approach, which incorporates attention mechanisms to both, achieve expert-like segmentation accuracy and with applicability to clinical MRI and CT data. Furthermore, to ensure a more direct comparability of the proposed method with relevant works from the state of the art, multiple network variants were additionally implemented and tested on the same imaging data.
1.1 Related Work
CNN-based methods. In recent years, machine or deep learning-based approaches achieved vastly superior results in terms of medical image segmentation tasks, representing almost exclusively the state of the art in this field. Especially the introduction of the Unet [28] led to a dominance of U-shaped variants like ResUnet [29], DenseUnet [4] or nnUnet [18]. However, there were various works using an Unet-styled network as a basic architecture, whereas different adaptions were made to increase the performances of CNNs. For instance, sequential models were embedded as CNN bottlenecks [26, 27] to tackle imbalanced data sets or for joint detection and segmentation purposes.
CNNs with self-attention or transformer-based elements. In order to sufficiently capture global information and overcome the limitation of CNNs due to their intrinsic locality of convolutional operations, various self-attention mechanisms were introduced [38, 30]. Whereas these approaches widely follow the principal architecture of U-shaped CNNs, some works proposed to combine convolutional- with transformer-based elements more recently [6, 33]. Transformers were first introduced in the field of natural language processing and quickly established itself as a state-of-the-art approach [22]. Adaptions like sparse transformers [9] or local self-attention [25] enabled the applicability to computer vision tasks. So called vision transformers showed excellent results in image recognition tasks, but come with the cost of pretraining on large data sets on its own, before fine-tuning on domain-specific data, when compared to CNN-based approaches. However, multiple training strategies were proposed to exploit the benefits of ImageNet in that regard [32]. Such a pretrained transformer could be embedded within the encoder path of an U-net-styled architecture for medical image segmentation [6, 40]. Furthermore, SWIN transformers were introduced, which represent very efficient hierarchical vision transformers based on shifted window mechanisms [22]. Since SWIN transformers showed very promising results on multiple vision tasks including semantic segmentations, they were utilized as the basic unit in a purely transformer-based U-shaped network architecture called SWIN-Unet [5]. In contrast to the above-mentioned approaches, the presented work combines the most promising elements of CNNs and transformer-based self-attention mechanisms, resulting in a hybrid CNN-transformer-based architecture using SWIN transformer blocks.
2 Methods
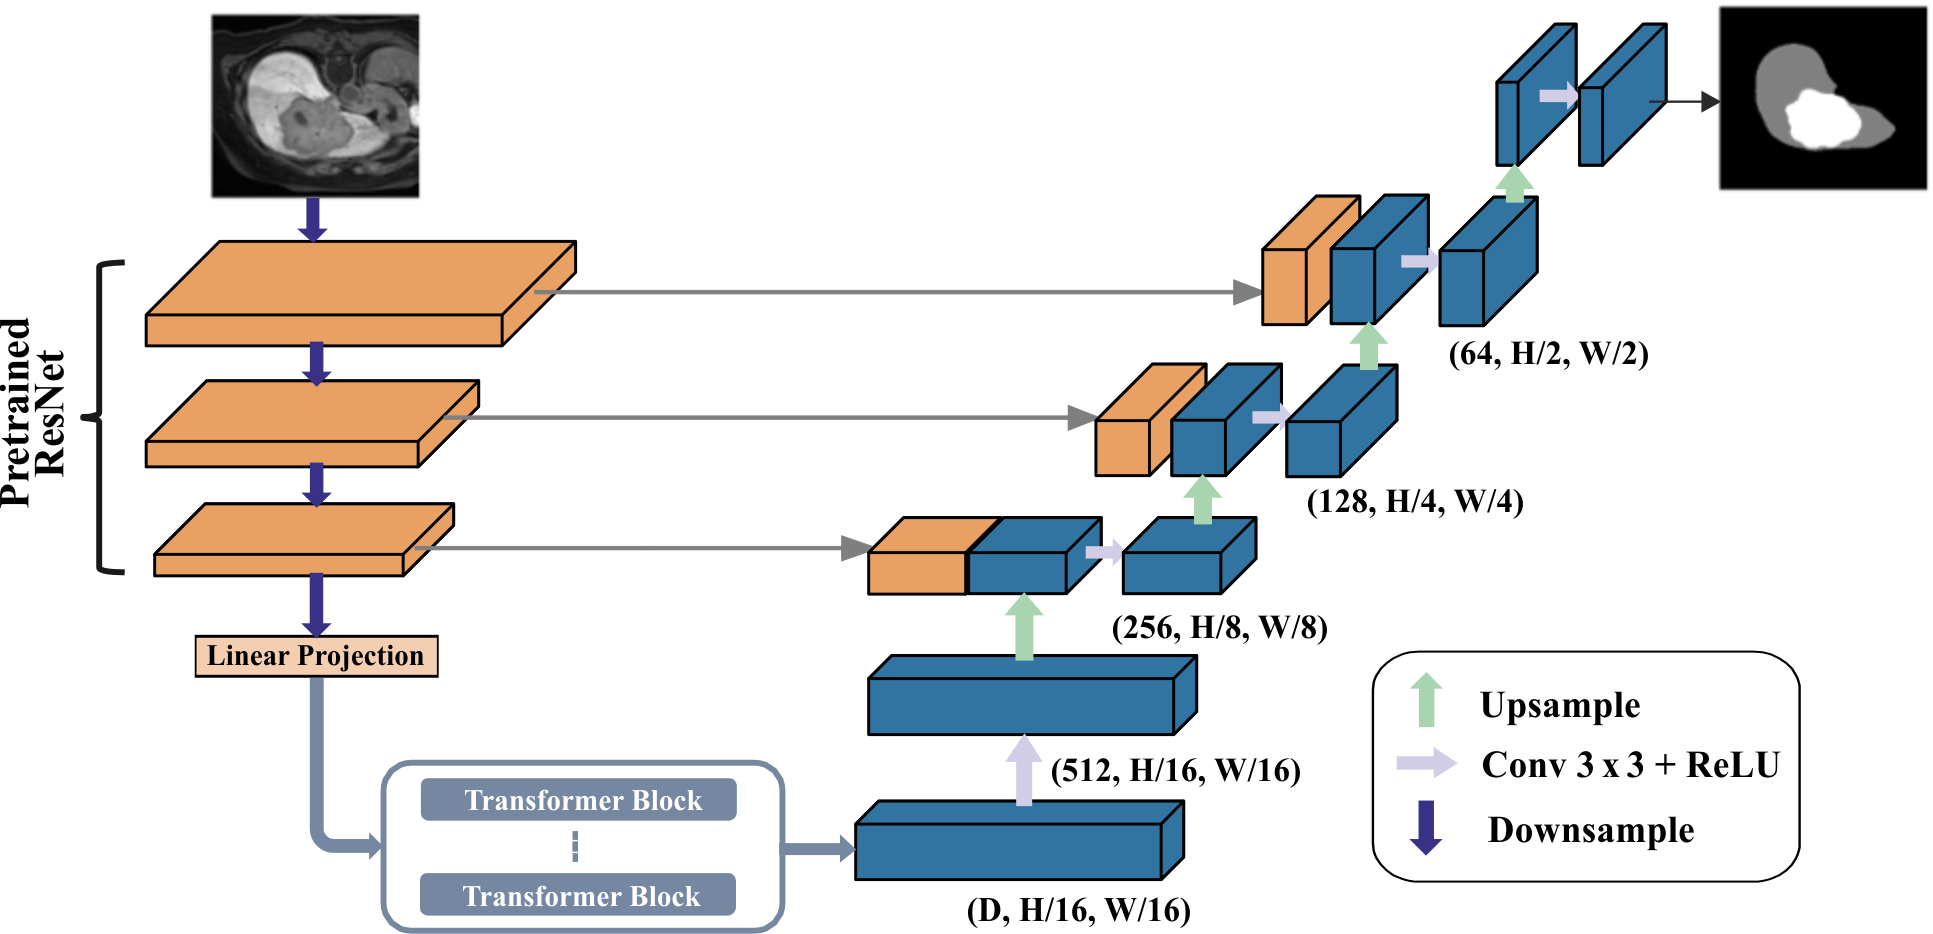
Figure 1 and 2 show the architecture of the proposed SWTR-Unet (SWIN-transformer-Unet) network for joint liver and hepatic lesion segmentation in MRI and CT. Herefore, Res-blocks, transformer-based multi-head self-attention (MSA) blocks as well as shifting window (SWIN) transformer blocks were combined into a hybrid structure. The components of the SWTR-Unet will be described in more detail in the following.
2.1 SWTR-Unet
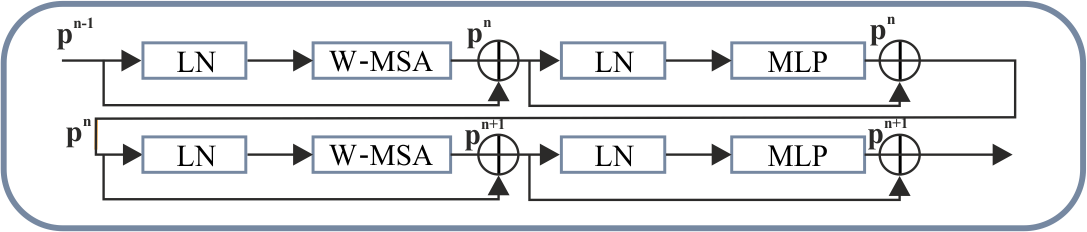
Regarding the hybrid encoder design of the proposed network a ResNet [17] was implemented as a convolutional backbone, which was pretrained on ImageNet [12] and combined with in total twelve transformer blocks at the bottleneck of the U-shaped architecture. Beside the function as a robust feature extractor, the Res-blocks within the pretrained ResNet also address the vanishing gradient problem and allow a more dynamic and efficient learning [17]. Fully convolutional-based networks like the widely known and applied Unet commonly suffer from the limitation of capturing long-range dependencies due to the intrinsic locality of convolutional operations. For extracting the global contextual information, the transformer elements encode the input images as a sequence of image patches. Then, the decoder performs the upsampling task needed for retrieving the precise localization. The transformer architecture replaces convolutional operators and relies on a multi-head self-attention mechanism instead. In contrast to works like [6, 5], the twelve transformer layers in the SWTR-Unet consist of multiple consecutive SWIN transformer sub-blocks, forming a SWIN transformer-based bottleneck within a CNN-based architecture. Each of those sub-blocks comprises layer normalization (LN), multi-headed self-attention (MSA) modules, residual connections, and a 2-layer multilayer perceptron (MLP) with a Gaussian Error Linear Unit (GELU) activation for adding non-linearity to the network. Regarding the self-attention modules, window-based multi-headed self-attention (W-MSA) and shifted window-based multi-headed self-attention (SW-MSA) are successively applied.
The input for the SWIN transformer blocks as the Unet bottleneck is generated by the preceding linear projection layer, which reshapes the 2D image in a sequence of 2D image tokens or patches, respectively of size 16 16 pixels [34]. The transformer architecture conducts global self-attention by computing the relationship of each patch with all other patches of the fed sequence, resulting in a computation of quadratic complexity [22]. This would make global self-attention mechanisms unsuitable for larger images. In order to overcome this limitation, shifted window-based local self-attention as proposed by Vaswani et al. [22], could reduce the computational costs due to linear complexity and furthermore, introduce cross-window connections via shifting.
The final segmentation masks of liver and lesions are obtained by the decoder-path of the STWR-Unet, which consists of in total four up-sampling layers. Starting at the bottom of the U-shaped architecture, the sequence of hidden features as output of the transformer blocks, is reshaped and then successively led through the decoder layers, where each consists of a two-times upsampling layer, a 3 3 convolutional layer and a Rectified linear unit (ReLU) layer. Therefore, the proposed SWTR-Unet is capable of aggregating both, local and global features as present in different resolution levels by preserving and transferring them to the decoder side via skip connections. Finally, the feature map is passed through the segmentation head to generate the segmentation output.
| Network | Activation Function | Optimizer | Loss Function | Epochs | Learning rate | Params |
| Unet [28] | ReLU | Adam | BCE | 60 | 1e-3 | 8M |
| DeepLabV3 [7] | ReLU | Adam | BCE | 60 | 1e-4 | 63M |
| Attn. Unet [24] | Leaky ReLU | SGD | BCE | 60 | 1e-3 | 6M |
| PSPNet [42] | Leaky ReLU | RMSProp | Dice | 70 | 1e-4 | 68M |
| DAF3D [39] | Leaky ReLU | Adam | Dice + CE | 70 | 1e-4 | 29M |
| DenseUnet [4] | Leaky ReLU | Adam | Dice + CE | 70 | 1e-3 | 36M |
| nnUnet [18] | Leaky ReLU | SGD | Dice + CE | 1000 | adaptive | 30M |
| UnetR [16] | ReLU | SGD | Dice | 60 | 1e-4 | 93M |
| SwinUnet [5] | GeLU | Adam | Dice | 80 | 1e-4 | 100M |
| TransUnet [6] | GeLU | Adam | Dice + CE | 80 | 1e-4 | 97M |
| SWTR-Unet | GeLU | SGD | Dice + CE | 70 | 1e-4 | 110M |
2.2 Imaging Data
Since both, MR and CT imaging are of crucial importance in clinical routine of hepatic lesion diagnosis and treatment decision-making, the same pipeline of pre-processing, training and evaluation was applied to both imaging modalities.
The single-modality, monophasic non-contrast-enhanced MR imaging data was retrospectively compiled and originally used for intervention planning purposes before brachytherapy at the Department of Radiology and Nuclear Medicine of the University Hospital in Magdeburg. The images were acquired using a Philips Intera 1.5 T scanner and an eTHRIVE sequence with repetition (TR) and echo times (TE) of 4.0 - 4.1 ms and 2.0 ms, respectively. In-plane image resolution of the axial scans was 0.98 mm, the spacing between slices was 3 mm, resulting in acquisition matrices of size . A total of 48 patient cases with overall 157 hepatic lesions were compiled. The ground truth segmentations of the liver outline and the hepatic lesions therein were performed by an experienced radiologist.
With respect to CT imaging, the LiTS challenge [2] data was used, which comprises scans from several clinical sites, using different acquisition protocols and CT scanners, and thus, the image quality and resolution vary noticeably. In-plane image resolution of the axial scans varies from 0.56 mm to 1.0 mm and the slice thickness varies from 0.45 mm to 6.0 mm. The number of slices per volume ranges from 42 to 128. The hepatic lesions that are present in each patient scan vary in size between 38 mm3 and 349 cm3 [2].
2.3 Pre-processing and Augmentation
The following description of the data pre-processing and augmentation holds true for both the MRI and CT data, if not stated otherwise. First, adaptive histogram equalization was performed to enhance the contrast volume-wise followed by resampling to a fixed matrix size. With regard to the MRI data, z-score normalization was performed, followed by an N4 bias correction. For CT data, the Hounsfield units were limited to the range [-100; 400] to exclude irrelevant outlier pixel intensities and subsequently normalized using the 5th and 95th percentile of the foreground intensities. Data augmentation consisting of various intensity and geometrical approaches were employed to strengthen the network’s robustness and generalization ability, since the number of available patient cases was relatively small, especially compared to the number of trainable parameters of each network. The image data was augmented using the application of Gaussian noise, gamma and affine transformations, including flipping (overall probability of , for each direction ), rotation () and translation ( voxels for the x and y-axis and voxels for the z-axis). Each of the 48 volumes of the MRI dataset was augmented 20-times leading to 960 samples of size voxels. Similarly, the 131 CT volumes were augmented 20-times and yielded in total 2,620 samples. Both, data sets were split into single slices for 2D image input, resulting in a total of 61,440 MR and 189,600 CT images.
2.4 Implementation details
The implementation of the proposed SWTR-Unet as well as relevant state-of-the-art methods were realized with Python 3.6 and Pytorch 1.7.0. All of the models were trained on a NVIDIA GeForce RTX2080 Ti GPU with 12GB of memory. Due to the limitation of GPU memory, the used batch size was 32 for 2D input and 8 in the case of the 3D input of the DAF3D network [39]. Table 1 describes the hyperparameter used after fine-tuning for each of the experimented methods. In order to evaluate the capability of the methods listed in Table 1 to segment the liver and lesions therein, seven-fold-cross validation was performed. Therefore, the MR dataset was separated into seven subsets each containing the augmented data of 41 to 42 image volumes for training purposes as well as six to seven original volumes within a corresponding validation set. Similarly, the CT data set is separated into seven-fold, each containing the augmented data of 114 image volumes for training purposes as well as 17 original volumes within a corresponding validation set. In doing so, it is guaranteed that the networks produce segmentation masks on unseen images with respect to the training process per fold. The 2D networks were applied to all slices per validation volume and predicted 2D slices were subsequently combined patient-wise to calculate the quality metrics regarding the segmentation accuracy per patient image volume. The results stated in the following refer to the average over all seven folds. In order to assess and compare the segmentation performance of all networks, no further post-processing was implemented.
| DSC | HD | ||||
| Unet [28] | |||||
| DeepLabV3 [7] | |||||
| Attn. Unet [24] | |||||
| PSPNet [42] | |||||
| DAF3D [39] | |||||
| DenseUnet [4] | |||||
| nnUnet [18] | |||||
| UnetR [16] | |||||
| SwinUnet [5] | |||||
| TransUnet [6] | |||||
| SWTR-Unet | |||||
2.5 Quality metrics
In order to assess and compare the capability of liver and hepatic lesion segmentation of the proposed SWTR-Unet with the state-of-the-art networks, Dice similarity coefficients (DSC) and Hausdorff distances (HD) per liver and the lesions within were used. The former is defined as
| (1) |
where and represent the reference and the resulting network’s segmentation. The Hausdorff distance, also known as the maximum surface distance, is defined as:
| (2) |
| (3) |
being the maximum of both directed Hausdorff distances between the two surface point sets of the reference and of the produced segmentation in each direction. was the maximum distance between any point x X and its nearest neighbour y Y and therefore, represents the worst contour misalignment.
3 Results
The evaluation of the proposed SWTR-Unet consists of three different aspects, which will be discussed successively. First of all, the SWTR-Unet as well as multiple state-of-the-art approaches that were additionally re-implemented, were applied to the MRI data. Hence, the segmentation capability of all network variants regarding the liver and its hepatic lesions therein could be compared directly. The second part focuses on the application of the proposed approach to the CT imaging data of the LiTS challenge and therefore, the segmentation accuracy can be assessed on both of the most relevant liver cancer imaging modalities. The final part was conducted to get more insights on potential influencing factors on the segmentation accuracy of the proposed SWTR-Unet, e.g., the number of skip connections and transformer layers or how lesion size or shape influence the segmentation results. Additionally, for assessing the quality of the segmentation results, a comparison with the inter-observer variability (IOV) of hepatic lesion segmentations manually produced by experts is instructive. Related literature stated IOV values as Dice scores of for MR imaging [15] and produced on CT images [35].
3.1 MRI-based evaluation
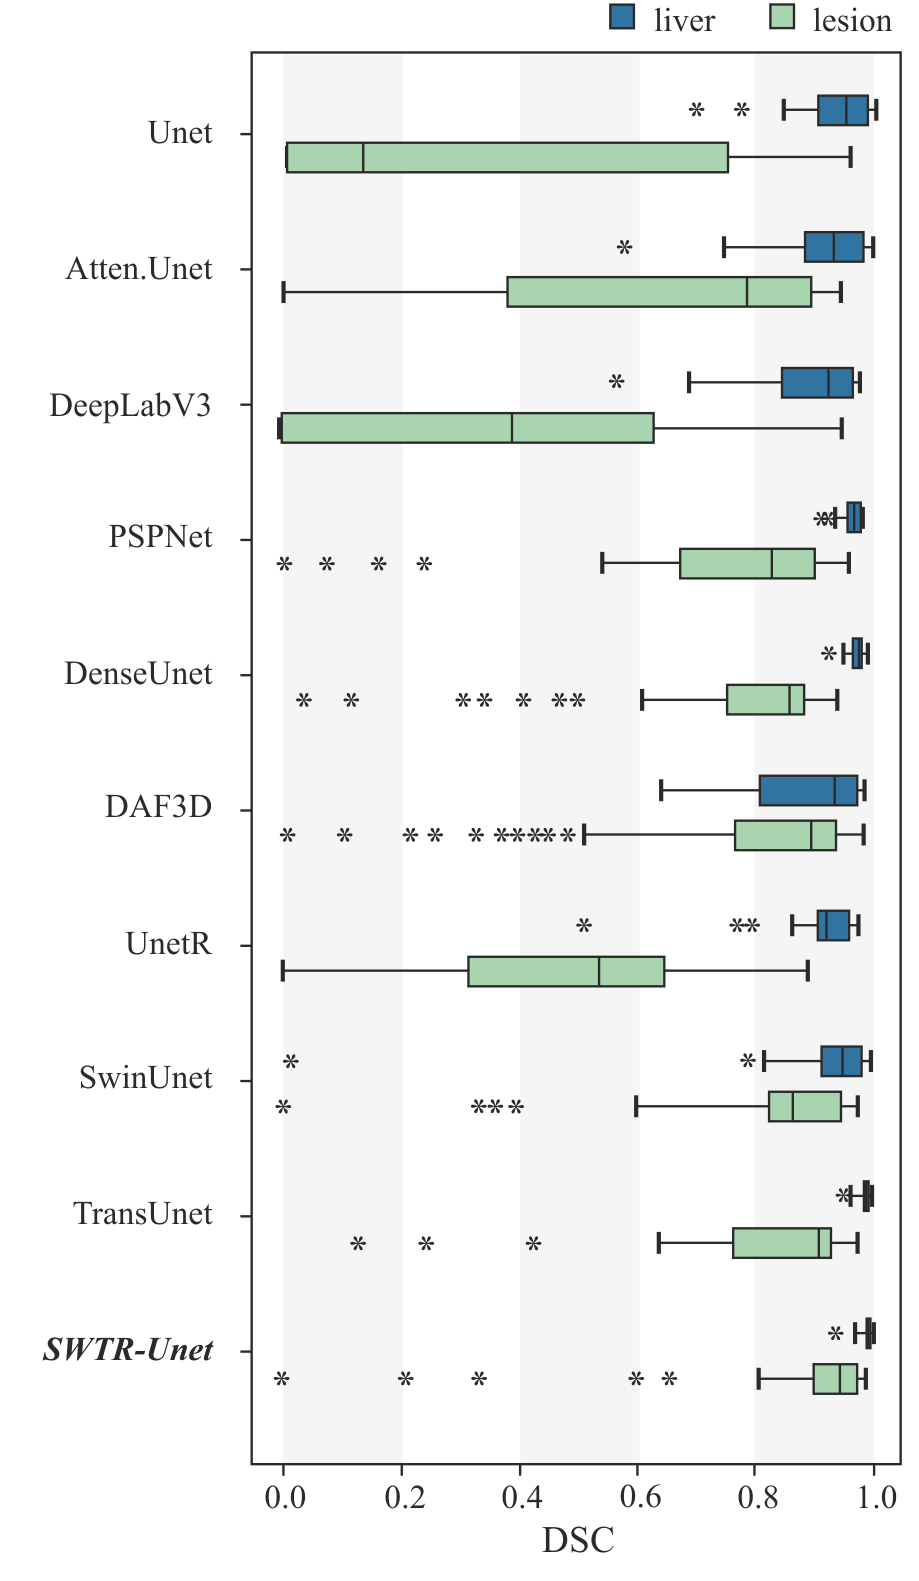
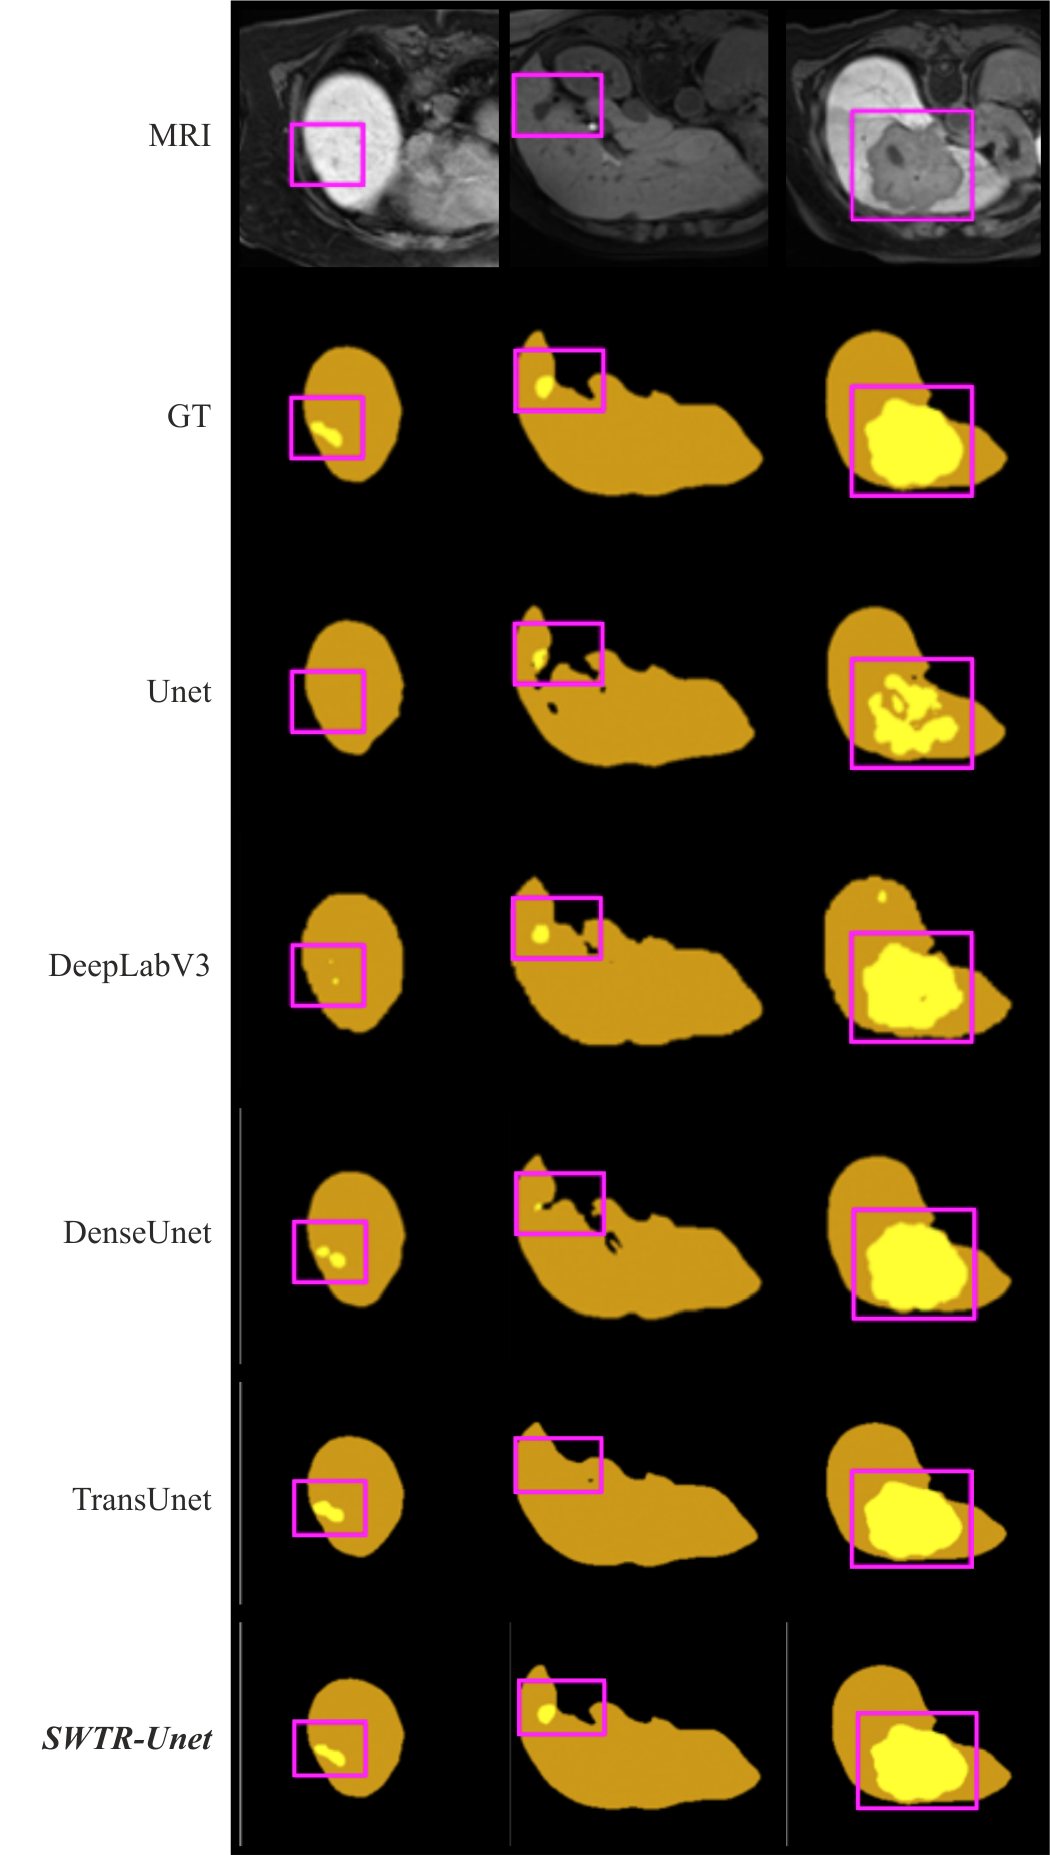
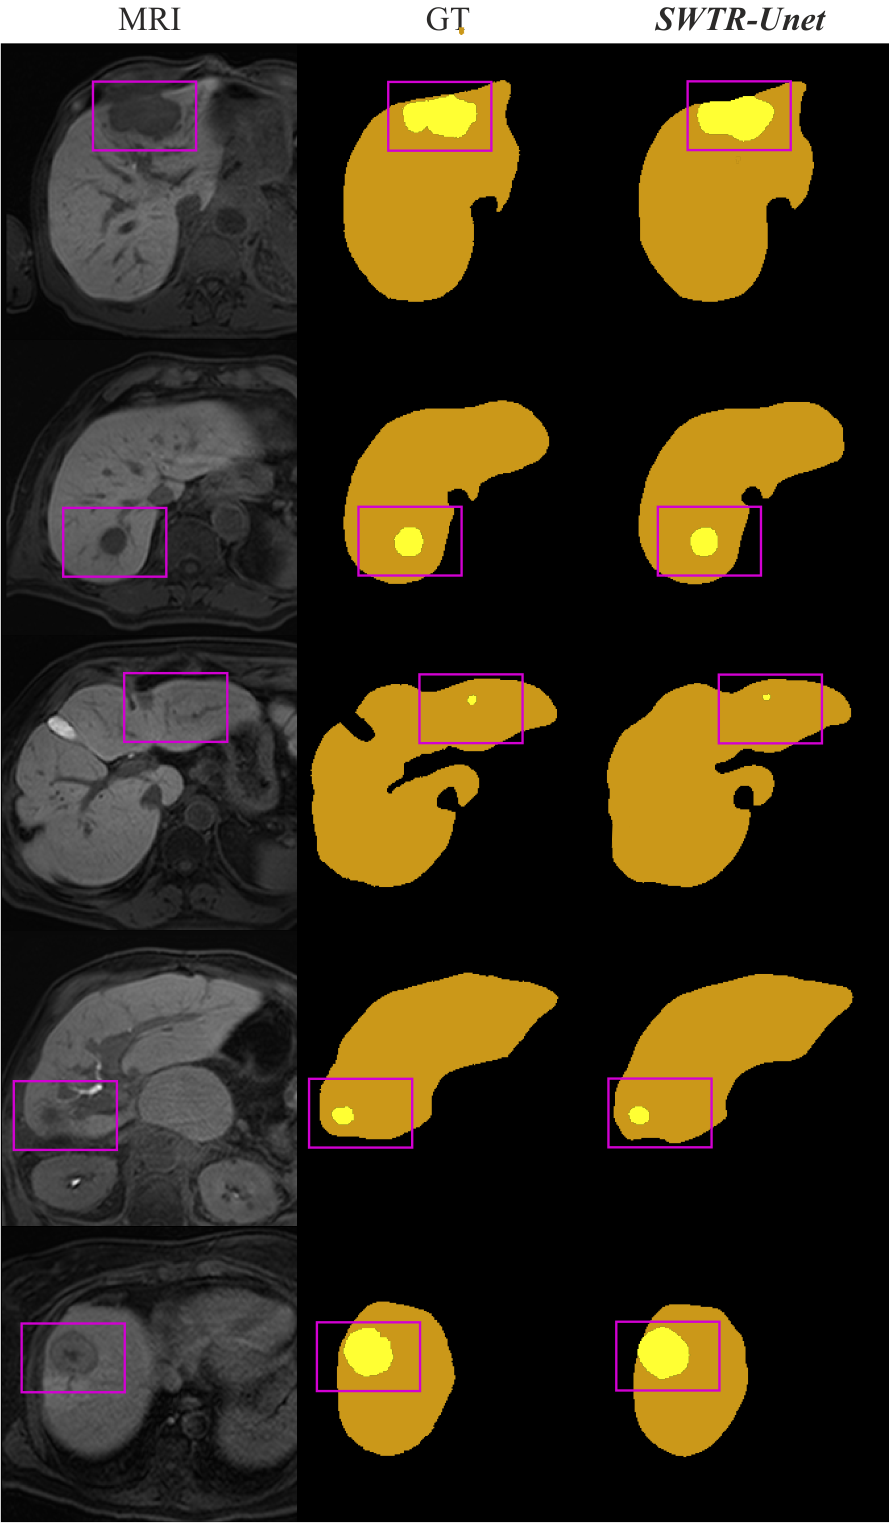
Table 2 shows the averaged segmentation accuracy of all implemented network variants, including both, multiple state-of-the-art architectures and the proposed SWTR-Unet regarding the liver outline and the hepatic lesions therein. With respect to the entirely convolutional-based network variants, the best results could be achieved with the nnUnet with on average liver and lesion Dice. Most of the other state-of-the-art CNNs show promising results regarding the liver segmentation, but lack accuracy in terms of the much more challenging segmentation of the hepatic lesions (see Figure 4). The observation of some of the networks producing the worst results revealed several possible reasons for the weak performance: a prevalent cause seems to be false-positive classified pixels in addition to otherwise reasonably good delineated tumors, which occurs on better performing samples as well but is less pronounced there. This problem is most prominent in the case of Unet and DeepLabV3 (average false-positive rate of and as compared to the of the DAF3D network). Furthermore, these networks are not able to sufficiently segment tumors of irregular shapes. Examples are shown in Figure 4, where the networks’ limitations of segmenting non-circular shaped lesions are demonstrated. Similar behaviour is observed for tumors of small size, which were not appropriately detected by any of the Unet, Attention Unet, and DeepLabV3 networks. Another challenge for those variants represented tumors located close to the liver boundary. In conclusion, the tested convolutional-based networks achieved acceptable segmentation accuracies regarding hepatic lesions of spherical shape, larger size and location in central regions of the liver, but the accuracies drastically decreased for non-spherical shaped and small tumors that are located close to the liver surface. In contrast, transformer-based networks achieved overall higher segmentation accuracies especially regarding the hepatic lesions. The only exception to this was the UnetR variant, which lacked sufficient accuracy for both object classes. The proposed SWTR-Unet variant outperformed any other network in this test in terms of liver and hepatic lesion segmentation, resulting in DSCs on average of and , respectively. Furthermore, in comparison to most of the state-of-the-art network variants, the proposed SWTR-Unet seemed to widely overcome limitations due to smaller sized and non-spherical shaped lesions.
3.2 CT-based evaluation
In addition to the MRI-based evaluation, the proposed SWTR-Unet was also applied to the LiTS challenge CT data to verify the applicability on another modality. On this dataset the proposed network achieved DSCs on average of for the liver and for the hepatic lesions therein. The mean Hausdorff distances were (liver) and (lesion).
3.3 Cross-modality evaluation
In addition to the experiments with solely MRI or CT data, a joint network was designed, which used both data sets as an input (i.e., overall 179 patient cases, including 48 MRI and 131 CT volumes). Analogous to the previous experiments, seven-fold-cross-validation was performed, which resulted in an average accuracy of DSC for the liver and DSC for the hepatic lesion segmentation. Therefore, the results are slightly inferior compared to both single source experiments, although not far off. This further proves the robustness of the proposed network with respect to the input image modality.
3.4 Ablation study
In order to gain more detailed insights of the performance and corresponding influencing factors of the proposed SWTR-Unet on the MRI data set, a number of additional experiments as well as corresponding significance tests (significance level ) were carried out. Starting with varying the number of skip connections (see Table 3), which were removed starting with the bottom-most connection (lowest resolution) up to the top-most connection (highest resolution). The results indicate that the skip connections are highly beneficial for the segmentation accuracy and accordingly the accuracy decreases significantly with each removed connection. Therefore, skip connections directly affect the ability of the network to capture lost spatial information during downsampling and thus, higher segmentation accuracies could be achieved.
| 0 | ||
|---|---|---|
| 1 | ||
| 2 | ||
| 3 |
Table 4 shows that extending the network with additional transformer layers increases the DSCs for both liver and tumor segmentation. Transformer layers proved to be in general beneficial to the segmentation accuracy, since they are suitable for capturing long-range dependencies between pixels and thus, global context information. That means, extending the transformer depth to a certain amount of layer, will likely increase the resulting segmentation accuracy, although limited by the drawback of rising computational costs. With the extension from eight to ten and twelve transformer layers the segmentation accuracy could be increased significantly step by step. Only the extension from ten to twelve transformer layers for the liver segmentation proved not to be significant.
| 8 | ||
|---|---|---|
| 10 | ||
| 12 |
Furthermore, the impact of the number of training samples on the segmentation quality was examined. This was done by training the network with 25, 30, 35, and 45 randomly selected patient cases and their corresponding 2D slices. As illustrated in Table 5, an increasing number of training samples led to an overall significantly more precise segmentation result. That should not come as a surprise, since a larger set of independent training data becomes more and more capable to represent the vast variety of the hepatic lesions’ size, shape, and location within the liver and therefore, minimizing overfitting behaviour and leading to an improved generalization capability of the network.
| 25 | ||
|---|---|---|
| 30 | ||
| 35 | ||
| 40 |
Finally, the impact of the pretrained ResNet as well as the presence of the transformer block were investigated (see Table 6). The results showed a rather marginal benefit of pretraining the ResNet compared to an untrained alternative. This finding thus calls into question the necessity of pretraining the ResNet as a pre-processing step. In contrast, the impact of the transformer bottleneck has proven to be critical, especially with regard to the hepatic lesions, which vastly benefited from its presence.
| pretrained ResNet | ||
|---|---|---|
| untrained-ResNet | ||
| with transformer bottleneck | ||
| without transformer bottleneck |
3.5 Correlation analysis
Due to the high variety of shapes, sizes and locations of the lesions within the liver, it was of utmost interest to examine how these lesion characteristics affect the segmentation accuracy of the proposed SWTR-Unet and to reveal possible bias. This correlation analysis was performed on both, the MRI as well as on the publicly available LiTS challenge CT data (see Table 7).
In terms of lesion shape, the ground truth segmentation of all samples was used to determine the lesions’ sphericity by calculating
| (4) |
with V being the volume and A the surface of the lesion mask. Subsequently, the lesions were divided into two classes, labelling them as spherical (, MRI: 20 lesions, CT: 44 lesions) or merely non-spherically shaped (, MRI: 137 lesions, CT: 838). The experiments clearly indicated higher segmentation accuracies if the lesions were of a rather spherical shape with on average DSC (CT: DSC) compared to the class of non-spherically shaped lesions with a mean Dice of DSC (CT: DSC), although these were much more prominently represented in the training set. The prevalence of mere spherically shaped lesions not only increase the chances of more accurate segmentations, but benefits also the robustness of the approach as indicated by the considerably lower standard deviation compared to the results of lesions with a .
The volume of each lesion derived from the ground truth segmentation was used furthermore to divide the whole data set into four different lesion size subgroups: lesions smaller than 1 , between 1 and 5 , between 5 and 10 and lesions larger than 10 . The results of the experiments using both, the MRI and CT data indicate that the averaged segmentation accuracy as well as the robustness of the method increases with larger tumor sizes (see Table 7), which was a similar finding to [43]. This tendency is further strengthened by the fact that the vastly overrepresented subgroup of the smallest lesions (under 1 , MRI: 68 lesions, CT: 536 lesions) performed statistically significantly worse than the subgroup of the largest lesions (over 10 , MRI: 12 lesions, CT: 117 lesions), despite the fact that the latter tended to be penalised by the sample distribution within the data set.
Finally, the impact of the lesions’ inner hepatic location was examined depending on the distance towards the liver surface. Each lesion was labelled based on the distance , that is the closest Euclidean distance between the liver surface and the lesion outline. Hence, it was differentiated between lesions that were surface-near () or rather centred within the liver (). The MRI results indicate that hepatic lesions close to the liver surface are significantly harder to accurately segment as those, which are more centred within the organ, which is reflected in a remarkably lower mean DSC of compared to on average for rather centred lesion. This may be caused by the more challenging contrast and texture variety at the liver surface with surrounding other tissues, even though both classes were not equally represented within the data set (35 surface-near vs. 122 rather centred cases). The found indication held also true for the segmentations produced on the LiTS challenge data, where lesions at the liver surface scored significantly worse ( DSC, 279 lesions) than those in a mere centred location ( DSC, 603 lesions).
The impact of each of the investigated influencing factors on the segmentation accuracy was assessed by significance tests (significance level ). Both the sphericity and the lesion size (smallest class versus largest class), as well as the proximity to the liver surface of the lesions have a statistically significant effect on the segmentation accuracy.
| 137 | 838 | |||
| 20 | 44 | |||
| 68 | 536 | |||
| 60 | 165 | |||
| 17 | 64 | |||
| 12 | 117 | |||
| 35 | 279 | |||
| 122 | 603 |
4 Discussion
4.1 MRI-based liver and hepatic lesion segmentation
Among the first to apply deep learning-based networks to liver lesion segmentation in MRI were [11], which included it in their otherwise CT-based study. The authors utilized an Unet-style fully convolutional cascaded neural network with a 3D Conditional Random Field (CRF) for the segmentation of the liver and subsequently using the resulting liver mask as an input for the following lesion segmentation. Regarding the MRI part of their work, they trained their network with 38 patient cases and achieved DSCs on average of for the liver and for the hepatic lesion segmentation. [3] applied an U-net-type network to multiphasic T1-weighted MR images of 174 patient cases to detect and delineate HCC. In order to enhance segmentation accuracy [3] combined the U-net with a random forest classifier and cluster thresholding and thus, achieved on average DSCs of for liver and for hepatic lesion segmentation. Similar to [3], [43] presented an approach for joint HCC detection and segmentation. However, they shifted away from a more typical U-net-based approach towards a combination of a channel-wise multi-modal image encoder that focusses on complementary multi-modality feature extraction, coordinate sharing between the detection and segmentation path and a subsequent radiomics guided discriminator. [43] applied their approach to multi-modal (T1-, T2-weighted, DWI) and multiphasic non-contrast-enhanced MR imaging of 255 patient cases. Exploiting the full potential of all MRI sequences and multiphase contrast-enhanced MR imaging they achieved on average a DSC of , whereas single-modality non-contrast-enhanced T1-weighted image input comparable to the image data of this work results in an averaged DSC of . The most recent work of [15] utilized a 3D anisotropic U-net and assessed it on late hepatocellular phase contrast-enhanced MR images of 19 test patient cases out of 107 subjects. They matched the resulting segmentation masks of their network with ground truths of three different raters and achieved a DSC of averaged over all test cases and raters.
| [11] | ||
|---|---|---|
| [3] | ||
| [43] | ||
| [15] | ||
| SWTR-Unet |
Compared to the proposed SWTR-Unet those works, as well as the additionally re-implemented approaches mostly yielded inferior results for hepatic lesion segmentation, especially if they utilized solely convolutional-based architectures, which may not be able to adequately capture the huge shape, size and location variety of hepatic lesions. The addition of non-convolutional elements, e.g., transformer-based building blocks as introduced by [6], [5] and integrated in the proposed SWTR-Unet could significantly enhance the segmentation performance. Another strategy represents the exploitation of complementary multimodal and multiphasic contrast-enhanced MR image features as well as radiomics guided refinements as proposed by [43], which yielded the best results so far. Regarding single-modality and non-contrast-enhanced MR imaging the proposed SWTR-Unet represents the state of the art on par with the work of [43], although in contrast to their work, the SWTR-Unet segments the liver in parallel. Overall, it is important to note, that with respect to the different data bases, such comparisons are of an indirect nature. In terms of the IOV of MRI-based hepatic lesion segmentation of )[15], only the proposed SWTR-Unet, the re-implemented nnUnet [18] and the approach of [43] could achieve expert level segmentation accuracy.
4.2 CT-based liver and hepatic lesion segmentation
In addition to the MRI-based experiments, the SWTR-Unet was applied unmodified to CT data to assess its applicability to another commonly used liver imaging modality. Since most of the works dealing with deep learning-based segmentation of hepatic lesions in CT imaging used the LiTS challenge data, a mere direct comparison of the results is possible (see Table 9). The segmentation accuracy of the SWTR-Unet proved to be superior to many state-of-the-art works for both liver and hepatic lesion segmentation, except for the works of [31] and [1]. The latter utilizes a two-step approach with a preceding detection of the liver lesion bounding box, which is subsequently used as an input for the Unet-based segmentation network. Therefore, the final segmentation accuracy heavily relies on the preceding detection step, which is also reflected by the drop of performance from to if the initial step is omitted. In contrast, the SWTR-Unet works on uncropped, original CT image volumes and additionally delineates the liver. [31] modified an Unet-style architecture by adding a residual path with convolutional layers and activation functions to the skip connections in order to avoid the duplication of low resolution information and enhance higher level feature extraction. In comparison with the SWTR-Unet the work of [31] achieves similar results regarding the liver segmentation, but proved to be superior with respect to the hepatic lesion segmentation. Both approaches underline the importance of capturing high level features and obtaining global information, which is a common limitation of conventional Unet architectures.
| [23] | ||
|---|---|---|
| [10] | ||
| [36] | ||
| [13] | ||
| [31] | ||
| [8] | ||
| [1] | ||
| [18]* | ||
| [5]* | ||
| [6]* | ||
| SWTR-Unet |
4.3 Conclusion
Precise segmentations of the liver and hepatic tumors are of utmost importance since decisions regarding the proper treatment evermore depend on findings provided by such procedures. Whereas manual segmentation represents the gold standard in terms of accuracy, it is time-consuming, cumbersome, and unnecessarily ties up valuable resources, which is why automatized procedures gain relevance in clinical settings.
In this work, we presented a novel hybrid network architecture combining convolutional and transformer-based elements and compared it with additionally implemented state-of-the-art approaches on the same evaluation data. This ensures a direct comparability of all methods, which is otherwise most often limited due to different databases of the related work. In this regard, all network variants were applied to clinical MRI data of the University Hospital of Magdeburg. Furthermore, the proposed approach was applied to publicly available CT imaging data of the LiTS challenge. In order to investigate various influencing factors on the segmentation accuracy, various parameters of the network architecture, as well as the influence of lesion size, shape and location on the results were examined.
Based on these experiments, the proposed SWTR-Unet achieved highly promising segmentation accuracies regarding both, the liver and its hepatic lesions with DSCs on average of and on MRI and and on CT data. In comparison to the related work, the proposed approach represents the current state of the art in MRI-based hepatic lesion segmentation. The findings of further experiments underlined the impact of lesion size, shape and location within the liver, which indicated that the segmentation accuracy increases with larger, more spherical and rather centred lesions. Furthermore, it could be shown that an increasing number of training samples, skip connections and transformer layers have a beneficial effect on the segmentation accuracy.
In conclusion, the proposed SWTR-Unet could represent an important step towards a more sophisticated computer-assisted workflow of liver lesion diagnosis and therapy by providing expert-level segmentation accuracy with little to no required user interaction. Therefore, it could support the radiologists in clinical practice by saving valuable resources and time.
5 Acknowledgements
Funding: The work of this paper was funded by the Federal Ministry of Education and Research within the Forschungscampus STIMULATE under grant number ’13GW0473A’.
Ethical approval: All procedures performed in studies involving human participants were in accordance with the ethical standards of the institutional and/or national research committee and with the 1964 Helsinki declaration and its later amendments or comparable ethical standards. For this type of study formal consent is not required.
Conflict of Interest Statement: None declared.
References
- Araújo et al. [2021] Araújo, J.D.L., da Cruz, L.B., Ferreira, J.L., da Silva Neto, O.P., Silva, A.C., de Paiva, A.C., Gattass, M., 2021. An automatic method for segmentation of liver lesions in computed tomography images using deep neural networks. Expert Systems with Applications 180, 115064.
- Bilic et al. [2019] Bilic, P., Christ, P.F., Vorontsov, E., Chlebus, G., Chen, H., Dou, Q., Fu, C.W., Han, X., Heng, P.A., Hesser, J., et al., 2019. The liver tumor segmentation benchmark (lits). arXiv preprint arXiv:1901.04056 .
- Bousabarah et al. [2021] Bousabarah, K., Letzen, B., Tefera, J., Savic, L., Schobert, I., Schlachter, T., Staib, L.H., Kocher, M., Chapiro, J., Lin, M., 2021. Automated detection and delineation of hepatocellular carcinoma on multiphasic contrast-enhanced mri using deep learning. Abdominal Radiology 46, 216–225.
- Cai et al. [2020] Cai, S., Tian, Y., Lui, H., Zeng, H., Wu, Y., Chen, G., 2020. Dense-unet: a novel multiphoton in vivo cellular image segmentation model based on a convolutional neural network. Quantitative imaging in medicine and surgery 10, 1275.
- Cao et al. [2021] Cao, H., Wang, Y., Chen, J., Jiang, D., Zhang, X., Tian, Q., Wang, M., 2021. Swin-unet: Unet-like pure transformer for medical image segmentation. arXiv preprint arXiv:2105.05537 .
- Chen et al. [2021] Chen, J., Lu, Y., Yu, Q., Luo, X., Adeli, E., Wang, Y., Lu, L., Yuille, A.L., Zhou, Y., 2021. Transunet: Transformers make strong encoders for medical image segmentation. arXiv preprint arXiv:2102.04306 .
- Chen et al. [2017] Chen, L.C., Papandreou, G., Schroff, F., Adam, H., 2017. Rethinking atrous convolution for semantic image segmentation. arXiv preprint arXiv:1706.05587 .
- Chi et al. [2021] Chi, J., Han, X., Wu, C., Wang, H., Ji, P., 2021. X-net: Multi-branch unet-like network for liver and tumor segmentation from 3d abdominal ct scans. Neurocomputing 459, 81–96.
- Child et al. [2019] Child, R., Gray, S., Radford, A., Sutskever, I., 2019. Generating long sequences with sparse transformers. arXiv preprint arXiv:1904.10509 .
- Chlebus et al. [2018] Chlebus, G., Schenk, A., Moltz, J.H., van Ginneken, B., Hahn, H.K., Meine, H., 2018. Automatic liver tumor segmentation in ct with fully convolutional neural networks and object-based postprocessing. Scientific reports 8, 1–7.
- Christ et al. [2017] Christ, P.F., Ettlinger, F., Grün, F., Elshaera, M.E.A., Lipkova, J., Schlecht, S., Ahmaddy, F., Tatavarty, S., Bickel, M., Bilic, P., Rempfler, M., Hofmann, F., Anastasi, M., Ahmadi, S.A., Kaissis, G., Holch, J., Sommer, W., Braren, R., Heinemann, V., Menze, B., 2017. Automatic liver and tumor segmentation of ct and mri volumes using cascaded fully convolutional neural networks. arXiv preprint arXiv:1702.05970 .
- Deng et al. [2009] Deng, J., Dong, W., Socher, R., Li, L.J., Li, K., Fei-Fei, L., 2009. Imagenet: A large-scale hierarchical image database, in: 2009 IEEE conference on computer vision and pattern recognition, Ieee. pp. 248–255.
- Fan et al. [2020] Fan, T., Wang, G., Li, Y., Wang, H., 2020. Ma-net: A multi-scale attention network for liver and tumor segmentation. IEEE Access 8, 179656–179665.
- Ferlay et al. [2010] Ferlay, J., Shin, H.R., Bray, F., Forman, D., Mathers, C., Parkin, D.M., 2010. Estimates of worldwide burden of cancer in 2008: Globocan 2008. International journal of cancer 127, 2893–2917.
- Hänsch et al. [2022] Hänsch, A., Chlebus, G., Meine, H., Thielke, F., Kock, F., Paulus, T., Abolmaali, N., Schenk, A., 2022. Improving automatic liver tumor segmentation in late-phase mri using multi-model training and 3d convolutional neural networks. Scientific Reports 12, 1–10.
- Hatamizadeh et al. [2022] Hatamizadeh, A., Tang, Y., Nath, V., Yang, D., Myronenko, A., Landman, B., Roth, H.R., Xu, D., 2022. Unetr: Transformers for 3d medical image segmentation, in: Proceedings of the IEEE/CVF Winter Conference on Applications of Computer Vision, pp. 574–584.
- He et al. [2016] He, K., Zhang, X., Ren, S., Sun, J., 2016. Deep residual learning for image recognition, in: Proceedings of the IEEE conference on computer vision and pattern recognition, pp. 770–778.
- Isensee et al. [2021] Isensee, F., Jaeger, P.F., Kohl, S.A., Petersen, J., Maier-Hein, K.H., 2021. nnu-net: a self-configuring method for deep learning-based biomedical image segmentation. Nature methods 18, 203–211.
- Li et al. [2013] Li, C., Wang, X., Eberl, S., Fulham, M., Yin, Y., Chen, J., Feng, D.D., 2013. A likelihood and local constraint level set model for liver tumor segmentation from ct volumes. IEEE Transactions on Biomedical Engineering 60, 2967–2977.
- Li et al. [2015] Li, G., Chen, X., Shi, F., Zhu, W., Tian, J., Xiang, D., 2015. Automatic liver segmentation based on shape constraints and deformable graph cut in ct images. IEEE Transactions on Image Processing 24, 5315–5329.
- Linguraru et al. [2012] Linguraru, M.G., Richbourg, W.J., Liu, J., Watt, J.M., Pamulapati, V., Wang, S., Summers, R.M., 2012. Tumor burden analysis on computed tomography by automated liver and tumor segmentation. IEEE transactions on medical imaging 31, 1965–1976.
- Liu et al. [2021] Liu, Z., Lin, Y., Cao, Y., Hu, H., Wei, Y., Zhang, Z., Lin, S., Guo, B., 2021. Swin transformer: Hierarchical vision transformer using shifted windows, in: Proceedings of the IEEE/CVF International Conference on Computer Vision, pp. 10012–10022.
- Meng et al. [2020] Meng, L., Tian, Y., Bu, S., 2020. Liver tumor segmentation based on 3d convolutional neural network with dual scale. Journal of applied clinical medical physics 21, 144–157.
- Oktay et al. [2018] Oktay, O., Schlemper, J., Folgoc, L.L., Lee, M., Heinrich, M., Misawa, K., Mori, K., McDonagh, S., Hammerla, N.Y., Kainz, B., Glocker, B., Rueckert, D., 2018. Attention u-net: Learning where to look for the pancreas. arXiv preprint arXiv:1804.03999 .
- Parmar et al. [2018] Parmar, N., Vaswani, A., Uszkoreit, J., Kaiser, L., Shazeer, N., Ku, A., Tran, D., 2018. Image transformer, in: International conference on machine learning, PMLR. pp. 4055–4064.
- Poudel et al. [2016] Poudel, R.P., Lamata, P., Montana, G., 2016. Recurrent fully convolutional neural networks for multi-slice mri cardiac segmentation, in: Reconstruction, segmentation, and analysis of medical images. Springer, pp. 83–94.
- Rezaei et al. [2020] Rezaei, M., Yang, H., Meinel, C., 2020. Recurrent generative adversarial network for learning imbalanced medical image semantic segmentation. Multimedia Tools and Applications 79, 15329–15348.
- Ronneberger et al. [2015] Ronneberger, O., Fischer, P., Brox, T., 2015. U-net: Convolutional networks for biomedical image segmentation, in: International Conference on Medical image computing and computer-assisted intervention, Springer. pp. 234–241.
- Schlemper et al. [2019a] Schlemper, J., Oktay, O., Schaap, M., Heinrich, M., Kainz, B., Glocker, B., Rueckert, D., 2019a. Attention gated networks: Learning to leverage salient regions in medical images. Medical image analysis 53, 197–207.
- Schlemper et al. [2019b] Schlemper, J., Oktay, O., Schaap, M., Heinrich, M., Kainz, B., Glocker, B., Rueckert, D., 2019b. Attention gated networks: Learning to leverage salient regions in medical images. Medical image analysis 53, 197–207.
- Seo et al. [2019] Seo, H., Huang, C., Bassenne, M., Xiao, R., Xing, L., 2019. Modified u-net (mu-net) with incorporation of object-dependent high level features for improved liver and liver-tumor segmentation in ct images. IEEE transactions on medical imaging 39, 1316–1325.
- Touvron et al. [2021] Touvron, H., Cord, M., Douze, M., Massa, F., Sablayrolles, A., Jégou, H., 2021. Training data-efficient image transformers & distillation through attention, in: International Conference on Machine Learning, PMLR. pp. 10347–10357.
- Valanarasu et al. [2021] Valanarasu, J.M.J., Oza, P., Hacihaliloglu, I., Patel, V.M., 2021. Medical transformer: Gated axial-attention for medical image segmentation, in: International Conference on Medical Image Computing and Computer-Assisted Intervention, Springer. pp. 36–46.
- Vaswani et al. [2017] Vaswani, A., Shazeer, N., Parmar, N., Uszkoreit, J., Jones, L., Gomez, A.N., Kaiser, Ł., Polosukhin, I., 2017. Attention is all you need. Advances in neural information processing systems 30.
- Vorontsov et al. [2019] Vorontsov, E., Cerny, M., Régnier, P., Di Jorio, L., Pal, C.J., Lapointe, R., Vandenbroucke-Menu, F., Turcotte, S., Kadoury, S., Tang, A., 2019. Deep learning for automated segmentation of liver lesions at ct in patients with colorectal cancer liver metastases. Radiology. Artificial intelligence 1.
- Vorontsov et al. [2018] Vorontsov, E., Tang, A., Pal, C., Kadoury, S., 2018. Liver lesion segmentation informed by joint liver segmentation, in: 2018 IEEE 15th International Symposium on Biomedical Imaging (ISBI 2018), IEEE. pp. 1332–1335.
- Wang et al. [2016] Wang, H., Naghavi, M., Allen, C., Barber, R.M., Bhutta, Z.A., Carter, A., Casey, D.C., Charlson, F.J., Chen, A.Z., Coates, M.M., et al., 2016. Global, regional, and national life expectancy, all-cause mortality, and cause-specific mortality for 249 causes of death, 1980–2015: a systematic analysis for the global burden of disease study 2015. The lancet 388, 1459–1544.
- Wang et al. [2018] Wang, X., Girshick, R., Gupta, A., He, K., 2018. Non-local neural networks, in: Proceedings of the IEEE conference on computer vision and pattern recognition, pp. 7794–7803.
- Wang et al. [2019] Wang, Y., Dou, H., Hu, X., Zhu, L., Yang, X., Xu, M., Qin, J., Heng, P.A., Wang, T., Ni, D., 2019. Deep attentive features for prostate segmentation in 3d transrectal ultrasound. IEEE transactions on medical imaging 38, 2768–2778.
- Zhang et al. [2021a] Zhang, Y., Liu, H., Hu, Q., 2021a. Transfuse: Fusing transformers and cnns for medical image segmentation, in: International Conference on Medical Image Computing and Computer-Assisted Intervention, Springer. pp. 14–24.
- Zhang et al. [2021b] Zhang, Y., Peng, C., Peng, L., Huang, H., Tong, R., Lin, L., Li, J., Chen, Y.W., Chen, Q., Hu, H., Peng, Z., 2021b. Multi-phase liver tumor segmentation with spatial aggregation and uncertain region inpainting, in: International Conference on Medical Image Computing and Computer-Assisted Intervention, Springer. pp. 68–77.
- Zhao et al. [2017] Zhao, H., Shi, J., Qi, X., Wang, X., Jia, J., 2017. Pyramid scene parsing network, in: Proceedings of the IEEE conference on computer vision and pattern recognition, pp. 2881–2890.
- Zhao et al. [2021] Zhao, J., Li, D., Xiao, X., Accorsi, F., Marshall, H., Cossetto, T., Kim, D., McCarthy, D., Dawson, C., Knezevic, S., et al., 2021. United adversarial learning for liver tumor segmentation and detection of multi-modality non-contrast mri. Medical Image Analysis 73, 102154.