Unlocking Personalized Healthcare on Modern CPUs/GPUs: Three-way Gene Interaction Study
Abstract
Developments in Genome-Wide Association Studies have led to the increasing notion that future healthcare techniques will be personalized to the patient, by relying on genetic tests to determine the risk of developing a disease. To this end, the detection of gene interactions that cause complex diseases constitutes an important application. Similarly to many applications in this field, extensive data sets containing genetic information for a series of patients are used (such as Single-Nucleotide Polymorphisms), leading to high computational complexity and memory utilization, thus constituting a major challenge when targeting high-performance execution in modern computing systems. To close this gap, this work proposes several novel approaches for the detection of three-way gene interactions in modern CPUs and GPUs, making use of different optimizations to fully exploit the target architectures. Crucial insights from the Cache-Aware Roofline Model are used to ensure the suitability of the applications to the computing devices. An extensive study of the architectural features of 13 CPU and GPU devices from all main vendors is also presented, allowing to understand the features relevant to obtain high-performance in this bioinformatics domain. To the best of our knowledge, this study is the first to perform such evaluation for epistasis detection. The proposed approaches are able to surpass the performance of state-of-the-art works in the tested platforms, achieving an average speedup of 3.9 (7.3 on CPUs and 2.8 on GPUs) and maximum speedup of 10.6 on Intel UHD P630 GPU.
Index Terms:
Epistasis detection, CPU, GPU, CARMI Introduction
During the last years, Genome-Wide Association Studies (GWAS) [1] were able to show the relationship between the risk of an individual developing certain diseases with its genetic profile, through exploratory genetic analysis on data sets with groups of patients. With this information, the identified gene combination can be inspected by healthcare services, contributing to early diagnosis, prevention and provision of medical treatments personalized to each patient in order to reduce the risk of disease development [2]. Hence, understanding the genetic causes of such conditions can offer invaluable insight into future treatments, as well as to serve as a crucial part of early disease diagnostic and prevention. Genetic studies usually focus on Single-Nucleotide Polymorphisms, i.e., gene variations that occur in a nucleotide on a given position of a DNA sequence, which can interact with each other to cause a disease, in a process called epistasis. While some diseases, such as Crohn's disease, are related to an interaction between two SNPs, i.e., second-order epistasis [3], others can only be identified when considering high-order epistasis, i.e., interactions of three or more SNPs [4, 5].
To accurately identify the SNP interactions, it is necessary to exhaustively evaluate all the genetic combinations in a given biological data set. As the number of genetic interactions grows exponentially with the number of tested genes, this task becomes highly computationally demanding in modern computing systems, in particular when considering higher interaction orders. Evolutionary algorithms [6] or machine learning methods [7, 8] can be used to speed up epistasis detection by narrowing down the search space. These approaches may lead, however, to reduced accuracy in identifying epistasis. Thus, the use of exhaustive search methods is the only way to guarantee the identification of the most accurate solution. As such, achieving high performance execution of exhaustive search epistasis methods on modern computing systems is particularly important, and a crucial step in tackling the treatment and prevention of diseases in future healthcare options.
State-of-the-art approaches for exhaustive search of genetic interactions are typically deployed on Central Processing Units [9] and Graphics Processing Units [10, 11], although several works also target accelerators, and Field-Programmable Gate Arrays [12, 13]. Regarding CPUs and GPUs, there is a considerable variety of devices available from different vendors (e.g., Intel, AMD and NVIDIA), each with distinct capabilities and architectures. Given the broad optimization space that arises from resource diversity, correlating the characteristics of the underlying hardware and the execution behavior of epistasis detection becomes a challenge, which limits the ability to select the most suitable devices for high-performance execution. As this issue is not unique to epistasis detection, but also common to other bioinformatics applications that share similar specifics to the workload here considered, such as the use of population count instructions [14, 15, 16], the insights and the optimization/evaluation methodology herein proposed can also be applied to those applications, contributing to speed up the execution of several methods that evaluate genetic data. This can result in important implications on early disease detection and prevention, and in the well-being of the patients.
To tackle these issues, this work performs an exhaustive study on modern CPU and GPU architectures from different manufacturers, by proposing as case study several approaches to perform identification of three-way gene interactions. Each of the three-way epistasis detection approaches considered in this work are developed to exploit distinct hardware components in-built in current systems, which allows identifying specific micro-architectural features that are most relevant for attaining high-performance. This task is supported by the characterization of these approaches with Cache-Aware Roofline Model (CARM) [17]. The experimental evaluation is performed on 5 CPUs and 8 GPUs from different manufacturers, including state-of-the-art Intel Ice Lake SP and AMD Zen2 CPUs, and NVIDIA Ampere, AMD RDNA2 and Intel Xe GPUs, as well as previous architectures from each vendor. By considering past architectures, it is also possible to assess which micro-architectural features introduced through different generations benefit the identification of three-way gene interactions. To the best of our knowledge, this is the first attempt at tackling epistasis detection in all modern platforms, by also focusing on performance portability to efficiently explore the hardware resources offered by all main vendors. The proposed approaches are able to surpass the performance of state-of-the-art works in all platforms tested, achieving performance gains up to 10.6. This work features the following contributions:
-
•
CPU and GPU approaches111Available on (link to github repository) for third-order exhaustive epistasis detection, that exercise different hardware components in each computing device, which can be used to relate the capabilities of the underlying hardware and the specifics of the application;
-
•
characterization of the proposed CPU and GPU approaches in CARM, demonstrating how the utilization of different hardware components affects the execution of the applications, as well as to demonstrate the ability of the proposed methods to fully exploit all the capabilities of each type of device;
-
•
extensive three-way gene interactions study in state-of-the-art CPU and GPU architectures from three different vendors (Intel, NVIDIA and AMD), in order to decouple the micro-architectural components more relevant for a high-performance execution of exhaustive epistasis detection and bioinformatics applications in general.
This article is structured as follows. Section II contains the analysis of the state-of-the-art works in epistasis detection. Section III introduces the problem formulation of the epistasis detection. In Section IV, the approaches considered for third-order exhaustive epistasis detection in this work are detailed. Section V presents the results of experimental evaluation. Section VI concludes the work and presents future directions.
II Related Work
Several works in the state-of-the-art explore two-way and three-way epistasis detection, focusing mostly on targeting either multi-core CPUs [18, 9] or GPUs [9, 19, 20, 21]. This article proposes several optimized approaches for exhaustive epistasis detection in both CPU and GPU, and presents an assessment of the effects of improvements in architecture across several devices and platforms. Some works feature approaches for epistasis detection without exhaustive search [22, 23, 7, 8], as exhaustive search methods have a high computational complexity. These approaches offer higher performance at the cost of lower result accuracy.
The majority of works target second-order epistasis, with epiSNP [24], GBOOST [10], multiEpistSearch [25] and GWISFI [26] being examples. As higher epistasis orders have been linked to complex diseases, it is of great importance to propose high-performance approaches for this problem. MPI3SNP [27] is a reference work for third-order exhaustive epistasis detection, targeting multi-CPU/GPU clusters. While it uses a binary format to reduce data size, and bitwise logic operations, the work presented in this article proposes performance optimizations that allow to fully exploit the effectiveness of memory accesses on both CPU and GPU, using cache blocking and achieving coalesced memory accesses.
Due to the data-parallel nature of this application, various relevant works focusing on identifying three-way gene interactions use GPUs. These include [28], which uses NVIDIA GPUs, and [29], which uses NVIDIA GPUs alongside a CPU. However, such works focus on devices from a single vendor, which does not guarantee their applicability to other GPUs architectures. The approaches herein proposed also focus on portability in order to make use of hardware that is widely available in current computing devices. This allows to deploy the developed applications in platforms with multiple CPU and GPU, providing the means to select the most suitable device to perform exhaustive three-way epistasis.
A different approach is taken in works [20] and [21], that target NVIDIA GPUs for third order exhaustive epistasis detection, but specifically make use of the tensor cores available in newer NVIDIA architectures. However, to target these specific units, it is necessary to rely on vendor specific programming frameworks and constructs (e.g. CUDA for NVIDIA), restricting the application deployment to specific GPUs. To provide portability across different devices and device types from different vendors, the approaches herein proposed are deployed using DPC++, which currently does not provide support for tensor cores. Although the proposed approaches do not directly exploit the features of this specialized hardware, they are devised to efficiently exploit the compute capabilities of current and upcoming CPU, and GPU platforms.
The work in [30] uses CPU and GPU in a collaborative way, performing two-way and three-way epistasis detection using CPU and GPU. However, the proposed framework focuses on the architectures of Intel CPUs and integrated GPUs. To the best of our knowledge, the work proposed in this manuscript is the first to feature experimental evaluation of highly-optimized approaches for exhaustive three-way gene interactions for CPU and GPU architectures on devices from all main vendors. This allows to identify the main hardware features present in current computing systems that result in an efficient execution, enabling the selection of the most suitable devices to speedup the evaluation of three-way gene interactions, leading to improvements in the performance of bioinformatics applications and consequently the development of future techniques of disease diagnostic.
III Problem Formulation
Epistasis detection aims to relate the occurrence of phenotypic characteristics in individuals to interactions between SNPs. To do so, it relies on data sets containing the genetic information of a set of SNPs and patients/samples contained in a case-control data set D, with size , where N is the number of samples and M is the number of SNPs. Each entry D[i,j] in the data set corresponds to the genotype value of the i-th SNP for the j-th sample, with and . Entries D[M+1,j] correspond to the phenotype value, or disease state, for the i-th sample. The genotype can take values 0 (homozygous major allele), 1 (heterozygous allele) or 2 (homozygous minor allele), and the phenotype values can be either 0 (control) or 1 (case).
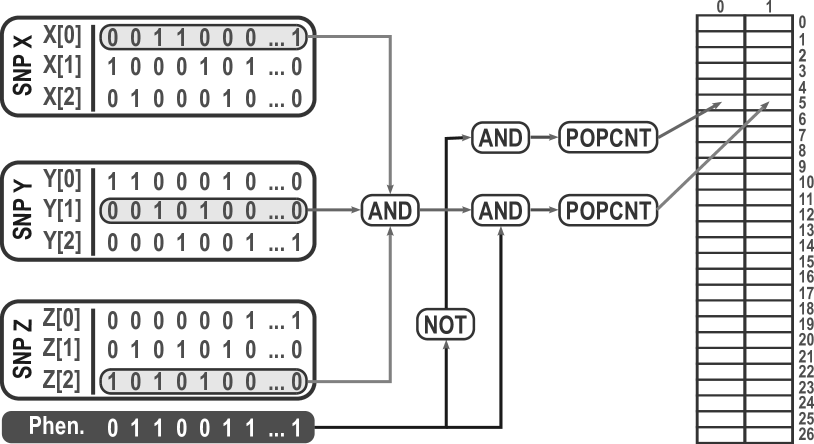
As the data sets containing the genetic information can have a large amount of samples and SNPs, it is crucial to reduce their memory requirements in order to achieve better performance. For this reason, this work considers the binarized format proposed in [31]. As it can be observed in Figure 1, a given SNP X is represented by three arrays (X[0], X[1] and X[2]), on per each possible value of the genotype. The information for each sample is encoded in a single bit in each component, depending on the correspondent genotype. The phenotype is also represented in a binary format, with each bit indicating the phenotype for a given sample.
Furthermore, the analysis of the genetic interaction on the D[i,j] is supported by a frequency table that stores the occurrence of each genotypic combination across all case and control samples. As the genotype can assume three distinct values (0, 1 or 2), for three-way epistasis detection this frequency table has a size of rows, and 2 columns, one for controls and one for cases. As exemplified in Figure 1, the naïve approach to fill the cells that correspond to the genotypic combination , an AND operation is done with the components , and , followed by an AND with the negated phenotype (controls) or by an AND with the phenotype (cases). Finally, a POPCNT operation is applied to both outputs with the result being added to the frequency table. This process is performed for all possible genotype/phenotype combinations for the considered SNPs, and is repeated until the information on all patients has been obtained.
Following this process, the information gathered in the frequency table is used to evaluate the SNP combination. This is done by using objective functions that rely on biological and statistical criteria, in order to measure the likelihood of a gene combination being epistatic. This work considers the Bayesian K2 Score objective function [32], which is based on Bayesian network principles. For a given combination of SNPs, the K2 Score is given by
| (1) |
with being the number of possible genotypic combinations among SNPs (), the number of diseases status ( in case-control scenarios), the frequency of a certain genotypic combination at the evaluated SNPs , and the number of samples that satisfy the occurrence of the phenotypic state with the genotypic combination at the evaluated SNPs. The solution to the problem is the SNP combination with the lowest K2 Score.
IV Three-way Gene Interaction Detection Approaches for Multiple Execution Scenarios
In order to relate the characteristics of the underlying hardware and the specifics of the algorithm to perform evaluation of three-way gene interactions, this work considers four different methods to perform this task. Each method is expected to exercise different components of CPUs and GPUs, and the utilization of profiling tools and insightful modeling allows to assess which one is more suitable to achieve high performance in current hardware. In this work, all approaches use 32-bit integers to compress the input data set, due to their compatibility with all the considered devices/architectures.
IV-A CPU Approaches
As the biological data sets considered for the evaluation of gene interactions can contain thousands of samples and SNPs, the naïve approach presented in Figure 1 is expected to be completely memory bound by the bandwidth of the slower memory levels, i.e. LLC and Dynamic Random Access Memory (DRAM). Hence, the only possibility to achieve high-performance execution with this approach would be to drastically increase the capacity and bandwidth of L1 and/or L2 caches, a configuration not present in current hardware.
One solution for this issue is to reduce the memory requirements of the algorithm. Since the genotype can have at most three values, the component of SNP X correspondent to the genotype 2 (X[2]) can be inferred from X[0] and X[1] through a NOR operation. The data set can also be divided in two components, one containing all control samples, and other containing all cases. This way, each SNP is represented by four arrays, two per each phenotype, and the phenotype array is not required in the frequency table construction for the evaluation of each gene combination, further reducing the computational requirements of the application. With these optimizations, the amount of memory transfers is expected to reduce by 1/3. However, while the first method would require a total of compute instructions to evaluate all the genotype combinations for each processed element, by removing the phenotype, this task only requires a total of NOR AND POPCNT , i.e., the amount of computations performed will reduce around 65%. This hints to a reduction of the Arithmetic Intensity (AI) of the application, indicating the possibility for the kernel to become more memory bound.
In this scenario, a third method to perform epistasis detection can include loop tiling techniques to improve the data locality, maximizing the cache utilization. Since cache blocking techniques do not affect the amount of memory transfers and performed computations, the AI is not expected to change and the performance of the kernel will likely improve. As observed in Algorithm 1, in this method to perform three-way epistasis detection, each CPU core tackles simultaneously three blocks with SNPs and samples. Each block is controlled by the loop variables and , while the variables and iterate over the SNPs contained in each block. Similarly, the variable controls the block and the loop iterates over each sample. With this approach, up to combinations can be processed simultaneously, thus requiring a frequency table array of size . Per each valid combination, the genotypes 0 and 1 of each SNP correspondent to controls () and cases () are loaded from memory, making a total of six loads per evaluated combination. The components of the genotype 2 are obtained with the three NOR operations, one per each SNP. The next step is the evaluation of the gene interaction for all the possible genotype combinations through the AND and POPCNT instructions, and the output is used to update the frequency table . After all samples are evaluated, the score is obtained from the get_score function. To parallelize this algorithm, each core fetches a task from a thread pool. Each thread performs a set of combinations, which can be defined dynamically in order to improve load balancing. To avoid synchronization barriers between tasks, the scores are kept locally to each thread and a final reduction is performed to obtain the global solution.
The parameters and used for loop tiling are determined according to the capacity of the L1 data cache, by defining a maximum size for the frequency table () and for each block (), such that both these components fit in the first cache level. As the frequency table occupies bytes, with B for 32-bit integers, can be determined through the equation . After defining , can be calculated through the equation . With this, the optimal values for and can be determined for each CPU, allowing for this implementation to achieve efficient cache blocking in the different CPUs. For example, for an Intel Ice Lake SP CPUs with a L1 data cache of 48 kB, if seven ways are used for the frequency table ( kB) and four ways for the block ( kB), then and .
After introducing cache blocking, the application performance is likely to become limited by the compute capabilities. Thus, the fourth (and final) approach considered herein focuses on code vectorization, through the use of vector intrinsics for the LOAD, NOR, AND and POPCNT instructions in Algorithm 1. As different CPU architectures are used in the scope of this work, different vectorization strategies are necessary depending on the target CPU. In the case of CPUs that support at most AVX instructions, such as AMD Zen and Zen2 and Intel Kaby Lake architectures, the LOAD and AND operations are performed through the intrinsics _mm256_loadu_si256 _mm256_and_si256, while for processors that support AVX512 instructions, the intrinsics _mm512_loadu_si512 _mm512_and_si512 are used instead. Furthermore, as none of the AMD and Intel processors support vectorized NOR, this instruction is vectorized through the use of a vector OR (_mm256_or_si256 or _mm512_or_si512) followed by a vector XOR (_mm256_xor_si256 or _mm512_xor_si512) with a vector with all bits set to one. Regarding the POPCNT instructions, with the exception of Intel Ice Lake SP, the CPUs only support scalar POPCNT. Thus, to update the frequency table, this operation is applied to each element of the vector, which is extracted with the instructions_mm256_extract_epi64 for AVX, or _mm256_extract_epi64 and _mm512_extracti64x4_epi64 for AVX512. For Intel Ice Lake SP, as it supports AVX512 vector POPCNT (_mm512_popcnt_epi32), each position of the frequency table is updated by applying a reduction operation (_mm512_reduce_add_epi32) to the POPCNT outputs.
IV-B GPU Approaches
Similarly to the CPU approaches, the method to perform three-way gene interactions presented in Figure 1 is expected to be completely limited by the main memory of the GPU. For this reason, the second approach considered for the GPU follows the optimizations introduced in the CPU, i.e., inferring genotype 2 from the other genotypes, and separating the data set according to the phenotype. As the AI is expected to reduce, to further improve the performance of this method, additional memory-related optimizations are implemented.
| System |
|
Cores |
|
||||
|---|---|---|---|---|---|---|---|
| CI1 |
|
6 | 256-bit (AVX) | ||||
| CI2 |
|
(2x)18 | 512-bit (AVX512) | ||||
| CI3 |
|
(2x)36 | 512-bit (AVX512) | ||||
| CA1 |
|
64 | 128-bit (AVX) | ||||
| CA2 |
|
16 | 256-bit (AVX) |
Since the evaluations of SNP combinations are independent from each other, the best way to parallelize the algorithm in a GPU is to attribute each thread to a single combination. However, the input data presented in Figure 1 contains the SNPs placed in rows and the samples in columns, which prevents coalesced memory accesses, since each SNP is separated in memory by N samples. Hence, the third method herein proposed considers a transposed data set, such that the SNPs are organized by columns and the consecutive samples are organized in rows. This increases the chances of consecutive threads using data that is stored consecutively in memory, leading to coalesced memory accesses loads instead of memory gather and scatter operations.
Despite this, in larger data sets, this approach will likely suffer from memory bottlenecks, as each sample is separated in memory by M SNPs. To mitigate this issue, the fourth GPU procedure is tiled with the SNPs organized in blocks of size , by placing SNP values from the same sample adjacently. This allows to improve memory accesses and cache utilization. With this organization, and by defining the size of each group of threads to be , the chances of achieving coalesced memory accesses increase, by maintaining an interval of between consecutive samples for the same SNP. The optimal value of depends on the target GPU, but for most architectures is defined as a multiple of 32 or 64.
The GPU kernel correspondent to the fourth GPU approach is represented in Algorithm 2. Each enqueueing of the GPU kernel receives multiple blocks of combinations from the CPU, processing them in succession until all combinations have been evaluated. The value of is defined empirically for each GPU device, in order to maximize performance on each GPU architecture. Each kernel execution contains threads, with each kernel instance processing one combination. As it can be observed in Algorithm 2, the assigned SNP combination is obtained from the multi-dimensional thread index. The frequency table is created and initialized in the private memory, eliminating the need for synchronization between different threads, and making use of the fast-access memory in the GPU general register file. The frequency table is filled by going through all samples in the data set. Following the completion of the frequency table , the score for the combination is obtained with the function get_score. Each GPU thread compares the value of the current score to its current best score, and updates it if necessary. Following the processing of all combination blocks, the final solution is determined in the CPU host from the best scores obtained by all GPU threads.
V Experimental Results
The experimental evaluation herein performed aims at assessing the impact of micro-architectural improvements when executing third-order epistasis detection across different generations of computing systems. As first step, the CPU and GPU approaches (Section IV) are characterized in CARM [17, 33], contained in Intel® Advisor 2021.4, which is part of the Intel® oneAPI toolkit, to identify the more suitable method to achieve high-performance execution.
| System |
|
|
|
|
||||||||
|---|---|---|---|---|---|---|---|---|---|---|---|---|
| GI1 |
|
24 | 192 | 4* | ||||||||
| GI2 |
|
96 | 768 | 4* | ||||||||
| GN1 |
|
30 | 3840 | 32 | ||||||||
| GN2 |
|
80 | 5120 | 16 | ||||||||
| GN3 |
|
72 | 4608 | 16 | ||||||||
| GN4 |
|
108 | 6912 | 16 | ||||||||
| GA1 |
|
60 | 3840 | * | ||||||||
| GA2 |
|
120 | 7680 | * | ||||||||
| GA3 |
|
80 | 5120 | * |
The most suitable version is then used to perform an extensive study on CPUs and GPUs, from Intel, AMD and NVIDIA, in order to decouple the most relevant micro-architectural features for the execution of three-way epistasis detection. The devices considered in this work are summarized in Tables I and II. In this work, NVIDIA multiprocessors, Intel execution units and AMD compute units are referred as compute units (CU), and CUDA cores, Intel GPU SIMD4 instances and AMD stream cores are referred as stream cores. From Intel, we consider the Skylake (CI1), Skylake SP (CI2) and Ice Lake SP (CI3) micro-architectures. The AMD CPUs have the Zen (CA1) and Zen2 (CA2) micro-architectures. While the CPUs CI2 and CI3 support AVX512 instructions, CI1, CA1 and CA2 can at most perform AVX instructions. This work also considers two of the latest Intel GPU architectures, i.e., Gen9.5 (GI1) and Gen12 (GI2), as well as, the AMD Vega20 (GA1), CDNA (GA2) and RDNA2 (GA3), and NVIDIA Pascal (GN1), Volta (GN2), Turing (GN3) and Ampere (GN4). As observed in Table II, these GPUs have distinct POPCNT capabilities, which is one of the main instructions in epistasis detection. GN1 has the highest throughput, of up to 32 POPCNT per cycle and compute unit, while both Intel GPUs are only able to perform 4 POPCNT per cycle and compute unit.
The GPU approaches are implemented by using the SYCL framework, i.e., the DPC++ programming model, to deploy the application in GPUs from any vendor while maintaining a high level of performance portability. DPC++ uses as back-ends CUDA 11.4 for NVIDIA, ROCm 4.2 for AMD, and Intel Level-Zero for Intel GPUs. Due to the lack of support for population count instructions in HIPSYCL, DPC++ does not guarantee a fair comparison between CPUs of different vendors. Thus, OpenMP programming model with dynamic scheduler is used instead, and the application is compiled with GCC-9.3 across all CPU processors. The CPU approaches are vectorized with vector intrinsics, which are transversal to any of the considered x86 processor from AMD and Intel.
To compare devices with different core counts, frequencies and vector widths, the performance is scaled to the number of cores and vector width for CPUs, and to the number of computing units and stream cores for GPUs. To compare data sets with different dimensions, the performance is represented as the total number of elements processed per second or per cycle. The total number of elements is defined as the amount of processed combinations multiplied with the number of samples, i.e., , where is the number of -combinations in a set of items, is the number of SNPs, the interaction order, and the number of individual samples. The experimental results are obtained for synthetic data sets equivalent to real case scenarios, containing SNPs ranging from 2048 to 8192 and 16384 samples.
per core.
per core.
V-A Characterization in Cache-Aware Roofline Model
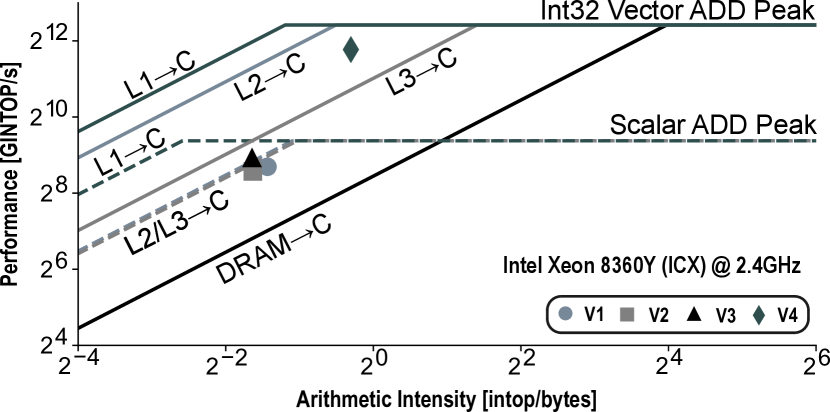
Figure 2 presents the characterization in CARM of the different methods to perform three-way epistasis detection on the CI3 CPU (Figure 2(a)), and GI2 GPU (Figure 2(b)). For Intel Ice Lake SP (CI3), the baseline algorithm (V1) is limited by the memory bandwidth of one of the slower memory levels, in this case the scalar L3 bandwidth roof. By removing the third genotype and the phenotype (V2), as expected, this approach suffers from a reduction in the AI, indicating a bigger impact of the memory and continues to be limited by the scalar L3 bandwidth roof. Although compared to the method V1, V2 achieves a speedup in the execution time around 2x, there is an apparent loss of performance due to a reduction of 2.1x on the amount of performed computations. Incorporating cache blocking in V3 resulted in an improvement in performance around 1.2x, moving the kernel to the top of L2 cache scalar roof and right below the scalar ADD roof, indicating that the application is limited by the compute roof and private caches. By vectorizing the application (V4), there is an performance increase of 7.5x compared to V3, and the kernel is now bound by the integer vector ADD peak. In comparison to the baseline algorithm, the performance increased 8.5x.
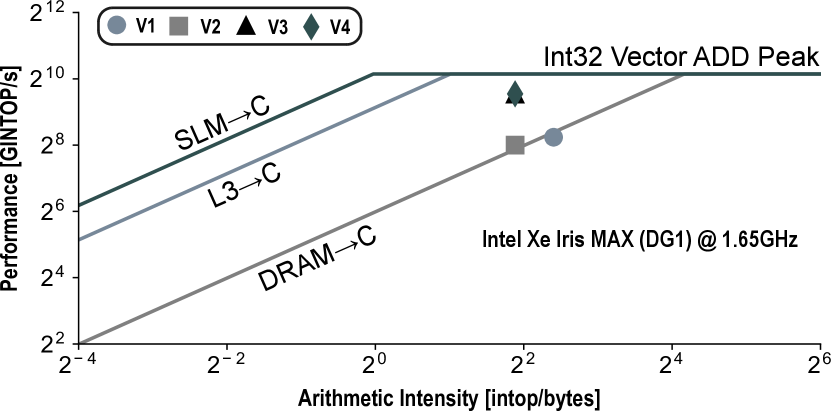
Similar insights can be obtained from the characterization of the GPU approaches on CARM. As shown in Figure 2(b), the naïve procedure (V1) is completely memory bound by the DRAM bandwidth. By inferring the genotype 2 from genotypes 0 and 1, and by splitting the data set in cases and controls (V2), there is a decrease in AI, similar to the effect that occurs on CPU. The performance also decreases, despite the improvement on the execution time around 1.79x when compared to V1. This is mainly due to the decrease of 47.5% in the number of transferred bytes of memory being overshadowed by the decrease in total number of operations (2.11x). While V2 is still mainly limited by DRAM, with the data set transposition, the coalesced memory accesses in the third method (V3) guarantee a significant performance increase, showing the efficacy of using the transposed data set. With the data set tiling introduced in the last GPU method (V4), there is slightly improvement in performance, placing the application closer to the maximum performance of 32-bit integer vector instructions.
From this analysis, it is possible to conclude that to fully exploit current CPUs and GPUs, the fourth approach of each device is the most suitable to achieve high-performance execution, which will be used to experimentally evaluate the capabilities of the different CPU and GPU micro-architectures. Although the score calculation is included in the kernel evaluation of each considered approach, its contribution for the total execution time is residual, and only around 4%, according to Intel® Advisor. Thus, the performance represented in CARM corresponds mostly to the frequency table construction, i.e., the most computational demanding part of epistasis detection.
V-B CPU Evaluation
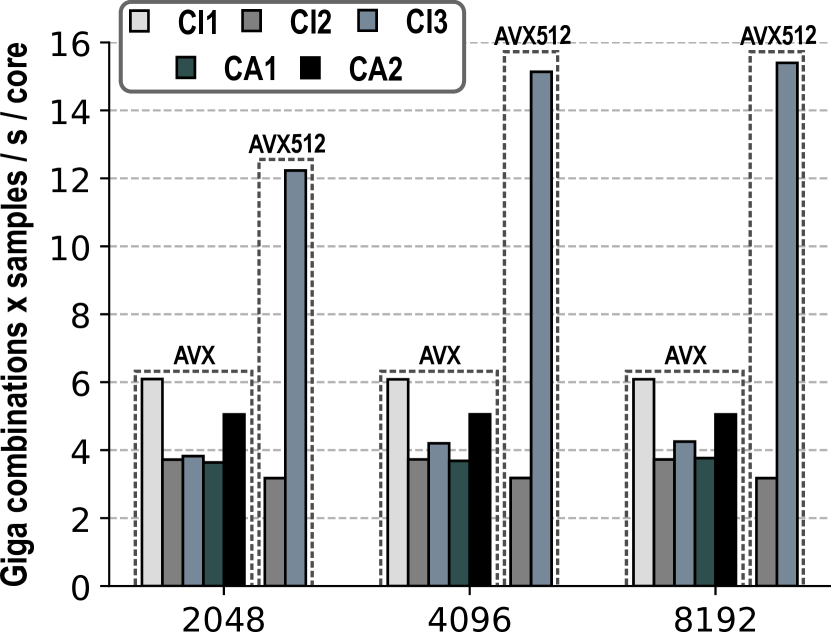
The performance results obtained for different data sets on diverse CPUs from Intel and AMD are presented in Figure 3. To perform a fair comparison between Intel processors that support AVX512 and the remaining systems, the AVX version of the algorithm used on the other processors is also executed on CI2 and CI3. The tiling parameters <> used in the CPU approach are calculated by defining the size of the frequency table to fit in 7 ways of the L1 data cache in all CPUs. Since Ice Lake SP has a larger L1 data cache with 12 ways, the size of each block is defined to occupy 4 ways in CI3, leaving one way for the prefetcher to exploit. Since the other systems only have a total of 8 ways, the size of each block is defined to occupy the remaining way. Thus, the experimental results on the CPU are obtained with the configuration <> for CI3, and <> for the remaining CPUs. is rounded to the closest multiple of the number of 32-bit integers that fit in the vector registers.
per compute unit.

per compute unit.
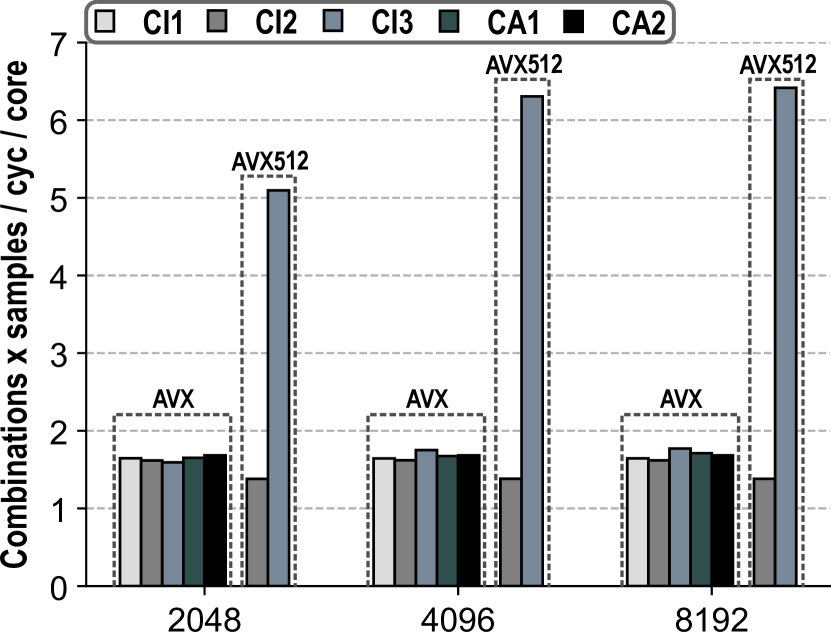
The performance as the number of processed elements per second and per core is presented in Figure 3(a). As observed, the maximum performance is achieved by CI3 when using AVX512 vector intrinsics. For example, for 8192 SNPs, AVX512 CI3 attains a performance around 15.4 Giga combs. x samples / s / core, i.e., 2.5x and 4.8x higher than CI1 and AVX512 CI2, respectively. For the same data set and compared to the AMD CPUs, AVX512 CI3 delivers a performance per core 4x and 3x higher than CA1 and CA2, respectively. The higher performance on CI3 arises from the support of vector POPCNT instructions introduced in the Ice Lake SP micro-architecture, which allows to fully use the vector capabilities of the processor when performing epistasis detection. For the remaining systems, the lack of vector POPCNT instructions imposes the utilization of scalar POPCNT, reducing performance. When using AVX512 instructions, CI2 (Skylake SP) achieves a performance lower than any other CPU. As the Skylake SP micro-architecture requires the utilization of two extract instructions per each scalar POPCNT when using AVX512 instructions, it imposes additional overheads. This effect is amplified by the frequency reduction that occurs in this architecture when using AVX512 instructions. In fact, when deploying the epistasis detection approach with AVX intrinsics on CI3 and CI2, the results show that the maximum performance is achieved by CI1 (6 Giga combs. x samples / s / core), followed by CA2 which attains a performance around 5 Giga combs. x samples / s / core. CI2, CI3 and CA1 achieve similar performance per core.
When performing AVX instructions, the higher performance of CI1 and CA2 when compared to the other CPUs mainly arises from the higher frequency of these systems (see Table I). When considering the performance as the elements processed per cycle and per core (Figure 3(b)), the approach vectorized with AVX intrinsics attains similar performance in all devices. In the case of CA1 and CA2, the increase in the vector width from 128-bit to 256-bit between Zen and Zen2 micro-architectures did not benefit the execution of three-way epistasis detection, due to the lack of vector POPCNT instructions, resulting in similar performance. Similarly to the performance per second and per core, AVX512 execution on CI3 achieves the highest performance per cycle, i.e., approximately 3.8x higher than all the remaining CPUs.
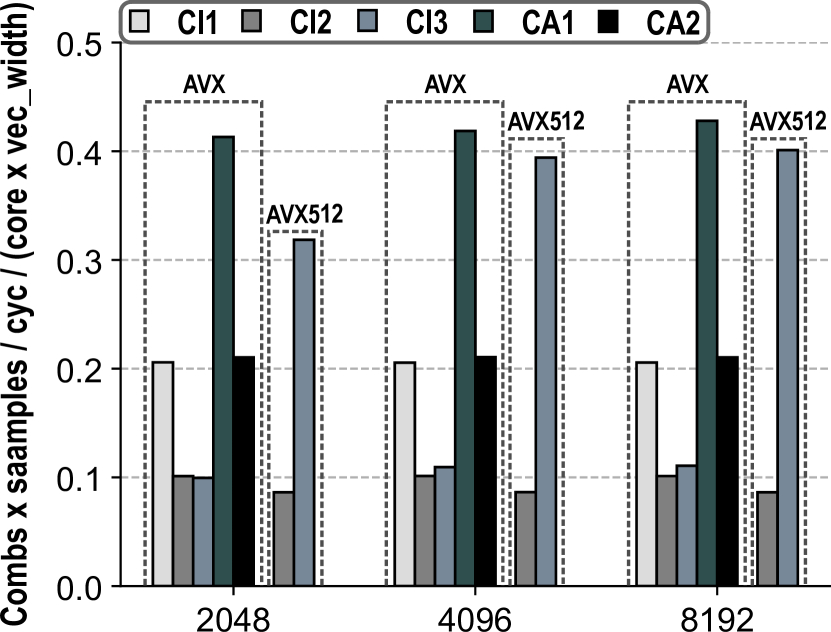
To assess the utilization efficiency of the vector units on the CPUs, the performance as the number of element processed per cycle and per core is also scaled to the number of elements of 32-bit that fit in the vector width of each CPU (Figure 3(c)). The maximum performance is attained by CA1 and AVX512 CI3 and around 0.4. While in CA1 the high vector occupancy is due to its reduced vector width coupled with scalar POPCNT instructions, for AVX512 CI3 this indicates that the usage of vector POPCNT instructions allows to achieve a good occupancy of the vector units of Intel Ice Lake SP. The performance in CA2 is half of the obtained in CA1 demonstrating that the lack of vector POPCNT instructions does not allow to fully use the wider vector width contained in the Zen2 micro-architecture, resulting in poor vector efficiency. For the same reason, CI1 achieves a performance up to 2.4x higher than CI2, since due to the lack of vector POPCNT, it is not possible to take advantage of the increase in the vector width from 256-bit to 512-bit in Skylake SP.
V-C GPU Evaluation
The performance results on Intel, NVIDIA and AMD GPUs are presented in Figure 4. The configuration <> used in the best epistasis detection approach on the GPU was defined empirically in order to maximize the performance in each device. The results presented in Figure 4 were obtained with the following parameters: <256, 64> for GI1 and GI2, <256, 32> for GN1 and GA3, <256, 64> for GN2, GN3 and GN4, and <128, 64> for GA1 and GA2.
| SoA Work | SNPs | Samples | Device |
|
|
Speedup | ||||
| MPI3SNP [27] | 10000 | 1600 | NVIDIA Titan V | 663.4 | 1085.7 | 1.64 | ||||
| NVIDIA Titan RTX | 716.9 | 1069.9 | 1.49 | |||||||
| (2x) Intel® Xeon® Platinum 8360Y | 38.8 | 224.4 | 5.78 | |||||||
| AMD EPYC 7302P | 11.7 | 67.1 | 5.74 | |||||||
| 40000 | 6400 | NVIDIA Titan V | 570.7 | 1892.1 | 3.31 | |||||
| NVIDIA Titan RTX | 573.6 | 2170.3 | 3.78 | |||||||
| (2x) Intel® Xeon® Platinum 8360Y | * ( 20 days) | 818.3 | 21.09 | |||||||
| AMD EPYC™ 7302P | * ( 67 days) | * ( 10 days) | 6.70 | |||||||
| [29] | 8000 | 8000 | NVIDIA Titan Xp | 1443.0 | 1279.9 | 0.89 | ||||
| NVIDIA Titan V | 1876.0 | 1936.0 | 1.03 | |||||||
| NVIDIA Titan RTX | 2140 | 2239 | 1.05 | |||||||
| NVIDIA A100 (250W) | 2694 | 2732 | 1.01 | |||||||
| AMD Instinct Mi100 | N/A | 2249 | N/A | |||||||
| [30] | 1000 | 4000 | Intel® Graphics UHD P630 | 5.9 | 62.3 | 10.56 | ||||
| Intel® Core™ i7-8700K | 2.9 | 30.3 | 10.45 |
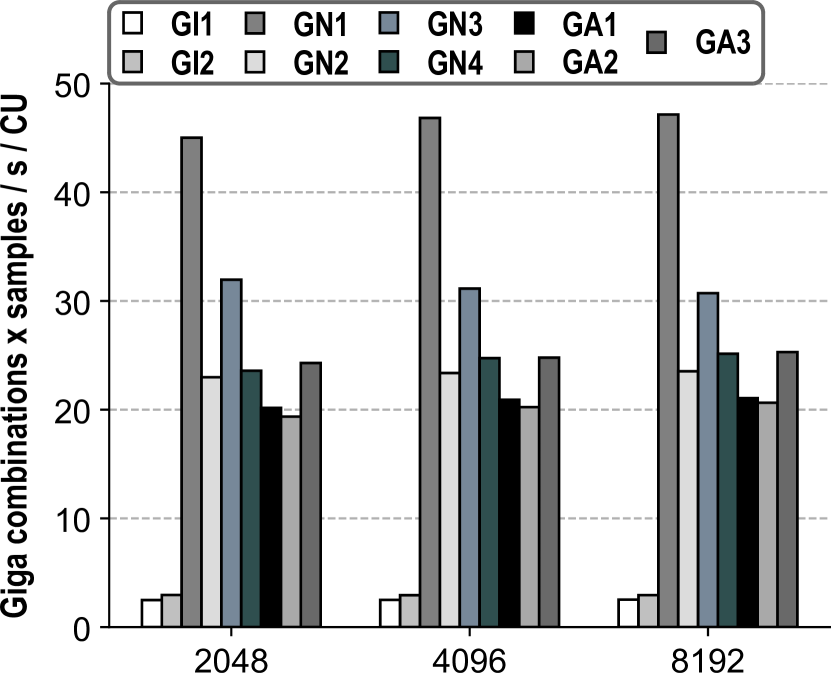
Regarding the performance as the elements processed per second and per compute unit (Figure 4(a)), the highest performance is achieved by GN1 (Titan Xp). For example, for 2048 SNPs, GN1 achieves a performance per compute unit 2x higher than GN2 (Titan V), 1.4x higher than GN3 (Titan RTX) and 1.9x higher than GN4 (A100). As shown in Table II, the higher performance per compute unit of GN1 arises from the higher POPCNT throughput per compute unit on Titan Xp (32 POPCNT per cycle) in comparison to Titan V, Titan RTX and A100 (16 per cycle) [34]. For the AMD GPUs, GA1 (Mi100) and GA2 (Radeon Pro VII) attain a similar performance and lower than GA3 (RX 6900 XT). Although the throughput of POPCNT per compute unit on GA1 and GA2 (12 per cycle) is higher than the one on GA3 (10 per cycle), the higher frequency of GA3 allows this GPU to attain higher performance than GA1 and GA2. Similarly for Intel GPUs, the higher frequency of GI2 results in slightly higher performance than GI1, as both GPUs have the same POPCNT throughput per compute unit.
The effect of the frequency can be isolated by considering the performance as the elements per cycle and per compute unit (Figure 4(b)). While the maximum performance is still achieved by GN1, the difference between GN2, GN3 and GN4 reduces, indicating that the main differentiating factor between Titan V, Titan RTX and A100 when performing epistasis is the higher frequency of Titan RTX. For AMD, the performance of GA1 and GA2 is higher than GA3, corroborating with the POPCNT information in Table II. For Intel GPUs, without the effect of frequency on performance, it is possible to verify that the performance per compute unit is similar on both devices, with GI1 having a slight advantage over GI2.
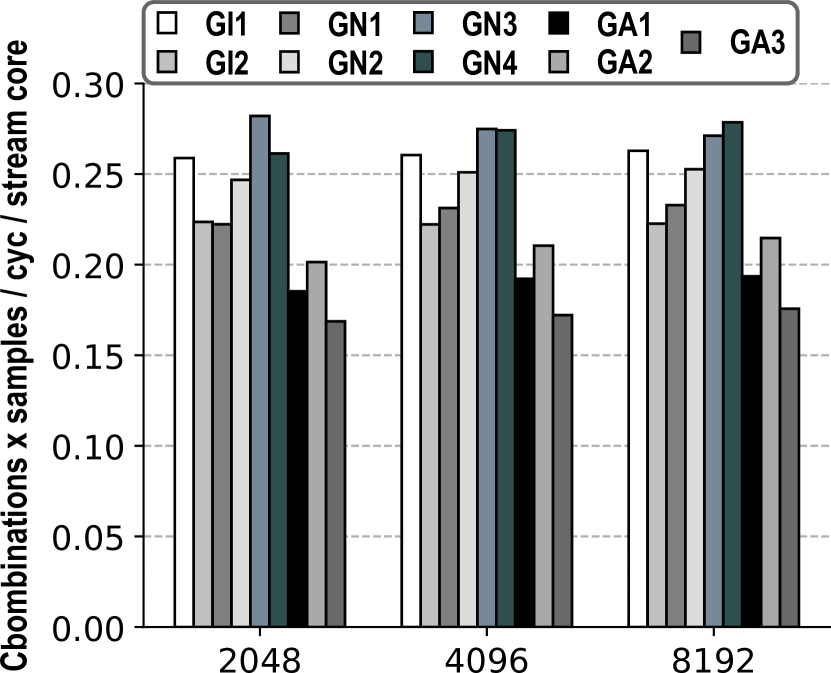
To assess the occupancy of the computing units, the performance is also scaled to the number of stream cores (Figure 4(c)). Intel and NVIDIA GPUs achieve similar performance (between 0.27 and 0.23 combs. x samples / cyc / stream core), indicating that the ratio of available units for POPCNT and the total number of stream cores is similar on these GPUs. As the architecture of the stream cores of GN3 and GN4 are similar, they achieve similar maximum performance and around 0.27 combs. x samples / cyc / stream core. The lower number of stream cores that support POPCNT on AMD GPUs results in lower occupancy than Intel and NVIDIA achieving a performance between 0.175 (GA3) and 0.21 (GA1) combs. x samples / cyc / stream core.
V-D Comparison between CPUs and GPUs
By comparing the performance of the CPUs scaled to the number of cores and vector width (Figure 3(c)) and the GPU performance per cycle and per stream core (Figure 4(c)), it is possible to observe that the performance of CI1, CA1, CA2 and AVX512 CI3 is similar to the performance of GPUs. Hence, the higher performance on GPUs relatively to the CPUs when evaluating three-way gene interactions mainly arises from the high number of stream cores. The sole exception is CA1, which attains high performance due to the reduced vector width coupled with the scalar POPCNT. This shows that for a CPU to achieve an overall performance close to the GPUs when performing three-way epistasis detection, it must feature wider vector units and with a higher core count, increasing the number of elements that can be processed simultaneously.
Since the best approaches on CPU and GPU are compute bound, their performance is highly dependent on the performance of POPCNT. For this reason, to maximize CPU performance, it is crucial to support vectorized POPCNT, in order to take full advantage of the vector units. For the GPU, the same insights can be derived for the number of stream cores that support POPCNT instructions, since as more cores support it, the higher the performance is expected to be in these devices. The clock frequency and number of cores are also highly relevant when evaluating of three-way gene interactions, as shown in Figures 3 and 4. Due to its compute bound nature, the performance of the application is expected to scale linearly with the number of cores/compute units and frequency. Thus, devices with a higher core count and more compute units coupled with high frequency are better suited for high-performance execution on current CPUs and GPUs.
Another solution to speed up three-way epistasis detection is to use heterogeneous systems with CPU+GPU. However, most of the evaluated CPUs attain a performance much lower than the one achieved with GPUs, which translates to a poor performance improvement for heterogeneous approaches. For example, while the NVIDIA Titan RTX (GN3) achieves a maximum overall performance around 2200 Giga combs. x samples / s, the Intel 8700K (CI1) and AMD EPYC 7601 (CA1) only achieve a maximum performance around 36.5 and 241 Giga combs. x samples / s, respectively. From the CPUs considered in this work, the Intel Ice Lake SP (CI3) is the most suitable CPU to be incorporated in a heterogeneous approach, since it is able to deliver a performance around 1100 Giga combs. x samples / s, i.e., half of the NVIDIA Titan RTX. A heterogeneous solution with CI3+GN1 would be expected to achieve a performance up to 3300 Giga combs. x samples / s.
The experimental results for the GPUs also show that the portability provided by the proposed approaches allows to achieve high-performance execution on devices with different characteristics. For example, when comparing AMD Mi100 and NVIDIA Titan RTX GPUs, AMD Mi100 is able to deliver higher performance (around 2.5 Tera combs. samples / s) than the one offered by NVIDIA Titan RTX (around 2.3 Tera combs. samples / s). Of the tested GPUs, only the most recent NVIDIA GPU, i.e., NVIDIA A100 is able to surpass the performance offered by AMD Mi100, achieving around 2.7 Tera combs. samples / s. In this scenario, the epistasis detection approaches proposed in this work have the potential to efficiently support multiple different architectures, as well as current and future devices.
On the other hand, while NVIDIA and AMD GPUs are the most suitable devices to attain high performance, since they are able to deliver an overall performance above 2000 Giga combs. x samples / s, from an efficiency aspect, the best device is the Intel Iris Xe Max (GI2). Although this GPU only delivers an overall performance up to 282.1 Giga combs. x samples / s, this is achieved with a TDP of 25 W, attaining an estimated efficiency of 11.3 Giga combs. x samples / J. In comparison, NVIDIA Titan RTX delivers a performance of 2200 Giga combs. x samples / s with a TDP of 280W, i.e., an efficiency of 7.9 Giga combs. x samples / J. In this scenario, the Intel Iris Xe MAX GPU is the most appropriate device to efficiently verify if a patient has a high risk of developing a certain disease on personalized healthcare services, by knowing a priori which SNPs to evaluate. For exploratory analysis on entire data sets, high-performance devices are the best choice.
V-E Comparison with state-of-the-art
The performance of the best approach for three-way epistasis detection proposed in this work is also compared against state-of-the-art works on three-way epistasis, namely MPI3SNP [27], and the works presented in [29] and [30]. The MPI3SNP results were obtained by executing the application on the experimental platforms used in this work, with the data sets contained in the project repository222https://github.com/UDC-GAC/mpi3snp/wiki/Sample-files. Similarly, the results for [29] were obtained through experimental evaluation on the considered devices. The values from [30] are directly obtained from the respective manuscript.
As observed in Table III, the best approach for three-way gene interactions proposed in this work attains higher performance than MPI3SNP. For the data set containing 10000 SNPs and 1600 samples, the proposed approach attains a performance 1.6x and 1.5x higher in Titan V and Titan RTX, respectively. For the Intel 8360Y and AMD 7302P, the performance gains are up to 5.8x. As for the data set with 40000 SNPs and 6400 samples, the approach proposed in this work attains a performance 3.3x higher than MPI3SNP for Titan V, and 3.8x higher for Titan RTX. For the CPUs, due to the unreasonable execution time of MPI3SNP in Intel 8360Y and AMD 7302P, we assumed that for this data set, the performance of MPI3SNP is equal to the one obtained for data set with 10000 SNPs and 1600 samples. In this scenario, it is expected that the best approach considered in this work achieves performance gains up to 21.1x in the Intel 8360Y. In fact, while our approach was able to process the data set containing 40000 SNPs and 6400 samples in approximately 1 day on an Intel 8360Y, the MPI3SNP is expected to take approximately 20 days on the same machine.
While maintaining a focus on performance portability, our approach is still able to be on par with a highly optimized and hand-tuned CUDA algorithm for three-way epistasis detection, while being deployed using DPC++. This is observed particularly in the most recent NVIDIA architectures, where our approach provides slight performance improvements over the work in [29] for Titan V, Titan RTX and A100. Furthermore, when considering the performance of our approach on the AMD Instinct Mi100, results show that supporting portability between different architectures can lead to higher performance. While the work in [29] cannot be run on this device, the performance obtained by our approach is 1.56, 1.20 and 1.05 higher when compared to [29] in NVIDIA Titan Xp, Titan V and Titan RTX, respectively. These results constitute, to the best of our knowledge, the highest performance obtained for a three-way exhaustive epistasis detection approach on AMD GPUs. Only the most recent NVIDIA GPU (A100) is able to surpass the performance of the AMD Mi100 by 1.2. For the Intel Gen9.5 GPU, the proposed approach attains a performance around 62.3 Giga combs. x samples / s, i.e., 10.6x higher than the performance obtained in [30], while for Intel 8700K, the performance of the proposed method is 10.4x higher than the one obtained in [30].
VI Conclusions and Future Work
To achieve the goals of personalized healthcare, the development of bioinformatics applications that relate patient genetic data with the risk of disease development is essential. Exhaustive epistasis detection constitutes one such application, relying on large biological data sets and complex operations to identify gene interactions. This work proposes a set of approaches for three-way exhaustive epistasis detection on modern CPUs and GPUs, that employ several optimizations to suit a range of target architectures. Using insights from CARM, the most adequate approaches were identified, and an exhaustive study on 5 CPUs and 8 GPUs from all main manufacturers was presented. This allowed to identify the main features relevant to obtain high-performance in bioinformatics applications. Moreover, the proposed approaches were able to obtain higher performance than state-of-the-art works in all platforms, achieving speedups of up to 10.6.
Future directions include the evaluation of several micro-architectures from the perspective of optimization goals, such as, power consumption and energy efficiency, as well as the inclusion of DVFS techniques to further improve the efficiency of bioinformatics applications.
References
- [1] P. M. Visscher et al., ``10 years of GWAS discovery: biology, function, and translation,'' Am. J. Hum. Genet., vol. 101, no. 1, pp. 5–22, 2017.
- [2] ``GWAS to the People,'' Nature Medicine, vol. 24, no. 10, pp. 1483–1483, Oct 2018.
- [3] I. Dinu et al., ``SNP-SNP interactions discovered by logic regression explain Crohn's disease genetics,'' PloS one, vol. 7, no. 10, pp. 1–6, 2012.
- [4] J. Sun et al., ``Hidden risk genes with high-order intragenic epistasis in alzheimer's disease,'' Journal of Alzheimer's Disease, vol. 41, no. 4, pp. 1039–1056, 2014.
- [5] J.-K. Yang et al., ``Interactions among related genes of renin-angiotensin system associated with type 2 diabetes,'' Diabetes care, vol. 33, no. 10, pp. 2271–2273, 2010.
- [6] F. Gonçalves, S. Santander-Jiménez, L. Sousa, J. M. Granado-Criado, and A. Ilic, ``Parallel evolutionary computation for multiobjective gene interaction analysis,'' Journal of Computational Science, vol. 40, pp. 1–15, 2020.
- [7] R. Jiang, W. Tang, X. Wu, and W. Fu, ``A random forest approach to the detection of epistatic interactions in case-control studies,'' BMC Bioinformatics, vol. 10, no. 1, pp. 1–12, 2009.
- [8] J. Shang et al., ``A review of ant colony optimization based methods for detecting epistatic interactions,'' IEEE Access, vol. 7, pp. 13 497–13 509, 2019.
- [9] B. Goudey et al., ``High performance computing enabling exhaustive analysis of higher order single nucleotide polymorphism interaction in genome wide association studies,'' Health Information Science and Systems, vol. 3, no. 1, pp. 1–11, 2015.
- [10] L. S. Yung, C. Yang, X. Wan, and W. Yu, ``GBOOST: a GPU-based tool for detecting gene–gene interactions in genome–wide case control studies,'' Bioinformatics, vol. 27, no. 9, pp. 1309–1310, 2011.
- [11] L. Wienbrandt, J. C. Kässens, M. Hübenthal, and D. Ellinghaus, ``1000 faster than plink: Combined FPGA and GPU accelerators for logistic regression-based detection of epistasis,'' Journal of Computational Science, vol. 30, pp. 183–193, 2019.
- [12] J. González-Domínguez, S. Ramos, J. Touriño, and B. Schmidt, ``Parallel pairwise epistasis detection on heterogeneous computing architectures,'' IEEE Transactions on Parallel and Distributed Systems, vol. 27, no. 8, pp. 2329–2340, 2015.
- [13] L. Wienbrandt et al., ``FPGA-based acceleration of detecting statistical epistasis in GWAS,'' Procedia Computer Science, vol. 29, pp. 220–230, 2014.
- [14] Y. Li, J. M. Patel, and A. Terrell, ``Wham: A high-throughput sequence alignment method,'' ACM Trans. Database Syst., vol. 37, no. 4, Dec. 2012. [Online]. Available: https://doi.org/10.1145/2389241.2389247
- [15] A. Lacour et al., ``Novel genetic matching methods for handling population stratification in genome-wide association studies,'' BMC bioinformatics, vol. 16, no. 1, pp. 1–12, 2015.
- [16] T. D. Wu and S. Nacu, ``Fast and SNP-tolerant detection of complex variants and splicing in short reads,'' Bioinformatics, vol. 26, no. 7, pp. 873–881, 02 2010. [Online]. Available: https://doi.org/10.1093/bioinformatics/btq057
- [17] A. Ilic, F. Pratas, and L. Sousa, ``Cache-aware roofline model: Upgrading the loft,'' IEEE Computer Architecture Letters, vol. 13, no. 1, pp. 21–24, 2014.
- [18] J. C. Kässens, J. González-Domínguez, L. Wienbrandt, and B. Schmidt, ``UPC++ for bioinformatics: A case study using genome-wide association studies,'' in 2014 IEEE International Conference on Cluster Computing (CLUSTER), 2014, pp. 248–256.
- [19] W. Joubert et al., ``Attacking the opioid epidemic: Determining the epistatic and pleiotropic genetic architectures for chronic pain and opioid addiction,'' in SC18: International Conference for High Performance Computing, Networking, Storage and Analysis. IEEE, 2018, pp. 717–730.
- [20] R. Nobre, A. Ilic, S. Santander-Jiménez, and L. Sousa, ``Exploring the binary precision capabilities of tensor cores for epistasis detection,'' in 2020 International Parallel and Distributed Processing Symposium (IPDPS 2020), May 2020.
- [21] R. Nobre, A. Ilic, S. Santander-Jiménez, and L. Sousa, ``Retargeting tensor accelerators for epistasis detection,'' IEEE Transactions on Parallel and Distributed Systems, vol. 32, no. 9, pp. 2160–2174, 2021.
- [22] X. Sun, Q. Lu, S. Mukherjee, P. K. Crane, R. Elston, and M. D. Ritchie, ``Analysis pipeline for the epistasis search–statistical versus biological filtering,'' Frontiers in Genetics, vol. 5, p. 106, 2014.
- [23] Y. Guo et al., ``Epi-GTBN: an approach of epistasis mining based on genetic tabu algorithm and bayesian network,'' BMC Bioinformatics, vol. 20, no. 1, pp. 1–18, 2019.
- [24] G. R. Luecke et al., ``Fast epistasis detection in large-scale GWAS for Intel Xeon Phi clusters,'' in 2015 IEEE Trustcom/BigDataSE/ISPA, vol. 3, 2015, pp. 228–235.
- [25] J. González-Domínguez, J. C. Kässens, L. Wienbrandt, and B. Schmidt, ``Large-scale genome-wide association studies on a GPU cluster using a CUDA-accelerated PGAS programming model,'' The International Journal of High Performance Computing Applications, vol. 29, no. 4, pp. 506–510, 2015.
- [26] Q. Wang et al., ``GWIS FI: A universal GPU interface for exhaustive search of pairwise interactions in case-control GWAS in minutes,'' in 2014 IEEE International Conference on Bioinformatics and Biomedicine (BIBM). IEEE, 2014, pp. 403–409.
- [27] C. Ponte-Fernández, J. González-Domínguez, and M. J. Martín, ``Fast search of third-order epistatic interactions on CPU and GPU clusters,'' The International Journal of High Performance Computing Applications, vol. 34, no. 1, pp. 20–29, 2020.
- [28] J. González-Domínguez and B. Schmidt, ``GPU-accelerated exhaustive search for third-order epistatic interactions in case–control studies,'' Journal of Computational Science, vol. 8, pp. 93–100, 2015.
- [29] R. Nobre, S. Santander-Jiménez, L. Sousa, and A. Ilic, ``Accelerating 3-way epistasis detection with CPU+GPU processing,'' in 23rd Workshop on Job Scheduling Strategies for Parallel Processing (JSSPP 2020), May 2020.
- [30] R. Campos, D. Marques, S. Santander-Jiménez, L. Sousa, and A. Ilic, ``Heterogeneous CPU+iGPU processing for efficient epistasis detection,'' in Euro-Par 2020: Parallel Processing, M. Malawski and K. Rzadca, Eds. Cham: Springer International Publishing, 2020, pp. 613–628.
- [31] X. Wan et al., ``Boost: A fast approach to detecting gene-gene interactions in genome-wide case-control studies,'' Am. J. Hum. Genet., vol. 87, no. 3, pp. 325–340, 2010.
- [32] X. Li, S. Zhang, and K.-C. Wong, ``Nature-inspired multiobjective epistasis elucidation from genome-wide association studies,'' IEEE/ACM T. Comput. Bi., June 2018.
- [33] Intel® Advisor, ``Design Code for Efficient Vectorization, Threading, Memory Usage, and Accelerator Offloading,'' https://www.intel.com/content/www/us/en/developer/tools/oneapi/ advisor.html, [Online; visited October-2021].
- [34] NVIDIA, ``CUDA C++ Programming Guide,'' https://docs.nvidia.com/cuda/cuda-c-programming-guide/index.html, [Online; visited October-2021].