Studying ultrafast Rabi dynamics with a short-wavelength seeded free-electron laser
Abstract
Rabi oscillations are periodic modulations of populations in two-level systems interacting with a time-varying field[1]. They are ubiquitous in physics with applications in different areas such as photonics[2], nano-electronics[3], electron microscopy[4], and quantum information[5]. While the theory developed by Rabi was intended for fermions in gyrating magnetic fields, Autler and Townes realized that it could also be used to describe coherent light–matter interaction within the rotating wave approximation[6]. Although intense nanometer-wavelength light-sources have been available for more than a decade[7, 8, 9], Rabi dynamics at such short wavelengths have not been observed directly. Here we show that femtosecond extreme-ultraviolet pulses from a seeded free-electron laser[10] can drive Rabi oscillations between the ground state and an excited state in helium atoms. The measured photoemission signal revealed an Autler-Townes doublet as well as an avoided crossing, phenomena that are both trademarks of quantum optics[11]. Using theoretical analyses that go beyond the strong-field approximation[12], we found that the ultrafast build-up of the doublet structure follows from a quantum interference effect between resonant and non-resonant photoionization pathways. Given the recent availability of intense attosecond[13] and few-femtosecond[14] extreme-ultraviolet pulses, our results offer opportunities to carry out ultrafast manipulation of coherent processes at short wavelengths using free-electron lasers.
Université de Lyon, Université Claude Bernard Lyon 1, CNRS, Institut Lumière Matière, Villeurbanne, France
Department of Physics, Lund University, Lund, Sweden.
Elettra-Sincrotrone Trieste, Basovizza, Trieste, Italy
Department of Physics, University of Gothenburg, Gothenburg, Sweden
Université Paris-Saclay, CEA, CNRS, LIDYL, Gif-sur-Yvette, France
Institute of Physics and CINSaT, University of Kassel, Heinrich-Plett-Straße 40, Kassel, Germany
European XFEL, Schenefeld, Germany
ELI-NP, “Horia Hulubei” National Institute for Physics and Nuclear Engineering, Mǎgurele, Romania
Istituto Nazionale di Fisica Nucleare, Laboratori Nazionali di Frascati, Frascati, Italy
Università degli Studi di Trieste, Trieste, Italy
IOM-CNR, Istituto Officina dei Materiali, Basovizza, Trieste, Italy
The advent of free-electron laser (FEL) facilities, providing femtosecond light pulses in the gigawatt regime at extreme-ultraviolet (XUV) or X-ray wavelengths, has opened up new prospects for experiments in isolated atoms and molecules in the gas-phase[15, 16]. Over the last decade, pioneering results concerning multi-photon ionization of atoms[17], and small molecules[18] were obtained using pulses from self-amplified spontaneous emission (SASE) FEL sources[8]. However, these pulses are prone to low degree of coherence and poor shot-to-shot reproducibility due to the inherent instability pertinent to the SASE process. As a result, despite theoretical predictions to observe Rabi oscillations at short wavelengths[19, 20, 21, 22], effects from these oscillations on the measured spectra were only indirect[23, 24]. Instead, XUV pulses from a SASE FEL have been used as pumps that allowed subsequent ultrafast Rabi dynamics to be driven by laser pulses at near-infrared wavelengths[25]. In this regard, XUV pulses from a seeded FEL, such as FERMI[10], with its high temporal and spatial coherence, and large peak intensity can permit studying coherent light–matter interactions[26] as well as phase-dependent interference effects of the wavefunction[2].
According to the Rabi model[1], if a two-level atom initially in its ground state , is subjected to an interaction with a field of frequency that couples it to the excited state , the probability for excitation varies sinusoidally in time as: . The oscillating population leads to a symmetric doublet structure in the frequency domain, known as an Autler-Townes (AT) doublet. The splitting is given by the generalized Rabi frequency: , where , is the detuning of the field with respect to the atomic transition frequency, . The Rabi frequency for light-matter interaction within the dipole approximation is: , with being the electric field amplitude, the transition matrix element, the reduced Planck’s constant and the elementary charge. In addition to the periodic population transfer , the coherent dynamics is further associated with sign changes of the oscillating amplitudes for the two states. For fermions, such sign changes of the wavefunction can be connected to rotations in real space[1] that have been measured for neutron beams in magnetic fields[27]. Analogous sign changes in quantum optics were studied using Rydberg atoms to determine the number of photons in a cavity[28]. Recently, the sign changes in Rabi amplitudes have been predicted to strongly alter AT doublet structures in photo-excited atoms, when probed by attosecond XUV pulses[29].
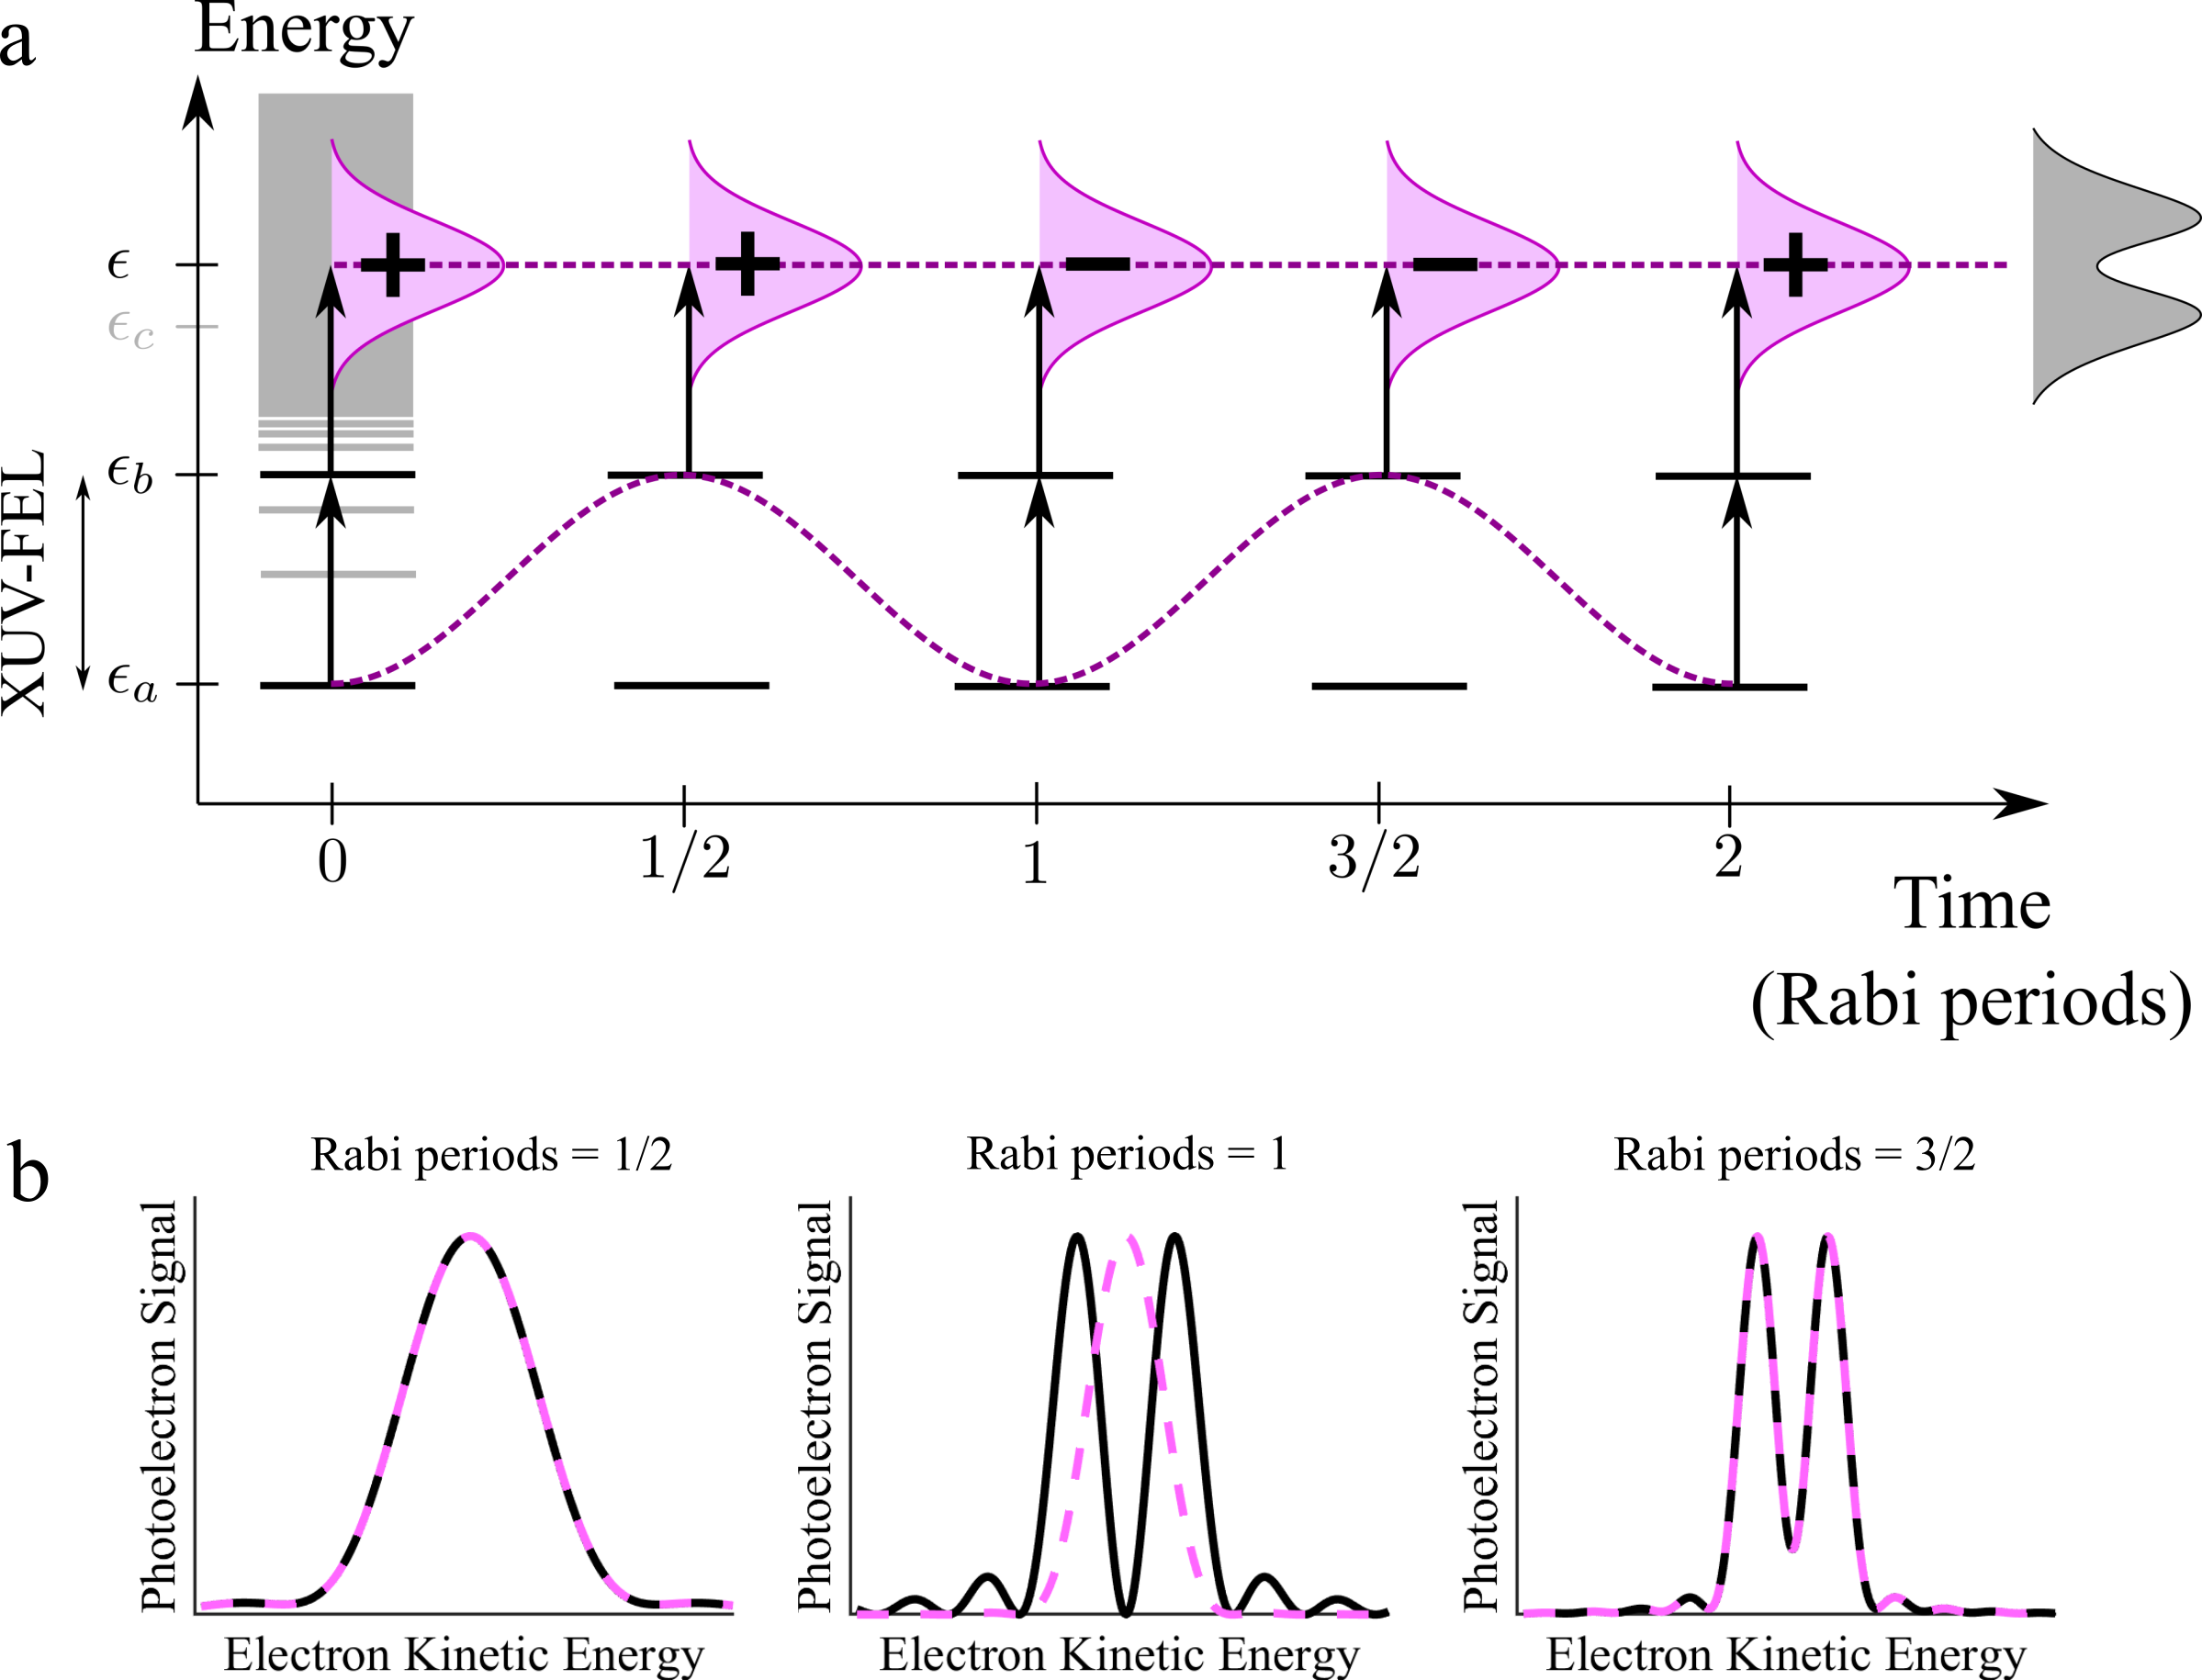
Here, we investigate the Rabi dynamics at XUV wavelengths in helium atoms induced by an intense pulse from the FERMI seeded FEL that couples the two levels: () and (), with eV [30]. The dynamics is probed in-situ by recording photoelectrons ejected from the state or during the ultrashort interaction, with one or two XUV-FEL photons, as illustrated in Fig. 1a. In order to interpret this non-linear dynamics, we have developed an analytical model based on a Dyson series for the two-level system undergoing Rabi oscillations (see Supplementary Information for details). The resulting AT doublet structure depends on whether the photoelectron is originating from the ground state, , or the excited state, , as shown in Fig. 1b. The narrow spectral bandwidth of the XUV-FEL pulse ( - meV; see Methods) enables efficient coupling of and with the dipole element: , being the Bohr radius[31]. It is possible to drive the transition coherently, because the excited state lifetime ( ns) is much longer than the estimated full-width-at-half-maximum (FWHM) of the FEL pulse duration[32]: fs. Thus, the Hamiltonian for a two-level system: , where and are Pauli operators, can be satisfied by a time-dependent wavefunction of the form: . Within the rotating wave approximation (RWA), the amplitudes of the ground and excited states are expressed as:
| (1) |
provided that the electric field can be approximated as a flat-top shape in time. The sign changes associated with these Rabi amplitudes are essential to understand the ultrafast build-up of AT doublets from or , by absorption of two or one resonant XUV-FEL photons. The AT doublet emerges due to a destructive interference effect between photoelectrons ejected before and after the first sign change, which is found to occur at and Rabi period for the amplitudes: and with , respectively. This is in agreement with the results from the analytical model presented in Fig. 1b.
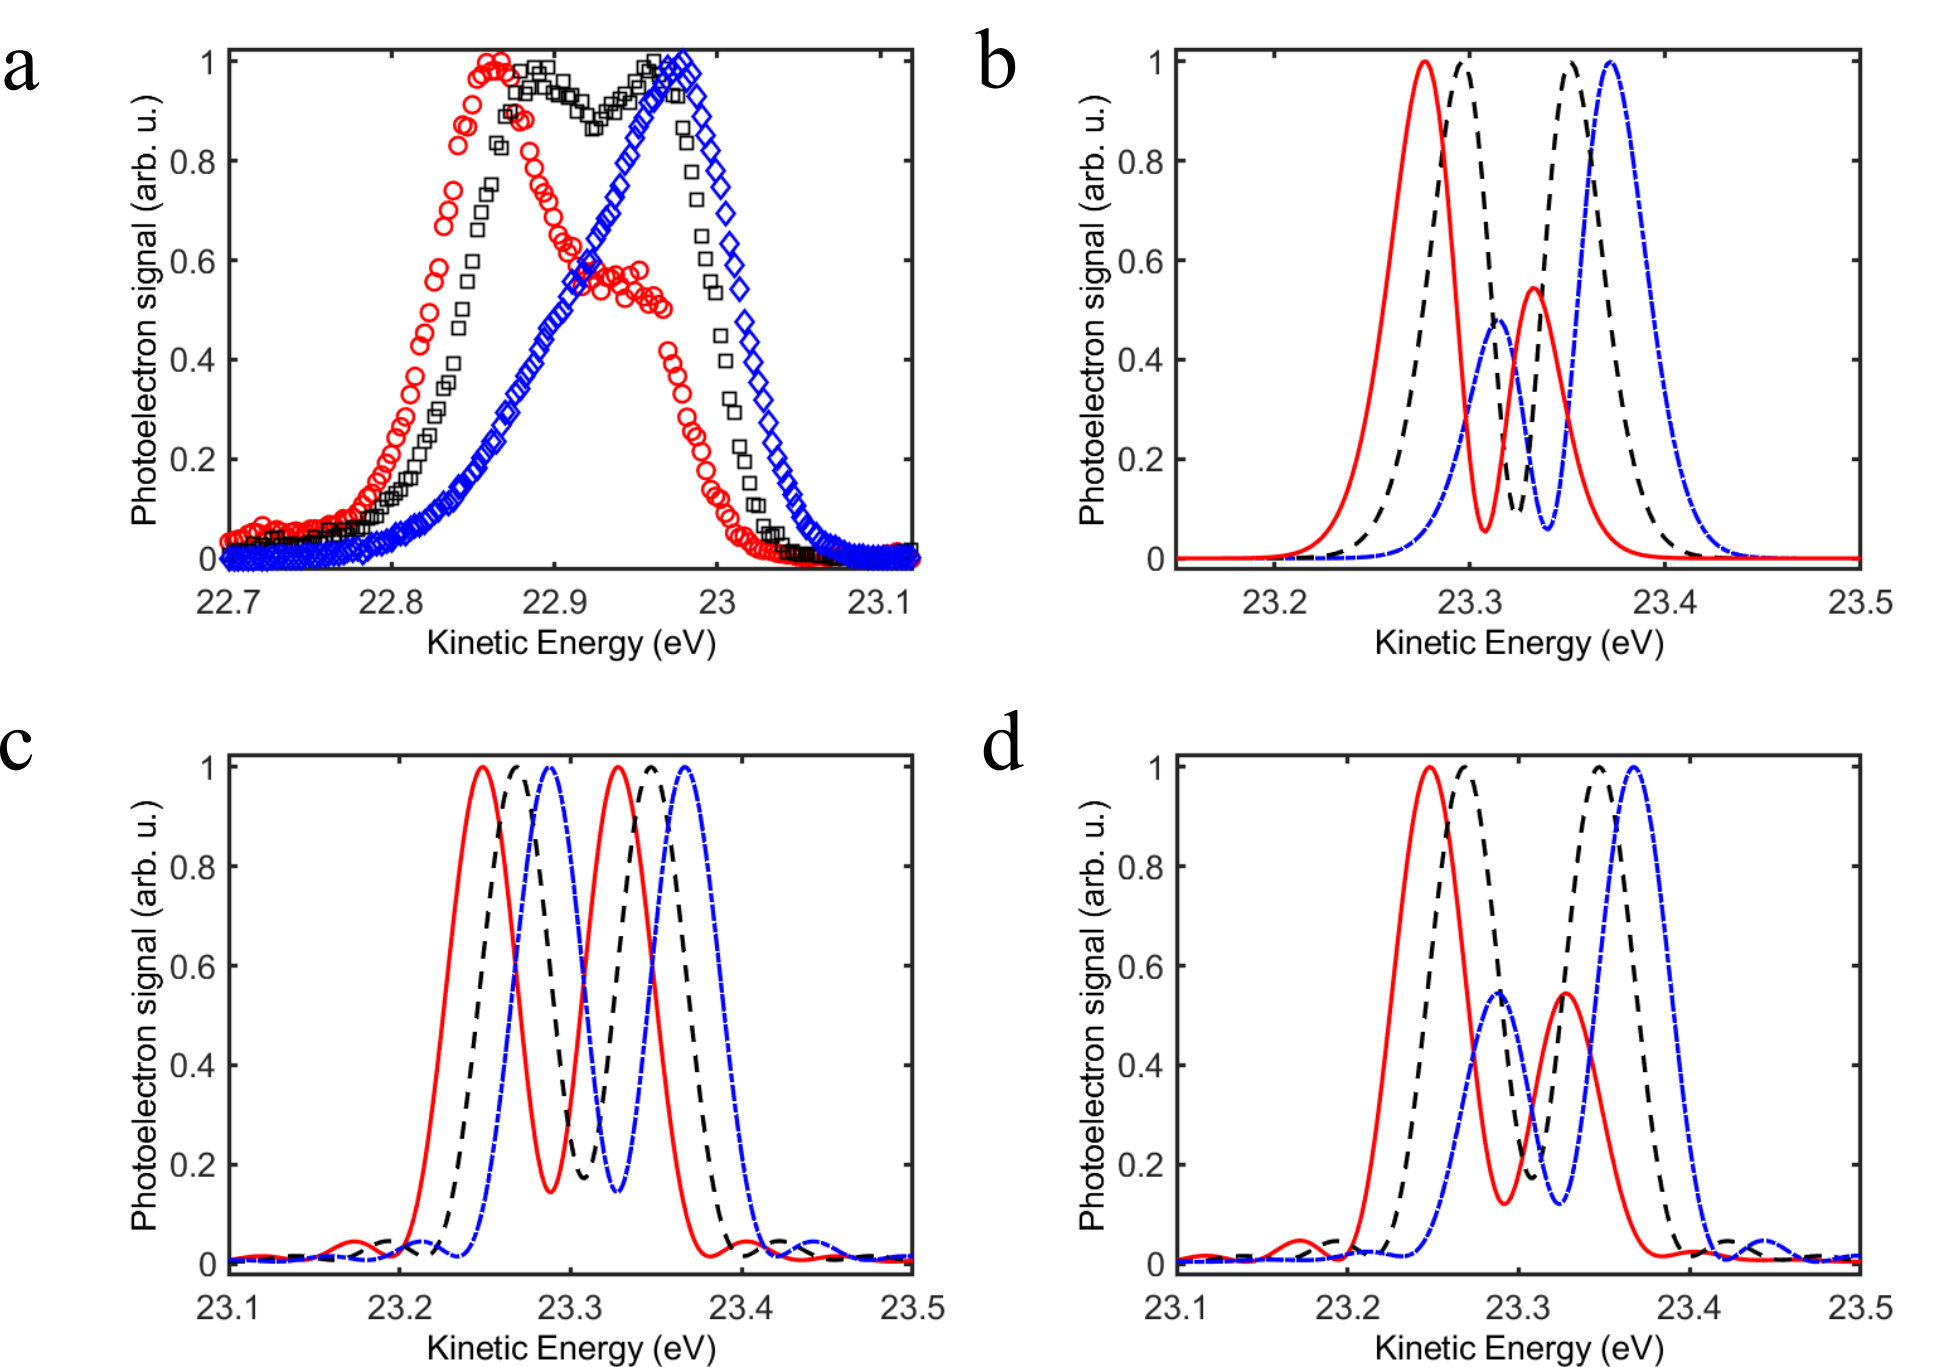
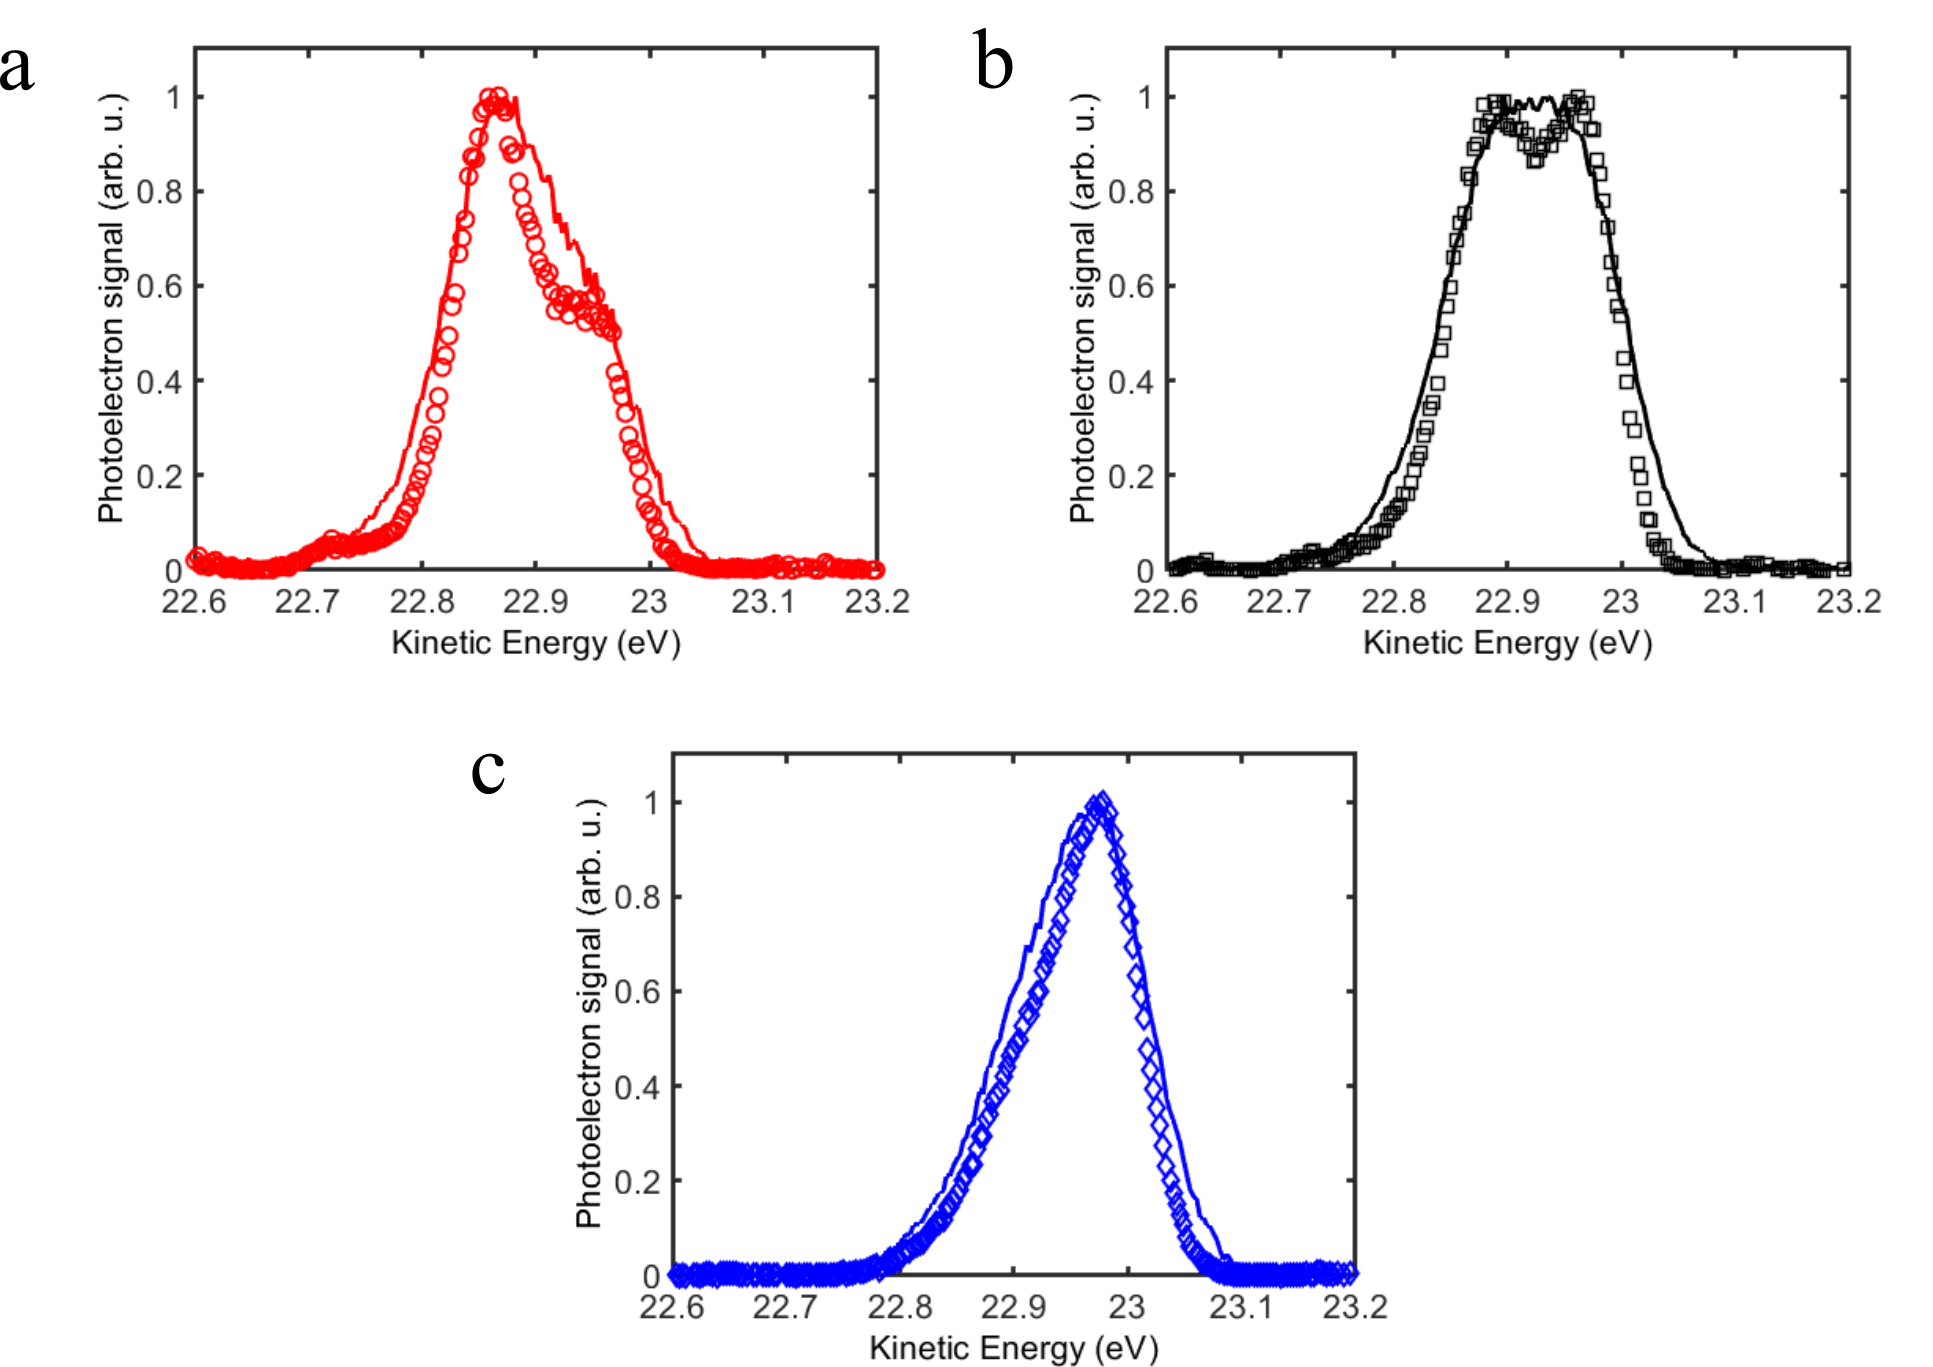
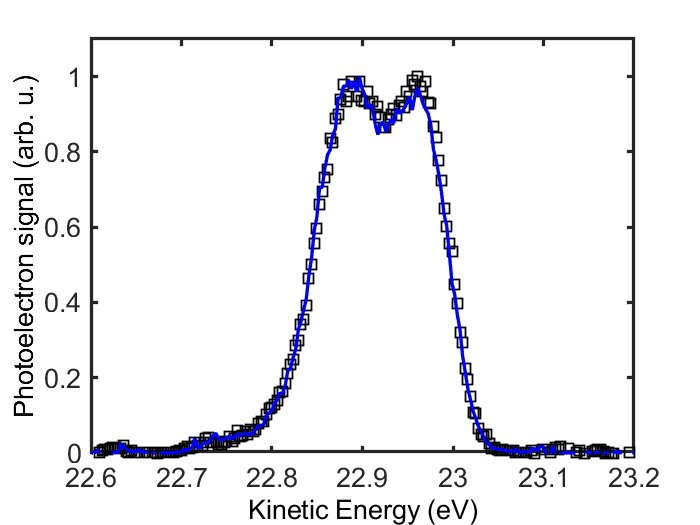
Measured photoelectron spectra, displayed in Fig. 2a, exhibit an AT splitting of meV (see Methods for details about the blind deconvolution procedure used here). The corresponding Rabi period: fs, given its proximity to the FWHM of the XUV-FEL pulse, suggests that the experiment was performed in a regime of ultrafast AT doublet formation close to a single Rabi cycle. A slight blue detuning of the XUV light by almost meV, relative to the atomic transition, is required to record a symmetric AT doublet (black squares in Fig. 2a). A strong asymmetry is observed when the FEL frequency is detuned to the red (red circles in Fig. 2a) or blue (blue diamonds in Fig. 2a) side of the symmetric doublet. The asymmetry of the AT doublet is quantitatively well-reproduced by ab initio numerical simulations for helium within the time-dependent configuration-interaction singles (TDCIS) approximation[33], as shown in Fig. 2b. Gaussian pulses were used with parameters chosen to match the experimental conditions with effective intensity of W/cm2 (as obtained from ) and pulse duration (FWHM) fs (see Methods for details). It is worth noting that the Rabi dynamics is sensitive to the exact shape of the driving pulse. For instance, a Gaussian pulse can induce more Rabi oscillations than a flat-top pulse with same FWHM by a factor of . Thus, the calculated photoelectron spectra from the analytical model using flat-top pulses in Fig. 1b for Rabi periods agree well with those from the TDCIS calculations using Gaussian pulses having FWHM close to a single Rabi period in Fig. 2b. Clearly, the AT doublet manifests itself between and Rabi periods. The difference in kinetic energy ( eV) of the symmetric AT doublet between experiment and theory (see Fig. 2a and 2b, respectively) is attributed to electron correlation effects not included in the TDCIS calculations that increase the binding energy beyond the Hartree-Fock level. The observed asymmetry in the AT doublet cannot be explained by a breakdown of the RWA because the experiment is performed at a resonant weak-coupling condition[6]: and . Instead, we express the Rabi amplitudes from Eq. 1 in terms of their frequency components and find that has two asymmetric components that are proportional to , while has two symmetric components that are proportional to . Using the analytical model with Rabi periods, we confirm that the AT doublet from is symmetric, while that from is asymmetric, as shown in Fig. 2c and 2d, respectively. Quite remarkably, the observed asymmetry in the experiment suggests that the photoelectron signal contains significant contributions from the two-photon ionization process from . How is this possible given that the electric field amplitude: a.u. implies an ionization-probability ratio of in favor of the one-photon process from ?
We propose that the two-photon signal from can compete with the one-photon signal from due to constructive addition of non-resonant intermediate -states (see grey bound and continuum states in Fig. 3a). This leads to a giant localized wave: , in comparison with the normalized wavefunction for , as shown in Fig. 3b. The scaling factor due to atomic effects is estimated to be in favor of the two-photon process (see Extended Data Table 1 for the matrix elements). Thus, we can explain why the XUV-FEL pulse is intense enough for the non-resonant two-photon process from the ground state to be comparable with the one-photon process from the resonant excited state. In general, addition of two pathways leads to quantum interference that depends on the relative phase. From Fig. 3b we can notice that the giant wave oscillates out of phase with the excited state close to the atomic core, which affects the signs of the matrix elements (see Extended Data Table 1). The ultrafast build-up of the AT doublet can be used to study the resulting interference phenomenon in time. In order to understand this phenomenon, we have used the analytical model to perform calculations where the one- and two-photon contributions are added coherently to simulate the angle-integrated measurements. In Fig. 3c we show how the resonant case () leads to a strongly asymmetric AT doublet after one Rabi period. Fig. 3d indicates that a blue detuning ( meV) leads to the symmetric AT doublet at an earlier time between and Rabi period. The advancement of the AT doublet in time follows from the faster Rabi cycling at the rate of generalized Rabi frequency. The required blue shift for the symmetric AT doublet is the signature of an interplay between the one-photon and two-photon processes that depends on the exact pulse form. A general loss of contrast in the AT doublet structures is found by considering the effect of an extended gas target in our model. However, the two-photon doublet was found to be less sensitive to the volume averaging effect when compared to the one-photon doublet (see Methods for details), allowing us to clearly observe the AT doublet in the measured photoelectron signal.
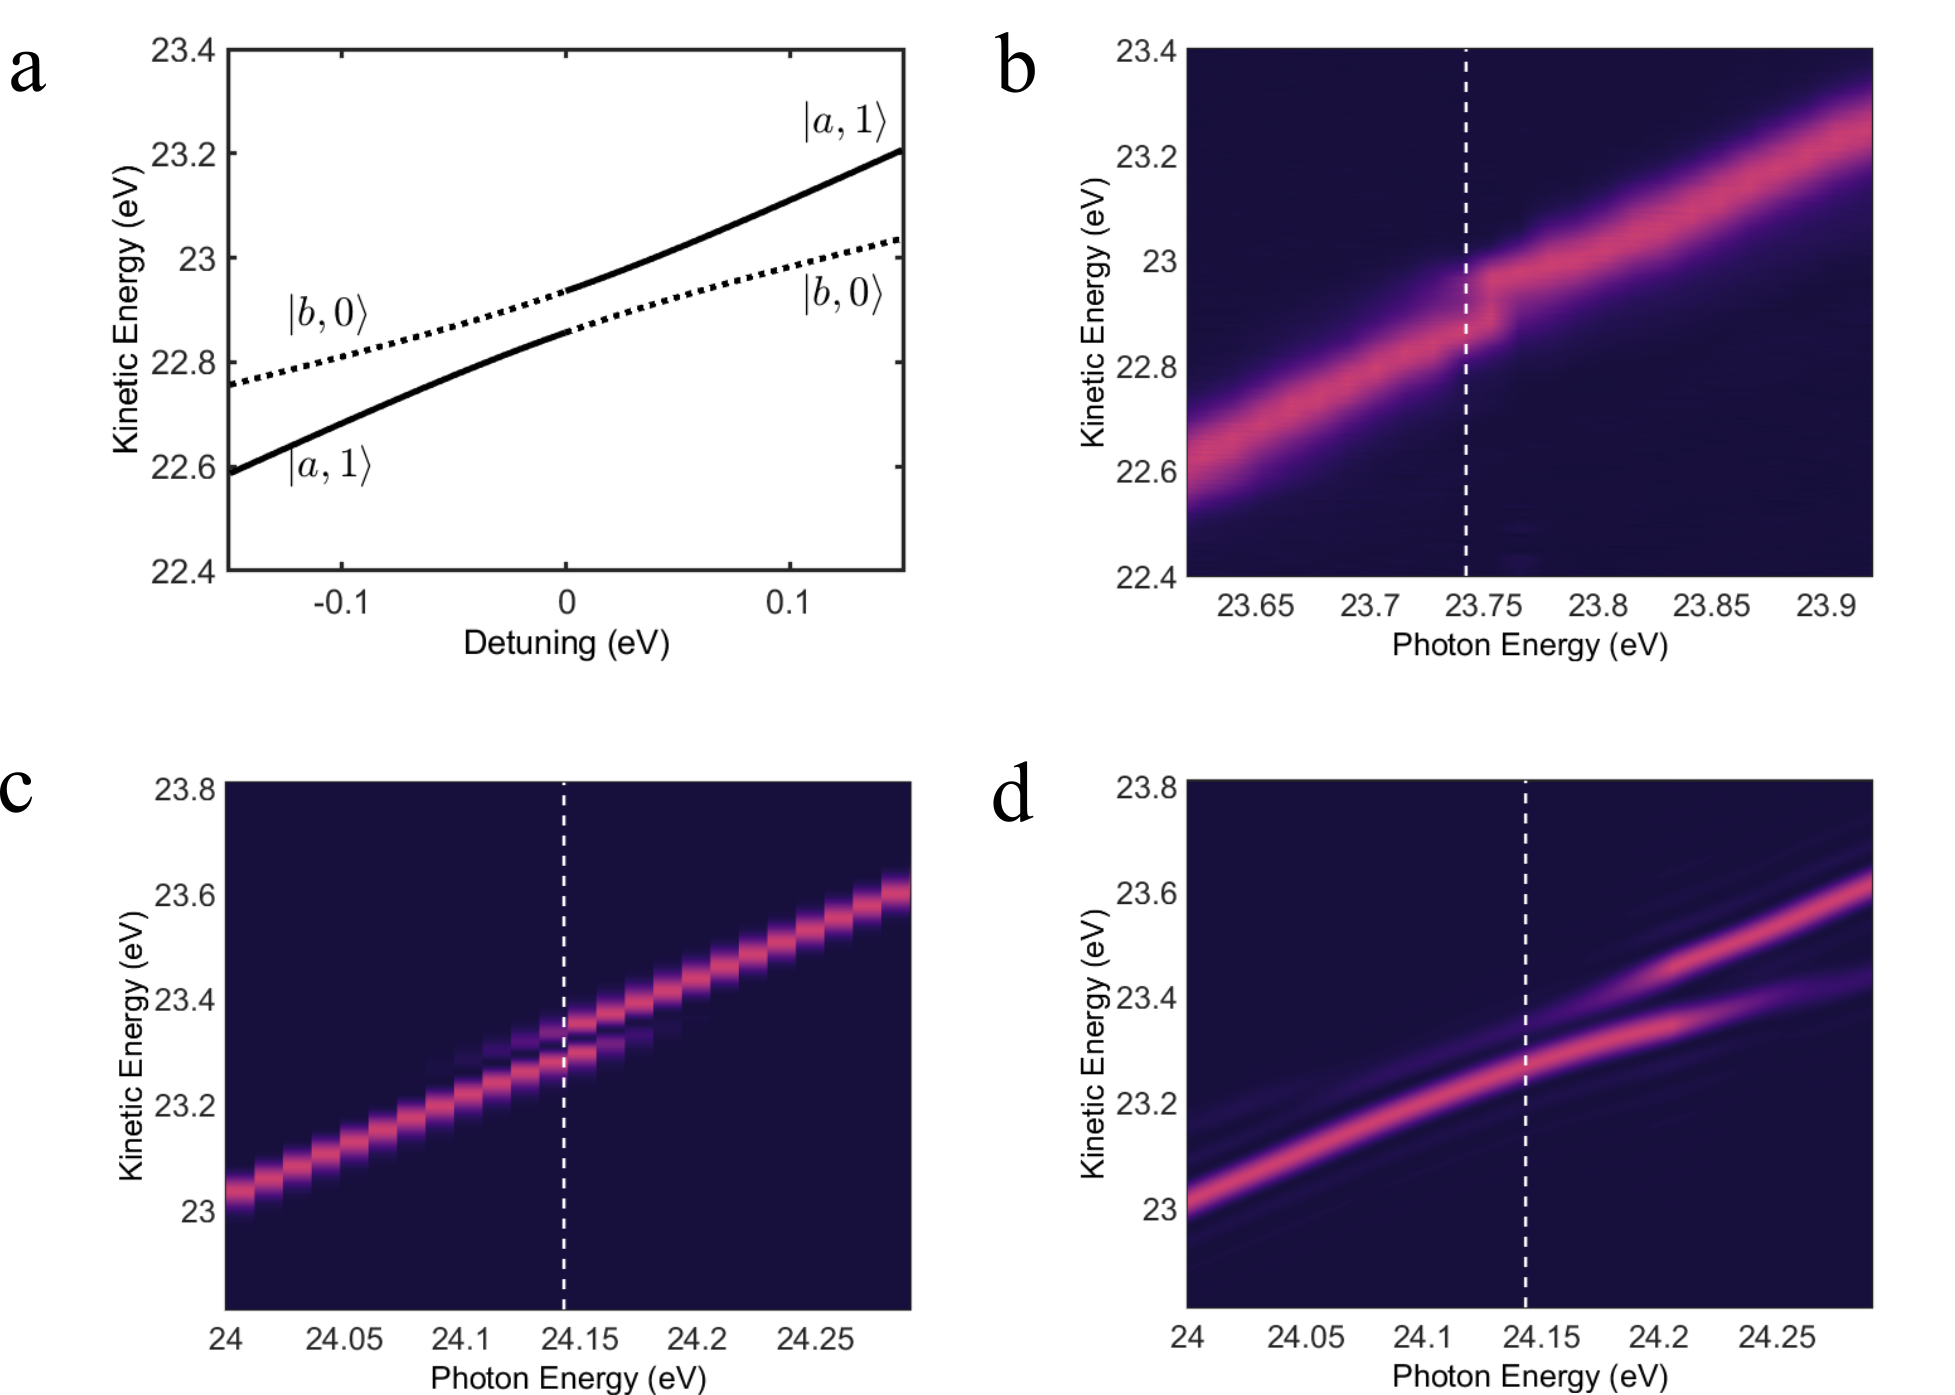
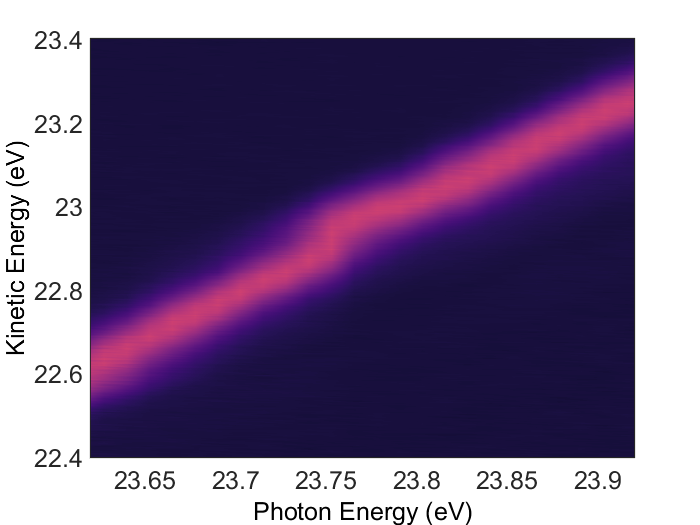
To provide further evidence in support of the coherent interaction between the helium atoms and the XUV-FEL pulses, we show that the ultrafast emergence of the AT doublet can be interpreted in terms of the dressed-atom picture with coupled atom–field energies: . One photon energy above these coupled energies implies final photoelectron kinetic energies: , where eV is the ionization potential of helium. In Fig. 4a, kinetic energies are labeled with the uncoupled atom–field states[34], and . The experimental results in Fig. 4b can be understood as one photon above at large detuning of the XUV-FEL pulse. This is because the interaction there is weak and the atom remains mostly in its ground state, , such that two photons are required for ionization. In contrast, both coupled energies appear close to the resonance to form an avoided crossing in kinetic energy. This is a clear signature of coherent Rabi dynamics taking place in the two-level atom. Note that the avoided crossing appears at a blue detuning from the resonant transition, (denoted by the dashed vertical line), revealing the quantum interference between the two pathways from the ground state and the excited state . Similar results were obtained from the TDCIS simulations (Fig. 4c) and the analytical model with contributions from both and for 3/2 Rabi periods (Fig. 4d). The observed blue detuning for the experimental avoided crossing ( meV) is very well reproduced by TDCIS calculations ( meV). The enhanced shift of the AT doublet to blue detuning in the analytical model is an effect of the pulse-envelope that can be reproduced with TDCIS using smoothed flat-top pulses.
Our results show that it is now possible to simultaneously drive and interrogate ultrafast coherent processes using XUV-FEL pulses. Prior attempts to understand Rabi dynamics at short wavelengths have relied on the strong-field approximation, where the influence of the atomic potential is neglected, leading to an inconsistent AT doublet when compared with numerical simulations[19, 20]. In contrast, our analytical model includes the full effect of the atomic potential and Rabi dynamics in the two-level subspace, while the remaining transitions to and within the complement of the Hilbert space are treated by time-dependent perturbation theory. Consequently, we could establish a unique mechanism in the form of a giant Coulomb-induced wave from the ground state to explain why the non-resonant two-photon process can compete with the resonant one-photon process and generate quantum interference effects at the high intensities provided by the XUV-FEL beam. With this model, we now understand how Rabi oscillations can prevail at short wavelengths despite photoionization losses from the neutral atom. Together with our experimental approach of using two-photon ionization as an in-situ probe of the coherent population transfer, which does not rely on any additional laser probe field, the scheme proposed here becomes applicable to other quantum systems as well. With the ongoing developments of seeded FEL facilities around the world[35, 36] capable of providing coherent light pulses down to few-ångstrom wavelength, our findings can inspire future studies involving core-level electrons in multi-electronic targets, such as molecules, and nano-objects at ultrafast timescales.

References
- [1] Rabi, I. I. Space Quantization in a Gyrating Magnetic Field. Phys. Rev. 51, 652 (1937).
- [2] Fushman, I. et al. Controlled Phase Shifts with a Single Quantum Dot. Science 320, 769 (2008).
- [3] Vijay, R. et al. Stabilizing Rabi oscillations in a superconducting qubit using quantum feedback. Nature 490, 77 (2012).
- [4] Feist, A. et al. Quantum coherent optical phase modulation in an ultrafast transmission electron microscope. Nature 521, 200 (2015).
- [5] Pedrozo-Peñafiel, E. et al. Entanglement on an optical atomic-clock transition. Nature 588, 414 (2020).
- [6] Autler, S. H. & Townes, C. H. Stark Effect in Rapidly Varying Fields. Phys. Rev. 100, 703 (1955).
- [7] Ackermann, W. et al. Operation of a free-electron laser from the extreme ultraviolet to the water window. Nat. Photon. 1, 336 (2007).
- [8] Emma, P. et al. First lasing and operation of an ångstrom-wavelength free-electron laser. Nat. Photon. 4, 641 (2010).
- [9] Ishikawa, T. et al. A compact X-ray free-electron laser emitting in the sub-ångström region. Nat. Photon. 6, 540 (2012).
- [10] Allaria, E. et al. Highly coherent and stable pulses from the FERMI seeded free-electron laser in the extreme ultraviolet. Nat. Photon. 6, 699 (2012).
- [11] Haroche, S. & Raimond, J.-M. Exploring the Quantum: atoms, cavities, and photons (Oxford University Press Inc., New York, 2006).
- [12] Reiss, H. R. Effect of an intense electromagnetic field on a weakly bound system. Phys. Rev. A 22, 1786 (1980).
- [13] Maroju, P. K. et al. Attosecond pulse shaping using a seeded free-electron laser. Nature 578, 386 (2020).
- [14] Mirian, N. S. et al. Generation and measurement of intense few-femtosecond superradiant extreme-ultraviolet free-electron laser pulses. Nat. Photon. 15, 523 (2021).
- [15] Young, L. et al. Roadmap of ultrafast x-ray atomic and molecular physics. J. Phys. B: At. Mol. Opt. Phys. 51, 032003 (2018).
- [16] Lindroth, E. et al. Challenges and opportunities in attosecond and XFEL science. Nat. Rev. Phys. 1, 107 (2019).
- [17] Young, L. et al. Femtosecond electronic response of atoms to ultra-intense X-rays. Nature 466, 56 (2010).
- [18] Rudenko, A. et al. Femtosecond response of polyatomic molecules to ultra-intense hard X-rays. Nature 546, 129 (2017).
- [19] LaGattuta, K. J. Above-threshold ionization of atomic hydrogen via resonant intermediate states. Phys. Rev. A 47, 1560 (1993).
- [20] Girju, M. G., Hristov, K., Kidun, O. & Bauer, D. Nonperturbative resonant strong field ionization of atomic hydrogen. J. Phys. B: At. Mol. Opt. Phys. 40, 4165 (2007).
- [21] Rohringer, N. & Santra R. Resonant Auger effect at high x-ray intensity. Phys. Rev. A 77, 053404 (2008).
- [22] Zhang, S. B. & Rohringer, N. Photoemission spectroscopy with high-intensity short-wavelength lasers. Phys. Rev. A 89, 013407 (2014).
- [23] Sako, T. et al. Suppression of ionization probability due to Rabi oscillations in the resonance two-photon ionization of He by EUV free-electron lasers. Phys. Rev. A 84, 053419 (2011).
- [24] Kanter, E. P. et al. Unveiling and Driving Hidden Resonances with High-Fluence, High-Intensity X-Ray Pulses. Phys. Rev. Lett. 107, 233001 (2011).
- [25] Fushitani, M. et al. Femtosecond two-photon Rabi oscillations in excited He driven by ultra-short intense laser fields. Nat. Photon. 10, 102 (2016).
- [26] Prince, K. C. et al. Coherent control with a short-wavelength free-electron laser. Nat. Photon. 10, 176 (2016).
- [27] Rauch, H. et al. Verification of coherent spinor rotation of fermions. Phys. Lett. A 54, 425 (1975).
- [28] Nogues, G. et al. Seeing a single photon without destroying it. Nature 400, 239 (1999).
- [29] Jiang, W.-C., Liang, H., Wang, S., Peng, L.-Y. & Burgdörfer, J. Enhancing Autler-Townes splittings by ultrafast XUV pulses. Phys. Rev. Res. 3, L032052 (2021).
- [30] Kramida, A., Ralchenko, Y., Reader, J., and NIST ASD Team (2021), NIST Atomic Spectra Database (ver. 5.9). National Institute of Standards and Technology, Gaithersburg, MD.
- [31] Chan, W. F., Cooper, G. & Brion, C. E. Absolute optical oscillator strengths for the electronic excitation of atoms at high resolution: Experimental methods and measurements for helium. Phys. Rev. A 44, 186 (1991).
- [32] Finetti, P. et al. Pulse Duration of Seeded Free-Electron Lasers. Phys. Rev. X 7, 021043 (2017).
- [33] Greenman, L. et al. Implementation of the time-dependent configuration-interaction singles method for atomic strong-field processes. Phys. Rev. A 82, 023406 (2010).
- [34] Cohen-Tannoudji, C., Dupont-Roc, J. & Grynberg G., “The Dressed Atom Approach” in Atom–Photon Interactions: Basic Processes and Applications (Wiley, 2004).
- [35] Nam, I. et al. High-brightness self-seeded X-ray free-electron laser covering the keV to keV range. Nat. Photon. 15, 435 (2021).
- [36] Liu, B. et al. The SXFEL Upgrade: From Test Facility to User Facility. Appl. Sci. 12, 176 (2022).
Experiment
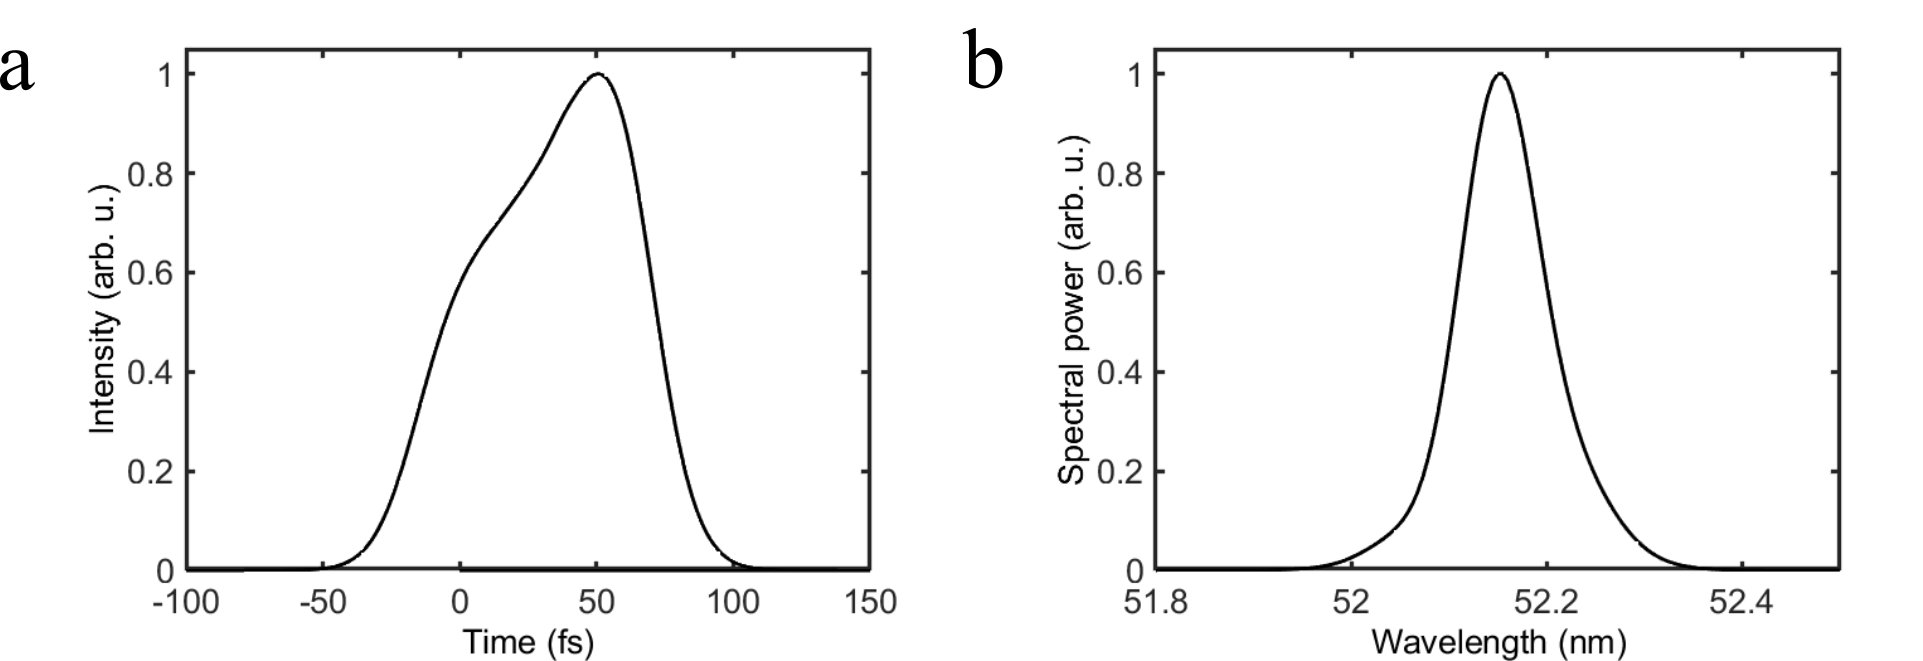
The experiment was carried out at the Low Density Matter (LDM) beamline of FERMI[2]. A pulsed Even-Lavie valve, synchronized with the arrival of the FEL pulse served as the target source. The target gas jet was estimated to be a cone with mm diameter at the interaction region. We measured the photoelectron spectra at and around the transition in helium, using a -m long magnetic bottle electron spectrometer (MBES). The gas jet, FEL beam, and magnetic bottle axes are mutually perpendicular, with the first two being on the horizontal plane of the laboratory, and the last one in the vertical direction. Before entering into the flight tube of the MBES, the photoelectrons were strongly retarded to below eV kinetic energy to achieve high spectral resolution (). To suppress any short-term fluctuation arising from the instability of the FEL, we performed a ‘round-trip’ scan across the wavelength range, nm. Empirically, the FWHM of the XUV-FEL pulse duration () can be approximated[32] to be in between and . Here, fs is the duration (FWHM) of the seed pulse (wavelength: nm) and is the harmonic order for the undulator. It leads to fs that matches very well the FWHM of fs, obtained from the simulation of the FEL dynamics using PERSEO[3]. The spectral bandwidth (FWHM) of the pulse was estimated using PERSEO to be around nm at the central wavelength of nm. Extended Data Fig. 1a and 1b displays the simulated temporal and spectral profiles of the FEL pulse, respectively. At best focus, the spot-size (FWHM) was estimated to be m. We measured the energy per pulse at the output of the FEL undulator to be around J, which refers to the full beam including all photons contained in the transverse Gaussian distribution. In order to consider those, we used as the FEL beam diameter at best focus, where m. Hence, the beam waist () is given by m, along with a Rayleigh length of: mm.
Data analysis
To filter the measured photoelectron spectra on a shot-to-shot basis, we used the photon spectrum recorded by the Photon Analysis Delivery and REduction System (PADRES) at FERMI to determine the bandwidth (FWHM) of the XUV pulse. Any shot without the photon spectrum was rejected: out of shots, shots were retained. All the shots having more than meV FWHM width were discarded (see, Extended Data Fig. 2a). Note that the simulated value of the photon bandwidth ( meV) lies within the filtering window of – meV. Additionally, we chose only the shots with integrated spectral intensities ranging from to in arbitrary units (see, Extended Data Fig. 2b). The filtered shots were sorted into photon-energy-bins, uniformly separated from each other by meV and covering the entire photon energy window of the wavelength scan (see, Extended Data Fig. 2c). Overall, only shots (filtering ratio of ) out of the raw data were retained. The measured photoelectron spectra, following shot-to-shot filtering, are shown in Extended Data Fig. 3. The avoided crossing is only faintly visible here. To obtain the clear avoided crossing from Fig. 4b, we deconvoluted the photoelectron spectra for three photon energies near the transition using the Richardson-Lucy blind iterative algorithm[4]. To reduce the noise introduced during the deconvolution we incorporated the Tikhonov-Miller regularization procedure into the algorithm[5]. The outcomes are shown in Extended Data Fig. 4. Following deconvolution, the values of FWHM for the Gaussian instrument-response-functions were found to be: meV, meV and meV, for the three photon energies. These values match well the combined resolution of meV, obtained from the photon bandwidth and the kinetic energy resolution of the MBES. No filter, either metallic or gaseous, was used along the path of the FEL beam. Hence, a minor contribution () from the second-order light can be noticed as an asymmetric tail close to eV kinetic energy (see, Extended Data Fig. 4a and 4b). To rule out any artifact from the fluctuations of the FEL pulse properties, we used another filtering criterion for the photon bandwidth ( - meV) and the integrated spectral intensity ( - arb. u.). The corresponding deconvoluted photoelectron spectra at eV is shown in Extended Data Fig. 5, along with that from Fig. 2a of the main text. No significant change in the AT doublet structure due to change in filtering criteria could be seen. Finally, for a transform-limited Gaussian pulse, can vary between - fs from shot to shot that encompasses its empirical value: fs. Since is significantly higher than the absolute value of the simulated group-delay-dispersion of the FEL pulse: fs2, no effect due to the linear chirp was considered in the theoretical calculations.
Intensity averaging over macroscopic interaction volume
To better understand the experimental results, we perform an intensity averaging procedure of the analytical model results (see Supplementary Information for details about the model). We assume a Gaussian beam profile with intensity varying as
| (2) |
with , the beam waist at focus, and , where is the Rayleigh length of the beam. We estimate that m and mm (see, Experiment). Since the target gas is spread out over a finite volume, the experimental signal will contain the response of atoms subject to a range of different intensities according to Eq. 2. The total signal strength is given by
| (3) |
where is the spectral amplitude for energy calculated with the model at intensity , and represents the extent of the gas target. Since the beam waist is much smaller than the extent of the target in the transverse directions, we treat the target as a box shape with an extent of mm along the -axis. In the transverse direction we consider contributions that are closer than from the axis of the beam. The total signal is then
| (4) |
The integrals are evaluated using numerical routines from the SciPy library[6].
Extended Data Fig. 6a contains a comparison of the shape of the intensity averaged spectrum and the spectrum for a single atom subject to the peak intensity, at the detuning where the peaks appear symmetric ( meV). Extended Data Fig. 6b and 6c contains the same type of curves for the separate contributions from the two- and one-photon process, but at zero detuning (where they are symmetric), illustrating that the two processes are affected differently by the intensity averaging procedure. The spectra in Extended Data Fig. 6b and 6c are normalized to the maximum of each simulation type (single-atom or macroscopic average). The shape of the two-photon signal is less affected by intensity averaging than the one-photon signal, since most of the signal comes from areas with high intensity due to the quadratic dependence on the electric field in the amplitude. On the other hand, the one-photon signal should have significant contributions from a larger volume of the target, since the one-photon amplitude scales linearly with the strength of the electric field. This means that the shape of the one-photon signal might become more distorted, as seen in Extended Data Fig. 6c, but that its relative contribution compared to the two-photon process should increase, when compared to the single-atom case.
Numerical simulations using TDCIS
The ab initio numerical simulations are performed using the Time-Dependent (TD) Configuration-Interaction Singles (CIS) method[33, 7, 8, 9] in the velocity gauge. The CIS basis for helium is constructed using Hartree-Fock (HF) orbitals that are computed using B-splines. Exterior complex scaling is used to dampen spurious reflections during time propagation of TDCIS[10]. The vector potential of the XUV-FEL pulse is defined as,
| (5) |
The central frequency, , is set close to the CIS atomic transition frequency, , between the HF ground state: and the singly excited state: . The duration of the pulse is set to and the peak intensity is set to . The CIS dipole matrix element between the ground state and the excited state is given by and the ionization potential is related to the orbital energy in HF: , in accordance with Koopmans’ theorem. Photoelectron distributions are captured using the time-dependent surface flux (t-SURFF)[11] and infinite-time surface flux (iSURF)[12] methods. The high kinetic energy of the photoelectrons ensures a proper description of the physics by the surface methods.
References
- [1]
- [2] Svetina, C. et al. The Low Density Matter (LDM) beamline at FERMI: optical layout and first commissioning. J. Synchrotron Radiat. 22, 538 (2015).
- [3] Giannessi, L. Overview of PERSEO, a system for simulating FEL dynamics in mathcad. Proceedings of FEL 2006 Conference Germany, http://www.jacow.org, pp. 91-94, 2006.
- [4] Fish, D. A., Brinicombe, A. M., Pike, E. R. & Walker, J. G. Blind deconvolution by means of the Richardson-Lucy algorithm. J. Opt. Soc. Am. A 12, 58 (1995).
- [5] Dey, N. et al. 3D Microscopy Deconvolution using Richardson-Lucy Algorithm with Total Variation Regularization. [Research Report] RR-5272, INRIA, https://hal.inria.fr/inria-00070726, pp. 71 (2004).
- [6] Virtanen P. et al., SciPy 1.0: Fundamental Algorithms for Scientific Computing in Python. Nat. Methods 17, 261 (2020).
- [7] Rohringer, N., Gordon, A. & Santra, R. Configuration-interaction-based time-dependent orbital approach for ab initio treatment of electronic dynamics in a strong optical laser field. Phys. Rev. A 74, 043420 (2006).
- [8] Bertolino, M., Busto, D., Zapata, F. & Dahlström, J. M. Propensity rules and interference effects in laser-assisted photoionization of helium and neon. J. Phys. B: At. Mol. Opt. Phys. 53, 144002 (2020).
- [9] Bertolino, M. & Dahlström, J. M. Multiphoton interaction phase shifts in attosecond science. Phys. Rev Res. 3, 013270 (2021).
- [10] Simon, B. The definition of molecular resonance curves by the method of exterior complex scaling. Phys. Lett. 71, 211 (1979).
- [11] Tao, L. & Scrinzi, A. Photo-electron momentum spectra from minimal volumes: The time-dependent surface flux method. New J. Phys. 14, 013021 (2012).
- [12] Morales, F., Bredtmann, T. & Patchkovskii, S. iSURF: A family of infinite-time surface flux methods. J. Phys. B: At. Mol. Opt. Phys. 49, 245001 (2016).
0.1 Data availability
All the relevant data that supports the main findings of the paper are included here. Any additional data related to this study are available from the corresponding authors upon request.
We acknowledge financial support from LASERLAB-EUROPE (grant agreement no. 654148, European Union’s Horizon 2020 research and innovation programme). S.N. thanks CNRS and Fédération de Recherche André Marie Ampère, Lyon for financial support. J.M.D. acknowledges support from the Knut and Alice Wallenberg Foundation (2017.0104 and 2019.0154), the Swedish Research Council (2018-03845) and the Olle Engkvist’s Foundation (194-0734). R.F. thanks the Swedish Research Council (2018-03731) and the Knut and Alice Wallenberg Foundation (2017.0104) for financial support. P.E.-J. acknowledges support from the Swedish Research Council (2017-04106) and the Swedish Foundation for Strategic Research (FFL12-0101).
E.O. and M.B. contributed equally to this work. D.B., C.C., M. Di F., P.E.-J., R.F., G.G., M.G., S.M., L.N., J.P., O.P., K.C.P., R.J.S., S.Z. and S.N. performed the experiment. E.O., M.B., S.C., F.Z. and J.M.D. provided the theoretical calculations. E.O. developed the analytical model and M.B. carried out the TDCIS calculations. S.N. analyzed the data. M. Di F., O.P. and C.C. managed the LDM end-station. R.J.S. and R.F. operated the magnetic bottle electron spectrometer. L.B., M.B.D., F.S., and L.G. optimized the machine. M.Ma. and M.Z. characterized the pulses. P.V.D. contributed to the analysis of obtained results. M.Me. and C.M. contributed to the initial planning of the project. S.N. and J.M.D. wrote the manuscript, which all authors discussed. S.N. led the project.
The authors declare no competing interests.
Correspondence and requests for materials should be addressed to J.M.D. (email: marcus.dahlstrom@matfys.lth.se) or S.N. (email: saikat.nandi@univ-lyon1.fr).


| Final state | ||
|---|---|---|
| -wave | 0.009311 | 0.1056 |
| -wave | 0.01298 | -1.300 |