A combined VANDELS and LEGA-C study: the evolution of quiescent galaxy size, stellar mass and age from to
Abstract
We study the relationships between stellar mass, size and age within the quiescent population, using two mass-complete spectroscopic samples with , taken from VANDELS at , and LEGA-C at . Using robust Dn4000 values, we demonstrate that the well-known ‘downsizing’ signature is already in place by , with Dn4000 increasing by across a 1 dex mass interval for both VANDELS and LEGA-C. We then proceed to investigate the evolution of the quiescent galaxy stellar mass-size relation from to . We find the median size increases by a factor of at , and see tentative evidence for flattening of the relation, finding slopes of and for VANDELS and LEGA-C respectively. We finally split our sample into galaxies above and below our fitted mass-size relations, to investigate how size and Dn4000 correlate. For LEGA-C, we see a clear difference, with larger galaxies found to have smaller Dn4000 at fixed stellar mass. Due to the faintness and smaller numbers of the VANDELS sample, we cannot confirm whether a similar relation exists at . We consider whether differences in stellar age or metallicity are most likely to drive this size-Dn4000 relation, finding that any metallicity differences are unlikely to fully explain the observed offset, meaning smaller galaxies must be older than their larger counterparts. We find the observed evolution in size, mass and Dn4000 across the Gyr from to can be explained by a simple toy model in which VANDELS galaxies evolve passively, whilst experiencing a series of minor mergers.
keywords:
galaxies: evolution – galaxies: star formation – galaxies: high-redshift1 Introduction
The formation and quenching of quiescent galaxies is still one of the most debated subjects in extragalactic astronomy. However, the last 20 years has undoubtedly seen major progress, as a result of ever-expanding and increasingly deep photometric and spectroscopic surveys, such as the Sloan Digital Sky Survey (SDSS; York et al., 2000), zCOSMOS (Lilly et al., 2007), the UKIRT Infrared Deep Sky Survey (UKIDSS; Lawrence et al., 2007) and the Cosmic Assembly Near-Infrared Deep Extragalactic Legacy Survey (CANDELS; Grogin et al., 2011; Koekemoer et al., 2011).
One of the key foundational results that shapes our understanding of galaxy evolution is the galaxy colour bimodality. First quantified in detail using SDSS data in the early 2000s (e.g. Strateva et al. 2001; Baldry et al. 2004), two distinct sub-populations of galaxies were identified. These are commonly referred to as the “red sequence” of quiescent galaxies and “blue cloud” of star-forming galaxies. These two populations are bridged by a smaller number of galaxies in transition between the blue cloud and red sequence, widely referred to as “green valley” galaxies. The observation of this sharp divide in the local Universe naturally led to questions as to when and why galaxies transition to the red sequence.
More recently, deep spectroscopic studies have firmly established that quiescent galaxies, as well as the colour bimodality, already exist at least as early as redshift, (e.g. Cimatti et al. 2002; Abraham et al. 2004; Halliday et al. 2008, Schreiber et al. 2018). However, photometric studies of the galaxy stellar-mass function (GSMF) have demonstrated that quiescent galaxy number densities have risen rapidly since this time, with quiescent galaxies making up less than 10 per cent of the total mass budget at , rising to around 75 per cent at (e.g. Fontana et al. 2006; Muzzin et al. 2013; Davidzon et al. 2017; McLeod et al. 2021; Santini et al. 2021).
The existence of the colour bimodality across the majority of cosmic history, coupled with the mass dominance of quiescent galaxies at late times, has firmly established quenching as one of the key questions in galaxy evolution (e.g. Peng et al., 2010; Somerville & Davé, 2015). However, despite our expanding observational capabilities, it has proven challenging to clearly identify the key processes responsible for quenching, and whether their relative importance changes as a function of redshift.
A wide range of different potential quenching mechanisms have been discussed in the literature. Mechanisms that are directly linked to the internal processes of a galaxy (e.g. quasar-mode and radio-mode AGN feedback) are often characterised as “internal” or “mass” quenching mechanisms (e.g. Croton et al., 2006; Choi et al., 2018). In contrast, mechanisms associated with galaxy-galaxy interaction (e.g. mergers, harassment), or interaction between a galaxy and the intracluster medium (e.g. ram pressure stripping) are typically described as “environmental” or “satellite” quenching.
To understand how these processes each contribute to galaxy quenching, much effort has been invested in characterising the physical properties of quiescent galaxies across cosmic time, and how these differ from those of star-forming galaxies. One of the most critical results, again derived from SDSS data, was the discovery that local quiescent galaxies follow a steeper relationship between stellar mass and size than local star-forming galaxies, and that, at stellar masses log, quiescent galaxies are smaller than their star-forming counterparts (Shen et al., 2003).
Motivated by this, significant progress has been made using deep optical and near-infrared imaging surveys to characterise the relationship between the sizes and stellar masses of both quiescent and star-forming galaxies out to high redshifts (e.g. Daddi et al., 2005; Trujillo et al., 2006; Wu et al., 2018b; Mowla et al., 2019; Suess et al., 2019a, b; Nedkova et al., 2021). These studies have demonstrated that different mass-size relations for quiescent and star-forming galaxies were already in place by . In addition, significant growth is observed in the average sizes of quiescent galaxies over time, increasing by a factor of between and (e.g. McLure et al., 2013; van der Wel et al., 2014).
It is tempting to interpret increasing average sizes for the quiescent population simply as evidence for the size growth of individual quiescent galaxies, usually assumed to be the result of merger events. However, the situation is complicated by recently quenched star-forming galaxies continuing to arrive on the red sequence over time. As star-forming galaxies are, on average, larger than quiescent galaxies, the addition of these new galaxies to the quiescent population could also plausibly explain this effect (e.g. Belli et al., 2015). Issues of this nature when comparing similarly selected galaxy samples at different redshifts are commonly referred to as “progenitor bias” (e.g. van Dokkum & Franx, 1996).
Because of the challenges introduced by progenitor bias, a variety of more sophisticated methods have been developed to evolve high-redshift galaxy samples down to the local Universe, with the aspiration of defining evolutionary tracks connecting progenitors and descendants (e.g. Zheng et al., 2007; van Dokkum et al., 2010; Cimatti et al., 2012; Shankar et al., 2015; Belli et al., 2019; Carnall et al., 2019a; Tacchella et al., 2021). A key parameter that can be introduced to break degeneracies in such analyses is the age of a galaxy’s stellar population, or more generally its star-formation history (SFH; e.g. Carnall et al. 2019b, Leja et al. 2019).
Historically, attempts to constrain the ages of quiescent galaxies have tended to focus on specific spectral features, such as Dn4000 and the H equivalent width (e.g. Balogh et al., 1999; Kauffmann et al., 2003). At , many studies have reported a positive correlation between Dn4000 and stellar mass (e.g. Brinchmann et al., 2004; Moresco et al., 2010; Moresco et al., 2011; Moresco et al., 2016; Haines et al., 2017; Siudek et al., 2017; Kim et al., 2018; Wu et al., 2018a). This has been widely associated with the “downsizing” trend, in which the stellar populations of more massive galaxies formed earlier in cosmic history, with present-day star formation concentrated in lower-mass galaxies (e.g. Cowie et al., 1996; Thomas et al., 2005).
Recently, the increasing availability of large, representative, spectroscopic samples at intermediate redshifts has facilitated analyses probing how size, age and stellar mass interrelate within the quiescent population. This has been partially motivated by earlier studies, spanning , that suggest larger galaxies tend to be younger than smaller galaxies within the quiescent population (e.g. van der Wel et al., 2014; Belli et al., 2015; Gargiulo et al., 2017).
At , Wu et al. (2018b) report a study of Dn4000 and H gradients across the stellar mass-size plane for a sample of 400 H-selected quiescent galaxies from the Large Early Galaxy Astrophysics Census (LEGA-C). At fixed mass, a negative correlation is found between Dn4000 and size, suggesting that larger galaxies are younger than their smaller counterparts. If confirmed, this result provides an opportunity to quantify progenitor bias within the quiescent population, and hence disentangle this effect from the merger-driven size growth of older galaxies post-quenching.
However, it is also well known that Dn4000 has a significant secondary dependence on stellar metallicity (e.g. Bruzual & Charlot, 2003). Recently, Barone et al. (2018, 2021) and Beverage et al. (2021) have reported no correlation between age and size at fixed stellar mass, instead suggesting that the observed correlation between Dn4000 and size is driven by a positive correlation between metallicity and the ratio of stellar mass to radius, acting as a proxy for the depth of a galaxy’s gravitational potential well.
Given this renewed discussion in the recent literature regarding the evolution of the quiescent galaxy population on the stellar mass-size plane, in this work we aim to improve our understanding by exploiting the combined statistical power provided by two recently completed surveys: VANDELS (McLure et al., 2018; Pentericci et al., 2018; Garilli et al., 2021) and LEGA-C (van der Wel et al., 2016, 2021; Straatman et al., 2018). These surveys provide ultra-deep spectroscopy for large, representative samples of quiescent galaxies, and we use them to construct mass-complete subsamples with , spanning redshift ranges from and for LEGA-C and VANDELS, respectively.
We begin by studying the relationship between Dn4000 and stellar mass via these new large spectroscopic samples. In particular, VANDELS provides the opportunity to confirm whether the clear Dn4000-mass trend seen at lower redshifts was already in place by . We then examine how size correlates with Dn4000 at fixed mass, and attempt to assess the relative contributions of age and metallicity to any size-Dn4000 trend. Finally, we discuss the level of progenitor bias and merger activity from to , using a simple toy model to explain the observed evolution.
The structure of this paper is as follows. We first give details of the VANDELS and LEGA-C datasets in Section 2. We then describe our sample selection and fitting methods in Section 3. We outline our results describing the correlations between size, Dn4000 and stellar mass in Section 4, then discuss these results in Section 5. We summarise our conclusions in Section 6. All magnitudes are quoted in the AB system, and throughout the paper we use cosmological parameters = , = 0.3 and = 0.7. We assume a Kroupa (2001) initial mass function.
2 DATA
2.1 The VANDELS spectroscopic survey
The VANDELS ESO Public Spectroscopic survey (McLure et al., 2018; Pentericci et al., 2018; Garilli et al., 2021) is an ultra-deep, medium-resolution, optical spectroscopic survey, targeting the Chandra Deep Field South (CDFS) and Ultra Deep Survey (UDS) fields. Data were obtained using the Visible Multi-Object Spectrograph (VIMOS; Le Fèvre et al., 2004) on the ESO Very Large Telescope (VLT). The final VANDELS data release (DR4; Garilli et al. 2021) provides spectroscopy for 2100 galaxies in the high-redshift Universe. VANDELS primarily targeted star-forming galaxies at and massive quiescent galaxies at , with quiescent galaxies making up 13 per cent of the final sample. In total, the survey covers an area of 0.2 deg2.
2.1.1 VANDELS Photometric Catalogues and selection criteria
The galaxies observed by VANDELS were drawn from four separate photometric catalogues, spanning a UV-NIR wavelength range from m. In the central regions of the CDFS and UDS fields, which benefit from CANDELS HST imaging, we make use of the catalogues produced by the CANDELS team (Galametz et al., 2013; Guo et al., 2013). Two further custom ground-based photometric catalogues were produced by McLure et al. (2018), covering the areas immediately surrounding the CANDELS footprints.
The VANDELS parent quiescent sample was selected from these photometric catalogues as follows. Objects were required to have , as well as i-band magnitudes of , and H-band magnitudes of , corresponding to stellar masses of (McLure et al., 2018). Quiescent objects were then selected via additional rest-frame UVJ magnitude criteria (e.g. Williams et al., 2009). In summary, the VANDELS parent quiescent sample was selected by:
-
•
-
•
-
•
-
•
0.49
-
•
-
•
These criteria produce a parent sample of 812 galaxies, of which approximately one third were observed as part of VANDELS.
2.1.2 VANDELS spectroscopic observations
In this section, we briefly summarise the VANDELS spectroscopic observations. We refer readers to Pentericci et al. (2018) for the full description. From the parent sample of 812 quiescent galaxies (see Section 2.1.1), 281 were randomly assigned slits and observed. Observations were made using the MR grism, which provides a resolution of over a wavelength range from Å. All objects were observed for 20, 40 or 80 hours to obtain SNRs of per resolution element (10 Å) in the iband. Spectroscopic redshifts, , were measured by the VANDELS team, with redshift quality flags assigned as described in Pentericci et al. (2018). In this paper, we use spectra from the VANDELS DR4 final data release (Garilli et al., 2021) and consider only those objects with robust spectroscopic redshifts (i.e quality flags 3 and 4, corresponding to a per cent probability of being correct). This produces an initial sample of 269 galaxies, of which 235 have .
2.2 The LEGA-C spectroscopic survey
The Large Early Galaxy Astrophysics Census (LEGA-C) is also an ESO Public Spectroscopy Survey, making use of VIMOS on the VLT. The full survey provides high-quality spectra for a primary sample of 3000 galaxies between , drawn from a 1.3 deg2 area within the UltraVISTA (McCracken et al., 2012) footprint in the COSMOS field. A full description of the survey design and data reduction can be found in van der Wel et al. (2016) and Straatman et al. (2018).
2.2.1 LEGA-C photometric catalogues and parent sample
The LEGA-C primary spectroscopic sample is drawn from a parent photometric sample of 10,000 galaxies. This parent sample was selected from the UltraVISTA DR1 catalogue of Muzzin et al. (2013) as follows. Galaxies were first selected to have , using spectroscopic redshifts where available (primarily from zCOSMOS), or otherwise photometric redshifts measured by Muzzin et al. (2013). A redshift-dependent band magnitude limit was then applied, ranging from K at , to K at , to K at . This ensures that galaxies in the LEGA-C sample are sufficiently bright in the observed spectroscopic wavelength range, from m.
2.2.2 LEGA-C spectroscopic observations
All LEGA-C observations were carried out using the high-resolution (HR-Red) grism, covering a typical wavelength range of Å at a spectral resolution of . Each galaxy received 20 hours of integration time, resulting in an average continuum SNR of 20 Å-1. The second data release (DR2) consists of 1988 spectra, including 1550 primary targets drawn from the parent sample described in Section 2.2.1. In this paper, we make use of the LEGA-C DR2 one-dimensional spectra, as well as Dn4000 measurements, sizes and spectroscopic redshifts. The LEGA-C team prioritise spectroscopic targets by -band magnitude, introducing an individual, -band-magnitude-dependent sample completeness correction factor, , for each object. We account for this by calculating LEGA-C median quantities weighted by these values throughout our analysis. For full details of the LEGA-C spectroscopic observations, we refer the reader to Straatman et al. (2018).
| Component | Parameter | Symbol / Unit | Range | Prior |
| Global | Redshift | - | - | |
| SFH | Stellar mass formed | (1, 1013) | log | |
| Metallicity | 1.0 | - | ||
| Falling slope | (0.1, 103) | log | ||
| Rising slope | (0.1, 103) | log | ||
| Peak time | / Gyr | (0.1, ) | uniform | |
| Dust | Attenuation at 5500Å | / mag | (0, 4) | uniform |
3 Method and sample selection
3.1 Selection of a mass-complete sample from VANDELS
To construct a mass-complete sample for our analysis, we begin by fitting the available photometric data for the 269 quiescent galaxies with robust spectroscopic redshifts in VANDELS DR4 (see Section 2.1.1), to obtain stellar masses and UVJ colours. We use the Bagpipes code (Carnall et al., 2018), with the 2016 updated version of the Bruzual & Charlot 2003 (BC03) stellar-population-synthesis models (BC16, see Chevallard & Charlot, 2016). We adopt the double-power-law SFH model described in Carnall et al. (2020), the Calzetti et al. (2000) dust attenuation law, and fixed Solar metallicity for consistency with previous studies (we assume Solar metallicity, ). Details of the parameter ranges and priors used are presented in Table 1.
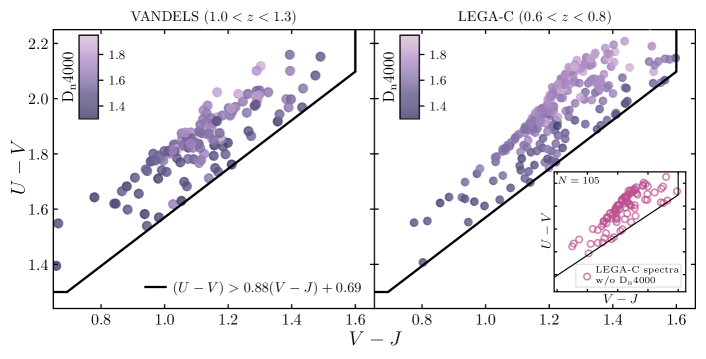
We first impose stricter UVJ criteria using the Bagpipes colours, requiring . This criterion has been shown to consistently select objects with sSFRs less than (Carnall et al., 2018; Carnall et al., 2019a), where is the age of the Universe, a widely applied criterion for quiescent galaxy selection (e.g. Pacifici et al. 2016). A total of 209 objects meet this UVJ criterion.
The VANDELS quiescent sample is not mass complete across the whole redshift range from , and we therefore impose further spectroscopic-redshift and stellar-mass limits to define a mass-complete subsample. Following Carnall et al. (2019a), we select only objects with redshifts and stellar masses (see their section 3). This narrows our VANDELS sample down to 138 objects.
In summary, our mass-complete VANDELS sample is selected by:
-
•
-
•
-
•
-
•
-
•
We finally visually inspect the VANDELS spectra, and remove one further object for which the spectrum is highly contaminated. Our final mass-complete sample therefore consists of 137 galaxies. These are shown on the UVJ diagram in the left-hand panel of Fig. 1.
3.2 Selection of a mass-complete sample from LEGA-C
In order to define our final mass-complete LEGA-C quiescent sample, we begin with the 1550 primary objects of the LEGA-C DR2 release (see Section 2.2). We first exclude objects flagged by the LEGA-C team as having flawed spectra or unreliable redshift measurements. This produced an initial sample of 1212 star-forming and quiescent galaxies between .
To generate stellar masses and UVJ colours for the LEGA-C galaxies, we use photometry from the updated UltraVISTA DR2 catalogue of Laigle et al. (2016). We cross-match our 1212 LEGA-C galaxies with the Laigle et al. (2016) catalogue, finding 1165 matches. We again fit the photometry with Bagpipes, using the same approach described in Section 3.1. The stellar masses generated by Bagpipes are fully consistent with the masses calculated by the LEGA-C team based on
AST  \citep[][]{kriek2009_fastcode}, as well as the \cite{laigle2016} masses based on \verb LePHARE  \citep{arnouts_lephare, lephare_code_ilbert_06}.
At this point we restricted the redshift range of our LEGA-C sample to $0.6 \leq z \leq 0.8$, meaning that both our VANDELS and LEGA-C samples span similar, $\sim$1 Gyr, periods of cosmic time. This both limits the amount of evolution  taking place within each sample, as well as maximising the time interval between the two samples. LEGA-C is mass complete down to $\mathrm{log_{10}}(M_{\star}/\mathrm{M_{\odot}}) \sim 10$, however we impose a slightly higher mass cut to facilitate direct comparisons with the VANDELS sample, again requiring $\mathrm{log_{10}}(M_{\star}/\mathrm{M_{\odot}}) \geq 10.3$. These two criteria reduce the sample to 656 star-forming and quiescent galaxies. We then apply the same UVJ selection criteria as described in Section \ref{mass-complete_selection_vandels}, resulting in a LEGA-C quiescent sample of 377 galaxies. These are shown in the right-hand panel of
ig. 1.
Due to the truncation of some LEGA-C spectra at the red end, not all LEGA-C galaxies have Dn4000 measurements in the DR2 catalogue. From our sample of 377 objects, 272 galaxies have measurable Dn4000 values. One further object has an extremely large uncertainty on Dn4000, and is therefore excluded from our analysis. In addition, we remove three galaxies for which reliable sizes could not be obtained with Galfit (see Section 3.3), resulting in a final LEGA-C sample of 268 quiescent galaxies with both size and Dn4000 information.
| VANDELS | LEGA-C | |||||||
| Mass Range | Dn4000med | Dn4000stack | Dn4000med | Dn4000stack | ||||
| 10.3 10.7 | 46 | 10.51 | 1.52 | 1.54 | 52 | 10.57 | 1.60 | 1.60 |
| 10.7 11.1 | 69 | 10.90 | 1.59 | 1.60 | 125 | 10.86 | 1.66 | 1.64 |
| 11.1 11.5 | 22 | 11.21 | 1.62 | 1.62 | 87 | 11.26 | 1.72 | 1.72 |
3.3 Measuring galaxy sizes
Size measurements for the final sample of VANDELS quiescent galaxies were derived from single Sérsic fitting of their two-dimensional light profiles using Galfit (Peng et al., 2002). Within the CANDELS footprint, we use HST F160W imaging for both UDS and CDFS objects. Outside the CANDELS footprints, in CDFS we use HST ACS F850LP imaging, and in UDS we use ground-based Hband imaging from UKIDSS.
For the HST imaging, the Sérsic index (n), effective radius (), axis ratio, magnitude and position angle are left as free parameters. For the objects we fitted using the UKIDSS ground-based imaging, we find that the spatial resolution of the Hband data is not good enough to confidently constrain the Sérsic index, and we instead assume a constant value of during the fitting process111This value was chosen for consistency with the Sérsic indices found for galaxies with HST imaging. Objects with HST F160W imaging have a median Sérsic index of , and a mean of , suggesting a fixed value of for objects with ground-based imaging is a reasonable assumption.. The rest of the parameters are left free.
We cross-check our size measurements against the results of van der Wel et al. (2012, 2014) for common objects, finding good agreement (within dex). In addition, we internally cross-compare the results we obtain for galaxies in each of the four input VANDELS catalogues, demonstrating that the different imaging datasets we employ for size measurement produce consistent results.
For the LEGA-C galaxies, we use the Galfit size information provided by the LEGA-C team as part of the DR2 release. These are derived using the methods described in van der Wel et al. (2012) and van der Wel et al. (2016), and are based on the original HST ACS F814W imaging in COSMOS (Scoville et al., 2007). We note that because the LEGA-C size measurements are based on shorter-wavelength F814W imaging, colour gradients could introduce an offset in sizes relative to those measured for the VANDELS sample. The expected magnitude of this effect is dex (e.g. van der Wel et al., 2014), well within our size-measurement uncertainty. This potentially introduces a small systematic uncertainty into the size evolution calculations presented in Section 5.
3.4 Measuring Dn4000
In this paper, we use the “narrow” definition of the 4000 Å break index, Dn4000, which has the advantage of being less sensitive to extinction effects (e.g. Balogh et al., 1999; Kauffmann et al., 2003; Martin et al., 2007; Silverman et al., 2009). Dn4000 is calculated as the ratio between the flux per unit frequency in the red continuum band ( Å) and the blue continuum band ( Å),
| (1) |
where are the upper and lower bounds of the blue () and red () narrow continuum bands defined above.
For all galaxies in our final quiescent VANDELS sample, we calculate our own Dn4000 values directly from the VANDELS spectra, obtaining results for all 137 objects. These have an average uncertainty of 0.02. For the LEGA-C galaxies, we make use of the Dn4000 values from the LEGA-C DR2 catalogue, which have an average uncertainty of 0.01.
3.5 Stacked spectra
In order to investigate the average spectral properties of the galaxies in our VANDELS and LEGA-C samples, we construct several median stacked spectra in bins of size and mass. These stacks are all constructed following the same standard procedure. When constructing a stacked spectrum, we first de-redshift and re-sample the individual spectra onto a common wavelength grid, using the SpectRes module for spectral re-sampling (Carnall, 2017). We then take the median flux across all the spectra in each pixel, and calculate uncertainties via the robust median absolute deviation (MAD) estimator.
The stacked spectra are normalised by the median flux in the blue continuum band of the 4000 Å break, in units of erg s-1 cm-2 Hz-1. This means that the median flux density in the blue band lies at = 1.0, and the median flux in the red continuum band is equal to the value of the Dn4000 index for that stacked spectrum.
4 Results
4.1 The relationship between stellar mass and Dn4000
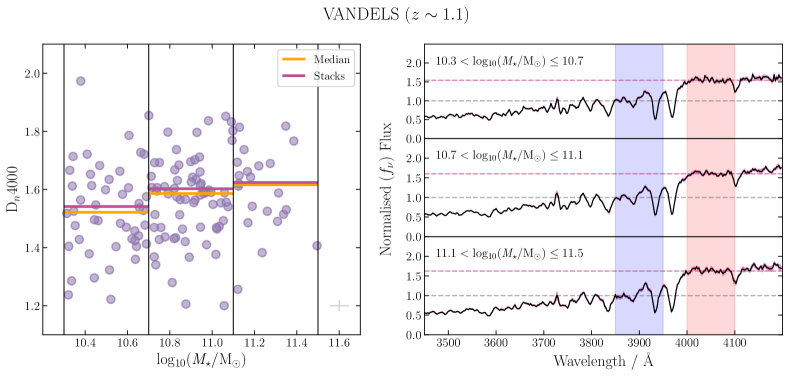
In Fig. 2, we show the relationship between stellar mass and Dn4000 for our mass-complete VANDELS sample (see Section 3.1). In the left-hand panel, we show Dn4000 values for each individual galaxy, highlighting the median values in three 0.4-dex stellar-mass bins. In the right-hand panels, we show median stacked spectra in the same three mass bins. The dashed grey and pink lines indicate the median fluxes in the blue and red bands of the Dn4000 index, respectively. Due to our choice of normalisation, the pink lines correspond to the Dn4000 values calculated from the stacked spectra. In Table 2, we also present the median Dn4000 values for galaxies in each mass bin, along with the Dn4000 values derived from the stacks.
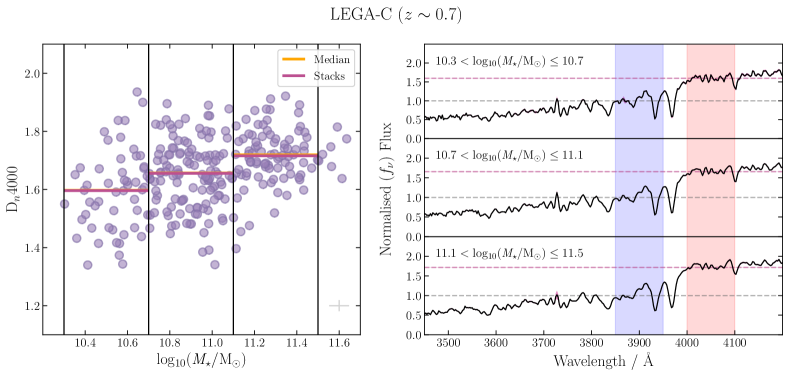
Fig. 3 shows the relationship between stellar mass and Dn4000 for our mass-complete LEGA-C sample (see Section 3.2), following the same format as Fig. 2. The median and stacked Dn4000 values shown in Fig. 3 for LEGA-C are also listed in Table 2.
A clear positive correlation between stellar mass and Dn4000 is visible in both the VANDELS and LEGA-C samples, with good agreement found in all cases between the median Dn4000 values for individual objects and the values derived from our stacked spectra. For both VANDELS and LEGA-C, the increase in average Dn4000 across the mass range we probe is . In addition, similar evolution is observed between VANDELS and LEGA-C at fixed mass in all three bins, with an average evolution in Dn4000 of across the Gyr that separates our two samples.
4.2 The VANDELS and LEGA-C mass-size relations
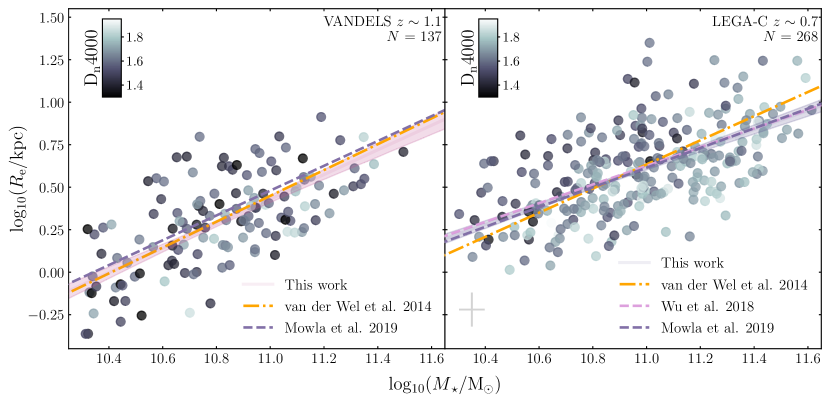
We show our VANDELS and LEGA-C samples on the stellar mass-size plane in Fig. 4, together with best-fitting relations of the form:
| (2) |
where is the effective radius, is the slope, and is the normalisation (van der Wel et al., 2014). When fitting for the free parameters , we adopt the stellar-mass uncertainties provided by the Bagpipes spectral fits. However, because the formal errors produced by Galfit are known to be significantly underestimated (e.g. Häussler et al., 2007), we adopt a constant error of dex on the effective radii as a more realistic estimate of the typical uncertainty (e.g. Bruce et al., 2012; McLure et al., 2013).
For our mass-complete sample of 137 VANDELS quiescent galaxies, we find best-fit parameters of and log. The best-fitting relationship is shown with a dark pink line in the left-hand panel of Fig. 4. The confidence interval is shaded pink. Previous results from van der Wel et al. (2014) and Mowla et al. (2019) are shown for comparison.
We perform the same fitting on the LEGA-C sample, using only the 272 objects with Dn4000 values (see Section 3.2). We find a shallower slope than the higher-redshift VANDELS sample, with best-fit parameters of and log. This relationship is shown with a dark blue line in the right-hand panel of Fig. 4. The confidence interval is shaded blue. Recent literature results at from van der Wel et al. (2014), Wu et al. (2018a) and Mowla et al. (2019) are shown for comparison.
In order to ensure that our results are not biased by adopting the subset of the LEGA-C sample with Dn4000 measurements, we also fit the full sample of 377 galaxies, obtaining best-fit parameters of = and log(A) = . The excellent agreement between these results and those quoted above for the Dn4000 subset means that, in the following section, we can compare our VANDELS sample to the LEGA-C subset with Dn4000 measurements, confident that our results are not sensitive to this choice.
| VANDELS | Galaxies above mass-size relation | Galaxies below mass-size relation | ||||||||
| Mass Range | Dn4000med | Dn4000stack | Dn4000med | Dn4000stack | ||||||
| 10.3 10.7 | 22 | 10.56 | 1.56 | 1.56 | 0.27 | 24 | 10.46 | 1.49 | 1.50 | -0.07 |
| 10.7 11.1 | 31 | 10.86 | 1.55 | 1.56 | 0.48 | 38 | 10.93 | 1.61 | 1.62 | 0.24 |
| 11.1 11.5 | 7 | 11.15 | 1.61 | 1.64 | 0.67 | 15 | 11.24 | 1.62 | 1.60 | 0.48 |
| LEGA-C | Galaxies above mass-size relation | Galaxies below mass-size relation | ||||||||
| Mass Range | Dn4000med | Dn4000stack | Dn4000med | Dn4000stack | ||||||
| 10.3 10.7 | 24 | 10.51 | 1.55 | 1.53 | 0.50 | 27 | 10.56 | 1.65 | 1.64 | 0.21 |
| 10.7 11.1 | 64 | 10.85 | 1.62 | 1.59 | 0.68 | 60 | 10.87 | 1.70 | 1.68 | 0.40 |
| 11.1 11.5 | 33 | 11.28 | 1.68 | 1.67 | 0.91 | 54 | 11.25 | 1.73 | 1.71 | 0.65 |
4.3 Stellar mass-size trends with Dn4000
Having considered the mass-Dn4000 and mass-size relations for our samples separately in Sections 4.1 and 4.2, we now combine these analyses to consider the relationship between galaxy size and Dn4000. Given that both quantities depend strongly on stellar mass, it is critical to separate out this dependency as much as possible (e.g. by using narrow stellar-mass bins) in order to delineate any correlation between Dn4000 and size.
The VANDELS and LEGA-C samples are shown on the mass-size plane in Fig. 4, colour-coded by Dn4000. For the LEGA-C sample at , a vertical trend appears to be visible, with galaxies below the mass-size relation tending to have higher Dn4000 values (lighter colours) than galaxies above the relation. For the VANDELS sample, a corresponding trend is not clearly visible. This is perhaps not surprising, given the smaller number of VANDELS objects, and the larger uncertainties on the individual Dn4000 measurements due to the lower SNR of the VANDELS spectra.
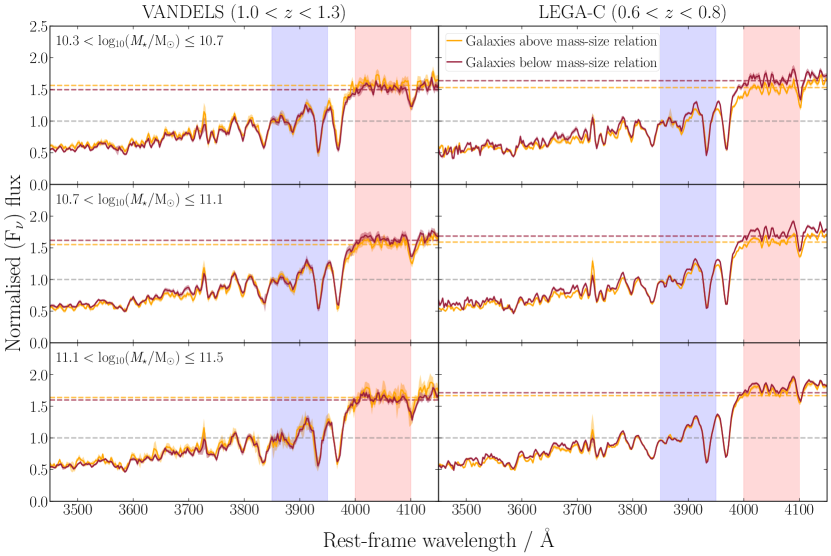
Motivated by the apparent size-Dn4000 trend visible for LEGA-C in Fig. 4, we implement an approach similar to that of Section 4.1, splitting our VANDELS and LEGA-C samples into the same three 0.4-dex stellar-mass bins, before splitting each mass bin into two size bins. Galaxies are separated in size by their position relative to the best-fitting mass-size relations derived in Section 4.2, with those above being separated from those below. This results in three mass bins for galaxies above the mass-size relation, and three mass bins for galaxies below the mass-size relation.
As in Section 4.1, we generate stacked spectra for each mass-size bin, from which we measure Dn4000 values. The six stacked spectra generated for our VANDELS and LEGA-C samples are shown in Fig. 5. The Dn4000 values for each stack are listed in Table 3, along with median Dn4000 values for the individual galaxies entering each stack. From Fig. 5 and Table 3, it can be seen that LEGA-C galaxies lying below the mass-size relation have significantly higher Dn4000 values than those above the relation. Smaller-than-average galaxies have higher Dn4000 by in the lower two mass bins, whereas the difference is in the highest-mass bin. This offset is most significant () in the middle-mass bin, where the number of objects is greatest, but is also clearly visible ( significance) in the highest-mass and lowest-mass bins.
For VANDELS, we do not observe a significant difference in average Dn4000 values above and below the mass-size relation in any of our three stellar-mass bins. This could of course simply indicate that the size-Dn4000 trend observed in LEGA-C was not in place at . However, as discussed above, the smaller number of objects in the VANDELS sample, coupled with the individual spectra having lower SNRs, makes it difficult to draw any firm conclusions. For example, it can be seen from the uncertainties quoted in Table 3 that, in a given stellar-mass bin, the difference in Dn4000 above and below the mass-size relation would have to be in order to be detected with significance in the VANDELS sample.
5 Discussion
In Section 4, we have considered the relationships between stellar mass, size and Dn4000 for two mass-complete samples of quiescent galaxies with , at from LEGA-C, and at from VANDELS. In this section we discuss these results, with a particular focus on whether the observed trends in Dn4000 are driven by stellar age or metallicity, and also on understanding the changes in the quiescent population across the Gyr that separates the VANDELS and LEGA-C samples.
5.1 Evidence of downsizing from stellar mass vs Dn4000
In Section 4.1, we report a clear relationship between stellar mass and Dn4000 for both our VANDELS and LEGA-C samples, such that, on average, more massive galaxies have higher Dn4000. This is in good agreement with previous studies at (e.g. Kauffmann et al., 2003; Brinchmann et al., 2004; Haines et al., 2017; Kim et al., 2018; Wu et al., 2018a), and has been widely interpreted as evidence that more massive galaxies are older (often referred to as downsizing, or archaeological downsizing). Our VANDELS result demonstrates this downsizing signal was already in place at for the first time using a large, representative, spectroscopic sample.
In this context, the trends between Dn4000 and stellar mass seen in Fig. 2 and Fig. 3 can be securely interpreted in terms of stellar populations of different ages, given the broad agreement in the literature that the stellar mass vs stellar metallicity relation is relatively flat at (e.g. Gallazzi et al. 2005, 2014; Panter et al. 2008; Choi et al. 2014; Leethochawalit et al. 2018; Carnall et al. 2021). We also see an increase in Dn4000 between VANDELS and LEGA-C, of at fixed stellar mass. This redshift evolution is discussed in Section 5.4.
5.2 Stellar mass-size relations
The stellar mass-size relations followed by both star-forming and quiescent galaxies have been extensively investigated over the past two decades. Over the widest dynamic range in stellar mass, there is now good evidence that quiescent galaxies follow a mass-size relation that is well described by a double power law (e.g. Nedkova et al., 2021; Kawinwanichakij et al., 2021). However, at high stellar masses (i.e. ), it is clear that quiescent galaxies follow a linear relation (see Equation 2), with a normalisation that evolves rapidly with redshift (e.g. Shen et al., 2003; Buitrago et al., 2008; McLure et al., 2013; van der Wel et al., 2014; Wu et al., 2018b; Mowla et al., 2019). It is much less clear whether the slope of the mass-size relation also evolves with time: most studies report values in the range , with no clear redshift trend emerging.
The mass-size relations we derive in this work, based on robust, mass-complete, spectroscopically confirmed galaxy samples at and , are consistent with recent literature results based on larger galaxy samples based on photometric redshifts. Our results indicate that, at a given stellar mass, massive quiescent galaxies grow by a factor of over the Gyr of cosmic time that separates our two samples.
Our results also provide tentative evidence that the slope of the mass-size relation may flatten () over the same interval, although we note that any flattening is only significant at the level. This tentative flattening of the relation could potentially be explained by larger newly-quenched galaxies, arriving onto the stellar mass-size distribution between . In Section 5.4, we explore whether a simple minor-merger model can explain the evolution of the quiescent galaxy mass-size relation suggested by our VANDELS and LEGA-C galaxy samples.
5.3 The size-Dn4000 relation: changing age or metallicity?
The spectral index Dn4000 is best known as a way of inferring ages for older stellar populations (e.g. Balogh et al. 1999; Kauffmann et al. 2003). However, the strength of this break is also known to depend somewhat on metallicity (e.g. Bruzual & Charlot, 2003).
In Wu et al. (2018b), the authors report a size-Dn4000 relationship for a similar sample of LEGA-C quiescent galaxies, and suggest that this is driven by a difference in the average ages of larger and smaller objects. However, other studies (e.g. Barone et al., 2021; Beverage et al., 2021) have reported a size-metallicity correlation via full spectral fitting analyses, casting doubt as to whether any size-Dn4000 trend should be attributed primarily to differences in average age or metallicity.
In Section 4.3, we have established that there is a trend between size and Dn4000 for our LEGA-C sample, with smaller galaxies having higher Dn4000. Averaged over our three mass bins, the mean Dn4000 offset is , in good agreement with Wu et al. (2018b).
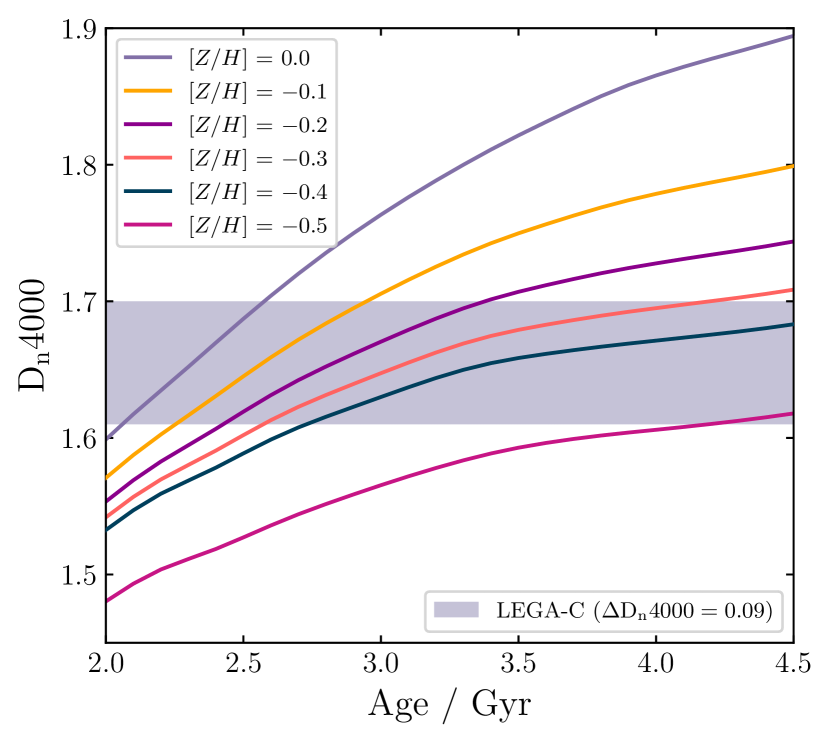
To investigate the influence of age and metallicity on Dn4000 in the context of our LEGA-C sample, we use Bagpipes to run a grid of models with simple, 1-Gyr-duration constant star-formation histories, using the BC03 stellar-population models. In Fig. 6, we show the relationship between Dn4000 and mean stellar age, for a range of metallicities (note that we assume ). Also shown with indigo shading is the gap between the median Dn4000 values above and below the mass-size relation in our middle LEGA-C stellar-mass bin. This mass bin was chosen as it contains the most objects, and hence has the best-constrained median Dn4000 values.
Under this simple set of assumptions, and within the range of plausible metallicities (i.e. [Z/H] ), it can be seen that our Dn4000 of 0.09 suggests a difference in age of Gyr, if the average metallicities in the two size bins are the same (the horizontal distance over which the lines shown move from the bottom to the top of the shaded region). Conversely, if both bins contain objects with the same average ages, a metallicity offset of dex is required to explain the observed difference in Dn4000 values.
Several leading studies have reported that massive, quiescent galaxies at exhibit a scatter in metallicity of dex (Gallazzi et al. 2014, Tacchella et al. 2021). Even in the most extreme possible scenario, for which all galaxies above the mass-size relation have below-average metallicities and vice versa, this level of scatter is not sufficient to produce the dex metallicity offset required to fully explain the Dn4000 = 0.09 observed in our middle LEGA-C mass bin. We therefore conclude that the size-metallicity relations found by Barone et al. (2021) and Beverage et al. (2021) cannot fully explain our observed size-Dn4000 trend, meaning a size-age relation is likely to also be present in our LEGA-C sample, with a magnitude of 500 Myr.
As discussed in Section 4.3, we do not observe a significant size-Dn4000 relation for our VANDELS sample. From Fig. 6, it can be seen that any size-Dn4000 trend due to a fixed offset in age or metallicity would be smaller in a population of younger galaxies. We therefore would not expect to see clear evidence of a size-age or size-metallicity relation in VANDELS with similar magnitude to the one we observe for LEGA-C, given the larger uncertainties on our binned VANDELS median Dn4000 values.
5.4 A model linking the VANDELS and LEGA-C samples
Having established the level of evolution between the LEGA-C and VANDELS samples in terms of stellar mass, size and Dn4000, in this section we investigate whether or not the observed evolution is compatible with the simplest possible toy model. Specifically, we investigate whether the observed size and Dn4000 evolution can be explained by passively evolving the VANDELS galaxies by Gyr at constant metallicity, with the growth in stellar mass and size being the result of a series of minor mergers.
5.4.1 Accounting for progenitor bias
In order to gain an accurate understanding of the relationship between the VANDELS and LEGA-C datasets, we first calculate the fraction of the LEGA-C sample that are likely descendants of the higher-redshift VANDELS galaxies, thus constraining the level of progenitor bias. Based on the original parent samples for both LEGA-C and VANDELS, we estimate that the comoving number densities of quiescent galaxies with at and are and , respectively. As a result, we conclude that the VANDELS sample can account for per cent of the progenitors of the LEGA-C sample.
Alternatively, we can map the VANDELS comoving number density to a higher-mass subset of the LEGA-C sample. We make the simplifying assumption here that the most massive objects in LEGA-C have been quenched long enough to be descended from the VANDELS sample at . Under this assumption, the VANDELS sample can account for 100 per cent of the progenitors of the LEGA-C sample with stellar masses . We adopt this latter assumption throughout the rest of this section, comparing the whole VANDELS sample () with the LEGA-C sample at .
5.4.2 Modelling the evolution of size, stellar mass and Dn4000
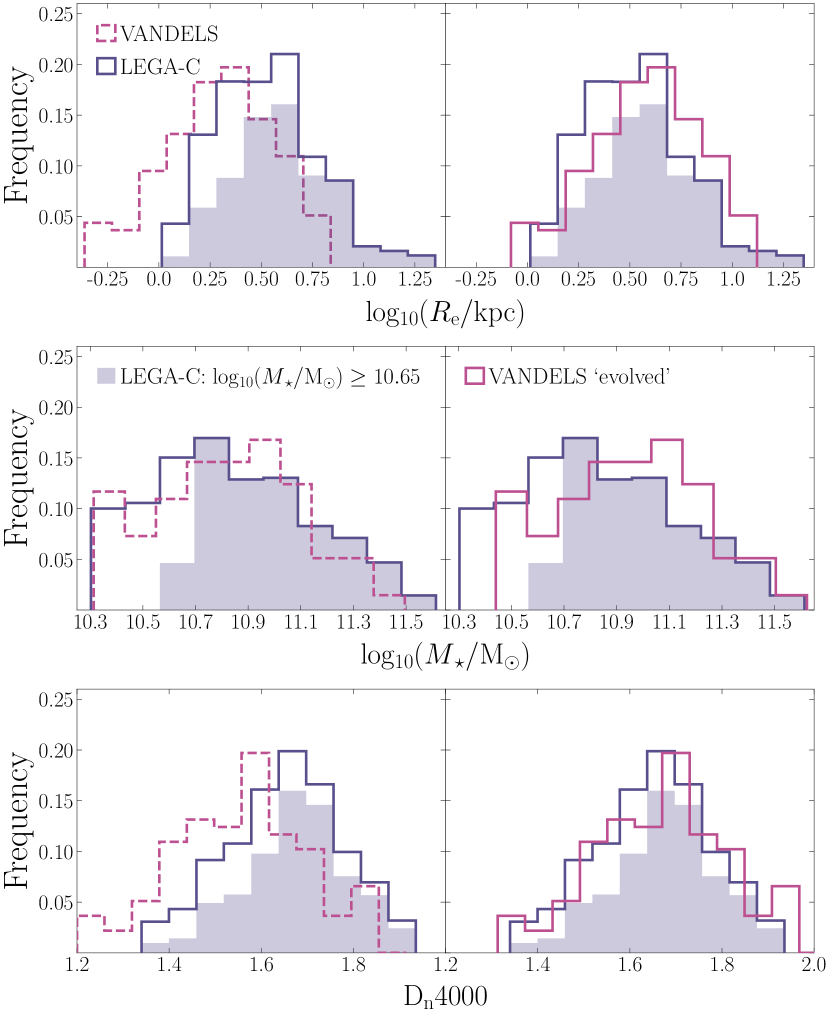
In the left-hand panels of Fig. 7, we show size, mass and Dn4000 histograms for the VANDELS (pink) and LEGA-C (indigo) samples. In order to explore whether the simplest set of assumptions possible can explain the trends observed in our data, we test a model wherein we calculate the shifts required to reconcile the two samples for each parameter, by finding the difference between the median of the VANDELS distribution and the median of LEGA-C galaxies with stellar masses (grey shading). In the right-hand panels of Fig. 7, we compare the original LEGA-C distributions to those of the shifted/evolved VANDELS sample, where the shifts applied in , and Dn4000 are 0.28, 0.13 and 0.11, respectively.
The application of a two-sample Kolmogorov–Smirnov (KS) test (Hodges, 1958) confirms that the distributions shown in the right-hand panels of Fig. 7 are statistically indistinguishable, with p–values of 0.84, 0.56 and 0.70 for the size, mass and Dn4000 distributions. In this case, a high p–value suggests there is no statistical evidence that the two underlying distributions are significantly different. This confirms that, apart from a systematic shift, there is no significant change in the shape of the size, mass and Dn4000 distributions between the LEGA-C and the VANDELS samples.
Moreover, we can test whether the implied change in the median Dn4000 value of is plausible, by comparing with the predictions shown in Fig. 6. Within the range of plausible metallicities (i.e. ), the tracks shown in Fig. 6 suggest that the change in Dn4000 over 2 Gyr will indeed lie in the range , as required. For massive quiescent galaxies at , Tacchella et al. (2021) find a median metallicity of [Z/H] = -0.27 (on our Solar abundance scale), suggesting an expected Dn4000 evolution of based on Fig. 6. Although encouraging, we note that further spectrophotometric analysis of both datasets will be required to fully understand the evolution in age and metallicity between the two samples.
5.4.3 Interpreting size growth via minor mergers
It has long been accepted that the most likely explanation for the observed size growth of the quiescent galaxy population is via dissipationless, so-called ‘dry’, mergers (e.g. Trujillo et al., 2011; van Dokkum et al., 2010; Cimatti et al., 2012; McLure et al., 2013). The dry merging is usually classified as either ‘major’, with a typical mass ratio of 1:3, resulting in size growth proportional to the accreted mass, or ‘minor’, with a typical mass ratio of 1:10, resulting in size growth proportional to the square of the accreted mass (Cimatti et al., 2012).
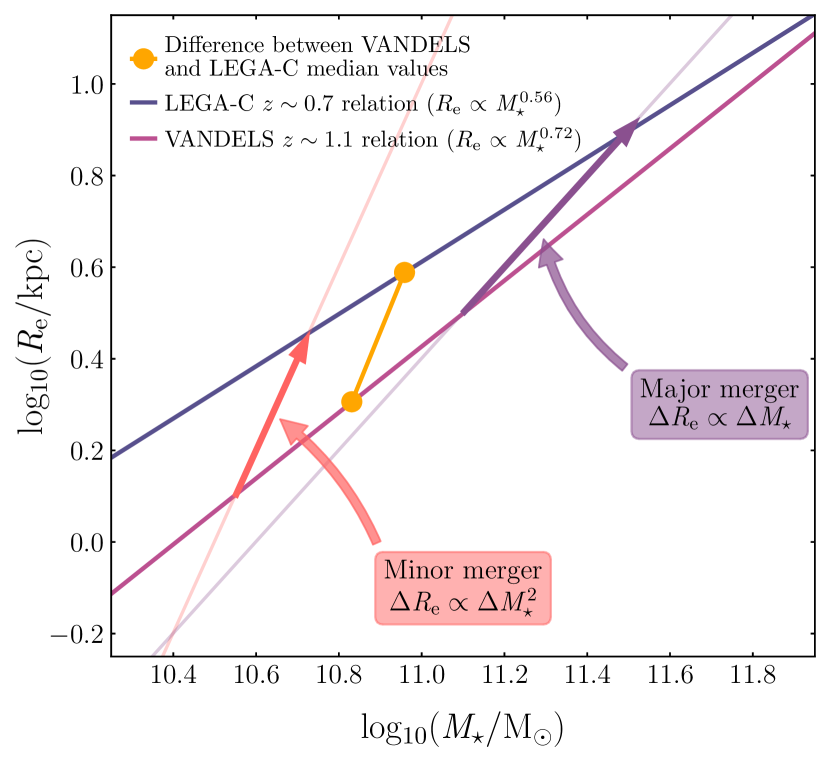
The potential growth of the VANDELS galaxies via major and minor mergers is illustrated in the schematic diagram shown in Fig. 8. The VANDELS and LEGA-C mass-size relations derived in Section 4.2 are again shown, along with representative vectors showing the directions galaxies are expected to move under the minor-merger and major-merger scenarios. The two joined orange points show the median values calculated in Section 5.4.2 for VANDELS galaxies, and for LEGA-C galaxies with stellar masses . For context, these median values are also shown overplotted on the whole VANDELS and LEGA-C samples on the mass-size plane in Fig. 9.
Fig. 8 immediately suggests that the observed evolution between VANDELS and LEGA-C is more consistent with minor mergers. As discussed in the previous section, the observed growth between the VANDELS and LEGA-C samples in terms of stellar mass and size are 0.13 dex and 0.28 dex (factors of 1.35 and 1.91), respectively. This is clearly consistent with a minor-merger scenario (i.e. . If we assume that minor mergers have a typical mass ratio of 1:10, the observed growth between VANDELS and LEGA-C is consistent with a series of three minor mergers within a time-span of Gyr.
It is clear from simulations that typical galaxies in the mass range under discussion here are unlikely to experience a major merger over the redshift interval (e.g. Hopkins et al., 2010; Johansson et al., 2012). This means that our results are consistent with the expectation that minor mergers are the dominant process driving quiescent galaxy growth at this epoch (e.g. Ownsworth et al., 2014; Buitrago et al., 2017).
5.4.4 Evolving the VANDELS sample down to
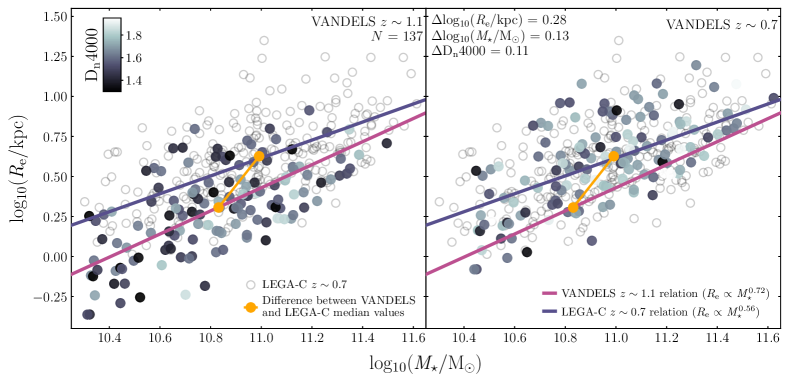
The expected future evolution of the VANDELS galaxies on the mass-size plane following our toy-model prescription is illustrated in Fig. 9. The left-hand panel shows the VANDELS sample at , along with the best-fitting mass-size relation determined in Section 4.2. In the right-hand panel, we show the location of the VANDELS galaxies after they have been "evolved" down to , using the average offsets from Section 5.4.2, as indicated in the top-left corner of the panel. The best-fitting mass-size relation for the LEGA-C sample at is also shown. Individual LEGA-C galaxies are shown with grey open circles in both panels.
It can immediately be seen from the right-hand panel of Fig. 9 that the two-dimensional distribution of the evolved VANDELS sample is well matched to that of LEGA-C (confirmed by a 2D KS test, Peacock 1983; ). As discussed above, the bottom-right panel of Fig. 7 demonstrates the two samples are also well matched in terms of their Dn4000 distributions, and that the required Dn4000 shift of 0.11 is consistent with 2 Gyr of passive ageing. Taken together, this suggests that our toy model, linking the two populations via a combination of passive evolution and minor mergers, is entirely plausible.
6 Conclusions
In this paper we have explored the relationships between stellar mass, size and Dn4000 for samples of quiescent galaxies at and , by utilising high-quality spectroscopic data from the VANDELS and LEGA-C surveys. Our main conclusions can be summarised as follows:
-
1.
In Section 4.1, we report a positive correlation between Dn4000 and stellar mass in both the LEGA-C () and VANDELS () samples, with a magnitude of across a dex interval in stellar mass. Within the mass and redshift ranges spanned by the two samples, we expect little or no correlation between stellar mass and metallicity (e.g. Beverage et al., 2021; Borghi et al., 2021). Consequently, we interpret this relationship between Dn4000 and stellar mass as being primarily driven by a correlation between stellar mass and stellar-population age (downsizing).
-
2.
In Section 4.2, we report a new mass-size relation for the VANDELS sample at , and confirm previous determinations of the mass-size relation for the LEGA-C sample at , with best-fitting slopes of = and , respectively. Our results provide tentative evidence for a flattening in the slope of the mass-size relation towards lower redshift, although the level of flattening () is only significant at the level.
-
3.
In Section 4.3, we find that, for the LEGA-C sample at fixed stellar mass, galaxies below the mass-size relation display larger Dn4000 values than galaxies above the relation. This is in good agreement with the previous analysis of LEGA-C by Wu et al. (2018b). A similar trend is not clearly seen within the VANDELS sample at , although the smaller sample size and lower SNR of the individual VANDELS spectra would make detecting such a trend unlikely.
-
4.
Our analysis suggests that the magnitude of the trend between Dn4000 and size observed within the LEGA-C sample cannot be fully explained by a relationship between size and metallicity, meaning that a size-age relation must also be present in the data, with a magnitude of Myr (see Section 5.3).
-
5.
We find that a simple toy model, based on a combination of passive evolution and minor mergers, can explain the observed evolution in stellar mass, size and Dn4000 between the VANDELS and LEGA-C samples. This scenario, assuming each VANDELS galaxy experiences Gyr of passive evolution, at a constant metallicity, together with a series of minor mergers, is sufficient to reproduce the distribution of the LEGA-C sample on the mass-size plane (see Section 5.4).
In the near future, there are excellent prospects for improving our understanding of the evolution of size, mass, age and metallicity within the quiescent galaxy population at . In addition to the unparalleled near-IR imaging and spectroscopic data promised by forthcoming James Webb Space Telescope programmes (e.g. PRIMER; Dunlop et al., 2021), large-scale optical-near-IR spectroscopic surveys, such as MOONRISE (Cirasuolo et al., 2020), will enable detailed studies of the quiescent galaxy population out to the highest redshifts.
Acknowledgements
M. L. Hamadouche acknowledges the support of the UK Science and Technology Facilities Council. A. C. Carnall acknowledges the support of the Leverhulme Trust. FB acknowledges support from grants PID2020-116188GA-I00 and PID2019-107427GB-C32 from The Spanish Ministry of Science and Innovation. MM acknowledges support from MIUR, PRIN 2017 (grant 20179ZF5KS) and grants ASI n.I/023/12/0 and ASI n.2018-23-HH.0. Based on observations made with ESO Telescopes at the La Silla or Paranal Observatories under programme ID(s) 194.A-2003(E-Q) (The VANDELS ESO Public Spectroscopic Survey) and IDs 194-A.2005 and 1100.A-0949 (The LEGA-C ESO Public Spectroscopic Survey). Based on data products from observations made with ESO Telescopes at the La Silla Paranal Observatory under ESO programme ID 179.A-2005 and on data products produced by TERAPIX and the Cambridge Astronomy Survey Unit on behalf of the UltraVISTA consortium. This research made use of Astropy, a community-developed core Python package for Astronomy (Astropy Collaboration et al., 2013, 2018).
Data Availability
The VANDELS survey is a European Southern Observatory Public Spectroscopic Survey. The full spectroscopic dataset, together with the complementary photometric information and derived quantities are available from http://vandels.inaf.it, as well as from the ESO archive https://www.eso.org/qi/. The LEGA-C data used in this paper are also publicly available from the ESO Science Archive. The LEGA-C spectra and catalogues are also available at https://users.ugent.be/~avdrwel/research.html#legac.
References
- Abraham et al. (2004) Abraham R. G., et al., 2004, AJ, 127, 2455
- Arnouts et al. (1999) Arnouts S., Cristiani S., Moscardini L., Matarrese S., Lucchin F., Fontana A., Giallongo E., 1999, MNRAS, 310, 540
- Astropy Collaboration et al. (2013) Astropy Collaboration et al., 2013, A&A, 558, A33
- Astropy Collaboration et al. (2018) Astropy Collaboration et al., 2018, AJ, 156, 123
- Baldry et al. (2004) Baldry I. K., Glazebrook K., Brinkmann J., Ivezić Ž., Lupton R. H., Nichol R. C., Szalay A. S., 2004, ApJ, 600, 681
- Balogh et al. (1999) Balogh M. L., Morris S. L., Yee H. K. C., Carlberg R. G., Ellingson E., 1999, ApJ, 527, 54
- Barone et al. (2018) Barone T. M., et al., 2018, ApJ, 856, 64
- Barone et al. (2021) Barone T. M., et al., 2021, arXiv e-prints, p. arXiv:2107.01054
- Belli et al. (2015) Belli S., Newman A. B., Ellis R. S., 2015, ApJ, 799, 206
- Belli et al. (2019) Belli S., Newman A. B., Ellis R. S., 2019, The Astrophysical Journal, 874, 17
- Beverage et al. (2021) Beverage A. G., Kriek M., Conroy C., Bezanson R., Franx M., van der Wel A., 2021, arXiv e-prints, p. arXiv:2105.12750
- Borghi et al. (2021) Borghi N., Moresco M., Cimatti A., Huchet A., Quai S., Pozzetti L., 2021, arXiv e-prints, p. arXiv:2106.14894
- Brinchmann et al. (2004) Brinchmann J., Charlot S., White S. D. M., Tremonti C., Kauffmann G., Heckman T., Brinkmann J., 2004, MNRAS, 351, 1151
- Bruce et al. (2012) Bruce V. A., et al., 2012, MNRAS, 427, 1666
- Bruzual & Charlot (2003) Bruzual G., Charlot S., 2003, MNRAS, 344, 1000
- Buitrago et al. (2008) Buitrago F., Trujillo I., Conselice C. J., Bouwens R. J., Dickinson M., Yan H., 2008, ApJ, 687, L61
- Buitrago et al. (2017) Buitrago F., Trujillo I., Curtis-Lake E., Montes M., Cooper A. P., Bruce V. A., Pérez-González P. G., Cirasuolo M., 2017, MNRAS, 466, 4888
- Calzetti et al. (2000) Calzetti D., Armus L., Bohlin R. C., Kinney A. L., Koornneef J., Storchi-Bergmann T., 2000, ApJ, 533, 682
- Carnall (2017) Carnall A. C., 2017, arXiv e-prints, p. arXiv:1705.05165
- Carnall et al. (2018) Carnall A. C., McLure R. J., Dunlop J. S., Davé R., 2018, MNRAS, 480, 4379
- Carnall et al. (2019a) Carnall A. C., et al., 2019a, MNRAS, 490, 417
- Carnall et al. (2019b) Carnall A. C., Leja J., Johnson B. D., McLure R. J., Dunlop J. S., Conroy C., 2019b, ApJ, 873, 44
- Carnall et al. (2020) Carnall A. C., et al., 2020, Monthly Notices of the Royal Astronomical Society, 496, 695–707
- Carnall et al. (2021) Carnall A. C., et al., 2021, arXiv e-prints, p. arXiv:2108.13430
- Chevallard & Charlot (2016) Chevallard J., Charlot S., 2016, MNRAS, 462, 1415
- Choi et al. (2014) Choi J., Conroy C., Moustakas J., Graves G. J., Holden B. P., Brodwin M., Brown M. J. I., van Dokkum P. G., 2014, ApJ, 792, 95
- Choi et al. (2018) Choi E., Somerville R. S., Ostriker J. P., Naab T., Hirschmann M., 2018, The Astrophysical Journal, 866, 91
- Cimatti et al. (2002) Cimatti A., et al., 2002, A&A, 381, L68
- Cimatti et al. (2012) Cimatti A., Nipoti C., Cassata P., 2012, MNRAS, 422, L62
- Cirasuolo et al. (2020) Cirasuolo M., et al., 2020, The Messenger, 180, 10
- Cowie et al. (1996) Cowie L. L., Songaila A., Hu E. M., Cohen J. G., 1996, AJ, 112, 839
- Croton et al. (2006) Croton D. J., et al., 2006, MNRAS, 365, 11
- Daddi et al. (2005) Daddi E., et al., 2005, ApJ, 626, 680
- Davidzon et al. (2017) Davidzon I., et al., 2017, A&A, 605, A70
- Dunlop et al. (2021) Dunlop J. S., et al., 2021, PRIMER: Public Release IMaging for Extragalactic Research, JWST Proposal. Cycle 1
- Fontana et al. (2006) Fontana A., et al., 2006, A&A, 459, 745
- Galametz et al. (2013) Galametz A., et al., 2013, ApJS, 206, 10
- Gallazzi et al. (2005) Gallazzi A., Charlot S., Brinchmann J., White S. D. M., Tremonti C. A., 2005, MNRAS, 362, 41
- Gallazzi et al. (2014) Gallazzi A., Bell E. F., Zibetti S., Brinchmann J., Kelson D. D., 2014, ApJ, 788, 72
- Gargiulo et al. (2017) Gargiulo A., et al., 2017, A&A, 606, A113
- Garilli et al. (2021) Garilli B., et al., 2021, A&A, 647, A150
- Grogin et al. (2011) Grogin N. A., et al., 2011, ApJS, 197, 35
- Guo et al. (2013) Guo Y., et al., 2013, ApJS, 207, 24
- Haines et al. (2017) Haines C. P., et al., 2017, A&A, 605, A4
- Halliday et al. (2008) Halliday C., et al., 2008, A&A, 479, 417
- Häussler et al. (2007) Häussler B., et al., 2007, ApJS, 172, 615
- Hodges (1958) Hodges J. L., 1958, Arkiv för Matematik, 3, 469
- Hopkins et al. (2010) Hopkins P. F., et al., 2010, ApJ, 724, 915
- Ilbert et al. (2006) Ilbert O., et al., 2006, A&A, 457, 841
- Johansson et al. (2012) Johansson P. H., Naab T., Ostriker J. P., 2012, ApJ, 754, 115
- Kauffmann et al. (2003) Kauffmann G., et al., 2003, MNRAS, 341, 33
- Kawinwanichakij et al. (2021) Kawinwanichakij L., et al., 2021, arXiv e-prints, p. arXiv:2109.09766
- Kim et al. (2018) Kim K., Malhotra S., Rhoads J. E., Joshi B., Fererras I., Pasquali A., 2018, ApJ, 867, 118
- Koekemoer et al. (2011) Koekemoer A. M., et al., 2011, ApJS, 197, 36
- Kriek et al. (2009) Kriek M., van Dokkum P. G., Labbé I., Franx M., Illingworth G. D., Marchesini D., Quadri R. F., 2009, ApJ, 700, 221
- Kroupa (2001) Kroupa P., 2001, MNRAS, 322, 231
- Laigle et al. (2016) Laigle C., et al., 2016, ApJS, 224, 24
- Lawrence et al. (2007) Lawrence A., et al., 2007, MNRAS, 379, 1599
- Le Fèvre et al. (2004) Le Fèvre O., et al., 2004, A&A, 428, 1043
- Leethochawalit et al. (2018) Leethochawalit N., Kirby E. N., Moran S. M., Ellis R. S., Treu T., 2018, ApJ, 856, 15
- Leja et al. (2019) Leja J., Carnall A. C., Johnson B. D., Conroy C., Speagle J. S., 2019, ApJ, 876, 3
- Lilly et al. (2007) Lilly S. J., et al., 2007, ApJS, 172, 70
- Martin et al. (2007) Martin D. C., et al., 2007, ApJS, 173, 342
- McCracken et al. (2012) McCracken H. J., et al., 2012, A&A, 544, A156
- McLeod et al. (2021) McLeod D. J., McLure R. J., Dunlop J. S., Cullen F., Carnall A. C., Duncan K., 2021, MNRAS, 503, 4413
- McLure et al. (2013) McLure R. J., et al., 2013, MNRAS, 428, 1088
- McLure et al. (2018) McLure R. J., et al., 2018, MNRAS, 479, 25
- Moresco et al. (2010) Moresco M., et al., 2010, A&A, 524, A67
- Moresco et al. (2011) Moresco M., Jimenez R., Cimatti A., Pozzetti L., 2011, J. Cosmology Astropart. Phys., 2011, 045
- Moresco et al. (2016) Moresco M., et al., 2016, J. Cosmology Astropart. Phys., 2016, 014
- Mowla et al. (2019) Mowla L. A., et al., 2019, ApJ, 880, 57
- Muzzin et al. (2013) Muzzin A., et al., 2013, ApJS, 206, 8
- Nedkova et al. (2021) Nedkova K. V., et al., 2021, arXiv e-prints, p. arXiv:2106.07663
- Ownsworth et al. (2014) Ownsworth J. R., Conselice C. J., Mortlock A., Hartley W. G., Almaini O., Duncan K., Mundy C. J., 2014, MNRAS, 445, 2198
- Pacifici et al. (2016) Pacifici C., et al., 2016, ApJ, 832, 79
- Panter et al. (2008) Panter B., Jimenez R., Heavens A. F., Charlot S., 2008, MNRAS, 391, 1117
- Peacock (1983) Peacock J. A., 1983, MNRAS, 202, 615
- Peng et al. (2002) Peng C. Y., Ho L. C., Impey C. D., Rix H.-W., 2002, AJ, 124, 266
- Peng et al. (2010) Peng Y.-j., et al., 2010, ApJ, 721, 193
- Pentericci et al. (2018) Pentericci L., et al., 2018, A&A, 616, A174
- Santini et al. (2021) Santini P., et al., 2021, A&A, 652, A30
- Schreiber et al. (2018) Schreiber C., et al., 2018, A&A, 618, A85
- Scoville et al. (2007) Scoville N., et al., 2007, ApJS, 172, 38
- Shankar et al. (2015) Shankar F., et al., 2015, ApJ, 802, 73
- Shen et al. (2003) Shen S., Mo H. J., White S. D. M., Blanton M. R., Kauffmann G., Voges W., Brinkmann J., Csabai I., 2003, MNRAS, 343, 978
- Silverman et al. (2009) Silverman J. D., et al., 2009, ApJ, 696, 396
- Siudek et al. (2017) Siudek M., et al., 2017, A&A, 597, A107
- Somerville & Davé (2015) Somerville R. S., Davé R., 2015, Annual Review of Astronomy and Astrophysics, 53, 51
- Straatman et al. (2018) Straatman C. M. S., et al., 2018, ApJS, 239, 27
- Strateva et al. (2001) Strateva I., et al., 2001, AJ, 122, 1861
- Suess et al. (2019a) Suess K. A., Kriek M., Price S. H., Barro G., 2019a, ApJ, 877, 103
- Suess et al. (2019b) Suess K. A., Kriek M., Price S. H., Barro G., 2019b, ApJ, 885, L22
- Tacchella et al. (2021) Tacchella S., et al., 2021, arXiv e-prints, p. arXiv:2102.12494
- Thomas et al. (2005) Thomas D., Maraston C., Bender R., Mendes de Oliveira C., 2005, ApJ, 621, 673
- Trujillo et al. (2006) Trujillo I., et al., 2006, ApJ, 650, 18
- Trujillo et al. (2011) Trujillo I., Ferreras I., de La Rosa I. G., 2011, MNRAS, 415, 3903
- Williams et al. (2009) Williams R. J., Quadri R. F., Franx M., van Dokkum P., Labbé I., 2009, ApJ, 691, 1879
- Wu et al. (2018a) Wu P.-F., et al., 2018a, ApJ, 855, 85
- Wu et al. (2018b) Wu P.-F., et al., 2018b, ApJ, 868, 37
- York et al. (2000) York D. G., et al., 2000, The Astronomical Journal, 120, 1579–1587
- Zheng et al. (2007) Zheng X. Z., Bell E. F., Papovich C., Wolf C., Meisenheimer K., Rix H.-W., Rieke G. H., Somerville R., 2007, ApJ, 661, L41
- van Dokkum & Franx (1996) van Dokkum P. G., Franx M., 1996, MNRAS, 281, 985
- van Dokkum et al. (2010) van Dokkum P. G., et al., 2010, ApJ, 709, 1018
- van der Wel et al. (2012) van der Wel A., et al., 2012, ApJS, 203, 24
- van der Wel et al. (2014) van der Wel A., et al., 2014, ApJ, 788, 28
- van der Wel et al. (2016) van der Wel A., et al., 2016, ApJS, 223, 29
- van der Wel et al. (2021) van der Wel A., et al., 2021, arXiv e-prints, p. arXiv:2108.00744